case study: leeds (university of leeds, uk)...case study: leeds (university of leeds, uk) 30/08/2016...
TRANSCRIPT

0
Subgroup: Human Settlement and Infrastructure
Case study: Leeds
(University of Leeds, UK)
30/08/2016

1
Document prepared by:
Olivia Rendon, Jouni Paavola, Dabo Guan, and Xin Li
School of Earth and Environment, University of Leeds
Project:
FP7/ Project BASE [2012-2016]
Date of release (current version):
30/08/2016
Purpose of this document:
"The Case Studies Living Document (CSLD) will be the document that each case study leader will use to
share the information that (i) characterize and give context to its case study, (ii) the goals within BASE,
(iii) the methods used and mainly (iv) a synthesis of the results that that case study is providing to BASE
project. This will allow the CS leader to understand how its own case is going (having a good overview),
but also (v) will allow the sub-group to which the case study belong to know what is happening and
what can be done (mainly on synergies and so on) as well as to (vi) WP4 & 5 coordinators to use that
information to report (including each WP task leaders). These living document will also (vii) allow WP6
& 7 partner to know the information."

2
Index
1. General Case Study Description ................................................................................................................... 4
A. Location ........................................................................................................................................................ 4
B. Case Study Summary.................................................................................................................................... 5
C. Context ......................................................................................................................................................... 5
D. Brief General Information on Climate CHANGE and related issues .......................................................... 6
E. Existing Information on Case Study’s adaptation history .......................................................................... 8
F. Connection with other research projects: .................................................................................................. 9
G. Case ID, Typologies and Dimensions ........................................................................................................... 9
H. Impacts, Sectors and Implementation ...................................................................................................... 10
I. Importance and Relevance of Adaptation ................................................................................................ 11
2. Case study research Methodology ............................................................................................................. 11
a) Research Goals ........................................................................................................................................... 11
b) Stakeholders involved ............................................................................................................................ 12
c) Methodology .............................................................................................................................................. 13
d) Case study Timeline ............................................................................................................................... 14
e) Collaboration with other Partners and Case studies ................................................................................ 15
f) Research Outputs ....................................................................................................................................... 15
3. Participation in Climate Change Adaptation .............................................................................................. 16
a) Process overview ........................................................................................................................................ 16
b) Participation in the Process Phases ....................................................................................................... 16
c) Participation Experience ............................................................................................................................ 16
d) Learning through Participation .............................................................................................................. 16
4. Climate Change Adaptation Measures and Strategies ................................................................................... 17

3
e) a) Adaptation Measures under analysis in your case study ..................................................................... 17
f) .......................................................................................................................................................................... 17
g) b) Adaptation Measures selection and data availability prior to BASE ................................................... 17
h) c) Full description of Adaptation Measures .......................................................................................... 18
5. Impacts, Costs and Benefits of Adaptation measures ................................................................................ 24
i) Step 1 – Preliminary Risk Assessment and identification of adaptation tipping points (max 1500
words) ................................................................................................................................................................. 25
j) Step 2 – Identification of Adaptation Measure and Adaptation Pathways (max 1500 words) ............. 30
l) Step 3 - Evaluation Criteria and Method (max 2000 words) ................................................................... 31
m) Step 3a Selection of evaluation criteria ................................................................................................ 31
n) ......................................................................................................................................................................... 32
o) Step 3b Selection of evaluation method(s) .............................................................................................. 32
p) ......................................................................................................................................................................... 32
q) ......................................................................................................................................................................... 32
r) Step 3c Weighting of evaluation criteria (applicable only to multi-criteria analysis) ............................ 32
s) Step 4 - Data collection (max 2000 words) ............................................................................................... 33
t) Step 5 – Evaluation and Priorization (max 1500 words) .......................................................................... 34
6. Implementation Analysis – Understanding, Leadership and Governance of the implementation of
adaptation measures ........................................................................................................................................ 36
7. Development of new tools for adaptation planning and implementation .................................................. 44
10. References ............................................................................................................................................. 45

4
a) General Case Study Description
Location
The city of Leeds District (Figure 1) is located in the River Aire catchment (Figure 2) in West Yorkshire, England.
Figure 1. Map of the District of Leeds showing all watercourses and zone 3 high probability of flood areas; the red star shows the location of Leeds city centre (Source: LCC 2007).
City of Leeds Coordinates: GPS: N 53° 47′ 59″ / W 1° 32′ 57″ Area: 557.1 km2

5
Figure 2. Map of the Aire catchment showing the main physical features of the area; the location of Leeds is
highlighted in yellow (Source: EA 2010).
Case Study Summary (Max 500 words) The Leeds case study aims to develop and evaluate adaptation strategies for managing urban flood risk in the Leeds
city region and the wider Aire catchment. An introduction of the historical climate trends and a projection of future
climate will be provided for Leeds. Flooding risks, flooding damages and adaptation measures will also be identified.
This case study has two research objectives. First, cost-benefit analysis of three different approaches to adaptation
will be attempted based on existing literature and interviews with key informants. The three approaches are grey
infrastructures and Sustainable Urban Drainage Systems (SuDS) for the city of Leeds and an ecosystem-based
approach for the Aire catchment. Second, a workshop has been carried out with stakeholders, mainly decision-
makers, to discuss the barriers and opportunities to climate change adaptation in Leeds, focusing on flood risk.
Context (Max 500 words) If relevant to the Case Study, please provide any contextual information of the region, history, etc of the case study
The Aire CFMP study-area covers approximately 1,114 km2 and includes 4 sub-catchments; the Upper Aire, Mid Aire,
Lower Aire and the Worth. The River Aire flows for 148 km from its source in the Yorkshire Dales near Malham to its
confluence with the River Ouse near Goole. The Aire catchment is characterized by steep sided narrow valleys in the
upper reaches. The valleys become shallow and wide to the south of Leeds, becoming tidally influenced from the

6
confluence with the Calder. The catchment is home to 1,050,000 people and covers 7 districts. Urban land use
occupies approximately 22% of the catchment. The catchment has a wealth of environmental and historically
recognised sites, including 22 Sites of Special Scientific Interest (SSSIs), 4 Special Areas of Conservation (SACs) and 2
Special Protection Areas (SPAs). There are 219 Scheduled Ancient Monuments, (SAMs), one World Heritage Site at
Saltaire, and 22 Registered Parks and Gardens (EA 2010 ACFMP).
Leeds is a city in the county of West Yorkshire, England. It had a total population of 751,500 living in 320,600
households in 2011, which makes Leeds the second largest local government district by population behind
Birmingham (ONS, 2013). Leeds is one of the largest centres for business, legal and financial services in the United
Kingdom, second only to London. The Leeds Metropolitan District covers 551.67 km2 and includes approximately 360
km2 of countryside designated as Green Belt. The general topography is undulating and varies in level from 10 m to
more than 340m. The District is traversed from the northwest to southeast by the river Aire. The northern boundary
is approximately delineated by the river Wharfe, which flows from west to east. The river Calder forms part of the
southern boundary flowing from the southwest to join the river Aire at Castleford. An area to the east of the district
flows into the river Ouse and a minor area at the northeast that drains towards the river Nidd. The soils are mainly
clay or loam and are relatively impermeable. However, sands and gravels predominate adjacent to the river Aire
(LCC 2011 PAR). The natural drainage of the area is by a series of watercourses, some of which are culverted, running
in steep sided valleys to the main rivers and their associated flood plains (LCC 2011).
Leeds has an oceanic climate, which has a relatively narrow annual temperature range (Table 1). The warmest month
is July with a mean temperature of 16°C, while the coldest month is January with a mean temperature of 3 °C. Leeds
is one of the driest cities in the UK with a mean total rainfall ranging from 63 to 114.3mm.
Table 1. Monthly average temperature and precipitation in Leeds Source: World Meteorological Organization (Available from http://worldweather.wmo.int/010 /c00039.htm)
Month Jan Feb Mar Apr May Jun July Aug Sep Oct Nov Dec
Average High (°C) 5.5 5.6 8.1 10.7 14.3 16.9 19.1 18.7 15.9 12.1 8.3 5.8
Average Low (°C) 0.5 0.3 1.7 3.2 5.9 8.8 11.1 10.9 8.9 6.1 3.2 0.9
Precipitation (mm) 109.8 77.2 81.5 72.9 65.2 77.1 63.0 81.1 77.1 99.8 105.2 114.3
Brief General Information on Climate CHANGE and related issues (Max 2,000 words) Please state which is the European climate zone of the case study and insert any current available information regarding the
case-study, namely expected impacts and scenarios.
Climate change is already beginning to affect Leeds. According to the weather data recorded for the period between
1985 and 2011 in the former Leeds Weather Centre and the Leeds City Council weather station, severe weather
condition such as flooding, gales and wintry conditions are more frequent nowadays than in the past. There have
been significant floods within the Leeds area registered since 1616 at the river Aire, river Wharfe, Wortley beck, river
Calder, Wyke beck, and many other locations across the district (PAR 2013; LCC 2011). The 5 main sources of
flooding in Leeds are: main rivers, ordinary watercourses, surface water, sewers and groundwater (LCC14 FRMS).
This case study focuses on two related problems to be tackled with climate change, surface and fluvial or riverine
flooding.

7
According to the Leeds City Council (2009) and the Yorkshire and Humber Assembly (2009), key climate change
impacts on Leeds will be: average daily temperatures rising; extreme hot temperatures in summer could reach 34 °C,
which exceeds the threshold (29 °C) of declaring a heat wave in Leeds; change of rainfall pattern with wetter winter
and drier summer, which could lead to more frequent river flooding and flash flooding in winter; and increase in the
number of extreme rainfall events in the northern and upland areas (Leeds City Council, 2007).
The UKCP09 Climate Projections are the fifth generation of climate change information for the UK based on a new
methodology designed by the Met Office. The Projections are presented for three different future scenarios
representing high (equivalent to SRES A1FI of the IPCC Special Report on Emissions Scenarios and RCP 8.5 of BASE),
medium (equivalent to SRES A1B) and low (equivalent to SRES B1; RCP 4.5 of BASE) greenhouse gas emissions
(http://ukclimateprojections.metoffice.gov.uk/21678). The figures in table 2 below are the UKCP09 outputs from the
UK Climate Impacts Programme (UKCIP) for the Humber River Basin District. A summary of the current fluvial flood
risk in the Aire catchment is presented in Table 3, and for the Leeds District in Table 4.
Table 2. Precipitation and peak river flow values for climate change projections under three different emissions
scenarios (Source: UKCP09).

8
Table 3. Reduced summary of current fluvial flood risk in the Aire catchment for different flood probabilities (see full
summary in section 5; Source: Aire Plan 2010).
Sector 5% 1.30% 1% 0.50% 0.10%
Catchment Area (km2) 87.6 101.26 106.34 112.71 124.77
Urban area (km2) 15.74 17.33 18.28 18.91 20.37
Grade 1-3b agricultural land (km2) 66.9 76.3 78.6 84 92.88
Population 17929 20923 22379 24019 28090
Properties
Residential 7795 9097 9730 10443 12213
Commercial 3056 3345 3647 3776 4112
Total properties 10851 12442 13377 14219 16325
Table 4. Reduced summary of current fluvial flood risk in the Leeds District (see full summary in section 5; Source: Aire
Plan 2010).
Sector 5% 1.30% 1% 0.50% 0.10%
Population 5465 6014 6330 6962 7590
Properties
Residential 2376 2614 2752 3027 3300
Commercial 1745 1863 1972 2123 2299
Total properties 4121 4477 4724 5150 5599
Existing Information on Case Study’s adaptation history (Max 2000 words) Please insert a Short resume of the Case study existing information related to Climate Change Adaptation (major goals, plans,
measures and timelines already defined or implemented), important Milestones in its “Adaptation Journey” as well as relevant state-of the art regarding the implementation of Adaptation Strategies and Specific Measure
The UK Climate Change Risk Assessment of 2012 (CCRA) provides a detailed analysis of the risks and opportunities
of climate change for the UK (Defra, 2012). To respond to the CCRA, the UK government published the National
Adaptation Programme (NAP) in 2013 within the framework of the Climate Change Act (Defra and Environment
Agency, 2013), which contains a mix of policies and actions to adapt to future weather conditions. The NAP
highlights the responsibility of the government as well as the roles of local authority, industry, community and civil
society in climate adaptation and encourages collaboration. The development of NAP is guided by the vision of ‘A
society which makes timely, far-sighted and well-informed decisions to address the risks and opportunities posed by a
changing climate.’
The first Leeds climate change strategy and action plan was published in 2009 and then revised in 2012 (The Leeds
Initiative, 2012). The strategy sets out plans and priorities for Leeds to tackle the causes and impacts of climate
change. The majority of the strategy focuses on low carbon development in Leeds, including improvement of energy
efficiency, application of renewable energy sources, promotion of sustainable transport. Regarding climate change
adaptation, the strategy identifies several priorities for action, including:
Develop and deliver an appropriate flood risk management scheme to protect Leeds city centre
Regularly appraise emergency response plans to ensure they can cope with extreme weather events
Long-term planning for climate-resilient buildings, infrastructure and enhanced green infrastructure

9
There are several regional groups working on climate change adaptation in the area. For instance, in 2010 the West
Yorkshire Adaptation Action Plan was developed. Also, the Leeds Climate Change Partnership (LCCP) was formed
and consists of a group of local organisations and businesses in Leeds with the objectives of ensuring Leeds reduces
carbon emissions and adapts to potential impacts of climate change. Members of the partnership meet every 3
months and include representatives of Leeds City Council, Environment Agency, Leeds University, ARUP, Metro,
among others (Leeds City Council, 2012). Also, the West Yorkshire Resilience Forum consists of officers from the
emergency services, health agencies, the Environment Agency and local councils responsible for assessing climate
risks, planning for emergencies and keeping the public informed during and after an emergency. The Forum’s
Community Risk Register identifies six key climate risks: major river flooding, urban flash flooding, drought, heat
waves, storms and gales, and low temperatures and heavy snow, all of which, except drought, are rated as high risk.
Flooding is the most important current climate risk.
Leeds City Council and/or the Environment Agency have carried out substantial work on flood risk management,
mainly driven by the 2007 floods in the UK. Flood risk assessments have been carried out to ascertain the history of
flooding, such as the Leeds Local Climate Impacts Profile 2002-2008 (LCLIP), and thus understand the future
potential impacts and to plan alleviation schemes. In 2014 construction of the Flood Alleviation Scheme (FAS; i.e.
grey infrastructure) for Leeds city centre began and other smaller FAS are being developed for specific flood prone
areas of the Leeds District. The current FAS is mainly funded by economic development-oriented grants that consider
adaptation.
Connection with other research projects: (Please list and shortly describe previous or ongoing research projects directly related with the Case Study) Please write
the name and summary of the project, relevant partner institutions, year of beginning and end of project)
The Leeds case study has connections with the Blue-Green City Adaptation Project
(http://www.bluegreencities.ac.uk/bluegreencities/index.aspx). The project aims to develop new strategies for
managing urban flood risk as part of wider, integrated urban planning intended to achieve environmental
enhancement and urban renewal in which multiple benefits of creating blue-green cities are rigorously evaluated
and understood. The research project runs from January 2013 to December 2015 and is funded by the Engineering
and Physical Sciences Research Council (EPSRC).
Case ID, Typologies and Dimensions Having in mind the following BASE Objectives; Categories of Case Studies, please fill in the following table.
BASE OBJECTIVES 1. Compile and analyze data and information on adaptation measures, their effectiveness. (…) 2. Improve current, develop new and integrate methods and tools to assess climate impacts, vulnerability, risks and adaptation policies (…).
3. Identify conflicts and synergies of adaptation policies at different levels of policy making with other policies (including climate mitigation) within and between sectors. (…)
4. Assess the effectiveness and full costs and benefits of adaptation strategies to be undertaken at local, regional, and national scales using innovative approaches (mainly by integrating bottom-up knowledge/assessment and top-down dynamics/processes) with particular attention on sectors of high social and economic importance.

10
5. Bridge the gap between specific assessments of adaptation measures and top-down implementation of comprehensive and integrated strategies.
6. Use and develop novel participatory and deliberative tools to enhance the effective use of local contextualized knowledge in adaptation strategies to assess perceptions of adaptation pathways and their co-design by citizens and stakeholders.
7. Disseminate findings by sharing the results of the project with policy-makers, practitioners and other stakeholders. (…)
CASE STUDIES CATEGORIES A. Public administration (municipality, regional, national, european)
B. Research and education Centres (universities, research centres, projects and groups, schools)
C. Public companies
D. Companies (farms, SMEs, big businesses)
E. Social enterprises (cooperatives, non profit companies, woofing farms, etc)
F. Consortiums (partnerships, campaigns),
G. NGOs (environmental NGO, local development NGO, charities, etc)
H. Transition Initiative
I. Ecovillage
J. Informal groups, Movements
Notes: 1 the main focus of the case study is urban, focusing on the Leeds district, but it will also look at the whole of
the Aire catchment which is a river catchment and includes rural areas.
1 Please insert year of start and year of end of case study.
Case ID Typologies and characterization Country
& Name of
CS
BASE Objectives to be answered
by the CS
Category of case study
Territorial zones
Scale Process
Direction Temporal Definition
Timescale1
UK; Leeds case
study
Objective 1
Objective 2
Objective 3
Objective 4
Objective 5
Objective 6
Objective 7
University
Rural
Urban
Coastal
River Basin
Local
Regional
National
Transnational
European /Global
Bottom-Up
Top-Down
Retrospective
Prospective 2012 - 2015
X
X
X
X
X1
B
X
X
X

11
Impacts, Sectors and Implementation Please tick the relevant boxes for impacts and implementation and insert the number 1 for primary sector and the
number 2 for secondary sector.
Importance and Relevance of Adaptation
Please tick the relevant box for the case study.
Case developed and implemented as a climate change adaptation measure
Case developed and implemented and partially funded as a climate change adaptation measure
Case mainly developed and implemented because of other policy objectives, but with significant consideration
on climate change adaptation aspects
b) Case study research Methodology
a) Research Goals (Max 500 words) Insert the General Goals for the case study and how will it contribute to BASE projects and BASE key research questions.
2 When the case study consists of a public administration with a top down approach, implementation can be an approved
legislation or regulation. When the case study is about practical adaptation measures like a sand dune, for example, implementation should be considered finished when the dune is built in situ.
Impacts Sectors Implementation Primary CC
Impacts (Climate-Adapt)
Primary CC Impacts (BASE)
Primary and Secondary Sector (Climate Adapt)
Primary and secondary Sector (BASE)
Implemented2
Phase of Implementation
2
Extreme Temperatures
Water Scarcity
Flooding
Sea level Rise
Droughts
Storms
Ice and Snow
Extreme temperatures
Water scarcity
Flooding
Coastal Erosion
Droughts
Soil Erosion
Vector Borne Diseases
Damages from extreme weather related events (storms, ice and snow)
Agriculture and forest
Biodiversity
Coastal Areas
Disaster risk reduction
Financial
Health
Infrastructure
Marine and Fisheries
Water Management
Urban
Agriculture
Biodiversity & Ecosystems
Coastal and Marine systems
Energy
Health and Social Policies
Transport
Production Systems and Physical Infrastructures
Water resources
Tourism
Yes
Ongoing
No
Assessment
Planning
Implementation
Monitoring
Evaluation
X
X
X
1
1
2
X
X
12
The case study aims to develop and evaluate three adaptation strategies for managing urban flood risk in the Leeds
city region and Aire catchment. As a baseline, the existing adaptive measures in urban flood management and the
potential future impacts of flooding in Leeds and the Aire catchment will be determined. The case study also aims to
assess the barriers and opportunities to adaptation. The main research goals are:
a) Compile and revise existing data on the flood risk and potential impacts of flooding in Leeds;
b) Analyse the costs and benefits of different adaptation measures for flood risk management, particularly the
potential of using grey infrastructure and Sustainable Urban Drainage Systems (SuDS) in the Leeds district
and an ecosystem-based approach for the Aire catchment; and
c) Assess the main drivers and barriers of climate change adaptation policy and implementation in Leeds.
The case study will contribute directly to BASE project objectives 1, 3 and 7. Objective 1 will be met by compiling and
analysing data on adaptation measures for Leeds and the Aire catchment, including analysis economic benefits, an
effort to include social and environmental benefits, and sectorial adaptation costs. Objective 3 will be met by XXX
iidentifying the barriers and opportunities to adaptation in Leeds with an emphasis on policy. Objective 7 will be met
by disseminating project results to policy makers, practitioners and other stakeholders through a workshop to
increase awareness of the impacts, costs and benefits of climate adaptation (as well as through wider BASE
dissemination activities and scientific publications).
b) Stakeholders involved (Max 2000 words) Please insert any information about the stakeholders involved in the adaptation process with which you will relate to, namely their
nature, involvement in the process, etc. If possible highlight the decision-making process as well as the leadership process for Climate Adaptation Strategies. Do
mention if there exists any kind of public engagement and participation within the Adaptation process.
Regarding adaptation, the most important group is the West Yorkshire Resilience Forum, which is responsible for
assessing the risks faced by the community, planning for emergencies and keeping the public informed during and
after an emergency. It is made up of executive officers from organisations responsible for protecting the public in
emergency situations - including the emergency services, health agencies, the Environment Agency and local
councils (for the case study this forum won’t be approached directly, but the individual members relevant for Leeds
will be involved, see below).
Leeds City Council is the Lead Local Flood Authority and thus has many responsibilities. The Council’s Flood Risk
Management Group has already taken action to reduce flooding and to help households in particularly vulnerable
places to cope.
Environment Agency is an executive, non-departmental public body responsible to the Secretary of State for
Environment, food and rural affairs (Defra). Its principal aims are to protect and improve the environment, and to
promote sustainable development. The EA take lead responsibility for risk-based management of flooding from main
rivers and the sea and regulation of the safety of reservoirs with a storage capacity greater than 25,000m3 (expected
to be reduced to 10,000m3). City partners are now implementing with the Environment Agency a city centre flood
risk management scheme.
Yorkshire Water Services are the sole water company operating in the Leeds district. As a provider of water
infrastructure services YWS have existing responsibilities in relation to flood management in the Leeds district.

13
Other stakeholders include Natural England, Arup and other consultancy firms, Canal and River Trust, community
flood groups, among others.
Note: Participation within the adaptation process in Leeds mainly consists of consultations carried by LCC and EA, as
is done for any other policy or activity. It is not possible to enter into more detail into the decision-making and the
leadership processes as these were not part of the case study aims.
c) Methodology (Max 2000 words) Please insert what will be your research approach regarding this case study, how did you define it (did it include participatory sessions
or not) and how you will implement it during the BASE Project period.
No participatory sessions were carried out to design the research approach.
To determine the current floos risk of Leeds and its potential impacts:
Unstructured interviews with key stakeholders and literature review
To analyse the costs and benefits of three potential adaptation measures for flood risk management:
Three cost-benefit analysis using secondary data, preferably from Leeds if available, and sensitivity analysis using
discount rates of 1%, 3.5% (decreasing) and 6%.
To assess the main drivers and barriers of climate change adaptation:
A local stakeholder workshop including group discussions with structured questions and a prioritisation
- Note: Partners/Case Studies using PRIMATE tool will be using CBA (to prioritize) and/or MCA (with stochastic
PROMETHE II) and the Monte Carlo Uncertainty Analysis, so please check these boxes.
METHODS to be used in Case Studies3 YES // NO
A) Methods for prioritizing adaptation options
Cost-Benefit Analysis (CBA) YES
Cost-Effectiveness Analysis (CEA)
Multi-criteria Analysis (MCA)
Analytic Hierarchy Process (AHP)
B) Quantification of impacts and relationships between factors affecting adaptation
Causal Diagrams
Influence Diagrams
Process-based Modelling
3 For descriptions and references of the Methods please refer to Milestone 8. For data requests from specific Work Packages
please refer to Deliverable 4.1
September 2014

14
Welfare variation analysis under restrictions
C) Uncertainty and sensitivity analysis
Probabilistic multi model Ensemble
Monte Carlo simulations ( PRIMATE uses this method)
Real option analysis
Climate risk management process
D) Participatory Methods
Scenario Workshop
Participatory Cost Benefit Analysis (PCBA)
Participatory add-ons to CBA
Participatory add-ons to Multi Criteria Decision Analysis
Participatory add-ons to Adaptation Pathways
Other (add extra lines if necessary):
d) Case study Timeline (Please insert an image of the Timeline of your Research Approach, highlighting important milestones and deliverables)
Activity 2014 2015
09 10 11 12 01 02 03 04 05 06 07 08 09 Etc.
Case study design X X
Literature review/ data collection X X X X X X X X X X X
Meetings with key stakeholders X X X X X X X X X
Flood risks and impacts X X X
Interviews on participation X X X
Preliminary T5.2 reporting X
T5.3 reporting X
CBA grey infrastructure X X
CBA SuDS X X X X
CBA ecosystem-based approach X X X
ECCA conference presentation X
Leeds drivers and barriers workshop X
Final T5.2 reporting X
T5.4 reporting X
Deliverable 5.4 work X X X
T5.5 reporting X
(Max 500 words) Please highlight if you have any special need or focus regarding any of these methods and their use on your case study.
None

15
e) Collaboration with other Partners and Case studies
Collaboration with BASE case studies (see list in EMDESK):
Potential collaborations to be explored with: Prague, Copenhagen and Rotterdam as case studies looking at urban
flooding; UK case studies (4) on the National Adaptation Strategy; and all case studies looking at barriers and
opportunities to adaptation.
Collaboration within BASE partners/researchers (EX: for a specific competence):
Name: _Volker Meyer__; Partner: _UFZ_; Purpose: Flood risk CBA approach
f) Research Outputs
a. Scientific Publications
1. Provisional Title: Implementation of climate change adaptation in BASE case studies - Lessons learnt;
Date: 09/15 (jointly with UFZ and other partners)
2. Provisional Title: Traditional flood risk management or SuDS for the city of Leeds, UK; Date: 12/15
3. Provisional Title: Greening the Aire catchment: ecosystem-based adaptation to flood risk; Date: 02/16
4. Provisional Title: Reflections upon the influence of the UK national adaption policy on local case studies;
Date: 04/16
b. Other Publications
- Books/Books Chapters: # 1
Provisional Title: _______________________________________________; Month/Year: ___/____
c. Other
- Scientific conferences:
1. Provisional Title: _How best to adapt to climate change? The case of flooding in Leeds, UK; Conference:
_ECCA_; 05/2015
2. Provisional Title: Ecosystem-based adaptation to climate change: barriers and opportunities in the Aire
catchment, UK; Conference: 8th Annual International Ecosystem Services Partnership (ESP) Conference ;
11/2015
3. Provisional Title: Implementation of climate change adaptation in BASE case studies - Lessons learnt;
Conference: ___?__; 03/2016

16
- Invited seminars, presentations at local events, etc.:
Barriers and Opportunities for Adaptation Workshop with local stakeholders in Leeds (08/06/15)
3. Participation in Climate Change Adaptation
Process overview (Please describe the use of Participatory Methodologies within your case study, namely its integration in the overall Research
Methodology explained earlier in the CSLD, the rationale behind it and key expected outcomes – Max 1000 words)
N/A
Participation in the Process Phases (Please uncover the role of all participants in the process of implementing adaptation measures. The adaptation implementation
has been divided into four phases for purposes of ease: 1) Initiative/decision to act, 2) Development of potential adaptation
options, 3) Decision-making, and 4) Implementation. The process phases are to be filled out with information corresponding to
each participant. I.e. if experts were not consulted in the ‘decision-making’ phase, then describe why they were not included. It
is also important that a wide array of participants is described, including those that were excluded from parts of the process. )
Make a bullet point for each of the five participant categories below (and distinguish between for example different stakeholder
or expert groups) and be as descriptive as possible how, why/why not were they involved.
Process phases:
1. Initiative/decision to act
2. Development of potential adaptation options 3. Decision-making 4. Implementation
Participation Experience (Please report with regards to your case study and the implementation of Participatory Methodologies using a traditional SWOT
analysis – Strengths; Weaknesses; Opportunities and Threats)
Strenghts Weaknesses
Opportunities Threats
Learning through Participation In order to capture how participation could improve the climate change adaptation process, please report
with regards to your case study:
a) Your view whether and how participation influenced the strategies and measures decided in your case? b) How you think the participatory process in your case could be/have been improved? c) Any novel (use of) participatory methods observed in the case studies

17
4. Climate Change Adaptation Measures and Strategies
a) Adaptation Measures under analysis in your case study (Please identify your Adaptation Measures considered in this case-study and provide a short description of each)
Adaptation Measure(s):
1) _Grey infrastructure
2) _Sustainable Urban Drainage Systems (SuDS)
3) _Ecosystem-based approach (EBA)
Short description for each Adaptation Measure (Max 50 words):
1) Grey infrastructure is a traditional approach to flood risk management which involves constructed assets,
mainly weirs and wall defenses.
2) SuDS are blue and green infrastructure that can slow water down, store water, allow water to infiltrate into
the ground or evaporate and transpire from vegetation (e.g. green roofs, swales, retention ponds).
3) The ecosystem-based approach refers to catchment level woodland creation aimed at reducing flood risk
and with multiple benefits.
b) Adaptation Measures selection and data availability prior to BASE (Please describe how and why where these specific measures selected for further research and analysis under BASE and what is
the baseline data already available for each specific adaptation measure. Max 500 words)
1) Grey infrastructure was selected as it is currently being implemented by the Leeds City Council and the
Environment Agency to reduce fluvial flooding from the Aire River (through walls, weirs and infrastructure
alterations). Specific flood alleviation schemes are also being developed for beck areas in the Leeds district,
which are all based on grey infrastructure. The Leeds case study will attempt to cost the implementation of
this measure across the entire district with existing data for the city centre and the rest of the District.
2) SuDS is an innovative approach to urban flood risk management being promoted by international and
national policies (e.g. green roofs, permeable paving, rainwater harvesting). Leeds provides guidance on SuDS
for new developments but no official policy exists. This approach will be explored for surface flood reduction
mainly caused by small becks and poor sewerage systems. Data on SuDS for Leeds is inexistent so analysis will
be based on literature available for the UK and beyond, as well as local data (e.g. water butt prices offered by
Yorkshire Water Services).
3) There has been recent research suggesting that rural land use management can significantly reduce peak
flood volumes and times to flood peak in the UK and beyond. These management measures can include
woodland planting, vegetative strips, natural dams, among others. This ecosystem-based approach has not
been explored comprehensively for the Aire catchment despite some small initiatives mainly in protected and
rural areas upstream. An ecosystem-based approach also offers a wide array of multiple benefits that are in
line with many other policy objectives (e.g. water quality, increased biodiversity).

18
Grey infrastructure – currently being implemented in Leeds city centre only by the Environment Agency and Leeds City Council. There are plans to implement flood alleviation schemes in other parts of the metropolitan area. This measure has only been hindered in the past by insufficient financial resources. SuDS – this measure is being implemented in new, individual developments under the guidance of Leeds City Council, although their quality and effectiveness varies. The researcher believes the implementation of SuDS will increase as its importance is emphasised in many policies. However, much uncertainty still surrounds these measures, particularly their costs and effectiveness, and further research is needed. Ecosystem-based – this measure is believed to be the most “complex” to implement due to the number of actors involved and the land use changes needed to reduce flood risk. There are currently efforts in the Aire catchment (promoted by, e.g., the Woodland Trust, The Yorkshire Farming and Wildlife Partnership) to create woodlands under the Countryside Stewardship schemes offered by the government, as well as other farmland and countryside measures that may direct or indirectly reduce flood risk. However, the payments offered by the schemes dont cover farmers’ opportunity costs or the costs of changing land use, so lots of work with upstream landowners is required.
c) Full description of Adaptation Measures (Please provide a full description on each of the Adaptation Measures regarding these 19 leading questions below. If more
than one Adaptation Measure please copy paste the structure provided.)
Process
I. Would, or at which part would, institutions and private stakeholders implement the measure
autonomously to adapt to climate change (adaptive capacity)?
II. Does the measure initiate further activities for adaptation to climate change?
Grey infrastructure will not further activities for adaptation; SuDS will further activities for adaptation, e.g.
improving urban microclimates by reducing heat stress; and the ecosystem-based approach will further
activities for adaptation the most, e.g. increasing adaptive capacity through the simultaneous protection of
other ecosystem services, strengthening human capital and reducing society’s vulnerability to climate change.
III. Does adaptation aim for flexibility and reflexivity (i.e. the ability to change as CC and other factors
develop)?
Grey infrastructure: current plans by local authorities contemplate a phase 2 that increases the area were
flood risk is reduced and phase 3 were the standard of protection is increase up to 1 in 200 years. However,
these measures (except for the two new adjustable weirs) are not flexible or reflexive.
SuDS and the ecosystem-based approach are naturally flexible and can be designed to be quite flexible, e.g.
staggering measures to work simultaneously or successively. It is believed that the ecosystem-based approach
have the greatest potential for reflexivity as it consists on generating and maintaining ecosystem services and
can be designed to replicate natural environments or to maximise flood risk reduction.
IV. Is the measure effective under different climate scenarios and different socio-economic scenarios?
The UKCP09 central estimate of climate change for the Leeds area is used for the case study. This data source
was selected as the CMCC data was not in a format or scale that could be used by the researchers. The UKCP09

19
estimates include the most comprehensive climate projections ever produced and are the leading source of
climate data for the UK. The central estimate (also known as SRES A1B4) is the Defra recommended scenario
which is utilised by local authorities. This estimate represents a value approximately midway between RCP4.5
and RCP8.5. The UKCP09 central estimate gives projections of peak river flow increase of up to 10% by 2025,
15% from 2025 - 2055 and 20% beyond 2055 (assuming rural and urban land use change will be effectively
managed at a local scale to ensure no significant increase in flood risk). However, further work is required at a
local level to understand the consequences of flooding from other sources of flooding as well as the
implications of climate change. The risk of fluvial flooding in Leeds is expected to increase the greatest during a
5% AEP flood (Environment Agency 2010). These figures suggest that a current day 1 in 200 year event (0.5%
AEP) will become a 1 in 75 year event (1.3% AEP) in 100 years’ time (PAR 2013).
The socioeconomic scenarios used for the Leeds case study are those of the SSP2 and SSP5 storylines. The
Western Europe SSP2 (“middle of the road with active mitigation”) presents population increases for the UK of
15% by 2035, 25% by 2055 and 30% by 2100 (of which 20% is urban for the latter). UK GDP increases by 400%
by 2100 and migration to urban areas continues from rural areas and from other countries, leading to the
expansion of cities and the creation of suburbs. The inequality between rich and poor increases and limited
government investment goes to greening cities. There is more heat stress and local governments take specific
actions, health systems are slowly privatised, and tropical diseases appear occasionally. This scenario is most in
line with local authority projections for Leeds of a 3% increase in urban area by 2026 reaching a 39% increase
by 2100 (Environment Agency 2010).
The SSP5 (“market driven development”) presents population increases for the UK of 25% by 2035, 45% by
2055 and 100% by 2100. UK GDP increases even more than the SSP2 at a rate of 5% per year reaching over an
800% increase by 2100. Cities grow and expand significantly due to immigration and from rural areas. There
are some ad hoc green city actions, but the government is not supporting this with policy. Energy consumption
of fossil fuels increases as people search for their comfort and financial stability. There is an increase in heat
wave deaths, of obesity and associated diseases, the increase in agro-chemical use increases health problems,
health systems are privatised. Thus, keeping the population healthy is a challenge. There is a loss of habitats
and species due to the overexploitation of ecosystem services.
The City of Leeds is the third largest city in the United Kingdom, with a total population of 750,000, behind
only London and Birmingham. The Leeds City Region (LCR) has a £52bn economy that constitutes 5% of the
total UK economy. Leeds is a vital regional transport hub (Leeds City Council 2013). Furthermore, most areas
earmarked for future residential and commercial development are located in the Aire valley (floodplain area at
risk), such as Holbeck, the commercial centre, the South Bank, the Aire Valley Enterprise zone and the Aire
Valley Action Zone (Leeds City Council 2007, 2013). For instance, the Leeds Planning Policy Statement 3:
Housing (PPS3) has an annual target for 60% of new housing to be provided on previously developed land and
by converting existing buildings which will place pressure on drainage systems (Environment Agency 2010).
Thus, Leeds seems to be representative of the figures presented by the SSP2 and SSP5 for the UK.
4 Derived from the A1 'storyline' developed by the IPCC Special Report on Emissions Scenarios

20
The three adaptation measures considered are not fully effective under the UKCP09 climate scenario
and the different socioeconomic scenarios.
Grey infrastructure - the current scheme being implemented in Leeds city centre is designed for up to 1 in 75
years event (phase 1) and will reach 1 in 200 years when phase 3 is completed. Flood alleviation schemes
planned for other areas of the metropolitan district aim to achieve varied standards of protection up to a 1 in
200 years. Climate change figures project that by the year 2055 the standard of protection achieved by the
grey infrastructure will drop from 1 in 200 to 1 in 75 years.
SuDS- As hydrological modelling of SuDS was not carried out, the effectiveness of these measures in Leeds is
based on literature only and is considered preliminary. Studies carried out in areas close to Leeds and in the UK
(e.g. Ellis and Viavattene 20145; Stovins 20126) show that SuDS are unlikely to be substantially effective for
events greater than 1 in 30 year event. With climate change the limited effectiveness of SuDS reduces even
more unless SuDS are implemented in an unfeasibly large area of the city.
Ecosystem-based approach- As hydrological modelling of woodlands for flood risk reduction was not carried
out, the effectiveness of this measure is based on literature only (although much more data is available for the
costs and benefits of woodlands than for SuDS, as well as less uncertain). The literature on the effectiveness of
woodlands at reducing flood risk in the UK is varied and context specific, ranging from 25% of rainfall
intercepted by broadleaf forests to only 1% or less. The Forestry Commission estimated and mapped the area
within the Aire catchment that is suitable for woodland planting aimed at flood risk reduction (only 4%;
Appendix 1). Considering that the most adequate land for flood risk reduction is planted it is assumed that at
least an equal level of protection as SuDS could be achieved (i.e. not more than 1 in 30 year event) and this will
likely apply to upper Aire regions (less so to the city of Leeds) such as Gargrave, Skipton, Keighley and Bingley.
Due to data availability this measure only considers woodland creation but if a wider array of measures were
included (e.g. sustainable farm management, debris dams, bunds, and ponds) the level of flood protection
would increase significantly for certain localities within the catchment.
V. Is the adaptation measure iterative?
All three CBAs for the adaptation measures considered can be replicated.
VI. Does the measure contribute to overall sustainable development, alleviate already existing problems
and bring benefits for other social, environmental or economic objectives than adaptation (no regret
measures)?
a. Please describe briefly how
5 Ellis and Viavattene (2014) found for a 1 in 30 year event a 57% reduction and for a 1 in 200 year event a 30% reduction in
Birmingham industrial area; and 95% and 55% respectively for a Coventry residential area (with a simulation replicating a real storm sequence). 6 Stovins (2012) found that green roofs in Sheffield, when dry, are capable of retaining 91% of a 10 year return period 1 hr
duration rainfall event, or 45% of a 100 year 1 hr event. This means that for a 48 hr event the retention values should be revised downwards to just 27% and 13% respectively.

21
Grey infrastructure only has two direct co-benefits besides flood reduction, extending fish mobility in the River Aire due to the new weirs to be built and some greening along the banks of the river where walls are being raised. SuDS does contribute to overall sustainable development and generates cobenefits in the urban environment, these include aesthetic value to attract residents and businesses, reduce heat stress, improve biodiversity, improve water and air quality (contributing to meeting the Water Framework Directive), health and wellbeing benefits and reducing pressure on sewer systems. The Ecosystem-based approach contributes to sustainable development and generates multiple cobenefits for the Aire catchment and beyond, these include the protection and maintenance of multiple ecosystem services, e.g. water quality (meeting Water Framework Directives), reduced erosion, several supporting services, carbon sequestration (i.e. climate change mitigation), biodiversity, air quality (reducing illness and deaths and increasing quality of life), aesthetics and recreation. If the woodlands created are aimed at being productive then it would contribute also to economic growth and provision of timber which is mainly imported by the UK.
VII. Can adjustments be made later if conditions change again or if changes are different from those
expected today?
The grey infrastructure being implemented already in Leeds city centre is designed to be adjusted at a
later stage, but solely to increase the height of river bank walls to increase flood protection.
SuDS are green measures so they allow for latter alterations although costs and space issues will be
crucial depending on the measure.
The ecosystem-based approach is a green measure that allows for alteration, although a large
number of stakeholders are involved and the policies behind the woodland schemes (that could fund
this measure) might take time to be altered and are highly influenced by EU policy.
Outcome
Relevance and effectiveness of adaptation measures VIII. How important is the climate change threat addressed by the measure? What economic values,
ecosystem functions and socio-cultural values are at stake, and to what extent are they affected by
climate change impacts? Is there an indication of overriding public interest, e.g. critical
infrastructures, public health?

22
IX. What portion of the targeted potential damages can be avoided by implementing the measure? (0-
100%)
Governmental models consider up to 1 in 1,000 year flood events but realistically 1 in 200 years is aimed for.
Grey infrastructure planned for a 1 in 200 year event can provide 100% protection at the current status, but
with climate change it only protects from a 1 in 75 year event by 2050 (87%, obtained by dividing the latter
damages into the former damages).
SuDS and EBA are estimated to provide a protection of up to 1 in 30 year event (81%). It is important to
highlight that although these two approaches to adaptation are unlikely to protect above a 1 in 30 year event,
the damages in Leeds are substantial already at a 1 in 20 year event, increasing slightly as probability
decreases.
Efficiency X. How high are the benefits of the measure relative to the costs? Are the costs justified by the benefits
(Please refer to results of economic evaluation in chapter 5)
XI. What are the costs of the administrative implementation of the measure? Are there potential funding
under the umbrella of other European policies (eg. CAP/Cohesion policy)?
XII. Does the measure give an incentive for innovation to different actors (e.g. SMEs) / can it deliver a
competitive advantage for the local economy?
Grey infrastructure probably doesn’t give an incentive for innovation, but its goal is to ensure that the main
infrastructures and businesses in Leeds city centre are protected. It also aims at encouraging further
investments in areas that are in flood risk areas.
The grey infrastructure approach and the EBA are efficient with positive benefit cost ratios, between
19.36 and 159.63 for the former (depending on discount rate), and between 28.66 and 35.98 for the
latter. Benefits are substantially lower for the SuDS approach giving BCR between 0.09 and 0.07.
The grey infrastructure approach is currently being built with funding from different sources, including
local council and central government. For the SuDS approach there is no identified funder as of yet. The
EBA is envisioned to be funded under the 2015 Woodland Capital Grants and would require extra input
form landowners.
The increase of flood risk has been identified as the main threat of climate change for the city of Leeds. The main economic assets at risk currently and in the future are people and infrastructure, including commercial and residential properties, roads and railways, hospitals, surgeries and health centres, and gas and electricity assets. The authorities place their main focus on the potential effects on current business areas and planned developments, as Leeds is set to become “the best city in the UK”. Thus, the grey infrastructure being implemented is designed to provide short-term visible benefits. On the other hand, thepeople in neighbourhoods affected by flooding are concerned about their own property and safety, as well as suffering from stress during flood events.

23
SuDS does provide an incentive for innovation and offer competitive advantage to city stakeholders, but it will
greatly depend on how quickly the technological know-how becomes widespread, if managed at a small scale
(context specific and as the costs for these measures decrease (currently not cost-effective at a large scale).
SuDS could be furthered if other stakeholders in Leeds engage with this measure beyond the local authorities.
EBA is a green measure that can provide an incentive for innovation to different stakeholders mainly in rural
areas, such as farmers, entrepreneurs and landholders, e.g. organic farming, sustainable forestry, eco-tourism,
rewilding, etc.
XIII. Does the measure have effects on employment?
Grey infrastructure will create most jobs during construction and few during operation and maintenance.
SuDS will also create many jobs during construction and for operation and maintenance. If a full array of SuDS
is implemented then this measure would be expected to generate a substantial number of jobs.
EBA will create jobs during woodland planting and the first years of tree growth only if managed
unproductively (as proposed in this case study). This measure has a high job creation potential if managed as
productive woodlands.
XIV. How long is the time-lag between implementation of the adaptation measure and the effect of the
measure?
Grey infrastructure will provide instant protection once built. However, the phase 1 currently being
built provides a protection of 1 in 75 years and the 2nd phase will provide a 1 in 200 year protection
(although there is no specific funding or date for the implementation of phase 2).
SuDS will provide instant protection once built, although this measure requires (strict) periodic
maintenance to ensure performance.
EBA will have a long time-lag considering tree growth time and planting sequence (this case study
proposes 50 ha planted each year until the maximum of 4,400 ha has been reached). It is expected
that the effect on flood risk reduction would be cumulative and start to be evident once trees reach
10 to 15 years of age.
XV. What is the timeframe during which the measure will have an effect?
All three measures will be designed for a 100 year life time, following the current flood alleviation
scheme for Leeds.
XVI. Does the measure create synergies with mitigation (i.e. reduce GHG emissions or enhance GHG
sequestration)?
Grey infrastructure will not create synergies with mitigation, except for some negligible green areas
that are planned for aesthetic purposes along the river banks.
SuDS will contribute to mitigation to some extent, as most of the measures involve vegetation, e.g.
green roofs, urban trees.

24
EBA is the measure that most contributes to mitigation as it involves woodland creation, with
sequestration varying depending on management decisions.
XVII. Does the measure alleviate or exacerbate other environmental pressures? (Explain briefly)
Equity XVIII. What are the impacts on different social or economic groups? are there expected impacts on
particularly vulnerable groups? (distributional impact)
XIX. Does the measure enhance well-being and quality of life (e.g. in the urban environment)?
Grey infrastructure enhances quality of life by reducing flood risk and to a negligible extent by
creating green areas near the River Aire banks.
SuDS is expected to increase wellbeing and increase quality of life by creating a substantial amount of
green spaces in the urban environment which will impact on health and enjoyment.
EBA enhances quality of life and wellbeing by reducing flood risk and also other co-benefits, such as
improving landscape aesthetics, recreation, biodiversity, and air quality.
5. Impacts, Costs and Benefits of Adaptation measures This section of the CSLD follows the Economic Assessment Steps put forward by UFZ thoroughly described in D4.1 of chapter 4.
Please check D4.1 for any doubts or questions. In case of duplication of information with previous sections of the CSLD feel free
to copy paste. For more detailed guidance (incl. two examples) please see the above mentioned chapter 4 of D4.1. Please do not
hesitate to contact [email protected], [email protected] or Filipe Alves if you have questions about how to fill out this
section.
Grey infrastructure will contribute to reducing flood risk to the main commercial area in the city centre of Leeds and some of the vulnerable residential areas close to the city centre and the river Aire. SuDS is proposed to complement the grey infrastructure by covering the rest of the Leeds District and protecting the remaining vulnerable residential areas with high flood risk (although flood alleviation schemes are being designed for these areas, funding hasnt been secured). EBA will protect residential and commercial areas in the towns of Gargrave, Skipton, Keighley and Bingley in the upper Aire catchment, it is unlikely to benefit the city of Leeds.
Grey infrastructure has been designed to have no negative effects, such that improvements have already been carried out downstream of Leeds city centre where increased flood risk was expected. However, it doesnt contribute to alleviating any other environmental problem besides improving fish mobility. SuDS and EBA if appropriately designed and maintained should not exacerbate any environmental pressures. On the other hand, they both contribute to the alleviation of other environmental problems, such as air pollution, water pollution, reduced biodiversity and biological corridors, and soil erosion.

25
Step 1 – Preliminary Risk Assessment and identification of adaptation tipping
points (max 1500 words) (some of these questions might be already answered in section 1 – if so, just copy paste)
What is the climate change related problem/risk you would like to reduce by adaptation?
Which problems already exist, what is/are the current risk/s?
The history of flooding for the Aire Catchment and the Leeds area dates all the way back to 1616, and the most recent flood peaks occurred in autumn 2000, June 2007 and January 2008. Flooding has been found to be the main threat of climate change for Leeds and the River Aire catchment in the future. There are two related problems to be tackled with climate change, surface and fluvial or riverine flooding. Analysis of the National Flood and Coastal Defence Database (NFCDD) in 2010 showed that the standard of protection within the Aire catchment, including Leeds, varies considerably, but the majority of it has very low protection (Figure 3; Aire Plan).
Figure 3. Standard of protection within the Aire catchment (Source: Aire Plan).
Table 5. Climate change projected for the Humber and Yorkshire region (Source: UKCP09).

26
Which assets and sectors are at risk under current climate variability?
Table 6 and 7 present a summary of the assets and sectors currently at risk of flooding in the Aire catchment and Leeds district, respectively, as reported in 2010. Table 6. Summary of all assets and sectors at current fluvial flood risk in the Aire catchment: SAC = Special area of Conservation; SPA = Special Protection Area; SSSI = Sites of Special Scientific Interest; and WHS = World Heritage Site (Source: Aire Plan 2010).
Sector /Asset Flood Risk
Physical 5% 1.30% 1% 0.50% 0.10%
Catchment Area (km2) 87.6 101.26 106.34 112.71 124.77
Urban area (km2) based on ALC 15.74 17.33 18.28 18.91 20.37
Grade 1-3b agricultural land (km2) 66.9 76.3 78.6 84 92.88
Social
Population 17929 20923 22379 24019 28090
Infrastructure
Residential properties 7795 9097 9730 10443 12213
Commercial properties 3056 3345 3647 3776 4112
Total properties 10851 12442 13377 14219 16325
Transport
Main roads (km) 37.7 41.79 44.2 47.63 54.1
Railway (km) 34.58 40.05 42.15 46.51 51.8
Community
Hospitals, surgeries and health centres 9 10 11 13 15
Fire, ambulance and police stations 2 3 3 4 4
nurseries, schools, colleges and universities 9 10 10 10 14
Tourism
camping and caravan sites 2 2 2 2 2

27
Energy
gas and electricity assets 140 161 172 183 201
Waste Sites
landfill sites 1 1 1 1 1
CoMAH sites 1 1 1 1 1
sewage treatment works 3 4 4 4 6
Environmental
SAC km2 0.77 0.81 0.83 0.84 0.87
SPA km2 0.01 0.01 0.01 0.01 1
Ramsar sites 0.53 0.56 0.57 0.57 0.57
SSSI km2 2.46 2.57 2.6 2.63 2.72
Historical
WHS 1 1 1 1 1
schedules ancient monument 1 3 3 3 3
registered parks and gardens 0 0 0 0 0
registered battlefields 0 0 0 0 0
listed buildings 347 355 404 410 455
Table 7. Summary of all assets and sectors at current fluvial flood risk in the Leeds District: SAC = Special area of Conservation; SPA = Special Protection Area; SSSI = Sites of Special Scientific Interest; and WHS = World Heritage Site (Source: Aire Plan 2010).
Sector/Asset 5% 1.30% 1% 0.50% 0.10%
Social
Population 5465 6014 6330 6962 7590
Properties
Residential 2376 2614 2752 3027 3300
Commercial 1745 1863 1972 2123 2299
Total properties 4121 4477 4724 5150 5599
Transport
Main roads (km) 14.29 15.66 16.21 18.12 19.27
Railway (km) 6.07 6.66 7.06 7.53 8.39
Community
Fire, ambulance and police stations 1 2 2 2 2
nurseries, schools, colleges and universities 1 1 1 1 1
Energy
gas and electricity assets 83 92 98 110 118
Waste Sites
CoMAH sites (top tier) 1 1 1 1 1
Environmental
SSSI km2 0.01 0.02 0.02 0.03 0.03
Historical
listed buildings 153 165 178 182 190
Which adaptation or protection measures are already in place? (refer to typology of measures in D6.1, table 2)

28
Non-structural: awareness raising, disaster response management, monitoring and management, and land use planning (i.e. risk zoning). These measures, particularly disaster response by emergency services are deemed to be quite good. Note: before the currently implementing Flood Alleviation Scheme of grey infrastructure (started 2014), few isolated structural measures were in place. Structural: improving flood defences (engineering; i.e. current implementation of grey infrastructure), improving flood defences (building with nature; some wetlands and flood plains exist but effectiveness is low or inexistent), giving space to rivers (the current grey infrastructure scheme which will remove the “Knostrop cut” island), improving drainage (Yorkshire Water is likely to regularly perform some drainage improvements but no official information is available), improving water retention (peak flows; see “building with nature” above), and flood resilient infrastructure (currently implementing weirs, walls and raised banks for the grey infrastructure scheme).
How do these risks presumably change due to climate and socio-economic change?
The following Table 8 and 9 shows a summary of the assets and sectors at future flood risk in the Aire catchment and the Leeds district, respectively, as reported in 2010. The main assets affected by future flood risk are properties, transport and community assets. Table 8. Summary of % increase of all assets and sectors at future risk of fluvial flood in the Aire catchment; CoMAH= Control of Major Accident Hazards, SAC = Special area of Conservation, SPA = Special Protection Area, SSSI = Sites of Special Scientific Interest, and WHS = World Heritage Site (Source: Aire Plan 2010).
Sector /Asset % increase of flood risk/ AEP
Physical 5% 1.30% 1% 0.50%
Catchment Area (km2) 18.3 12.6 6.7 8.1
Urban area (km2) based on ALC 11.8 6.4 1.4 5.9
Grade 1-3b agricultural land (km2) 15.1 12.0 9.0 8.3
Social
Population 13.5 8.4 6.7 4.9
Infrastructure
Residential properties 13.5 8.4 6.7 4.9
Commercial properties 7.9 7.3 0.2 2.3
Total properties 21.4 15.7 6.9 7.2
Transport
Main roads (km) 12.5 9.5 6.3 9.0
Railway (km) 19.1 12.7 9.5 7.4
Community
Hospitals, surgeries and health centres 11.1 10.0 0.0 7.7
Fire, ambulance and police stations 50.0 33.3 33.3 0.0
nurseries, schools, colleges and universities 0.0 10.0 10.0 10.0
Tourism
camping and caravan sites 0 0 0 0
Energy
gas and electricity assets 12.9 5.6 4.7 9.3
Waste Sites
landfill sites 0.0 0.0 0.0 0.0
CoMAH sites 0.0 0.0 0.0 0.0
sewage treatment works 33.3 25.0 25.0 25.0

29
Environmental
SAC km2 2.6 0.0 0.0 2.4
SPA km2 0.0 0.0 0.0 0.0
Ramsar sites 1.9 0.0 0.0 0.0
SSSI km2 4.1 0.4 0.0 3.4
Historical
WHS 0 0 0 0
schedules ancient monument 200 0 0 0
listed buildings 11.2 14.9 3.0 8.3
Table 9. Summary of % increase of all assets and sectors at future risk of fluvial flood in the Leeds District; CoMAH= Control of Major Accident Hazards, SAC = Special area of Conservation, SPA = Special Protection Area, SSSI = Sites of Special Scientific Interest, and WHS = World Heritage Site (Source: Aire Plan 2010).
Sector/ Asset % increase of flood risk/ AEP
5% 1.30% 1% 0.50%
Social
Population 6 6 9 -1
Properties
Residential 6 6 9 -1
Commercial 5 6 7 -1
Total properties 6 6 8 -1
Transport
Main roads (km) 20 3 5 4
Railway (km) 9 5 2 9
Community
Fire, ambulance and police stations 100 0 0 0
nurseries, schools, colleges and universities 0 0 0 0
Energy
gas and electricity assets 8 7 5 6
Waste Sites
CoMAH sites (top tier) 0 0 0 0
Environmental
SSSI km2 100 0 0 0
Historical
listed buildings 10 6 2 2
What are the main drivers, impacts and affected sectors (refer to BASE impact and sector categories, see also Table 1 of D6.1)
The sectors are “flood risk management”, with the impact of flooding from increase in river flows, and “urban human settlements and infrastructure” (or production systems and physical infrastructures), with the impact of peak rainfall events. [I am not sure I understand what drivers the question refers to, but the drivers for increased flood risk are climate change, urbanisation, and population and economic growth.]
Which climate and socio-economic scenarios are used?

30
The UK Climate Projections (UKCP09) provide present three different future scenarios representing High
(SRES A1FI), Medium (SRES A1B) and Low (SRES B1) greenhouse gas emissions. The UKCP09 central estimate
of climate change for the Leeds area is used for the case study. The UKCP09 central estimate gives
projections of peak river flow increase of up to 10% by 2025, 15% from 2025 - 2055 and 20% beyond 2055
(assuming rural and urban land use change will be effectively managed at a local scale to ensure no
significant increase in flood risk). The socioeconomic scenarios used for the Leeds case study are those of the
SSP2 and SSP5 storylines.
Which adaptation tipping points can be identified?
Give appropriate period (2015-2030, 2030-2050, after 2050) for each considered combination of climate and socio-economic scenario.
The adaptation pathways methodology was not applied in the Leeds case study, so the following statements are based on the adaptation measures’ lifetime, effectiveness and projected climate change. A key tipping point for Leeds will be around the year 2050 under both scenarios when climate change increases flood risk in most areas, e.g. 1 in 200 years becomes 1 in 75 years event. Another key tipping point is by 2100 due to population growth/urbanisation, particularly for SSP5.
Step 2 – Identification of Adaptation Measure and Adaptation Pathways (max
1500 words) (some of these questions might be already answered in section 4 – if so, just copy paste)
What are the alternative adaptation measures?
What are the primary and secondary objectives of adaptation?
The case study aims to develop and evaluate three adaptation strategies for managing urban flood risk in the Leeds city region and Aire catchment. The primary aim of the adaptation measures is to reduce flood risk, and the secondary aim is to provide co-benefits.
What are potential measures to meet these objectives? (refer to typology of measures in D6.1, table 2)
The potential measures for flood risk management include non-structural and structural. The non-structural measures that already exist are awareness raising, disaster response management, monitoring and management, and land use planning (i.e. risk zoning). These existing measures, particularly disaster response by emergency services, are deemed to be working well. Economic incentives and risk transfer tools are two other non-structural measures that currently don’t exist in Leeds and so far are not planned. The structural measures for flood risk management that exist or have recently commenced (2014) in Leeds are improving flood defences (engineering) or flood resilient infrastructure, giving space to rivers (some in current grey infrastructure scheme), and improving drainage (by Yorkshire Water). However, giving space to rivers, improving water retention, and improving drainage, are measures that have limited or non-existent application.
What is your baseline option (the “business-as-usual”-option)?
The baseline option refers to current flood risk with existing non-structural adaptation measures without the
grey infrastructure that is currently being implemented. Thus, impacts of current flood risk are being

31
compiled and estimated for the Aire catchment and the Leeds district at an Annual Exceedance Probability
(AEP) of 5%, 1.3%, 1%, and 0.5% (and in some instance at 0.1%).
• What is the ambition level of this baseline strategy?: Maintaining current risk levels or current protection levels (implying with CC risks may increase)?
The ambition level is to maintain current risk levels but assuming that with climate change this risk
will rise.
• Is current backlog of investments for adaptation measures included or excluded?
The current secured investment of almost £50 million for the grey infrastructure in Leeds city centre
is excluded from the baseline but included in the CBA of grey infrastructure for the whole of the
Leeds District.
• Does it include only planned adaptation or also autonomous, non-planned adaptation?
The baseline only includes planned adaptation.
Are there complementary measures? Is it appropriate to bundle these measures?
The non-structural measures are necessary alongside a combination of structural measures. The three
adaptation measures explored in the Leeds case study need to be bundled for maximum flood risk reduction.
What are alternative adaptation pathways?
What is the “sell-by”-date of the measures or bundles of measures? I.e. when will they – under conditions of climate
change – not any longer be able to meet the defined objectives?
Grey infrastructure schemes for the Leeds district aim to achieve a 1 in 200 year protection but by 2050 this
protection will decrease to 1 in 75 years due to climate change. SuDS and EBA will also decrease to an
undefined level of protection.
What would be alternative measures or bundles of measures at these “tipping points”?
At the grey infrastructure “tipping point” in year 2050 is when the green measures of SuDS and EBA are
alternatives to increase and enhance flood protection.
Step 3 - Evaluation Criteria and Method (max 2000 words)
Step 3a Selection of evaluation criteria Which evaluation criteria should be used?
What are the relevant positive and negative properties of the measures (costs and benefits) to be considered in the evaluation process (economic, ecological and social effects)? (see D4.1, chapter 4 for examples)
Criteria Grey infrastructure SuDS EBA
Costs
Appraisal, design,
construction, risk,
compensation,
maintenance,
Capital and maintenance (low,
medium, high)
Planting, tree shelters, gates,
fencing, weeding, maintenance,
woodland plan, scrub clearing,
Rhododendron control, re-

32
estates, disruptions
to rail and traffic
stocking health issue, thinning,
labour, respacing
Excluded
Costs None Design, risk Design, risk
Benefits
Avoided damages
to properties and
vehicles, avoided
Water quality improvement, air
quality improvement, energy savings,
water savings, consumptive and non-
consumptive recreation,
ecology/biodiversity, aesthetics,
surface and groundwater supply,
carbon sequestration, climate cooling
(health), avoided damages
Erosion reduction, runoff
reduction, air quality
improvement, recreation,
aesthetics, carbon
sequestration, biodiversity,
timber, avoided damages,
increased land value
Excluded
Benefits
Job creation,
economic
development
Reduced sound transfer, reduced heat
island effect, job creation, economic
development, health related (exercise
opportunity, stress relief) and the
above benefits were not available for
all SuDS measures included
Improved water quality, job
creation, economic
development, health-related
(exercise opportunity, stress
relief)
What is the appropriate unit to measure each of these criteria? Is the performance of the adaptation options measured in qualitative, monetary or other quantitative terms?
All included costs and benefits were monetised and those excluded were due to lack of data or inability to
monetise.
Step 3b Selection of evaluation method(s) What is the appropriate evaluation method?
The MCA or PCBA methods might have been used to include criteria not easily expressed in monetary terms, however due to time and resource constraints a cost-benefit analysis (CBA) approach was used.
Step 3c Weighting of evaluation criteria
(applicable only to multi-criteria analysis) What are the preferences of stakeholders regarding the different evaluation criteria?
The evaluation criteria are based solely on secondary data availability in documents such as those generated by local authorities, national authorities, scientists and practitioners. Stakeholders were not included in the criteria selection for the three CBAs, but there is evidence that they were included in the design of the grey infrastructure scheme being implemented; this scheme only considers traditional costs and benefits, excluding social and environmental costs and benefits.

33
Step 4 - Data collection (max 2000 words) What are the costs and what are the benefits of the alternative adaptation options?
What potential data sources are available, including damage & impact assessment methods or existing CBA studies on adaptation measures?
Grey infrastructure cost and benefit data came from the Aire Catchment Flood Management Plan (2010),
flood risk assessments for Leeds (2008, 2011), Local Climate Impacts Profile for Leeds (2009), Leeds city
centre Flood Alleviation Scheme Project Appraisal Reports (2010, 2013), West Garforth Integrated Urban
Drainage (2008), documents towards the development of the Wyke Beck flood alleviation scheme (2008 -
2010), among others.
SuDS cost data came from consultancy and NGO documents on SuDS costs and benefits (CIRIA 2013; Eftec
2010; HR Wallingford 2004; UKWIR Ltd. 2005), government documents (e.g. Environment Agency 2007),
local data (e.g. Yorkshire Water 2014), among others. Benefits data is based directly or indirectly on the
following documents: Environment Agency (2007), Roebuck et al. (2011), Royal Haskonings (2012), Sustrans
(2010) and Woodland Trust (2011).
EBA cost data is based on the recent Woodland Capital Grants 2015 of the UK government and Forestry
Commission documents. Benefit data is based mainly, directly or indirectly, on the following documents: CJC
Consulting (2014), Defra (2011), Eftec (2010), Smith et al. (2012), Valatin and Starling (2010), and Woodland
Trust (2015).
If no relevant data sources are available and modelling cannot be undertaken: Which experts can estimate proxies for
assessing the performance of measures regarding the respective criterion?
Some benefits for the SuDS and the EBA approaches are not available and could be estimated via proxies by
SuDS engineer experts, public health professionals and environmental economists.
How do the adaptation options perform with regard to each of the cost and benefit criteria selected in step 3a?
The following table shows that only the grey infrastructure and the EBA adaptation options are cost-effective. The
SuDS technology (based on UK figures) seems to be prohibitively expensive at a large scale.
Criteria/ Discount
rate
Grey Infrastructure SuDS (20% coverage &
high benefits)
EBA
PV Costs
1%
3.5%
5%
271,863,504
337,647,984
525,892,385
639,653,880,883
2,013,861,981,797
12,932,971,606,314
715,074,908
2,328,564,777
13,730,165,938
PV Benefits
1%
3.5%
5%
5,262,645,065
13,555,471,871
83,950,062,874
60,025,693,027
177,211,459,014
955,372,732,478
20,493,116,283
72,209,214,640
494,072,859,908
NPV
1%
3.5%
5%
4,990,781,561
13,217,823,887
83,424,170,489
- 579,628,187,856
- 1,836,650,522,783
- 11,977,598,873,836
19,778,041,375
69,880,649,863
480,342,693,970

34
BCR
1%
3.5%
5%
19.36
40.15
159.63
0.09
0.09
0.07
28.66
31.01
35.98
What is the evaluation time frame?
What is the lifespan of the measure with the longest lifetime?
The timescale is 100 years from the end of 2014 to 2114 following the lifetime of the current grey
infrastructure scheme.
Which discount rate should be applied?
Which discount rate is recommended by national guidelines for climate change adaptation measures (or public
investments)? Is it a linear discount rate or any other type (i.e. declining, hyperbolic, etc.)
The following declining discount rate is recommended by the UK government (HM Treasury 2011):
Period of Years 0 - 30 31 - 75 76 - 125
Discount Rate 3.5% 3% 2.5%
And a low (1%) and high (5%) discount rates were applied for testing the sensitivity of results.
How to deal with data uncertainty?
Can uncertainties related to the performance of the measures regarding certain evaluation criteria be described by a
range (min-max), a triangular distribution (min, most likely, max) or any other kind of probability distribution?
The grey infrastructure measure is based on hydrological modelling (considering other alternatives also) and
estimations by consultancies with expertise in the area. The measure itself is also quite straightforward and
it takes account for risk in its estimates, thus it is considered to have low uncertainty.
The SuDS measure estimates’ consider 1%, 5% and 20% coverage in the Leeds district as well as low and high
benefit values which provide some insight into uncertainty.
The EBA measure, besides discount rate, does not include any range of criteria. However, the SuDS and EBA
measures are based on conservative estimates to avoid overestimations.
Step 5 – Evaluation and Priorization (max 1500 words)
What is the ranking order of alternative adaptation options (measures, bundles of measures or pathways)?
For cost-benefit analysis: What is the net-present value of the alternative options?
Criteria/ Discount
rate
Grey Infrastructure SuDS (20% coverage &
high benefits)
EBA
NPV
1%
3.5%
4,990,781,561
13,217,823,887
- 579,628,187,856
- 1,836,650,522,783
19,778,041,375
69,880,649,863

35
5% 83,424,170,489 - 11,977,598,873,836 480,342,693,970
What is the benefit-cost ratio?
Criteria/ Discount
rate
Grey Infrastructure SuDS (20% coverage &
high benefits)
EBA
BCR
1%
3.5%
5%
19.36
40.15
159.63
0.09
0.09
0.07
28.66
31.01
35.98
What are the uncertainties associated with the performance of the different options?
There is little uncertainty in the performance of the grey infrastructure. There is large uncertainty in the performance of the SuDS and EBA approaches as they are based on green measures, the literature offers wide ranging performance values and are context specific. Hydrological modelling could help reduce uncertainty in the latter two approaches although not completely.
Is there and, if so, to what extent uncertainty in the ranking of options?
There is uncertainty in the cost-effective ranking of the options, mainly due to the inability to monetise several benefits of the SuDS approach and some of the EBA approach.
Is it possible to determine which option most likely performs best or is it necessary to gather further information to reduce uncertainty (go back to step 4)?
As designed, the best performing alternative is the grey infrastructure with a protection up to 1 in 200 years.
What are the main lessons learnt from your case study?
There is a substantial amount of cost and benefit data available in government and consultancy work for the UK
(grey literature; main source of data) which is quite disperse and at times hard to access (e.g. Defra and
Environment Agency documents).
The early involvement of key stakeholders in the economic evaluation process would have likely facilitated access
to data.
It is still not possible to capture all the direct and indirect benefits of the “green” adaptation measures, which
probably has a strong influence on the cost-effectiveness of measures (i.e. SuDS).
The application of cost-benefit analysis to three different adaptation measures for Leeds and the Aire catchment
provides important insights into areas that need further attention and research (e.g. quantification of benefits
derived from SuDS), and the general feasibility of the measures.
The exploration of different socioeconomic scenarios and the impacts of climate change highlight periods in time
when tipping points might occur and how different adaptation measures might be combined and/ or staggered to
distribute costs in time and provide the necessary standard of protection.
The findings support the need to consider a bundle of adaptation measures beyond traditional approaches, and a
wider catchment focus, in order to achieve a high standard of protection as well as multiple benefits.
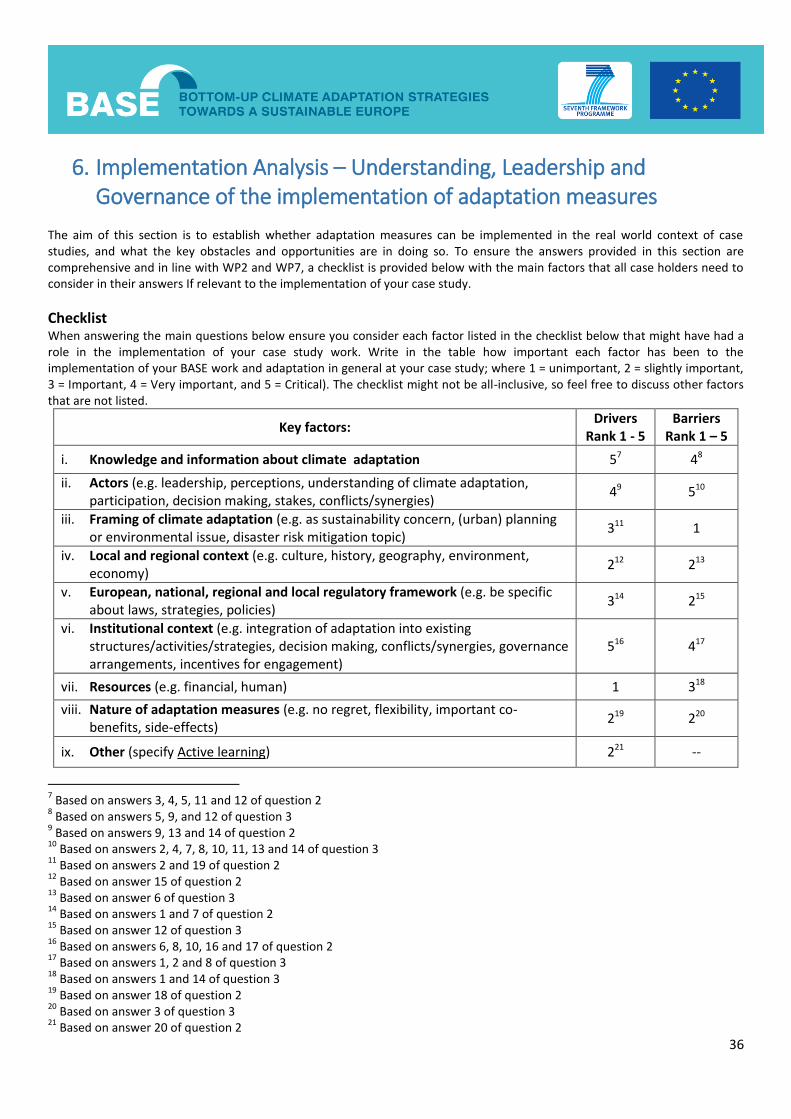
36
6. Implementation Analysis – Understanding, Leadership and Governance of the implementation of adaptation measures
The aim of this section is to establish whether adaptation measures can be implemented in the real world context of case studies, and what the key obstacles and opportunities are in doing so. To ensure the answers provided in this section are comprehensive and in line with WP2 and WP7, a checklist is provided below with the main factors that all case holders need to consider in their answers If relevant to the implementation of your case study.
Checklist When answering the main questions below ensure you consider each factor listed in the checklist below that might have had a role in the implementation of your case study work. Write in the table how important each factor has been to the implementation of your BASE work and adaptation in general at your case study; where 1 = unimportant, 2 = slightly important, 3 = Important, 4 = Very important, and 5 = Critical). The checklist might not be all-inclusive, so feel free to discuss other factors that are not listed.
Key factors: Drivers
Rank 1 - 5 Barriers
Rank 1 – 5
i. Knowledge and information about climate adaptation 57 48
ii. Actors (e.g. leadership, perceptions, understanding of climate adaptation, participation, decision making, stakes, conflicts/synergies)
49 510
iii. Framing of climate adaptation (e.g. as sustainability concern, (urban) planning or environmental issue, disaster risk mitigation topic)
311 1
iv. Local and regional context (e.g. culture, history, geography, environment, economy)
212 213
v. European, national, regional and local regulatory framework (e.g. be specific about laws, strategies, policies)
314 215
vi. Institutional context (e.g. integration of adaptation into existing structures/activities/strategies, decision making, conflicts/synergies, governance arrangements, incentives for engagement)
516 417
vii. Resources (e.g. financial, human) 1 318
viii. Nature of adaptation measures (e.g. no regret, flexibility, important co-benefits, side-effects)
219 220
ix. Other (specify Active learning) 221 --
7 Based on answers 3, 4, 5, 11 and 12 of question 2
8 Based on answers 5, 9, and 12 of question 3
9 Based on answers 9, 13 and 14 of question 2
10 Based on answers 2, 4, 7, 8, 10, 11, 13 and 14 of question 3
11 Based on answers 2 and 19 of question 2
12 Based on answer 15 of question 2
13 Based on answer 6 of question 3
14 Based on answers 1 and 7 of question 2
15 Based on answer 12 of question 3
16 Based on answers 6, 8, 10, 16 and 17 of question 2
17 Based on answers 1, 2 and 8 of question 3
18 Based on answers 1 and 14 of question 3
19 Based on answer 18 of question 2
20 Based on answer 3 of question 3
21 Based on answer 20 of question 2

37
Note: The ranking in the table above is based on a subjective assessment of stakeholders’ ranking of the main barriers and opportunities to adaptation in Leeds. All answers are based on a Leeds Stakeholder Workshop carried out in June 2015, except for anything marked as OR which is the researcher’s opinion.
Summary Information (based on your answers to the questions below)
a) Specify sectors covered (e.g. coast, city, agriculture):
City
b) Specify adaptation measures covered (e.g. altering cultivation practices, building defences; explain
why they were chosen):
Three adaptation measures are considered: grey infrastructure (currently under construction), SuDS
(strongly promoted in the UK by different sectors) and ecosystem-based approach (green measure
not explored). Information for this section was obtained during a one-day workshop of Leeds
stakeholders.
c) Specify climate change impacts covered (e.g. flooding, heat stress, sea level rise):
Flooding
d) Specify main results of activities (e.g. changes, outputs):
The case study is prospective and it includes the Flood Alleviation Scheme (grey infrastructure)
currently under construction for the city centre of Leeds.
Questions Answer these six questions giving specific evidence and examples where possible. In principle all implementation activities should be included, i.e. adaptation activities supported by BASE partners as well as those by other actors. If it is possible to inform about the implementation of those adaptation measures assessed for task 5.2, it is very important to do so in order to comply with the DoW. The measures covered can be extensive and/or particular to a case study. They can include for example, the development of plans and strategies, vulnerability/risk assessments, economic assessments such as CBA, MCA, the development of participatory processes/public dialogue, through to the implementation of actual measures including physical measures such as engineering developments and land use change, incentives/subsidies for behavioural change, etc. This list is not all-inclusive and is merely a guide. Your own case study may have very different measures. However, you must be clear what measures you are refereeing to when answering these questions.
1. How have climate change adaptation measures and strategies been advanced in the case study?
Describe the process! Note: Retrospective case studies will not answer this question, but have to update their answer to question 1E of this document on the history of adaptation at their case study. (Approximately 500 words) There is no adaptation strategy for Leeds, only a National Adaptation Strategy, and currently a Flood Alleviation Scheme (including two movable weirs, cutting out an island and wall defenses) is being constructed in the city centre. Thus, there is no coordinated or planned process for adaptation and specific (often isolated) activities are mentioned here. The following are activities and initiatives that have advanced adaptation, either directly or indirectly, in Leeds: Partnerships are working to access alternative funding streams for flood risk management, e.g.
Yorkshire Water with the Lead Local Flood Authority (LLFA) and communities. The Aire Action Leeds network was a good example which advanced specific flood adaptation actions and communication between many stakeholders.

38
Defra funding, either directly or through other organisations like the Forestry Commission, provides incentives to upland landowners who implement sustainable practices. Although the only way to get things to happen is direct involvement, i.e. have someone who goes and sees landowners and gets them to engage; there must be close interaction and personal engagement to get buy-in, including persons of the community that are trusted.
Community education and consultation has worked in some areas. Especially, education on flood risk is given at schools but it is only happening in a sparse and uncoordinated nature. Some schools have partnerships and links with local organisations to discuss these issues.
The Environment Agency (EA) has tended to be risk averse with trying new things, there are criteria to get funding, and you have to be so certain. I do think we are getting slightly less risk averse - attitudes have changed, not as focused on the traditional focus – but until funding criteria changes we are quite narrow in what’s required.
There are some good examples of adaptation measures that have been implemented in and around Leeds in recent years. For example, the innovative approach at St Aidans which was a big open cast coal mine restored as a wetland. It was designed to work as flood storage and as a nature reserve. UK Coal restored it and paid money into an endowment fund. It has a good management model where the community group influenced the design (with concerns about flood risk, car parking and others), the Council owns it, the Royal Society for the Protection Birds (RSPB) manages it, and the EA manages the flood risk aspects. Another example is the Old Moor in Dern Valley, a coal storage area and colliery, which was restored as a nature reserve and provides washlands from the River Dern with the EA involved in management. There was a push by the city council to restore the legacy of coal mining for local people, the land was cheap and communities were involved due to environmental degradation. Another example is the grey infrastructure efforts of Leeds City Council in Garforth (and other areas of Leeds), and now some areas do not flood as much as in 2007 (but because flood risk wasn’t reduced everywhere people discarded the adaptation measures as ‘not working’, even though they are). The DEFRA pilot project in Garforth was fantastic for advancing the understanding on issues such as flows, culverts, etc. The Garforth flood group has also been a conduit for engaging public bodies. Further afield, the small scale, multi-stakeholder “Slowing the Flow Pickering project” scale project is led by the Forestry Commission and funded by DEFRA. This project provides ideas and evidence-based research that is transferable to other areas.
The Leeds City Council (LCC) has a good flood alert system in place. A lot of people have solar panels in Leeds often because they can get some cost savings from it
(although not always because it is the right thing to do). C & RY recommend the implementation of certain conditions in new developments (it isn’t
statutory) and there is some implementation being done (e.g. SuDS, bat boxes). Leeds is adopting SuDS measures for multi-property serving assets. We’ve been looking at new schemes on slowing the flow, the use of SUDs type measures. There’s a campaign to put SUDs into new developments, over the last 15 years, but it hasn’t been entirely successful, such as in other places like Germany. SUDs were included in the LCC core strategy in 2014. C+RY also take on volunteers and these could look at flood risk management.
Dissemination of knowledge from high level people in a wide array of organisations shows willingness to pursue this issue.
The third sector in Leeds is a good source of knowledge on adaptation and related issues, e.g Sustrans, living streets, Leeds cycle campaign

39
2. What and who drives (or enables) the adoption and implementation of adaptation measures and strategies/policies? Please explicitly refer to the factors mentioned in the checklist, highlighting the factor in bold, and be specific about any relevant policies! (Approximately 500 – 1000 words) It is generally agreed that the main driver of flood risk adaptation in Leeds is flooding events and their associated damages. However, stakeholders ranked, the more ‘positive’ drivers by importance, as follows (note that some are potential drivers): 1. A policy approach that matches flood risk spending with the potential economic damage, i.e.
cost-benefit analysis approach. 2. A shift towards integrated and holistic thinking to better understand that flood risk is part of a
wider system (e.g. natural capital and ecosystem management). 3. Evidence based research, predominantly funded by DEFRA as case studies focusing on natural
measures to reduce flood risk, e.g. the Pickering project set up 4 years ago. 4. More spatial studies carried out on flooding to have policy that connects the catchment with
the site of the problem. 5. Potential efforts to quantify the benefits to businesses in order to encourage engagement
with and investment in flood risk management. 6. There are opportunities to make tangible, powerful arguments of the economic case for policy,
investors, developers, and private actors. 7. Stronger and more cohesive EU and national regulation to get flood risk built in to the higher
levels (at the local level a key driver in the water industry have been penalties for internal flooding, this means costs to the water companies and thus has encouraged long-term business plans. The OFWAT also has its own financial requirements and DEFRA requires LCC to report on adaptation practices every 4 - 5 years). Leadership is also important, if there is a good ‘champion’, actions are achieved. For instance, DEFRAs adaptation people did give a high profile to adaptation but it has since lowered in their agenda.
8. To create a long-term body that is independent from government, but high level, to enable a lasting view that is specifically focused on flood risk.
9. Get Universities involved to ensure better evidence-based research, businesses also. 10. Creating standards and accreditations for flood risk adaptation actions. 11. Knowledge sharing across sectors including the authorities, the third sector, e.g. work that
the consultancy firm ARUP is doing in Leeds. 12. A large scale review at the national level of what actually constitutes ‘flood risk’ so that it is
an accepted and understood concept for a shared vision and a universal understanding. This can lead to baselines and targets.
13. To get schools to teach more about flood risk and its local impacts. 14. DEFRA (and its affiliated bodies) could enhance their capacity to make personalised
engagement with specific catchment stakeholders. 15. Place-based approaches with local perspectives are drivers, e.g. localised green
infrastructure measures. Some community flood groups are active in tackling the issue, e.g. Meanwood, Garforth; but once the current issue is solved continuity is lacking.
16. To create incentives for the private industry to invest in flood management as part of a positive ‘Northern Powerhouse’ vision. Adaptation specialists, such as Jon Clubb (YourClimate), have been forced to think more strategically and business-like to make adaptation appealing.

40
17. Through Corporate Social Responsibility (e.g. Dow Jones Green Index) companies can increase their flood risk adaptation, but it might only work for larger companies.
18. Co-benefits (e.g. aesthetics, recreation, ecosystems, and health) can help to get more support and bottom-up inclusion, backed up by top-down endorsement and funding.
19. Easy, clear message on climate change adaptation for multiple actors to access and utilise. 20. To look at and emulate pioneering projects, such as St Aidans and Pickering, which used
innovative ways of implementing flood management. 3. What obstacles were encountered during the adoption or implementation of adaptation measures
and strategies/policies? Please explicitly refer to the factors mentioned in the checklist, highlighting the factor in bold, and be specific about any relevant policies! (Approximately 500 – 1000 words) Stakeholders ranked the main barriers to adaptation, by importance, as follows:
1. There are several barriers regarding funding, e.g. its availability, access and attitudes. 1a. Evidence and specific justification is needed to obtain funding for projects, i.e. high Cost Benefit Ratio; Funding from DEFRA is based on being able to move a property from one risk band to other. The lack of interdisciplinary communication to correctly justify projects negatively affects the chances of obtaining funds. This can be due to a legacy effect of wanting to show a difference, e.g. Heritage Lottery Fund (HLF).
1b. Priority is given to other issues over adaptation at the policy level, e.g. economic recovery or growth, key infrastructure, health & wellbeing. 1c. Government funding for floods is reactive, action is only taken upon a flood occurring and then funding is cut during non-flood times. 1d. Difficult to access post-flood funding for big cities (i.e. The Bellwin Scheme), and limited to the immediate aftermath only. Thus, it is a prescriptive funding landscape. 1e. Lack of funding to protect new developments. 1f. Funding is focused on highly populated areas, not on low density areas, i.e. farmers (e.g. Grant in aid fund, Environment Agency and Yorkshire Water funding) 1g. No financial rewards for SuDS schemes or other adaptation measures (as there is for solar panels).
2. Project governance is lacking. 2a. Different disciplines and agencies operate in isolation. Internally and externally there is lack of communication (and information sharing) between departments and agencies, and between low-ranking and high-ranking politicians who are the actual decision makers; e.g. the Environmental Agency, Leeds City Council (between departments, such as financial risk management, planning and economic region), and between Risk Management Authorities (RMAs). 2b. Lack of leadership (i.e. responsibility and coordination) and buy-in into interdisciplinary projects. 2c. Lack of a clear long-term vision, i.e. public and political profile of flooding decreases after there is a short period without disasters. 2d. Differing priorities of stakeholders. 2e. Legislative power is lacking in cases where landowners refuse to cooperate.
3. It is challenging to demonstrate the success or benefits of an adaptation measure. Residents

41
often do not perceive benefits or improvements from measures. Although evidence-based research to date has been useful, it is often not transferable.
4. Stakeholder engagement is low beyond the public sector. 4a. Businesses are not engaged in adaptation measures even if they are to benefit from it. Companies often only do the minimum required by law. 4b. There is a lack of landowner engagement and cooperation, particularly upstream, due to a lack of incentives and as consequences are felt elsewhere, i.e. downstream. 4c. The EA has a bad history of leading but not listening to what people and communities say.
5. There is a general unawareness and lack of knowledge regarding green measures, such as SuDS. 5a. A lack of technical guidelines and know-how for green solutions. 5b. An unawareness of the range of options available and where to access this information.
6. Localism reduces the possibility of a strategic approach for wider (catchment) scale projects. Currently there is little evidence showing the benefits of adaptation in Leeds, modelling is needed at catchment level.
7. The adoption and ownership of SuDS is unclear. 7a. There are infrastructural problems, e.g. roof strength. 7b. There is pressure on reducing the costs of development, as well as red tape lobbying on SuDS (i.e. against SuDS regulation). Thus enforcement by local authorities in new developments is reduced. 7c. There are certain health and safety issues with standing water measures (e.g. swales, balancing ponds), such as child safety, mosquitoes, and health impacts. 7d. There is uncertainty of responsibilities. Who is going to pay for installing and maintaining retrofitting systems? Is it the local authority, residents, governments?
8. There is an accountability problem, that is, defining who is responsible for or who pays for adaptation measures. 8a. Individuals don’t feel responsible for their actions, e.g. dumping waste water in water streams. 8b. There is an absence of incentives; for instance, households are not inclined to implement measures in the first place and then maintenance needs to be considered also.
9. It is difficult to quantify and cost water quality, biodiversity and other benefits to include in cost-benefit analyses.
10. Insurance companies don’t behave realistically as there are no proper flood resilient refurbishments done after events.
11. Introduction of adaptation measures without consulting local residents results in a lack of local support, especially cement structures.
12. Citizens’ lack of knowledge (unawareness) about natural flood risk management impedes the adoption of local adaptation measures, e.g. paving over front garden no mechanism to do adaptation. 12a. No discussion locally on how to adapt to flood risk. 12b. Lack of residents understanding, they don’t want to take it on.
13. Conflicts with Sites of Special Scientific Interest (SSSI) where preventive measures are needed, thus flood risk implementation is incomplete.
14. Customers’ low willingness to pay extra on their water bills to pay for adaptation (particularly if it is for others), strengthened by political influence (through OFWAT) to keep water bills low.

42
4. If any obstacles were overcome, how was this achieved? (Approximately 500 words)
When flood events have occurred, some people have reacted, showing a sudden interest in their
community flood group and and supporting the EA in fund raising efforts (altohugh proactiveness is
needed).
It is the role of the government to make sure insurance works for people, instead of for the
insurance companies itself. The central government has done some work on this.
Education has worked up to a point. For instance, there are various projects to engage the
community at Garforth, but they are very small so only some people are informed.
The government’s Green Deal Plan (i.e. a scheme that allows people to make energy-saving
improvements to their home and find the best way to pay for them) has gotten lots of work done
towards mitigation, e.g. solar panels and solid wall insulation systems (but it has not rolled out to
flood adaptation). At the same time, this scheme helps people realize the risks that exist.
Knowledge of previosu programs provides opportunities to do things a better way. For instance, the
Green Deal Plan was too expensive, implementation was somewhat weak, and loans (attached to
energy bills or mortgage) were high so people where better off getting private loans.
All flood risk adaptation exercises and studies that have been carried out, either successful or not,
are learning experiences. For example, a village was being flooded for years so the EA came and
identified adaptation actions to implement: blocking rivers, providing drains, etc. However, none of
them proved to be worth doing to justify the expenditures. But it is not a waste of time as, although
it didn’t solve the problem, it contributed to a better understanding of adaptation. It also involved
direct engagement and people (i.e. victims) were being spoken to.
Some incentives exist to promote measures that decrease flood risk in certain areas. For example,
the use of water butts in homes to capture rainfall water to use for your garden, etc. reduces water
runoff which can reduce household water charges.
Developers that understand the area to be built in (particularly areas with flood risk), that
communicate openly (especially about funding for flood risk management) and that approach
communities, reduce the chances of having locals object those new developments. For example,
residents in a community objected a development. But then developers communicated their plans,
highlighted the benefits (such as a decrease of 80% water run-off), engaged with the community,
and provided additional funds for a wider flood risk management scheme. Thus, the builder got
approval by local residents and the council to develop, so every group won. This also shows how
adequate and engaged consultation can influence if and how developments take place, committing
developers to carry out flood risk reduction measures and others.
Particular interests are able to mobilize funding and media.
The initial Flood Alleviation Scheme (FAS) for Leeds was elaborated mainly by the EA in 2010. This
proposal was rejected mainly due to its elevated cost. Thus, a new FAS was designed at a reduced
cost with a more active involvement of the council as Lead Flood Authority (OR).

43
The Aire Action Group (now inactive), with a coordinator funded by the EA, was a useful
partnership that brought together key stakeholders in the Aire catchment helping solve
(temporarily) the lack of communication between them (OR).
5. What are the future prospects of the climate change adaptation activities in the case study? (Approximately 200 – 500 words)
(Answer based on stakeholders and the researcher’s views for the future of adaptation in Leeds, all factors mentioned are hypothetical though, unless otherwise mentioned) It is evident from the LCC’s financial documents that several small flood alleviation schemes will be implemented around the Leeds district (in residential areas). There is also a strong push by several stakeholders (including EA, LCC and Water@Leeds of the University of Leeds) for the requirement of implementation of green measures in new developments (OR). There seems to be a tendency towards a wider, holistic catchment approach. An ecosystem services approach highlighting, quantifying and costing multiple benefits not just flood risk reduction. DEFRA is interested in this; the current government is putting a value on natural capital, so there’s an opportunity to start generating that debate. An example in place already is the health benefits of initiatives during cold weather. Thus, the aim is not only to understand the hydrology of the area, but also to connect everyone in the area, particularly the people who are affected by flooding (i.e. at risk residents and businesses) and the people contributing to the problem (e.g. landowners upstream, developers).
There is an interest in an independent long-term body to manage flood risk, formed by representatives of key stakeholders, that leads and takes actions forward. The EA is not long-term due to its periodical
reviews, it is not stable. A coordinating approach by all agencies is needed. River stewardship is a potential mechanism that the EA is already considering, e.g. in Sheffield. A separate organisation could be set up which can get funding from somewhere to be held in trust for river maintenance, for whatever way communities want to spend it. It seems eminent that financial incentives might develop for flood risk adaptation of households (e.g. SuDS), similar to the Green Deal Plan. For example, in London there is a (social housing) project on water efficient homes (showers, white appliances, etc.) which incorporates flood protection, so when a household renovates it considers all aspects. Also, the reductions possible in water bills by disconnecting from surface water could be more widely publicised or put into practice (see OFWAT website). There is also a strong push for advancing the inclusion of green measures in new developments. A stronger voice at the national level would support this and a long-term economic model would help to set the agenda, especially to developers. Another key aspect is to get involved with purveyors of SuDS. Another issue that might develop is greater involvement of businesses in flood risk management, particularly an incentive process for new businesses to contribute to flood prevention. So the private sector can see that it’s worth buying into the idea – if they want centre themselves in Leeds they need

44
to invest and take it forward. There needs to be a way of quantifying the benefits of flood risk management for businesses. Even highlighting the repercussions a major flood in Leeds would have on the local and national economy, as it is a northern power house. By emphasising that Leeds is the place to be, which requires investment in other areas first, which will then further justify the investment in flood risk. This is linked to the fact that new sources of funding are needed, the government doesn’t have the money, and it needs to come from the private sector. There needs to be a clear local policy, although it should initially come from DEFRA to start with, but then it needs to lead on to having a local vision. A suggestion was to create a water management credits system or a sustainable rating, like that of supermarket supply chains (i.e. regulation as a driver). Partnerships between key stakeholders and the University of Leeds will be strengthened, particularly through cross-faculty hubs dedicating staff to this networking. Stakeholders like LCC and EA could be clearer on what the Universities could produce to help their work, involving agencies from the start and feeding this into funding proposals. Also should include businesses, Local Enterprise Partnerships (LEP), local nature reserves, and Local Nature Partnerships (LNP). There are expectations that the adaptation report submitted by the climate change adaptation minister to parliament should open opportunities.
6. What is the key message from this case study (and which could work in other cases as well)? Don’t forget to consider any specific policy recommendations that arise in your case study! (Approximately 200 – 500 words)
The key message of the Leeds case study research is that a combination of soft, grey and green measures (a holistic approach) is needed to achieve maximum flood risk reduction, as well as multiple other benefits, and efforts should not be limited to one approach. In addition, the ability to quantify the benefits of green adaptation measures has a substantial bearing on their cost effectiveness and thus its implementation by authorities. The key points of flood risk adaptation in Leeds in general include: a) most, if not all, flood adaptation actions (including community participation) have generated from actual flood events as a ‘reaction’ and this needs to change to a proactive focus instead; b) it has been found that although local efforts are vital, it is also crucial to count with the support and political will of the central government for regulations, funding, research, among others; b) adaptation efforts in Leeds seem to be enhanced when several key stakeholders come together to work on an initiative, which also leads to a greater internalisation of concepts and goals in the stakeholders’ organisations.
7. Development of new tools for adaptation planning and
implementation (Please describe the development and use of new tools for climate change adaptation planning and implementation which you
have used under BASE research project and report on their SWOT analysis and overall feedback. Máx 2000 words)
New tool(s) developed and used during BASE:

45
1) __None_________________________________________
Description for each New tool (Maximum 50 words/each):
Swot Analysis:
Strenghts Weaknesses
Opportunities Threats
10. References
11. Defra 2012. UK Climate Change Risk Assessment: Government Report. Department for Environment, Food &
Rural Affairs.
12. Defra and Environment Agency 2013. The National Adaptation Programme: Making the country resilient to a
changing climate. Department for Environment, Food & Rural Affairs and Environment Agency.
13. Leeds City Council 2007. Impact of Flooding Events in June on the Leeds District. Report of the Director of City
Development/ Director of Resources. Available from:
http://democracy.leeds.gov.uk/documents/s12048/Flooding Report - 4 July.pdf.
14. Leeds City Council 2009. A Local Climate Impacts Profile for Leeds 2002 - 2008. Available from:
http://www.leeds.gov.uk/docs/Local Climate Impacts Profile (LCLIP).pdf.
15. Leeds City Council. 2012. Climate Change Partnership [Online]. Available:
http://www.leeds.gov.uk/council/Pages/Climate-Change-Partnership.aspx.
16. ONS 2013. Primary Care Organisation Population Estimates, Mid-2011 Final (Census Based) (Table 8).
Available from: http://www.ons.gov.uk/ons/publications/re-reference-tables.html?edition=tcm%3A77-
297507 - tab-all-tables: Office for National Statistics.
17. The Leeds Initiative 2012. Leeds Climate Change Strategy: Making the Change 2012 to 2015. Available from:
http://www.leeds.gov.uk/docs/Climate Change Strategy 2012.pdf.
18. Yorkshire and Humber Assembly 2009. Yorkshire and Humber Regional Adaptation Study: Weathering the
Storm. Available from: http://www.ukcip.org.uk/wordpress/wp-content/PDFs/YHARASbrochure.pdf.

46
APPENDIX 1. Map of high priority land for woodland planting to reduce flood risk in the Aire catchment (Source:
Forestry Commission).