case study houten - itdp: the institute for transportation ... · nicole foletta, itdp europe case...
TRANSCRIPT

Nicole Foletta, ITDP Europe
case study
Houtenutrecht, the netherlands

houten site facts
Architect: Rob Derks
Population: 43,900
Urban Area: 820 ha
Urban Density: 54 persons/ha
Number of Residential Units: 18,400
Distance from Utrecht City Center: 8 km
Cars: 415 cars/1,000 residents
Parking Spaces/Residence: 1.1
Non-motorized Mode Share: 55%
Public Transport Mode Share: 11%
Households with Carsharing: 2%

background
Houten, a city in the province of Utrecht in The Netherlands, is a
unique example of an entire city designed and built to prioritize
the cyclist and pedestrian. It is a greenfield development with good
transit access, high quality bicycle infrastructure, provision of public
bikes and carsharing, and application of employer contributions
and educational programs to promote cycling. Non-motorized trans-
port use is higher in Houten than in comparable cities while
car use is lower.
The city’s innovative traffic layout was a departure from the
norms of the time when it was developed in 1968 and approved by
the city council. The design limited intra-city car use and gave priority
to traffic safety for pedestrians and cyclists. Core design features
include narrow roads, application of traffic calming measures and
separation of bicycle paths from car traffic whenever possible.
The basic layout of the city consists of two train stations, each
surrounded by a ring road with a radius of approximately one kilo-
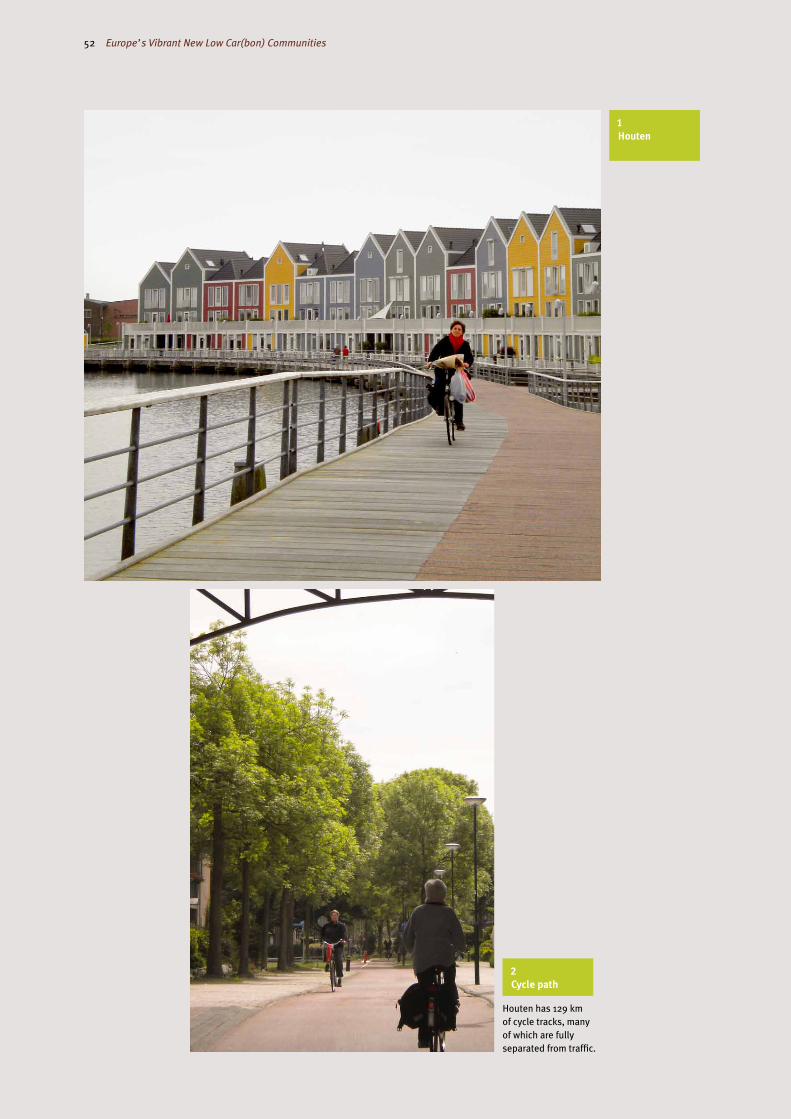
meter. The rest of the city is covered by an extensive, 129 kilometer
network of bicycle paths (Photos 1 and 2; Figure 1). There are 31
residential districts, each of which is only accessible to cars via the
peripheral ring roads encircling the town. However, the network
of paths for cyclists and pedestrians includes a thoroughfare that
passes directly through the town center, providing filtered perme-
ability for cyclists and pedestrians. The majority of schools and
important buildings are located along this thoroughfare. Due to this
design, cycling is the most direct mode of transportation and is often
even faster than travel by car. 1
Houten’s innovative design features along with the city’s persis-
tent policies to favor cyclists and pedestrians have resulted in numer-
ous measured benefits, including improved cyclist and pedestrian
safety, increased activity levels of residents, and reduced use of
motorized vehicles. Furthermore, this case study demonstrates that
innovative design features are not limited to new districts within a
city, but can be applied to new cities as a whole.
planning process
In 1966 the national government identified Houten, then a small
village with a population of about 3,000, as a high growth area and
mandated a growth plan be developed to accommodate an eventual
population of 100,000. In 1968 Dutch architect Rob Derks offered
a plan heavily focused on filtered permeability: a dense network
of direct routes for cyclists and a course network of general roads,
offering limited city center access to cars (see Filtered Permeability
sidebar, p. 49). The city council, which was then made up of civilians
and farmers and no politicians, approved Derk’s plan, which they
believed would provide a more liveable quality to their city. They
hired four city advisors (including Rob Derks) with expertise in archi-
tecture, city planning and transportation engineering to implement
the plan. This combination of technical and planning expertise was
key to the success of the development.
In 1974 an agreement was made with the national government
to fund the first ring road. Construction began in 1978. Further infra-
structure was publicly funded, both through the local government
and using grants from the regional and national governments.
In 1994 Houten was again designated as a new growth area under
the government’s new Vinex Location program (see Vinex Locations
sidebar, p. 50). Plans were made to construct a second train station,
also surrounded by a ring road with bicycle paths and mixed use
lanes throughout. This area is referred to as South Houten.
To this day, city policies in Houten have a strong focus on bicycle
safety and bicycle rights. The local cyclist union is also very active in
advocating for cycling infrastructure and cycling rights.
key policy and design measures
Sustainable transportation is one of the main priorities of the City
of Houten. Beyond using urban design to encourage cycling and
walking, the city has also applied several other policy measures, the
combination of which has had a great impact on travel behavior of its
citizens. These are described below.
Bicycle and Pedestrian Infrastructure
As mentioned, the city of Houten has over 129 kilometers of cycle
paths, which are colored brick-red. In the city center these paths are
completely separated from car traffic (Photo 3), although motor-
ized scooters are allowed to use them. (Dutch law places low-speed
scooters in the same category as bicycles, therefore they cannot
legally be excluded from using the paths.) In order to improve
safety, speed bumps are located on cycle paths throughout the city
designed specifically to slow motorized scooters while providing
minimal disturbance to cyclists (Photo 4). The entrance to many of
the cycle paths are blocked by bollards, so cars are physically unable
to enter these pathways. Only in residential areas do bikes share
roads with cars, but speeds in these areas are limited and the streets
are traffic calmed to maintain safety for pedestrians and cyclists.
Furthermore, signs are located on these streets stating that cars are
guests on the road and must give priority to cyclists. Bicycle tunnels
and bridges have been built under or over the ring roads so that nei-
ther bicycle nor car traffic are interrupted (Photo 5). In addition, cycle
paths connect Houten to the city of Utrecht where many residents
commute for work.
This extensive focus on bicycle infrastructure and bicycle prior-
ity above the car on all city streets is unique to the city of Houten.
Furthermore, infrastructure costs for Houten are no higher than for
any other Vinex location in the Netherlands (Beaujon 2002; Tiemens
2010). This focus makes cycling in Houten easier, safer and more
convenient than in other cities. Surveys have shown that even those
not predisposed to cycling cycle more as a result of living in Houten
(Hilbers 2008). This demonstrates the strong impact infrastructure
can have on travel choices.
One issue encountered is that since so many residents cycle, it
can often be difficult to find a bicycle parking spot, especially in high-
trafficked areas like the city center (Photo 6). To resolve this issue,
the city is currently constructing a staffed bicycle parking facility and
bicycle shop under the tracks of the central train station.
Urban Design
Houten’s early focus on urban design is a key to the city’s current
level of transport sustainability. When designing the city, Houten’s 1 http://www.youtube.com/watch?v=p4QT5rvnfS0
48 Europe’s Vibrant New Low Car(bon) Communities
planning advisors considered how the location of housing and layout
of roads and bicycle paths would affect resident travel behavior. They
did not neglect the car in their designs, but created a layout that
would give priority to cyclists.
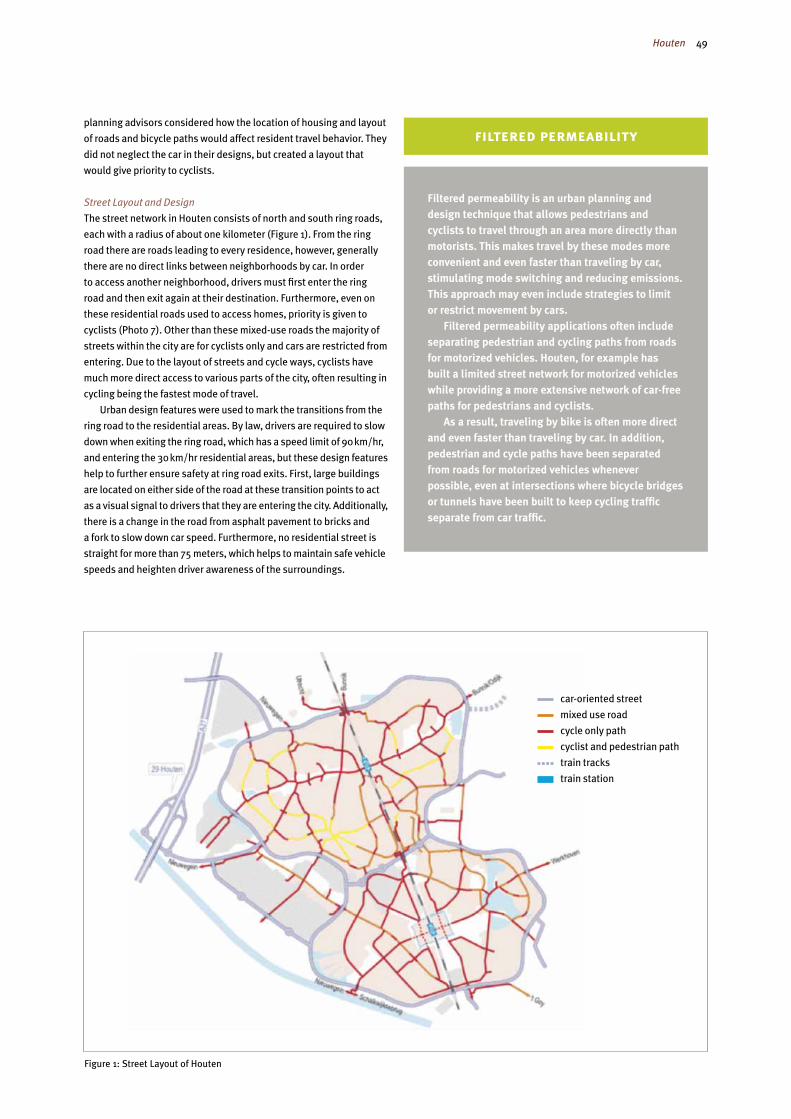
Street Layout and Design
The street network in Houten consists of north and south ring roads,
each with a radius of about one kilometer (Figure 1). From the ring
road there are roads leading to every residence, however, generally
there are no direct links between neighborhoods by car. In order
to access another neighborhood, drivers must first enter the ring
road and then exit again at their destination. Furthermore, even on
these residential roads used to access homes, priority is given to
cyclists (Photo 7). Other than these mixed-use roads the majority of
streets within the city are for cyclists only and cars are restricted from
entering. Due to the layout of streets and cycle ways, cyclists have
much more direct access to various parts of the city, often resulting in
cycling being the fastest mode of travel.
Urban design features were used to mark the transitions from the
ring road to the residential areas. By law, drivers are required to slow
down when exiting the ring road, which has a speed limit of 90 km/hr,
and entering the 30 km/hr residential areas, but these design features
help to further ensure safety at ring road exits. First, large buildings
are located on either side of the road at these transition points to act
as a visual signal to drivers that they are entering the city. Additionally,
there is a change in the road from asphalt pavement to bricks and
a fork to slow down car speed. Furthermore, no residential street is
straight for more than 75 meters, which helps to maintain safe vehicle
speeds and heighten driver awareness of the surroundings.
filtered permeability
Filtered permeability is an urban planning and design technique that allows pedestrians and cyclists to travel through an area more directly than motorists. This makes travel by these modes more convenient and even faster than traveling by car, stimulating mode switching and reducing emissions. This approach may even include strategies to limit or restrict movement by cars.
Filtered permeability applications often include separating pedestrian and cycling paths from roads for motorized vehicles. Houten, for example has built a limited street network for motorized vehicles while providing a more extensive network of car-free paths for pedestrians and cyclists.
As a result, traveling by bike is often more direct and even faster than traveling by car. In addition, pedestrian and cycle paths have been separated from roads for motorized vehicles whenever possible, even at intersections where bicycle bridges or tunnels have been built to keep cycling traffic separate from car traffic.
Figure 1: Street Layout of Houten
car-oriented street
mixed use road
cycle only path
cyclist and pedestrian path
train tracks
train station
Houten 49

“like pedals of a flower” around these central areas (Beaujon 2002).
This style follows the classic layout of a transit oriented development
(TOD), with housing and retail focused around a central transit sta-
tion, maximizing access for all residents. Furthermore, the majority
of schools and important buildings are located along a bicycle thor-
oughfare, which runs through the center of the city, providing easy
access to important destinations by bike.
A business park is located in South Houten close to the border
between the two rings, providing many job opportunities to
residents. In addition, the historic city center of Houten is located in
the southwestern part of the northern ring, which consists of a plaza
surrounded by shops and restaurants as well as several historical
buildings, including a protestant church that dates back to the 1500’s.
Public Transport
As mentioned, Houten has two railway stations, one located in the
center of each ring road. Houten Castellum was recently renovated
and additional track capacity was added. Every 15 minutes a train
takes travelers from Houten Station to the city of Utrecht, with a jour-
ney time of 10 minutes. There are also four trains per hour running in
the opposite direction, towards the town of Geldermalsen. Houten
also has bus connections to Utrecht and other regional centers. The
trains and buses make it easy for residents to access Utrecht and
other parts of the Netherlands without needing a car.
Train and bus riders in Houten may use the OV-chipkaart, a
contactless smartcard that will eventually be used on all public
transport in the Netherlands. Introduction of this card simplifies the
process of traveling to other parts of the country. The same card can
also be used in the GWL Terrein development located in Amsterdam.
Public Bikes
An OV-Fiets (translated as “public transport bicycle”) rental station
with 35 bikes is located at a staffed bicycle parking facility near
Houten’s central train station (Photo 8). OV-Fiets started as a pilot
project in the Netherlands in 2002 with the aim to integrate bike
rental as part of the services offered by the Dutch public transport
system. There are now over 160 rental points, mainly located at
train stations throughout the Netherlands. The scheme has been
designed for frequent users, mainly commuters, to encourage
cycle use over motorized transport for the first/ last leg of their jour-
neys between the station and their homes or places of work. Currently
50% of the nation’s rail passengers have access to the scheme
(OV-Fiets (NL) 2008).
OV-Fiets users must register with the system and a Dutch bank
account is necessary for the subscription charges. Users can sign
up using their existing annual rail season card (much like the Oyster
scheme in London) or obtain a membership card. Each individual
rental costs € 2.85 per 20 hour period up to a maximum of 60 hours.
The yearly subscription charge is € 9.50. Members may use a bike at
any location throughout the Netherlands, but must always return the
bike to the station where it was obtained.
The OV-Fiets system differs from bikesharing systems being
introduced in many cities, such as Velib in Paris and Stockholm City
Bikes, in which short trips are encouraged and users can pick-up
and drop-off bikes at numerous locations throughout the city.
OV-Fiets, on the other hand, has one charge per 20 hour period, so
users often keep the bikes for longer periods of time. Additionally,
each bike comes equipped with a lock, making it possible for users
to park the bike, for example, at their office during the day, and use
Public Space Design
The city of Houten has incorporated many open public spaces and
green areas into its design. Next to the central train station is a plaza
surrounded by a man-made canal and home to numerous shops and
cafes. The plaza is often used for public markets, making it a bustling
activity center. A similar plaza with shops and cafes but incorporating
a Romanesque theme, is planned for the Houten Castellum station
in the south of the city. Many small play areas and parks are located
throughout the city so that no one has to go far to find green space.
In addition, a small forest complete with cycle paths and play areas
for children was created just outside the city. The objective was to
create an area near the city, accessible by bicycle or walking, where
residents could escape to enjoy nature without having to drive.
Land Use Planning and Design
In the core of each of Houten’s rings is a train station, so that no one
lives more than two kilometers away from a station. Next to each sta-
tion is a plaza with shops and other amenities. Housing is arranged
vinex locations
Vinex Locations are areas in the Netherlands, generally in the outskirts of cities, designated for housing development. The program was created by the Dutch Ministry of Housing in 1993 as an answer to the anticipated housing shortage, mainly due to the high growth rate of the population. More than just an urban-extension program, the Vinex project was intended to metamorphose the shape of the Netherlands. Over a million houses were to be built by 2015, in new neighborhoods fulfilling special conditions. “To fit the requirements of the consumer in the 21st century,” special attention was given to quality, sustainability and social equity. The principles of Vinex housing are:
· Build cohesive neighborhoods in place of existing urban gaps to reduce the fragmentation of Dutch cities and to protect green areas
· Make easily accessible all urban facilities and, in particular, shopping centers in order to increase the potential customer base
· Reduce car-dependency by providing easy access to urban facilities by public transport or NMT
· Build a viable and social structure that will cor-respond to all layers of society
Vinex Locations are required to create growth plans following certain standards. To avoid segregation, 30% of housing is required to be social housing, which is subsidized by the government and meant for low-income households. Additionally, housing must be high density with at least 30 houses per hectare, must conform to market conditions, must maintain the relation between existing and new urban areas and must use sustainable design (Vinex Location Website).
50 Europe’s Vibrant New Low Car(bon) Communities

cars. Companies may only offer transport subsidies related to bikes
or public transit, in order to encourage employees to choose these
options over commuting by car (Tiemens 2010).
Educational Programs
Children are taught from an early age≠ not only about the health
benefits of cycling, but also about bicycle safety. Since cycling is a
primary mode of transport in Houten, it is essential that residents
understand appropriate and safe bicycle use. Starting at an early age
Houten’s children are given a thorough education in bicycle riding
and take a compulsory bicycle exam when they are 10 years old to
test their knowledge of hand signals, road rules and riding ability.
Children must take this test until they pass (CylcePress 2003).
quantitative analysis
In order to quantify the benefits of Houten’s unique combination of
urban design structure and policy measures, we compared it to Zeist,
as a reference point within the Netherlands, and Milton Keynes,
England, to demonstrate the difference between bike-oriented and
car-oriented urban design (Table 2). Zeist has a similar population
to Houten and, like Houten, is located on the outskirts of Utrecht (a
the bike throughout the day for trips or errands. The bike must then
be brought back to the same station where it was checked-out.
Therefore it functions as a hybrid system between bikesharing and
bicycle rental.
Carsharing
Two carsharing companies are located in Houten: Greenwheels and
Wheels4all. Greenwheels has two carsharing vehicles in Houten, one
of which is located near the central station. Wheels4all has fourteen
cars located throughout the city. These vehicles provide residents of
Houten with access to a car when needed without having to own one.
More information about these companies is included in Table 1.
Employer Contributions
In the Netherlands, companies are required to compensate employ-
ees for their transport to work. This money is subsidized by the
government through tax deductions. Typically employers provide
a variety of options that employees can choose between, such
as reimbursement for fuel, free parking, transit passes, and even
providing money towards the purchase of a new bike. For example,
City of Houten employees can purchase a tax deductible bike every
three years. The City of Houten goes beyond national policy to
restrict companies from offering compensation options related to
Wheels4All Greenwwheels
Deposit 250 € 225 €
Monthly subscription fee (varies based on subscription type)
Several options:2.5, 5, 10, 20 or 150 €
4,700
Population density (persons/ha) 2.5, 5, 10, 20 or 150 € Ranges from:
Fee per km (varies based on subscription type) 0.11 or 0.13 € 0.10 €
Hourly fee (varies based on subscription type) 0.5, 1.6 or 2.5 € 2.50 €
Discounts available No substantial discount available Discount with Dutch Railway card (NS card)
Company membership option Yes Yes
Number of cars available in Houten 14 2
Table 1: Information about carsharing companies in Houten
Houten Zeist Milton Keynes South Houten Veldhuizen
Population 43,900 60,400 196,000 18,700 9,350
Urban area (ha) 820 2,500 8,900 350 190
Urban density (persons/ha) 54 24 22 53 49
Number of residential units 18,400 26,600 na 5,700 3,500
Cars per 1,000 residents 415 530 na 449 na
Mode share
Car 34% 46% 70% 58% 77%
Public transit 11% 11% 10% 16% 10%
Bicycle 28% 29% 3% 24% 13%
Walking 27% 14% 17% 2% 0%
Table 2: Houten as compared to nearby and surrounding areas
http://www.wheels4all.nl, http://www.greenwheels.nl
ITDP Europe, 2010; City of Houten; City of Zeist; Milton Keynes Council, 2009; Hilbers, 2008
Houten 51
1 Houten
2 Cycle path
Houten has 129 km of cycle tracks, many of which are fully separated from traffic.
52 Europe’s Vibrant New Low Car(bon) Communities
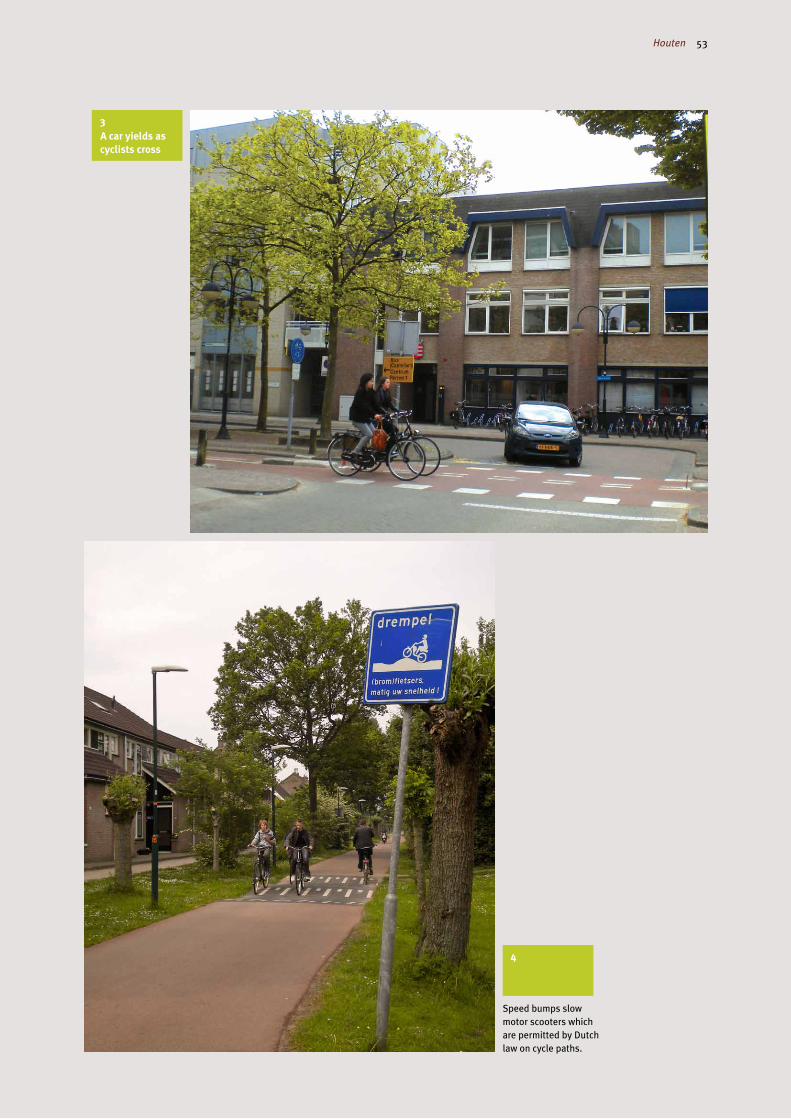
3 A car yields as cyclists cross
4
Speed bumps slow motor scooters which are permitted by Dutch law on cycle paths.
Houten 53

6 Bicycle trailer
Children learn about cycling and cycling safety from an early age in Houten and many families travel together via bike.
5 Cycle tunnel
Cycle paths cross the ring road, giving both cyclists and motorists safe, uninterrupted travel routes.
54 Europe’s Vibrant New Low Car(bon) Communities

7 Mixed use street
On residential streets, bikes share space with cars, but as the sign indicates, drivers must give cyclists right-of-way.
8 OV-Fiets bicycles
An OV-Fiets bicycle rental station near Houten’s train station is a blend between bikeshare and traditional bike rental, allowing for day-long rentals to encourage passengers to ride to and from the station.
Houten 55

regional center with a population of 307,000). Like many cities in the
Netherlands, Zeist has good bicycle and pedestrian infrastructure;
however its street network is much more car-oriented than the Houten
network. Milton Keynes, like Houten, was designed in the 1960’s
as a new city; it was the last and largest of the British government’s
new towns, under the 1946 New Towns Act. The city is located about
80 km northwest of London. Unlike Houten’s bicycle and pedestrian
focused, dense, urban design, Milton Keynes was designed with the
car in mind, focusing on low densities and easy car access on high
speed grid roads. In a further attempt to accommodate the car, the
parking supply is quite high; as much as 2-3 times higher than what
would be expected for a city of its size (Whiteside 2007).
Additionally, the area of South Houten is compared to the
neighborhood of Veldhuizen, located in the Leidsche Rijn district of
the city of Utrecht. Like South Houten, Leidsche Rijn was identified as
a high growth area, or Vinex Location (see Vinex Locations sidebar).
Both locations were required to follow the same Vinex Location
guidelines, including reserving 30% of housing as social housing,
providing a density of at least 30 houses per hectare, maintaining
the relation between existing and new urban areas and using
sustainable design. The neighborhoods in the Leidsche Rijn district
were designed individually, each with its own identity. However, the
urban designers of Veldhuizen and other neighborhoods of Leidsche
Rijn took a different approach to the planners of Houten, placing
more focus on cars and therefore providing more parking facilities,
more main roads, and improvements to public transit (Hilbers 2008).
Table 2 provides a summary of statistics for the entire city of Houten
(within the two ring roads), the city of Zeist, the city of Milton Keynes,
the area of South Houten (within the southern ring road) and the
neighborhood of Veldhuizen.
Car and Bicycle Ownership Rates
While the car ownership rate of Houten is not necessarily low (415
cars per 1,000 residents), it is lower than the nearby city of Zeist (530
cars per 1,000 residents). A survey of Milton Keynes residents found
that 45% of households have two or more cars (Milton Keynes Council
2009). This is higher than for the city of Houten where 36% of house-
holds have two or more cars (ITDP Europe 2010). The Milton Keynes
survey did not collect exact numbers of cars owned per household.
Surveys conducted in both Houten and Milton Keynes asked
about the bicycle ownership rates for households. In Houten only
2% of households are without a bicycle while in Milton Keynes 35%
of households do not own a bike. The bicycle ownership rate is quite
high in Houten at 3.4 bikes per household. The rate is much lower in
Milton Keynes at 1.1 bikes per household. This is not surprising given
that the Netherlands is known for having a much stronger bicycle
culture than England. However, investments in bicycle infrastructure
also likely contribute to this difference. The city of Houten has nearly
three meters of cycle paths per resident while Milton Keynes has just
over one meter of cycle paths per resident. Furthermore, the cycle
paths in Houten are direct and are perceived as safe by residents,
while the cycle lanes in Milton Keynes are not direct, can be difficult
to follow and are perceived by some to be dangerous after dark
(Whiteside 2007).
Bicycle Use and Perceptions
Results of a survey conducted by University of Utrecht students shows
that people in South Houten are more active, on average, than people
in both Veldhuizen and the Netherlands as a whole (Figure 2). Factors
contributing to this increased activity are that residents of South
Houten more often cycle for daily and weekly errands and also spend
more hours per week on recreational cycling (2.3 hours per week
for South Houten residents versus 1.4 hours per week for Veldhuizen
residents). It would appear that the spatial design structure
and extensive cycle network seem to encourage cycling in Houten.
This is further supported by survey findings that residents of South
Houten are more satisfied with the number of unhindered bike
paths and give higher ratings for quality and safety of bike paths
(Figure 3). In addition, more than half of survey respondents stated
that their bicycle use increased after moving to South Houten
(Hilbers 2008).
Mode Split
While Houten residents do more recreational cycling than residents
in surrounding areas, encouraging more transportational cycling
is key to reducing carbon emissions. A survey of South Houten and
0%
The Netherlands(2005)
perc
ent o
f res
iden
ts
inactive(less than 0.5 hours of exercise per week)
moderately active(0.5 – 2.49 hrs/wk)
active(2.5+ hrs/week)
South Houten(2008)
Veldhuizen (2008)
20%
40%
60%
80%
100%
Figure 2: Activity level of residents of The Netherlands, South Houten and Veldhuizen
Hilbers, 2008
56 Europe’s Vibrant New Low Car(bon) Communities

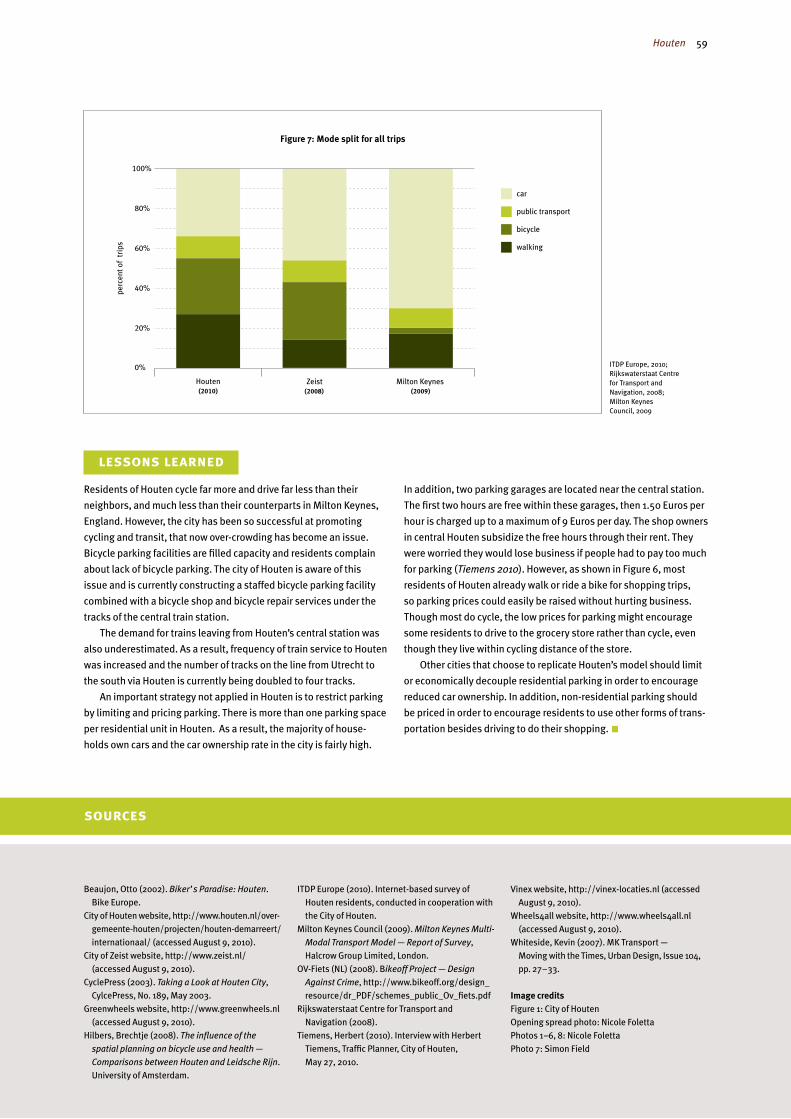
Overall, more than half of all trips made by Houten residents
(55%) are made by non-motorized modes of travel, which is higher
than for the city of Zeist (43%) and Milton Keynes (20%). Further,
higher proportions of trips made by Milton Keynes (70%) and Zeist
residents (46%) are by car than for the city of Houten (34%), as seen
in Figure 7. A further study found that 42% of trips shorter than 7.5
kilometers in Houten are made by bike, and around 21% by foot (City
of Houten Website). Another study states that car use in Houten is
25% lower than in similar cities (Beaujon 2002). All of these studies
support the finding that the combination of measures present in
Houten have contributed to improved sustainability of travel choices
of residents, particularly for trips within the city.
Distance Traveled
Distance traveled is a key measure for evaluating transport-related
emissions. Resident surveys found that residents of South Houten
have shorter commute times than residents of Veldhuizen, even
while more people commute to work by bike and fewer by car. This
suggests that residents of South Houten live closer to work, thus
requiring less daily travel, and reducing the carbon footprint of
residents (Hilbers 2008).
Veldhuizen residents in 2008 found that more respondents from
South Houten (24%) cycle to work than respondents from Veldhuizen
(13%), as seen in Figure 4. Furthermore, 14% of respondents from
South Houten cycle or walk to a public transportation stop or station
and then take public transportation to work versus 9% in Veldhuizen.
A far smaller proportion of South Houten residents (58%) travel to
work by car than Veldhuizen residents (77%).
Surveys of residents of Houten and Milton Keynes found that far
more work trips made by Houten residents (31%) are by bike than
work trips made by Milton Keynes residents (4%), as seen in Figure 5.
In addition, far more commute trips by Milton Keynes residents
(73%) are by car than in Houten (53%). This demonstrates that
Milton Keynes residents are much more dependent on their cars for
work trips than Houten residents.
Still, many work trips made by Houten residents are by car,
particularly for trips out of the city. However, by far, the most popular
mode of travel for trips made within the city is cycling. The majority
of Houten residents travel to the grocery store (53%), conduct other
shopping (70%), run service related errands like visiting the bank or
barber (79%) and visit friends and family in Houten (79%) by bike or
on foot, as seen in Figure 6.
0%
South Houten(2008)
perc
ent o
f res
iden
ts
Vedhuizen(2008)
20%
40%
60%
80%
100%
car
public transport with car as pre-transport
public transportwith cycling or walkingas pre-transport
bicycle
walking
Figure 4: Mode of transportation to work for South Houten and Veldhuizen residents
bicycle path safety
bicycle path quality
1 2 3
goodaveragebad
Veldhuizen (2008)
South Houten(2008)
Figure 3: Perceptions of bicycle path quality and safety in South Houten and Veldhuizen
Hilbers, 2008
Hilbers, 2008
Houten 57

Half of Houten residents travel less than one kilometer to their
grocery store, and 18% travel a mere 500 meters or less. The average
distance residents travel to a grocery store is 1.2 km (ITDP Europe
2010). However, 47% of residents stated that they typically travel to
the grocery store by car (Figure 6). Residents might be incentivized
to drive to the store based on the low parking rates in parking
garages in Houten and the high availability of parking spaces. If
parking prices were increased, more residents would likely shift to
cycling to the grocery store, since the majority of residents already
cycle for most other trip purposes within the city (Figure 6). Indeed,
many residents own bike trailers which can be used to carry goods
(Photo 6). These trailers, combined with the short distance to a
grocery store make shopping trips by bicycle feasible.
Indeed, surveys of residents throughout the city of Houten found
that 21% of residents live within 5 kilometers of their place of work
or education, and more than half live within 15 kilometers. However,
the finding that almost half of residents live 15 kilometers or more of
their place or work corresponds with the finding that 53% of resident
commute trips are by car (Figure 5). For longer travel distances,
residents are forced to travel by motorized modes since most are not
able to cycle or walk such long distances. While Houten has good
public transport access, it appears that many residents still choose
to travel by car to work, particularly for destinations more than 25
kilometers from home. Increased car travel increases the carbon
footprint of residents.
0%
Houten(2010)
perc
ent o
f tri
ps
Milton Keynes(2009)
20%
40%
60%
80%
100%
car
public transport
bicycle
walking
Figure 5: Mode of travel to work
0%
grocery shopping
perc
ent o
f res
iden
ts
other shopping service relatederrands
visiting family and friends
20%
40%
60%
80%
100%
car
public transport
bicycle
walking
Figure 6: Houten residents’ mode of travel for various trip types (2010)
Hilbers, 2008
ITDP Europe, 2010
58 Europe’s Vibrant New Low Car(bon) Communities
In addition, two parking garages are located near the central station.
The first two hours are free within these garages, then 1.50 Euros per
hour is charged up to a maximum of 9 Euros per day. The shop owners
in central Houten subsidize the free hours through their rent. They
were worried they would lose business if people had to pay too much
for parking (Tiemens 2010). However, as shown in Figure 6, most
residents of Houten already walk or ride a bike for shopping trips,
so parking prices could easily be raised without hurting business.
Though most do cycle, the low prices for parking might encourage
some residents to drive to the grocery store rather than cycle, even
though they live within cycling distance of the store.
Other cities that choose to replicate Houten’s model should limit
or economically decouple residential parking in order to encourage
reduced car ownership. In addition, non-residential parking should
be priced in order to encourage residents to use other forms of trans-
portation besides driving to do their shopping.
lessons learned
Residents of Houten cycle far more and drive far less than their
neighbors, and much less than their counterparts in Milton Keynes,
England. However, the city has been so successful at promoting
cycling and transit, that now over-crowding has become an issue.
Bicycle parking facilities are filled capacity and residents complain
about lack of bicycle parking. The city of Houten is aware of this
issue and is currently constructing a staffed bicycle parking facility
combined with a bicycle shop and bicycle repair services under the
tracks of the central train station.
The demand for trains leaving from Houten’s central station was
also underestimated. As a result, frequency of train service to Houten
was increased and the number of tracks on the line from Utrecht to
the south via Houten is currently being doubled to four tracks.
An important strategy not applied in Houten is to restrict parking
by limiting and pricing parking. There is more than one parking space
per residential unit in Houten. As a result, the majority of house-
holds own cars and the car ownership rate in the city is fairly high.
sources
Beaujon, Otto (2002). Biker’s Paradise: Houten.
Bike Europe.
City of Houten website, http://www.houten.nl/over-
gemeente-houten/projecten/houten-demarreert/
internationaal/ (accessed August 9, 2010).
City of Zeist website, http://www.zeist.nl/
(accessed August 9, 2010).
CyclePress (2003). Taking a Look at Houten City,
CylcePress, No. 189, May 2003.
Greenwheels website, http://www.greenwheels.nl
(accessed August 9, 2010).
Hilbers, Brechtje (2008). The influence of the
spatial planning on bicycle use and health —
Comparisons between Houten and Leidsche Rijn.
University of Amsterdam.
ITDP Europe (2010). Internet-based survey of
Houten residents, conducted in cooperation with
the City of Houten.
Milton Keynes Council (2009). Milton Keynes Multi-
Modal Transport Model — Report of Survey,
Halcrow Group Limited, London.
OV-Fiets (NL) (2008). Bikeoff Project — Design
Against Crime, http://www.bikeoff.org/design_
resource/dr_PDF/schemes_public_Ov_fiets.pdf
Rijkswaterstaat Centre for Transport and
Navigation (2008).
Tiemens, Herbert (2010). Interview with Herbert
Tiemens, Traffic Planner, City of Houten,
May 27, 2010.
Vinex website, http://vinex-locaties.nl (accessed
August 9, 2010).
Wheels4all website, http://www.wheels4all.nl
(accessed August 9, 2010).
Whiteside, Kevin (2007). MK Transport —
Moving with the Times, Urban Design, Issue 104,
pp. 27–33.
Image creditsFigure 1: City of Houten
Opening spread photo: Nicole Foletta
Photos 1–6, 8: Nicole Foletta
Photo 7: Simon Field
0%
Houten(2010)
perc
ent o
f tr
ips
Zeist(2008)
Milton Keynes (2009)
20%
40%
60%
80%
100%
car
public transport
bicycle
walking
Figure 7: Mode split for all trips
ITDP Europe, 2010; Rijkswaterstaat Centre for Transport and Navigation, 2008; Milton Keynes Council, 2009
Houten 59