case study for the david l. lawrence convention center building performance... · case study for...
TRANSCRIPT

Case Study for the David L. Lawrence Convention CenterA Building in Operation [BiO] Study
© 2011
prepared for
Green Building Alliance
prepared by
evolve environment : : architecture
prepared with
CJL Engineering
Carnegie Mellon University Center for Building Performance and Diagnostics
Civil and Environmental Consultants, Inc.
funded by
The Heinz Endowments and The Sports and Exhibiton Authority of Pittsburgh

THIS REPORT WAS FUNDED BY
The Heinz Endowments The Pittsburgh Sports and Exhibition Authority
PREPARED FOR
Green Building Alliance
PREPARED BY
evolve environment : : architecture Christine Mondor, AIA, Stephen Hockley, David Deal, Marc Mondor, AIA, Cole Williams
WITH
CJL Engineering Alan Traugott, Gaelyn Neely, Greg Laroca, Amy Ford
Carnegie Mellon University Center for Building Performance and Diagnostics Vivian Loftness, FAIA, Azizan Abdul-Aziz, Jihyun Park, Erica Cochran, Jimena Serra, Craig Schiller
Civil and Environmental Consultants, Inc. Geoff Nara, John Buck, Brad Hazelwood
Copyright © 2011 Pittsburgh, Pennsylvania

With
CJL Engineering Carnegie Mellon University Center for Building Performance and Diagnostics Civil and Environmental Consultants
©2011
Building in Operation (BiO) Case Study | David L. Lawrence Convention Center Page 0 November 2011
For By
BiO Case Study | David L. Lawrence Convention Center Table of Contents 1 Introductory Materials Pages
1.1 Introductory Materials | Overview 1 1.2 Introductory Materials | Business Case for Sustainability 2
2 Benchmarking 2.1 Benchmarking | Internal 4 2.2 Benchmarking | External 6
3 Building Performance 3.1 Building Performance | Energy Conservation Measures 8 3.2 Building Performance | HVAC and Controls 11 3.3 Building Performance | Lighting 14 3.4 Building Performance | Commissioning Review 16 3.5 Building Performance | Natural Ventilation 18 3.6 Building Performance | Power Factor Correction 20 3.7 Building Performance | Renewable Energy 21 3.8 Building Performance | Water Use Audit 24 3.9 Building Performance | Blackwater Treatment System 27
4 Site Performance 4.1 Site Performance | Site Review 29 5 Operations 5. 1 Operations | Waste Review 31 5.2 Operations | Transportation Review 33 5.3 Operations | Sustainable Purchasing Policy 35 6 User Satisfaction 6.1 User Satisfaction | Thermal, Air Quality, Visual & Acoustic 37 7 Sustainable Operating Systems 7.1 greenfirst Review 40 8 LEED EBOM 8.1 LEED EBOM | Submission Recommendations 42 9 Ongoing Data Collection 9.1 Ongoing Data Collection | Recommendations 44 10 Conclusion 10.1 Conclusion 46

With
CJL Engineering Carnegie Mellon University Center for Building Performance and Diagnostics Civil and Environmental Consultants
©2011
Building in Operation (BiO) Case Study | David L. Lawrence Convention Center Page 1 November 2011
For By
Building in Operation (BiO) Case Study for the David L. Lawrence Convention Center
1.1 Overview In the convention industry, Pittsburgh’s David L. Lawrence Convention Center is a leader in sustainable practices. This document summarizes an in‐depth study performed in 2010 and 2011 that examines existing practices and proposed improvement cycles in operations, maintenance, and marketing that are critical to maintain leadership and capture regional economic benefits.
Upon its completion in 2003, the David L. Lawrence Convention Center (DLCC) received a Gold level certification from the U.S. Green Building Council’s Leadership in Energy and Environmental Design for New Construction (LEED‐NC) green building rating system, making it the world’s largest green building and the first LEED certified convention center in the world. The DLCC was constructed with public money, is owned by a public authority, and is operated by an international venue management firm dedicated to sustainable operations through iterative improvements. The DLCC’s commitment to sustainability has been an explicit attraction for many high profile events, including the U.S. Green Building Council’s Greenbuild Conference and Expo (2003) and the G‐20 Summit (2009). Because of its proactive approach, the DLCC’s success has been a national model. Its success likely influenced the standards for sustainable practices in the convention industry, such as those in the soon‐to‐be‐released APEX/ASTM Green Meetings and Events Standards.1
To maintain leadership in the rapidly changing meeting and convention market, the DLCC has implemented a cycle of constant improvement. This building case study analyzes the DLCC’s quantitative and qualitative returns on investment and provides recommendations for how improvements can be made to advance future performance. This post‐occupancy analysis was managed by the Green Building Alliance and performed by a project team led by evolve environment :: architecture (evolveEA) with CJL Engineering, Carnegie Mellon University’s Center for Building Performance and Diagnostics, and Civil and Environmental Consultants. This study’s conclusions will allow the DLCC to capitalize on the original sustainable design approach, and consider additional improvements. In addition, it will support the DLCC’s pursuit of LEED Existing Buildings Operations & Maintenance (EBOM) certification.
The DLCC building case study summarized here analyzes the DLCC’s green features, performance, and operations with two primary tasks: 1) to review the performance of the DLCC against original LEED‐NC design and construction criteria and future LEED‐ EBOM standards and 2) to benchmark DLCC performance versus original design expectations and similar facilities nationwide (both LEED and non‐LEED certified). Analyses include quantitative and qualitative assessments of the following systems: energy, natural ventilation, water, site, transportation, waste, purchasing, and occupant comfort. Commissioning, internal greening efforts, and existing data collection efforts were also examined. Because the DLCC doesn’t currently have submetering that is adequate to fully understand ongoing performance and utility usage, data from 1 year was taken as a benchmark. Where possible this report attempts to average data over multiple years to avoid anomalies. The full case study supporting materials include detailed information about these analyses of major building systems, a financial analysis of DLCC services and building practices, recommendations for operational and capital improvements, recommendations for ongoing performance data collection, and key information in support of the LEED‐EBOM certification.
As with all green buildings, the DLCC’s story is not just about the building, but also about the people who run and support it every day, continuing to innovate in their green practices.
1 http://www.conventionindustry.org/StandardsPractices/GreenMeetings/APEXASTM.aspx

With
CJL Engineering Carnegie Mellon University Center for Building Performance and Diagnostics Civil and Environmental Consultants
©2011
Building in Operation (BiO) Case Study | David L. Lawrence Convention Center Page 2 November 2011
For By
1.2 The Business Case for Sustainability at DLCC Evidence suggests that a growing percentage of the events, meetings and conventions are seeking more sustainable options for their event venues and cities. While the DLCC has been a national leader in sustainability practices, many other North American convention centers have begun to understand the financial opportunity that greening their facilities offers in terms of additional business. To continue the DLCC’s leadership and to be a premier green event spot, the DLCC should continue to annually analyze the case for sustainability and adjust strategies accordingly.
Findings During investigations into DLCC’s sustainability based marketing, the project team found that:
The US meeting industry supports $106B in GDP and $263B in direct spending2.
VisitPittsburgh has found that 23% of the US meeting industry is looking for green events. This accounts for $24.4B in GDP and $60.5B in direct spending3. Up from 5% in 2004, this represents an annual growth rate of 4.5%, which if continued, would mean that 100% of the market would be demanding “green” events by 2025.
From the beginning of 2006 through the end of 2010, the DLCC has hosted 94 “green‐seeking4” events, accounting for $12,526,013 in revenue (38% of total revenue) and at least $143,823,698 in direct spending (26% of total). Figures 1.2a and 1.2b illustrate these numbers.
Further investments in the DLCC’s greenfirst (g1) Program (defined in Section 7.1 | greenfirst) could yield a modest increase in the number of green‐ seeking events and high associated returns in terms of revenue and direct spending.
Due to increasing client demand for sustainable event locations and metrics, leading centers have developed and are aggressively marketing local “green networks” of hospitality and other service providers.
2 Pricewaterhouse Coopers LLP, The Economic Significance of Meetings to the U.S. Economy. Convention Industry Council. 2 February 2011. Weblink 3 Fulvi, Jason. VisitPittsburgh. Personal Interview. Pittsburgh, 8 November 2010. 4 The term “green seeking” means that the clients specifically asked about DLCC’s green/sustainable initiatives during the sales process. Event planners were not directly asked whether they would have selected the DLCC without its sustainability initiatives.
Figure 1.2a: Total Revenue
Figure 1.2b: Total Direct Spending

With
CJL Engineering Carnegie Mellon University Center for Building Performance and Diagnostics Civil and Environmental Consultants
©2011
Building in Operation (BiO) Case Study | David L. Lawrence Convention Center Page 3 November 2011
For By
Recommendations
Continue to define what constitutes a green event. The DLCC should develop criteria for green events and coordinate tracking with partners for a more detailed tracking system of event impact. It should align efforts with the soon to be released APEX/ASTM Green Events Standards.
Create a Pittsburgh green network of businesses. The DLCC should use the economic metrics to leverage a coordinated effort with regional value chain and hospitality partners to improve performance and track the results of this impact with economic metrics.
Promote the sustainability performance of the DLCC. The DLCC should leverage its high level sustainability performance through regular metric reporting, outreach, and promotion of the Pittsburgh green events support network.
Be transparent with the improvement process. The DLCC should institute annual sustainability reporting to make explicit DLCC’s commitment and the results of ongoing improvement cycles.
Shape the future of the green industry. The DLCC should begin working with trade groups, standard developers and other convention centers that are creating event and facility performance metrics.

With
CJL Engineering Carnegie Mellon University Center for Building Performance and Diagnostics Civil and Environmental Consultants
©2011
Building in Operation (BiO) Case Study | David L. Lawrence Convention Center Page 4 November 2011
For By
2.1 Benchmarking | Internal This analysis reviewed the 2006 Burt Hill Kosar Rittelman Associates (BHKR) energy model5 and compared DLCC’s historical energy performance over the past few years with model predictions. The BHKR energy model provides a comparison between projected, as‐designed DLCC annual utility costs and an ASHRAE6 code – minimum baseline building. DLCC utility bills for years 2008, 2009, and 2010 were then compared to the ASHRAE Standard 90.1 – minimum baseline building in order to estimate the extent to which the DLCC has achieved predicted savings.
Findings The scope for this project included a review of the original CTG energy model7 (2003), the BHKR energy model (2006), and a comparison to DLCC historical energy performance where appropriate. It should be understood that an energy model is a financial tool used to evaluate relative potential energy performance of architectural and engineering system components and approximate estimates of annual utility costs. The original 2003 CTG energy model was based on a full building occupancy profile (i.e. 5 – 7 day/week full occupancy), which is not representative of actual convention center usage. The full occupancy model would overstate energy savings unrealistically, and as a result, it was not considered for this energy evaluation. There was also a version of the 2006 Burt Hill model that incorporated full‐occupancy profiles, which was also not evaluated for this report.
The model that was most relevant for the purposes of this energy evaluation was the BHKR partial occupancy energy model, which incorporated more realistic event/setup/breakdown occupancy schedules. The BHKR partial‐occupancy model was calibrated with 2005/2006 DLCC events and utility bill data in order to improve its representation of the convention center’s projected annual energy performance. The BHKR model projected that DLCC would utilize 16% less annual energy than an ASHRAE Standard 90.1 Appendix G baseline model (based on 240 average events/year utilization).
The results derived from comparing actual DLCC energy records with a Standard ASHRAE 90.1 baseline building model appear reasonable. The results are also consistent with percentage reductions typically achieved for energy efficient projects when compared to ASHRAE baseline models.
Energy usage in the building appears to correlate primarily with the number and types of events and to a lesser degree with the weather.
DLCC staff have worked diligently to improve operating procedures and to address building deficiencies to reduce annual energy usage, such as event operational scripts, central chiller plant operations to compensate for low load conditions, aggressive heating setback programs during non‐event periods, measures to reduce building infiltration, aggressive lighting and daylighting control strategies, and envelope improvements.
The BHKR energy model had assumed an ideal coefficient of performance (COP) for the central chiller plant. The plant was sized to provide chilled water for a convention center headquarters hotel, which has never been constructed. Although the chiller plant is operated as efficiently as possible given the conditions, the plant is not operating at its intended COP. CJL applied a correction for the coefficient of performance to account for actual chiller plant performance during the model’s utility calibration period, April 2005 to March 2006.
DLCC’s actual overall annual energy consumption for 2008, which served 248 events, was 20% better when compared to the BHKR energy model baseline predicted energy usage (the BHKR model predicted a 16% energy savings over the ASHRAE 90.1 baseline and actual performance was 4% better than the model’s prediction
DLCC’s actual overall annual energy consumption for 2008, which served 248 events, was 20% better than the BHKR energy model’s ASHRAE baseline. The actual building was performing better than the BHKR model originally predicted by 4% (model predicted the DLCC would have 16% energy savings). 2009 and 2010 had fewer events due to economic conditions and the impact of the G‐20 meeting, approximately 180 annual
5 Burt Hill Kosar Rittelmann Associates, David L. Lawrence Convention Center Energy Study. 26 July 2006. 6ASHRAE = American Society of Heating, Refrigerating, and Air‐Conditioning Engineers 7 CTG Energetics, Inc, LEED Energy & Atmosphere Credit 1: Optimize Energy Performance Energy Cost Budget Analysis. 23 June 2003, updated 17 September 2003.

With
CJL Engineering Carnegie Mellon University Center for Building Performance and Diagnostics Civil and Environmental Consultants
©2011
Building in Operation (BiO) Case Study | David L. Lawrence Convention Center Page 5 November 2011
For By
events. Since DLCC energy usage varies consistently with the annual number of events, a reduced number of events would result in artificially inflated savings in comparison to the baseline model. When the number of events for 2009 and 2010 are calibrated to match the 248 actual events for 2008, the annual energy savings are consistently over 15% in comparison to the BHKR baseline energy model.
Deviation between the energy model and actual DLCC performance appears due to variations in actual event usage for lights, fans, equipment plug loads, and pumps in comparison to an idealized average usage represented in an energy model. It is particularly difficult to estimate event equipment plug load variations for different event types (since the DLCC has little control over equipment used by exhibitors).
This analysis has concluded that actual DLCC performance is consistent with the BHKR model predicted energy savings results. The DLCC is meeting, if not exceeding, forecasted energy savings when compared to an ASHRAE 90.1‐2001 baseline.
* LFPP – Lights, Fans, Plug Load, Pumps **BHKR Model assumes COP=3. COP corrected to COP=2.16 to match historical plant performance 4/05 to 3/06.
Recommendations Energy usage recommendations are covered in Section 3.1 | Building Performance‐Energy Conservation Measures.
Figure 2.1a: Comparison of DLCC Energy Performance 2008‐2010 Actual and Normalized vs. 2006 BHKR Energy Model** with Corrected Chiller Plant Coefficient of Performance (BTU x 10
6)

With
CJL Engineering Carnegie Mellon University Center for Building Performance and Diagnostics Civil and Environmental Consultants
©2011
Building in Operation (BiO) Case Study | David L. Lawrence Convention Center Page 6 November 2011
For By
2.2 Benchmarking | External Benchmarking analyses are an effective method for understanding how an organization compares to other organizations and what best practices are in a competitive market. The project team has performed in‐depth benchmarking of other convention centers to understand how the DLCC’s green performance compares to its competitors, and to identify areas of competitive advantage and opportunity for improvement.
Findings
The project team has taken a multi‐tiered approach gathering benchmarking information, and has pooled data from 6 cohorts: SMG facilities, targeted competitors of interest, facilities that have shared performance information in EPA’s Portfolio Manager, facilities that participated in the IAVM’s 2010 Sustainability Committee Survey, facilities with industry leading web‐based communications, and the DLCC’s historical performance.
While this case study has made a strong attempt, it is very difficult to fully benchmark the convention center energy use because convention centers have large variance in space types, usage patterns, climate and mechanical systems. Consequently, this case study identified “total BTU/ft2/visitor” as the best measurement for truly comparing convention center energy use.
Energy benchmarking consisted of two routes: (1) a detailed survey to the SMG and targeted competitors of interest, and (2) a comparison to a cohort in ENERGY STAR Portfolio Manager (PM).
o 13 facilities of various size and location partially or fully responded to our benchmarking request. Findings include: the DLCC is performing relatively well in terms of energy usage (0.102 BTU/ ft2/visitor in 2009, which is 28% below the cohort average of 0.141 BTU/ ft2/visitor), but not so well in terms of cost (the DLCC paid $1.44 per ft2 in 2010, which is approximately 29% higher than the ENERGY STAR Portfolio Manager cohort average).
Water benchmarking compared performance among the SMG and targeted competitors of interest. In 2010, the DLCC’s potable water usage per visitor was 5.5 gallons, 75% lower than the cohort 2009 average of 22 gallons per visitor. In 2009, DLCC’s usage was 4.4 gallons per visitor, 80% lower than the cohort average. 2010 cohort data was not available.
Waste benchmarking compared performance among the SMG and targeted competitors of interest. The DLCC is performing very well in terms of waste management compared to its cohort of survey takers.
o DLCC’s 2009 diversion rate was 49%‐ 16 percentage points above cohort average.
o Although 2 of the 13 convention centers had higher diversion rates, evidence suggests that these rates are a result of less reduction at the source. These 2 centers produced 4.7 and 8.3 pounds of waste per visitor, which is significantly higher than the DLCC’s 1.6 pounds per visitor; they also each landfilled almost 1.7 pounds of waste per visitor, more than twice as much as the DLCC’s 0.8 pounds.
Transportation benchmarking compared performance among the SMG and targeted competitors of interest. 45% of respondents had employee alternative transit incentives. The DLCC does not.
Web‐Based Communications benchmarking reviewed facilities with industry leading web‐based communications. It found that high performing convention facilities nurture demand for sustainable options with early engagement, green event menus, and thoroughly developed sustainable service provider networks. o Only 1 facility out of the entire cohort performs carbon measurement and reporting.
Renewable Energy benchmarking reviewed the results of a 2010 survey by the International Association of Venue Managers (IAVM) of 405 event facilities (29% of which were convention centers). It shows that many facilities have renewable energy systems installed: 33% have solar on roofs, 1% have solar hot water, 3% use hydroelectric power, and 4% have wind power8.
8 Mercado, Haylee Uecker, comp. 2010 IAAM Sustainability Committee Survey Results. Rep. IAAM Sustainability &Technology Task Force, 2010. Print

With
CJL Engineering Carnegie Mellon University Center for Building Performance and Diagnostics Civil and Environmental Consultants
©2011
Building in Operation (BiO) Case Study | David L. Lawrence Convention Center Page 7 November 2011
For By
Recommendations
The DLCC should fully market its strengths. These include low water usage, low landfilled waste per visitor, and overall walkability of the facility. Though not discussed previously here, the DLCC also excels at its pursuit of occupant comfort measures, and these should be promoted widely.
The DLCC should also look to improve in areas of weakness. These include: providing employee public transportation incentives, installing renewable energy sources in visible areas, performing in‐depth communications benchmarking to fully understand how the convention center industry is communicating its sustainability efforts to event planners, and working with its local value‐chain to build and market a sustainable network of providers (see report Section 7.1 | greenfirst Review for more information).
With
CJL Engineering Carnegie Mellon University Center for Building Performance and Diagnostics Civil and Environmental Consultants
©2011
Building in Operation (BiO) Case Study | David L. Lawrence Convention Center Page 8 November 2011
For By
3.1 Building Performance | Energy Conservation Measures The energy audit performed as part of this case study process is the first step in developing a “DLCC Energy Master Plan”. The Master Plan allows the SEA to evaluate and prioritize potential Energy Conservation Measures (ECMs), pursue potential funding sources such as Act 129, and schedule potential implementation. Some measures were considered and eliminated during the evaluation phase due to cost, technical complications, or poor return‐on‐investment (ROI). Recommended improvements to the facility are summarized in the energy conservation measures (ECM) table below (Figure 3.1c).
Findings
In general, the DLCC’s building systems were originally designed to be energy efficient and have been diligently operated by DLCC staff to minimize energy usage. The following Energy Conservation Measures primarily reflect the introduction of new more efficient technologies since the original building was constructed, such as LED lighting, as well as retrofits that address wear‐and‐tear after almost 10 years of operation. Because the DLCC doesn’t currently have submetering that is adequate to fully understand the details of ongoing performance and utility usage, data from 1 year was taken as a benchmark. Where possible this report attempts to average data over multiple years to avoid anomalies.
To assess the DLCC’s current performance and possible areas for improvement, the team:
o reviewed monthly energy utility bills for 2008, 2009, and 2010; o attended multiple DLCC events to observe operations; o surveyed and inventoried major building systems; o mapped energy usage by area, including exhibit halls, meeting rooms, ballroom, and parking garage; o used 2009 as a representative year because a greater level of event details were available.
Building systems reviewed included air handling systems; pumps; building automation system (BAS) controls; natural ventilation; chiller plant; steam heating system; interior and exterior lighting; kitchen equipment; conveyance systems; IT/AV systems; blackwater treatment; water feature; and service hot water. In addition, renewable energy opportunities were identified for potential future implementation.
As summarized in Section 2.1, when compared to the calibrated 2005/2006 Burt Hill Kosar Rittelman (BHKR) ASHRAE Standard 90.1 Appendix G baseline energy model9, the DLCC is performing 15%‐20% better10 for years 2008, 2009, and 2010. This percentage of energy efficiency performance is consistent with the performance originally projected by the model (16%).
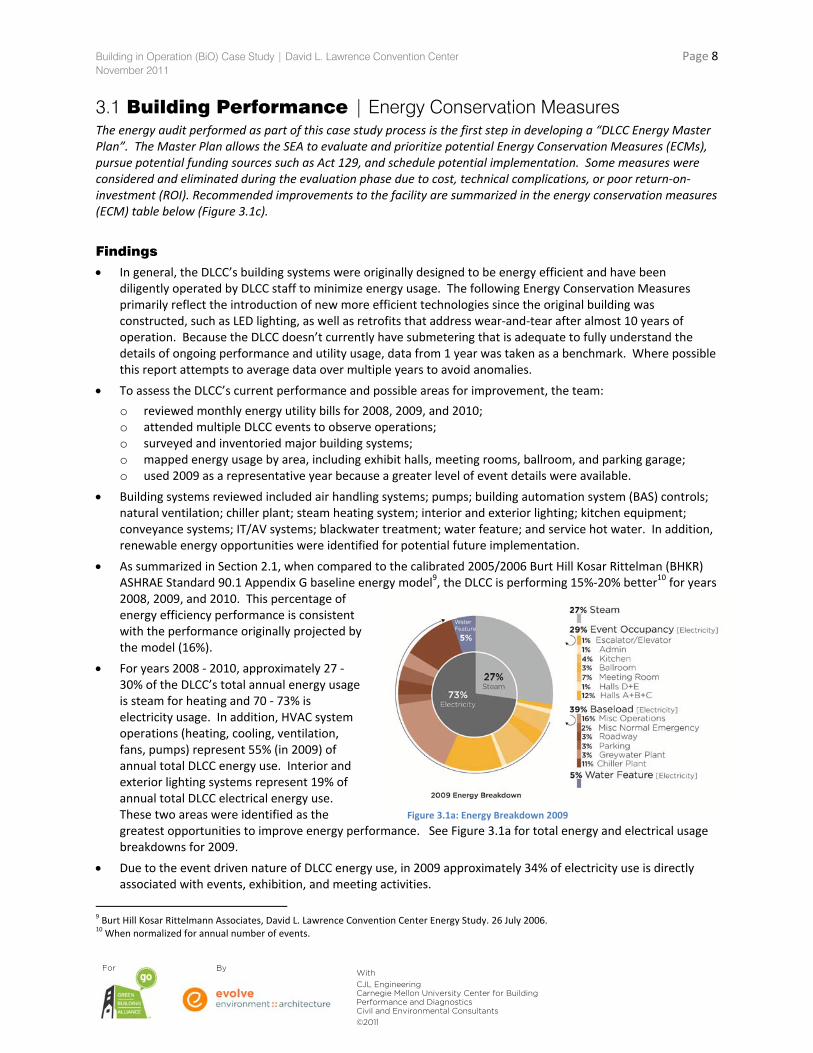
For years 2008 ‐ 2010, approximately 27 ‐ 30% of the DLCC’s total annual energy usage is steam for heating and 70 ‐ 73% is electricity usage. In addition, HVAC system operations (heating, cooling, ventilation, fans, pumps) represent 55% (in 2009) of annual total DLCC energy use. Interior and exterior lighting systems represent 19% of annual total DLCC electrical energy use. These two areas were identified as the greatest opportunities to improve energy performance. See Figure 3.1a for total energy and electrical usage breakdowns for 2009.
Due to the event driven nature of DLCC energy use, in 2009 approximately 34% of electricity use is directly associated with events, exhibition, and meeting activities.
9 Burt Hill Kosar Rittelmann Associates, David L. Lawrence Convention Center Energy Study. 26 July 2006. 10 When normalized for annual number of events.
Figure 3.1a: Energy Breakdown 2009

With
CJL Engineering Carnegie Mellon University Center for Building Performance and Diagnostics Civil and Environmental Consultants
©2011
Building in Operation (BiO) Case Study | David L. Lawrence Convention Center Page 9 November 2011
For By
On average, the DLCC’s annual energy use is equivalent to 0.102 BTU/ft2/visitor/year. Especially in the convention industry, BTU/ ft2/visitor/year is an important measure because it provides a cross‐facility benchmark. As shown in Figure 3.1b, compared to the cohort of 13 facilities surveyed for this analysis, the DLCC is below average in its energy use.
Figure 3.1b: BTU/Square Foot/Visitor/Year for Surveyed Convention Center Cohort
With
CJL Engineering Carnegie Mellon University Center for Building Performance and Diagnostics Civil and Environmental Consultants
©2011
Building in Operation (BiO) Case Study | David L. Lawrence Convention Center Page 10 November 2011
For By
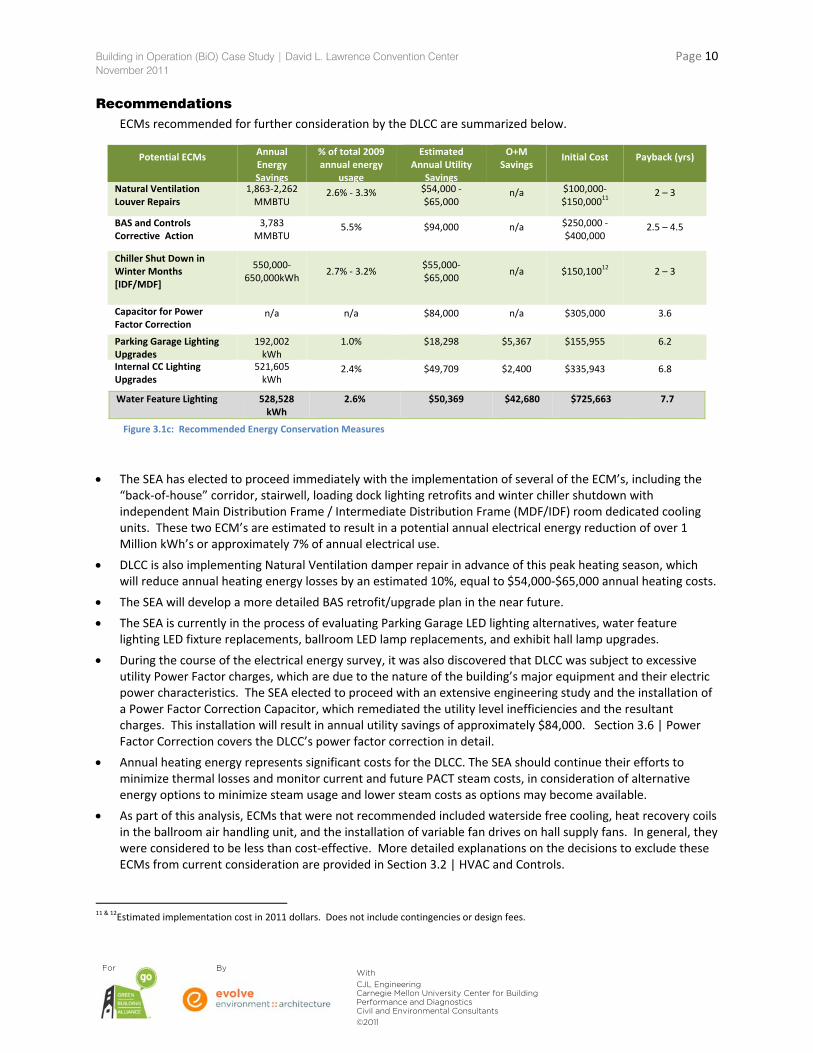
Recommendations ECMs recommended for further consideration by the DLCC are summarized below.
Potential ECMs Annual Energy Savings
% of total 2009 annual energy
usage
Estimated Annual Utility
Savings
O+M Savings
Initial Cost Payback (yrs)
Natural Ventilation Louver Repairs
1,863‐2,262 MMBTU
2.6% ‐ 3.3% $54,000 ‐$65,000
n/a $100,000‐$150,000
11
2 – 3
BAS and Controls Corrective Action
3,783 MMBTU
5.5% $94,000 n/a $250,000 ‐ $400,000
2.5 – 4.5
Chiller Shut Down in Winter Months [IDF/MDF]
550,000‐650,000kWh
2.7% ‐ 3.2% $55,000‐ $65,000
n/a $150,10012 2 – 3
Capacitor for Power Factor Correction
n/a n/a $84,000 n/a $305,000 3.6
Parking Garage Lighting Upgrades
192,002 kWh
1.0% $18,298 $5,367 $155,955 6.2
Internal CC Lighting Upgrades
521,605 kWh
2.4% $49,709 $2,400 $335,943 6.8
Water Feature Lighting 528,528 kWh
2.6% $50,369 $42,680 $725,663 7.7
The SEA has elected to proceed immediately with the implementation of several of the ECM’s, including the “back‐of‐house” corridor, stairwell, loading dock lighting retrofits and winter chiller shutdown with independent Main Distribution Frame / Intermediate Distribution Frame (MDF/IDF) room dedicated cooling units. These two ECM’s are estimated to result in a potential annual electrical energy reduction of over 1 Million kWh’s or approximately 7% of annual electrical use.
DLCC is also implementing Natural Ventilation damper repair in advance of this peak heating season, which will reduce annual heating energy losses by an estimated 10%, equal to $54,000‐$65,000 annual heating costs.
The SEA will develop a more detailed BAS retrofit/upgrade plan in the near future.
The SEA is currently in the process of evaluating Parking Garage LED lighting alternatives, water feature lighting LED fixture replacements, ballroom LED lamp replacements, and exhibit hall lamp upgrades.
During the course of the electrical energy survey, it was also discovered that DLCC was subject to excessive utility Power Factor charges, which are due to the nature of the building’s major equipment and their electric power characteristics. The SEA elected to proceed with an extensive engineering study and the installation of a Power Factor Correction Capacitor, which remediated the utility level inefficiencies and the resultant charges. This installation will result in annual utility savings of approximately $84,000. Section 3.6 | Power Factor Correction covers the DLCC’s power factor correction in detail.
Annual heating energy represents significant costs for the DLCC. The SEA should continue their efforts to minimize thermal losses and monitor current and future PACT steam costs, in consideration of alternative energy options to minimize steam usage and lower steam costs as options may become available.
As part of this analysis, ECMs that were not recommended included waterside free cooling, heat recovery coils in the ballroom air handling unit, and the installation of variable fan drives on hall supply fans. In general, they were considered to be less than cost‐effective. More detailed explanations on the decisions to exclude these ECMs from current consideration are provided in Section 3.2 | HVAC and Controls.
11 & 12
Estimated implementation cost in 2011 dollars. Does not include contingencies or design fees.
Figure 3.1c: Recommended Energy Conservation Measures

With
CJL Engineering Carnegie Mellon University Center for Building Performance and Diagnostics Civil and Environmental Consultants
©2011
Building in Operation (BiO) Case Study | David L. Lawrence Convention Center Page 11 November 2011
For By
3.2 Building Performance | HVAC and Controls The analysis reviewed the DLCC’s existing HVAC systems, Building Automation System (BAS), and system operating procedures to identify potential opportunities to save additional energy, improve thermal performance, and optimize system efficiencies. The team evaluated 2008‐2010 utility bills, records of operating and performance data, and previous energy models to identify patterns of energy use. The team observed the building in use during several events, as well as setup and break down days, in both heating and cooling seasons. Systems evaluated included major air handling units, the BAS and temperature controls, natural ventilation, chiller plant activity, PACT steam usage, and kitchen and service hot water.
Findings
The DLCC’s Energy Utilization Index (BTU/ft2/yr) usage for years 2008‐2010 can be found in Figure 3.2a. For comparison, typical large office buildings can be in the range of 50,000 – 100,000 BTU/ft2/yr.
Because of the unique nature of every convention center event, it is more effective and efficient for the DLCC engineering staff to use the Building Automation System (BAS) in a semi‐automatic/manual mode to operate the building for each event. The DLCC engineering and event management staff create “resumes” for each event, which identify schedules, areas in use (such as ballroom, exhibit halls and meeting rooms, as well as corridors, vertical transport and prefunction/reception areas), lighting and daylighting requirements, power for exhibitor equipment loads, and heating/cooling setpoints.
The DLCC engineering staff use the event resume requirements to set the Indoor Environmental Conditions for each event and then manually/semi‐automatically use the BAS to turn on appropriate systems to meet the Indoor Environmental Conditions. At the same time, the DLCC engineering staff diligently keep HVAC, lighting, kitchen, water feature and transport systems off or to a minimum for areas not in use for an event, during event setup and breakdown days, and during non‐event days to reduce overall energy consumption.
CJL observed that DLCC engineering staff have made numerous efforts, such as placing plastic sheeting over escalator floor openings, to reduce air infiltration through the building, particularly in winter. Based on a CJL recommendation, they also close blackout shades in the winter in an effort to reduce heat losses through roof glazing and to reduce solar cooling loads on warm days.
CJL observed that during setup and breakdown days, loading dock garage doors typically remain open for extended periods as equipment and vehicles move back and forth from the loading dock/utility corridor into exhibit hall areas. This results in significant infiltration of untreated outside air, particularly in the coldest and warmest outdoor conditions.
CJL observed many of the DLCC HVAC systems in operation in order to evaluate existing conditions, control sequences, and performance. It was noted that many controls and damper actuators are out of calibration and alignment, which leads to overall controllability and energy performance inefficiencies.
The original design of the DLCC HVAC systems for areas other than the exhibit halls include low temperature cooling primary supply air and dedicated outside air systems, working in conjunction with Fan Powered VAV boxes or single zone Air Handler Units. Low temperature HVAC systems use lower temperature chilled water than is typically provided for cooling. Since the same cooling effect can be accomplished with less water, pumping energy is reduced. At the same time, HVAC air handling systems can be sized smaller with reduced airflow and smaller ductwork to meet cooling loads, which in turn results in reduced fan energy. The net result is that while the central plant works a little harder to produce colder chilled water, because of pumping and fan energy savings, the overall system uses less energy.
During winter/fall/spring months, when temperatures fall below approximately 40ºF, the Dedicated Outdoor Air HVAC systems can potentially use outdoor air in lieu of central plant chilled water to enable “free cooling”.
Figure 3.2a: DLCC Energy Utilization Index (BTU /ft2/YR)
With
CJL Engineering Carnegie Mellon University Center for Building Performance and Diagnostics Civil and Environmental Consultants
©2011
Building in Operation (BiO) Case Study | David L. Lawrence Convention Center Page 12 November 2011
For By
The central chiller plant was sized in anticipation of the addition of a convention center headquarters hotel, which has not been constructed. Several HVAC systems in the convention center were designed assuming that the chiller plant would be in operation throughout the year because of hotel load requirements. The central plant currently operates 24/7/365 to provide chilled water for relatively small loads in the convention center, in particular the IT/AV equipment loads located in Main Distribution Frame / Intermediate Distribution Frame (MDF/IDF) equipment rooms, which results in significant plant operational and energy inefficiencies.
During non‐event “dark” days, the DLCC engineering staff turn off lights, HVAC systems, escalators, etc. to minimize energy consumption. The space temperatures in unoccupied areas, such as the exhibit halls are allowed to drift up or down. The HVAC systems remain off during exhibit hall event setup and breakdown days, sometimes with discomfort for the exhibitors. The staff will engage the Natural Ventilation system during these periods to provide some cooling and air movement.
The ballroom air handling units have an issue with supply air “short circuiting” to the return air path. On a June 2010 survey the following conditions were observed via the Building Automation System (BAS) colorgraphics: Under normal operations, the return air temperature is equivalent to the room temperature with a few added degrees for the heat of lights, people and equipment. However, in this instance, the return air temperature was at least 12 ºF colder than the room below, indicating that a significant percentage of supply air was going directly to the return air stream without having any impact on the room below. This condition often causes the operators to run the air handling units at exaggerated cooling temperatures in order to provide satisfactory conditions in the space below. Supply diffuser changes to “punch” the air down lower into the space are hampered by the need to avoid drafts and maintain occupant comfort.
The ballroom also presented an opportunity to evaluate heat recovery because of the proximity of the outdoor air and exhaust/relief air ductwork. The four ballroom air handling units share a common outdoor air supply duct and a common exhaust/relief duct. However, the partial occupancy (figured at 1040 hours per year) utilization of the space and increased static pressure concerns and modifications resulted in an unacceptable payback period.
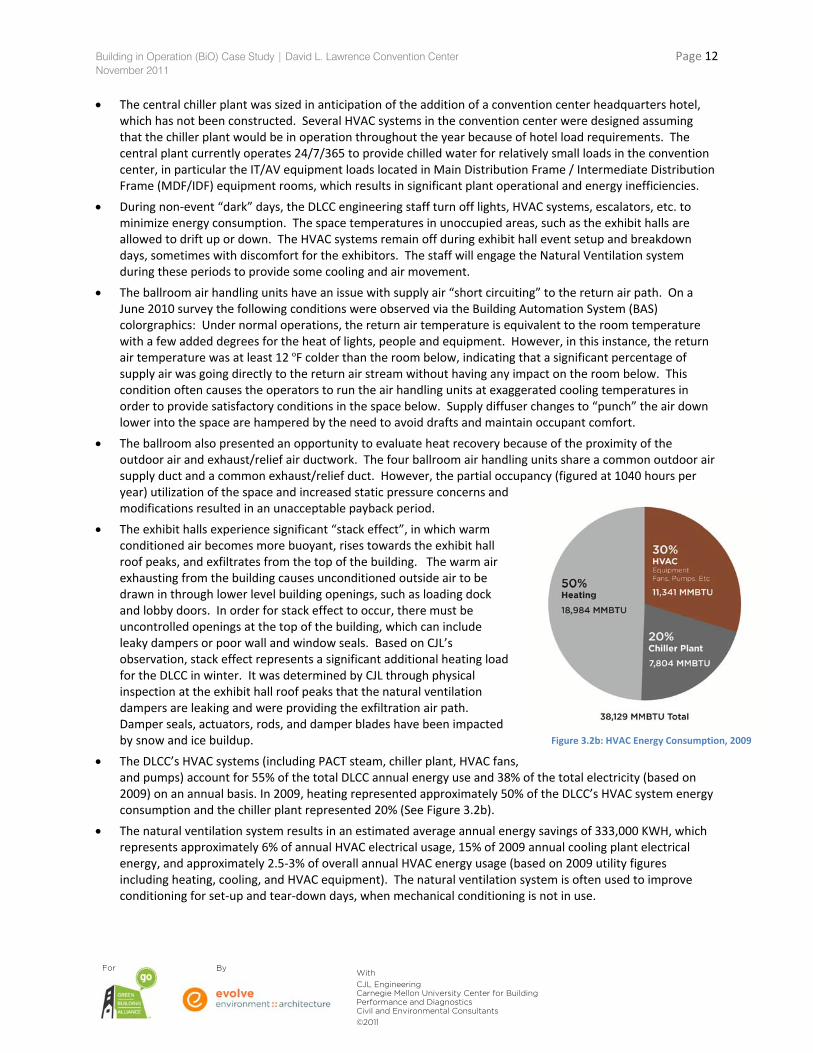
The exhibit halls experience significant “stack effect”, in which warm conditioned air becomes more buoyant, rises towards the exhibit hall roof peaks, and exfiltrates from the top of the building. The warm air exhausting from the building causes unconditioned outside air to be drawn in through lower level building openings, such as loading dock and lobby doors. In order for stack effect to occur, there must be uncontrolled openings at the top of the building, which can include leaky dampers or poor wall and window seals. Based on CJL’s observation, stack effect represents a significant additional heating load for the DLCC in winter. It was determined by CJL through physical inspection at the exhibit hall roof peaks that the natural ventilation dampers are leaking and were providing the exfiltration air path. Damper seals, actuators, rods, and damper blades have been impacted by snow and ice buildup.
The DLCC’s HVAC systems (including PACT steam, chiller plant, HVAC fans, and pumps) account for 55% of the total DLCC annual energy use and 38% of the total electricity (based on 2009) on an annual basis. In 2009, heating represented approximately 50% of the DLCC’s HVAC system energy consumption and the chiller plant represented 20% (See Figure 3.2b).
The natural ventilation system results in an estimated average annual energy savings of 333,000 KWH, which represents approximately 6% of annual HVAC electrical usage, 15% of 2009 annual cooling plant electrical energy, and approximately 2.5‐3% of overall annual HVAC energy usage (based on 2009 utility figures including heating, cooling, and HVAC equipment). The natural ventilation system is often used to improve conditioning for set‐up and tear‐down days, when mechanical conditioning is not in use.
Figure 3.2b: HVAC Energy Consumption, 2009

With
CJL Engineering Carnegie Mellon University Center for Building Performance and Diagnostics Civil and Environmental Consultants
©2011
Building in Operation (BiO) Case Study | David L. Lawrence Convention Center Page 13 November 2011
For By
Recommendations
CJL evaluated multiple winter cooling options, including a small air‐cooled chiller, waterside economizer “free cooling” and individual local cooling units for the MDF/IDF equipment rooms. Based on CJL’s evaluation of winter events and operational requirements, the local cooling units provided the most cost effective solution. DLCC is adding individual cooling units to serve the IT/AV equipment in the MDF/IDF rooms, which will allow for a full chiller plant shut down in the winter months. The shutdown will save the DLCC an estimated 550,000‐650,000 kWh annually, which translates to an average annual cost savings of $55,000‐$65,000. Based on an installed cost of $150,100, this represents approximately a 2‐3 year simple payback. The winter shutdown provides maintenance and operational benefits as well.
The natural ventilation dampers located at the top of the exhibit hall roof should be retrofitted to reduce air leakage and stack effect losses in heating season. Heating energy losses are estimated at $54,000‐$65,000 and 1,863‐2,262 MMBTU per year, which represents approximately 10% of the annual heating energy usage.
Based on CJL field observations, it is recommended that DLCC consider upgrading and retrocommissioning of the BAS system, controls, sensors, meters, actuators, etc., to enable improved building HVAC system control and performance, natural ventilation, heating and chiller plant control. After 10 years of operation, the BAS technology is several generations out of date and the controls are out of calibration and alignment. Additional submetering should be considered to improve DLCC’s ability to break out and track detailed energy usage for lighting, HVAC, exhibit halls, water treatment, etc. This BAS upgrade is estimated to cost in the range of $250,000 to $400,000, depending on the extent of the retrofit. It is estimated that this upgrade could reduce the DLCC’s total energy consumption by 5.5% (or $94,000 annually) for a 2.5 to 4.5 year payback.
Per CJL’s recommendation, the daylighting blackout shades for the exhibit halls are closed during cold weather, particularly at night, to reduce heat losses thru the roof glazing.
DLCC is evaluating high speed garage doors in the exhibit halls from loading dock and utility corridor to reduce heating and cooling losses and stack effect contributions during heating season. DLCC should also evaluate air curtains as a potential alternative, since they would allow traffic through the doors while keeping infiltration to a minimum.
DLCC should evaluate heating season setback temperatures in lieu of exhibit hall system shutdown during non‐event days that occur during the coldest winter days. During extended cold spells, the building mass serves as a cold thermal storage mass, which causes occupant discomfort and may offset energy savings realized by keeping systems off. This approach may maintain more moderate setback temperatures and minimize temperature swings, which will avoid high heating demand spikes to recover the space for events.
DLCC should evaluate “night purge” economizer operations to precool the event halls and meeting rooms during appropriate ambient (cool and dry) conditions. This approach uses the concrete floors as thermal mass storage to precool the event spaces prior to occupancy.

With
CJL Engineering Carnegie Mellon University Center for Building Performance and Diagnostics Civil and Environmental Consultants
©2011
Building in Operation (BiO) Case Study | David L. Lawrence Convention Center Page 14 November 2011
For By
3.3 Building Performance | Lighting In order to quantify the electrical usage of systems and to identify potential energy saving measures, this analysis assessed the DLCC’s existing lighting and lighting controls. To determine the impact of potential retrofits and upgrades, the team compared existing DLCC lighting systems to proposed upgrades in terms of light levels, cost, and energy usage. Many of the proposed upgrades are new technologies that were not available during the original construction.
Findings
In 2009, lighting systems used 26% of annual electricity and 19% of annual total energy (electricity and steam) at the DLCC. Figure 3.3a shows usage by space for the 2009 calendar year. The proportion used by each building area is variable based on the number of events in a given year.
Existing lighting fixtures were inventoried and photometrically accurate lighting models were developed to identify potential improvements to lighting efficiency and performance, and to reduce maintenance.
The analysis evaluated lighting power densities (watts/SF), usage patterns, and potential areas for lamp/fixture replacements.
In order to model and demonstrate proposed light level and quality changes, replacement lamps and fixtures were tested with mockup demonstrations and lighting models.
Existing incentive programs and paybacks were included in feasibility analyses. Generally, the most cost‐effective approach to upgrade DLCC lighting systems (for cost and energy reduction) is lamp replacement with new technologies (i.e., reduced wattage lamps, light emitting diodes (LEDs), etc.).
Recommendations Lighting Recommendations can be found in Figure 3.3b on the next page.
Figure 3.3a: Lighting End‐Use Consumption, 2009

With
CJL Engineering Carnegie Mellon University Center for Building Performance and Diagnostics Civil and Environmental Consultants
©2011
Building in Operation (BiO) Case Study | David L. Lawrence Convention Center page | 15 November 2011
For By
DLCC Lighting System/Location
Lamp or Fixture Replacement?
Initial Cost b Calculated Annual Electricity Savings
Calculated Annual Energy Reduction (kWh)
% Reduction Payback (Years)
e
Payback with Act 129 Credits (Years)
e
Initial Cost Differential
a
Payback of Initial Cost Differential (Years)
a, e
Payback of Initial Cost Differential with Act 129 Credits
a, e (Yrs)
ACT 129 Credit Eligibility
Potential Act 129 Cost Savings
Serving Corridors Lamp $2,990 $2,534 26,589 22% 1.18 0.55 $810 0.32 ** 6¢/kWh $1,595
Prefunction Area ‐ Linear Direct Ceiling Lights
Lamp $5,093 $4,315 45,282 22% 1.18 0.55 $1,379 0.32 ** 6¢/kWh $2,717
Prefunction Area ‐ Wall Washers
Lamp $748 $189 1,982 19% 3.96 3.33 $195 1.03 0.40 6¢/kWh $119
Exhibit Halls A‐C ‐ Downlights
Lamp $810 $176 1,847 21% 4.60 3.97 $216 1.23 0.60 6¢/kWh $111
Exhibit Halls A‐C ‐ Arches
Lamp $32,423 $4,773 50,086 9% 6.79 6.16 $10,544 2.21 1.58 6¢/kWh $3,005
Utility Corridor c Lamp $23,962 $5,499 57,698 58% 4.36 3.37 $23,805 4.33 3.34 $123.00 per
fixture $5,412
Ballroom d Lamp $57,400 $8,896 93,346 71% 5.08 4.59 $45,920 4.07 3.57 6¢/kWh $5,601
Stairwells c Fixture $23,606 $5,161 54,156 37% 4.57 4.09 $22,542 4.37 3.88 $16.50 per
occ sensor $2,508
Loading Dock c Fixture $76,852 $12,545 131,633 52% 6.13 4.66 $76,280 6.08 4.61 $133.50 per
fixture $18,423
Parking Garage Lighting
d
Fixture $155,955 $18,298 192,002 60% 6.19 5.88 $150,335 6.04 5.73 6¢/kWh $11,520
Water Feature Fixture $725,663 $50,369 528,528 86% 7.80 7.46 $714,553 7.68 7.34 6¢/kWh $31,712
Exhibit Halls D & E
Fixture $112,059 $5,621 58,986 64% 19.93 16.82 $111,279 19.80 16.69 $103.00 per fixture
$17,484
Notes: a The initial cost differential indicates the difference in cost between the proposed lighting upgrade and maintenance/relamping costs for the existing lighting. b The initial cost listed is for materials only and does NOT include the cost associated with contractor markup or labor for installation, unless otherwise noted. c The cost associated with contractor markup and labor/installation is included for this proposed upgrade. d Annual savings in operations/maintenance costs are also included in this payback calculation. e The utility rate used for these calculations is $0.0953 per kWh. Refer to supporting materials in full report and Lighting Appendix 2 for payback calculations using varied utility rates.
Figure 3.3b: Lighting Recommendations

With
CJL Engineering Carnegie Mellon University Center for Building Performance and Diagnostics Civil and Environmental Consultants
©2011
Building in Operation (BiO) Case Study | David L. Lawrence Convention Center page | 16 November 2011
For By
3.4 Building Performance | Commissioning Review This analysis compared the DLCC’s current performance to its original LEED design and construction criteria, with special attention to the building’s final commissioning report.13 Several recommendations from the original commissioning report may still be applicable to support current operational improvement efforts and the DLCC’s LEED‐EBOM pursuit.
Findings
As‐built drawings and the commissioning report were reviewed to determine the DLCC’s HVAC system design intent, HVAC scheduled performance, capabilities and capacities of installed systems, and performance issues identified by the initial commissioning effort. The DLCC’s current operation was compared to these documents via on‐site observations.
The DLCC is still experiencing symptoms reflective of issues documented by the final commissioning report.
The DLCC’s building automation system (BAS) is experiencing some operational issues. To overcome BAS software shortcomings, DLCC operators undertake significant manual adjustment.
Additionally, BAS sensor readings have a large number of inconsistency issues, indicating that sensor data used for control decision‐making may not be accurate.
It is likely that in addition to sensor inconsistencies, HVAC system airflows are out of balance.
The DLCC’s signature natural ventilation system reduces annual energy costs, but its dampers at the exhibit hall roof peak have significant leakage issues. The DLCC’s natural ventilation system is discussed in greater detail in Section 3.5.
During low and partial load conditions, the DLCC’s chilled water plant experiences poor kW/ton performance. The engineering staff work around the low load conditions to the extent possible, but the addition of an adjoining convention center headquarters hotel served by the chiller plant would increase efficiencies.
Several DLCC spaces have performance issues unique to the space or installed systems, including air flow and air volume issues, airflow short‐circuiting, reheat capabilities, and parallel signaling to units.
Recommendations Recommendations listed here are similar in scope to Building Automation System (BAS) retrofit and upgrades presented under the HVAC and Controls section.
DLCC’s defective or out‐of‐calibration BAS terminal devices should be repaired or replaced. The devices should have a point‐to‐point checkout and be recommissioned, recalibrated, and rebalanced.
Existing direct digital control (DDC) panels should be reprogrammed to more closely reflect the DLCC’s operational needs.
The DLCC’s existing BAS network level controllers should evaluate potential replacement with new controllers that support web access. The DLCC BAS computer interface should be replaced with a new web‐based colorgraphics package. The improved man‐machine interface would enhance the overall BAS and HVAC systems performance, improve engineering staff operational efficiencies, and improve energy efficiency.
In an effort to continue to improve on the original design intent, reduce energy use, and to provide healthy, comfortable indoor spaces, the DLCC should also consider periodic scheduled recommissioning and rebalancing of HVAC systems and associated controls.
HVAC and BAS retraining sessions should be considered to help refresh the DLCC operations staff regarding design intent and system operational capabilities.
13 “David L. Lawrence Convention Center: Commissioning Final Report”, Burt Hill Project 99010.00, November 2004, Burt Hill Rittelman
Associates.

With
CJL Engineering Carnegie Mellon University Center for Building Performance and Diagnostics Civil and Environmental Consultants
©2011
Building in Operation (BiO) Case Study | David L. Lawrence Convention Center page | 17 November 2011
For By
Lighting and daylight harvesting control systems or upgrades should also be evaluated to determine whether new control technologies would provide enhanced lighting system performance and energy efficiency tracking.

With
CJL Engineering Carnegie Mellon University Center for Building Performance and Diagnostics Civil and Environmental Consultants
©2011
Building in Operation (BiO) Case Study | David L. Lawrence Convention Center page | 18 November 2011
For By
3.5 Building Performance | Natural Ventilation The architectural integration of the DLCC’s natural ventilation system continues to be one of the DLCC’s signature elements. Outdoor air louvers on the river side of the building bring outdoor air directly into the exhibit hall floor levels. Exhaust louvers at the peak of the sloped roof in the exhibit halls enable a natural “chimney effect” to draw air into the halls, which then exhausts at the top of the halls. Natural ventilation is operated by DLCC engineering staff as a semi‐manual process based on their judgment of appropriate outdoor conditions and coincident event schedules. These conditions typically occur in spring and fall seasons when outdoor air can provide cooling without the assistance of the central cooling plant.
Findings The CJL team evaluated DLCC as‐built drawings and the original CTG energy model for the DLCC’s natural
ventilation (NV) system for design intent, intended operation, and estimated savings. Additionally, the natural ventilation system’s operations and equipment conditions were observed during events and a representative sample of NV dampers was examined to determine operational efficacy. Figure 3.5 below illustrates the operations of the NV system.
Figure 3.5a: Natural Ventilation Schematic
While limited sub‐metering did not allow direct measurement of energy savings, CJL reviewed natural ventilation logs kept by DLCC staff, conducted interviews with engineering staff, and observed multiple event operations to develop estimates of natural ventilation use, control strategies, and effectiveness for various event and non‐event periods. Based on CJL’s observations, it is estimated that the NV system is operated between 100 – 225 event hours per year, depending on the coincidence of appropriate outdoor conditions and event schedules. CJL has estimated that 200 event hours represent approximately 333,000 kWh in annual cooling plant and fan system energy savings. This is equivalent to approximately $32,000 in electric utility savings and represents approximately 13% of annual cooling plant energy consumption.
Based on the experience of the staff operating the DLCC HVAC systems over the last few years, it was determined that the natural ventilation system can be operated in a wider band of temperatures than was originally recommended by the design team. The original CTG energy model suggested that natural ventilation could be used effectively when outdoor temperatures were in a range from 48o to 58o Fahrenheit (F). However, DLCC system operators have extended the natural ventilation system operational range from 45o to 64oF. This results in additional cooling plant and fan energy savings. The system is also utilized during event set‐ups and tear‐down to increase the vendor comfort. The event halls are not conditioned during these times because the large access doors between the halls and the loading dock doors are open to the outside conditions.
Anecdotal experience and measured air quality tests indicate that the DLCC’s natural ventilation system also provides indoor air quality benefits in terms of reduced CO2 and volatile organic compounds (VOC) levels in the exhibit halls.
The exhibit halls experience significant “chimney effect” during the heating season, which represents the same thermal principles as natural ventilation, except that it is unintentional. Warm conditioned air in the hall

With
CJL Engineering Carnegie Mellon University Center for Building Performance and Diagnostics Civil and Environmental Consultants
©2011
Building in Operation (BiO) Case Study | David L. Lawrence Convention Center page | 19 November 2011
For By
becomes buoyant, rises towards the exhibit hall roof peaks, and exfiltrates from the top of the building. The warm air exhausting from the building causes unconditioned cold outside air to be drawn in through lower level building openings, such as loading dock and lobby doors. In order for stack effect to occur, there must be uncontrolled openings at the top of the building, which can include leaky dampers or poor wall/window seals. Based on CJL’s observation, stack effect represents a significant additional heating load for the DLCC in winter. It was determined by CJL through physical inspection at the exhibit hall roof peaks that the natural ventilation dampers are leaking and were providing the exfiltration air path.
CJL conducted a field inspection of NV exhaust dampers located at the peak of the exhibit hall roof, together with DLCC engineering and facilities personnel. A significant portion of the natural ventilation dampers that were observed during the inspection (62% of those observed) displayed problems that contribute to air leakage losses ‐ damper seals, actuators, rods, and damper blades have been impacted by snow and ice buildup. Exfiltration of warm air from the leaky exhibit hall roof dampers would cause a “chimney effect”, which would draw unconditioned cold air into the DLCC building through doors, loading dock doors, and other leaky dampers. Increased DLCC steam heating utility costs resulting from damper leakage are estimated to be in a range of approximately $30 ‐ 60,000 annually.
CJL was not able to inspect the NV intake louvers/dampers located on the Fort Duquesne Blvd side of the exhibit halls. They should also be inspected for proper function and potential leakage.
Recommendations
Defective natural ventilation system components and terminal devices should be repaired or replaced in order to reduce steam heating utility losses. Repairs or replacements should be configured and specified so that they are easy to maintain (e.g., easy to access and/or operate well depending on where they are located on the building).
Since many parts of the DLCC’s natural ventilation system need to work in concert to be effective, ongoing preventive maintenance, point‐to‐point checkouts and regularly scheduled recommissioning of the natural ventilation system controls should be considered to ensure ongoing savings from its use.

With
CJL Engineering Carnegie Mellon University Center for Building Performance and Diagnostics Civil and Environmental Consultants
©2011
Building in Operation (BiO) Case Study | David L. Lawrence Convention Center page | 20 November 2011
For By
3.6 Building Performance | Power Factor Correction Power factor represents the efficiency of a building’s power requirements from the utilities’ standpoint. Power factor in a building is not a measure of energy efficiency. Power factor is impacted by the types and combinations of electrical loads from building systems and equipment, including fluorescent lights, large motors (chillers, pumps, fans, escalators, elevators, etc.). It is not unusual for large commercial, institutional and industrial buildings to have low or less efficient power factors.
Findings
In an electric power system, a load with low power factor draws more current than a load with a high power factor for the same amount of useful power transferred (i.e., a loss of efficiency from the utility standpoint). The higher currents increase the energy lost in the distribution system, and require larger wires and other equipment to deliver the same amount of power. Because of the costs of larger equipment and wasted energy, electrical utilities will usually charge a higher cost (Duquesne Light Company calls it a power factor multiplier) to industrial or commercial customers where there is a lower power factor.
During the course of evaluating DLCC energy performance, CJL noted that the DLCC’s utility bills from 2008 through 2010 included monthly power factor multiplier (PFM) charges ranging from 1.16 to 1.45 times demand charges. These fees result in increased annual utility costs to DLCC at an average of $84,000 per year (for 2011 utility rates, $7.53/kW).
The power factor of an electric power system is defined as the ratio of the real power flowing to the load to the apparent power in the circuit. Ideally, the power factor multiplier is 1.0, but it is very common for it to be 1.2 or higher in large commercial and industrial buildings.
Understanding and correcting the power factor for a building of the size and complexity of the DLCC requires rigorous engineering analysis. Power factor analysis and correction is typically not done at the beginning of a building’s operations, because the power factor profile does not become clear until the building begins to operate consistently over several years.
Five (5) field investigations were undertaken from October 2010 through January 2011 to achieve the conclusions detailed in the supporting materials provided in the full report.
The large scale capacity and high voltage of the capacitor made this a fairly unique project, requiring considerable engineering effort on the part of DLCC electricians and staff, Duquesne Light Company, CJL Engineering and the capacitor manufactures to figure out how to integrate the high‐voltage capacitors into the DLCC infrastructure to ensure that the correction benefits would be achieved, while avoiding risks of substantial disruptions to DLCC operations, risk to personnel safety, and potential damage to DLCC electrical infrastructure.
Previously, DLCC had installed a number of smaller capacitors in an effort to address some of the power factor issues.
Recommendations
To correct the power factor penalties, two new high‐voltage, large‐scale capacitors were installed in August of 2011 to eliminate Duquesne Light’s power factor multiplier each month throughout the year. This state‐of‐the‐art technology has been customized to meet the DLCC’s electrical operating characteristics. The capacitors are working to reduce DLCC utility costs, and at the same time, will also improve Duquesne Light Company’s generation efficiencies.
Capacitor installation on the DLCC’s two 4,160 volt electrical lines should result in an average annual utility savings of $84,000/year at 2011 demand rates ($7.530/kW).

With
CJL Engineering Carnegie Mellon University Center for Building Performance and Diagnostics Civil and Environmental Consultants
©2011
Building in Operation (BiO) Case Study | David L. Lawrence Convention Center page | 21 November 2011
For By
3.7 Building Performance | Renewable Energy Renewable energy technologies can potentially generate electrical power for building use, while helping to reduce fossil fuel use and Greenhouse Gas (GHG) emissions. Renewable technologies, in combination with Federal and State incentive programs, are becoming more affordable solutions for reducing energy costs while also reducing building owner/operator risk and future exposure to energy price fluctuations. The team evaluated four potential types of renewables (photovoltaics, solar hot water, wind turbines, and water turbines), including technologies, incentives, site conditions, and appropriate matching of loads and generation capacities.
Findings Multiple renewable technologies were evaluated for energy generation performance, cost, constructability and Return on Investment (ROI).
Photovoltaics (PV)
The DLCC has south‐facing roof exposure for PV installation, but areas appropriate for PVs may be shadowed by adjacent buildings. The flat section of the larger roof area facing Allegheny River, and the balcony viewing area (as a shade provider) provide good potential locations for PV.
The DLCC has a consistent 24/7 base electric load, which means that all of the energy produced by the PVs would be consumed by the building. This enables the most cost‐effective PV system configuration.
Currently PV system costs are at a historic low point, while PV panel energy production efficiencies are improving. Additionally, incentive programs are available to help offset initial PV capital costs.
Solar Hot Water
The DLCC has 22 electric hot water tanks (50 gallon) serving the toilet room clusters located throughout the building. Many of these locations are vertically “stacked” on multiple floors. Toilet rooms serving the administrative offices, Halls A and B, A/B prefunction areas, the ballroom, and adjacent 3rd floor meeting rooms are the most actively used.
Code requires that hot water tanks must maintain minimum water temperatures of 125°F. During periods of non‐use, the insulated tanks cycle on/off to maintain temperatures, as a small percentage of heat is lost through copper piping and tank openings. These standby losses represent a significant portion of the annual service hot water energy usage due to the nature of a convention center’s event driven schedule.
There is a noticeable delay between turning on a hot water faucet and the arrival of hot water, particularly in the beginning of event occupancy. CJL found that this is due to oversized supply piping, which results in a longer delay before the cooler water in the pipe is discharged and warm water reaches the faucet.
The CJL team evaluated the potential of using solar hot water to offset existing service hot water standby losses. The greatest impediments to the use of solar hot water are the scale of the building and the distances between the distributed locations of the hot water tanks. A central solar hot water system would be cost‐prohibitive from the standpoint of storage, piping distribution and controls. Due to the intermittent nature of event schedules, it is estimated that a central solar hot water system could only be sized to handle 15‐20% of the DLCC’s hot water load, which would reduce hot water electricity usage by up to 45,000‐60,000 kWh per year (or approximately $6,000). Capital costs for a system this size would be significant, particularly for piping distribution and controls, representing an extended payback period.
Smaller distributed solar hot water systems located in proximity to their end use, such as a vertically stacked toilet room cluster, should be given further consideration.

With
CJL Engineering Carnegie Mellon University Center for Building Performance and Diagnostics Civil and Environmental Consultants
©2011
Building in Operation (BiO) Case Study | David L. Lawrence Convention Center page | 22 November 2011
For By
Wind Turbines
Pittsburgh wind profiles are variable, with wind velocities that are unfavorable for small scale power generation. However, the DLCC roof area between the exhibit halls acts like a natural canyon, "squeezing” the air through a narrow channel, which increases velocities. This canyon effect could also increase the duration and availability of higher wind velocities, which could provide a strong location for a wind turbine. The flag mastheads should also be considered for a future wind project. Evaluation beyond the scope of this project is required for further pursuit.
Water Turbines
DLCC’s proximity to the Allegheny River provides a potential opportunity for a water turbine, or a water gate (new technology) to generate power from the river’s current. Given the river’s consistent current, a relatively small turbine could develop significant power. However, the distance from the river to the building’s electrical infrastructure in order to connect and use the power would likely result in significant installation costs. Several turbine technologies should be further evaluated.
Recommendations
Photovoltaics (PV)
PV is the most straight‐forward renewable energy option for the DLCC. The building’s consistent base electric load and ample roof space provide a favorable combination for implementation.
Potential locations for PVs include mechanical penthouse rooftops (city‐side) and the river‐side flat portion of the main roof. PVs on the river‐side would gain additional reflected light from the curved roof surface (resulting in a potential power output increase of 10‐20%). PV panels could also serve as shade canopies along the fourth floor river‐side terrace, which would provide a visible renewable energy demonstration for attendees to experience.
Figure 3.7a: Potential Sites for Solar PV
Calculating the savings and ROI of a PV system depends on current and future projected electricity costs, the sale of Solar Alternative Energy Credits (SAECs), and the application of several state and national incentive programs to help offset capital cost. It should be noted that the Federal renewable energy grant program, which would offset up to 30% of the initial system cost, is due to expire at the end of 2011. See the supporting materials within the full report for more information.
The DLCC could potentially take advantage of a third‐party power purchase agreement (PPA) for a PV system. The third party would buy, install, and maintain the PV system and provide a guaranteed power rate per kWh for a 10‐20 year period. The PPA would obtain the tax, SAEC and incentive revenues, as well as the energy

With
CJL Engineering Carnegie Mellon University Center for Building Performance and Diagnostics Civil and Environmental Consultants
©2011
Building in Operation (BiO) Case Study | David L. Lawrence Convention Center page | 23 November 2011
For By
revenues from DLCC to pay back their investment. This approach would eliminate the system’s capital and maintenance costs to the SEA, while providing renewable energy power for the DLCC. However, in transferring the SAECs to the PPA, the DLCC could not claim to be “solar powered.” Instead, they would be considered as “hosting a solar power provider”.
Solar Hot Water
Further investigation is needed to determine feasibility and cost effectiveness for multiple distributed solar hot water systems located to serve individual vertical toilet room stacks. This would avoid significant piping distribution and controls costs and enable systems to be sized more closely to match adjacent loads and usage schedules. Solar hot water for the kitchen and laundry hot water use should also be investigated. Solar hot water is also eligible for Solar Alternative Energy Credits, and many state and federal incentive programs.
Wind and Water Turbines
Further analysis is required to determine the technical feasibility of these technologies. It is recommended that a wind anemometer and trending data logger be located in the gap between the exhibit halls to track wind velocities. Also, it is suggested that a potential collaboration with a water turbine manufacturer might enable a demonstration of this technology.
Water and wind turbines are only recommended as technology demonstration projects for the DLCC due to technology limitations and extended payback periods.

With
CJL Engineering Carnegie Mellon University Center for Building Performance and Diagnostics Civil and Environmental Consultants
©2011
Building in Operation (BiO) Case Study | David L. Lawrence Convention Center page | 24 November 2011
For By
3.8 Building Performance | Water Use Audit The DLCC uses potable, non‐potable and reclaimed water to meet their needs. This analysis included a water use audit in order to understand how efficiently water is used for this facility, in comparison to expectations for a LEED certified facility. The water use audit also provides the opportunity to evaluate economic savings, resource reduction opportunities, and ways to best match water end uses to source quality.
Findings
The DLCC has three water sources (primary uses are listed in parentheses):
o Potable water from Pittsburgh Water and Sewer Authority(PWSA) (domestic uses); o Non‐potable aquifer water from the Wisconsin Glacial Flow aquifer, which flows beneath Pittsburgh (used
for the DLCC’s cooling tower, water feature, and on‐site irrigation); o Blackwater, (i.e. wastewater from toilets, lavatories, mop sinks, kitchen, and laundry) that is processed by
the DLCC’s on‐site treatment plant (reused on‐site for toilet flushing).
The team reviewed as‐built drawings, attendee records, central plant records, kitchen and laundry records, fixture inventories, pump flow meter records, and utility bills to determine reclaimed and potable water flow and usage rates. Logs for the water feature and chiller plant were also reviewed to evaluate aquifer water use.
The DLCC’s service water usage depends on the number and types of events it holds. A number of water conservation strategies were implemented at DLCC, the first and most cost effective of which was the installation of low flow plumbing fixtures. These contribute to a reduced water usage profile and meet LEED‐EBOM 2009 requirements. It should be noted that the latest fixture technologies would offer additional reductions in water usage.
The lack of immediate hot water for hand washing has been identified as an issue at the DLCC. This time lag is due to the DLCC’s oversized hot water piping and the distance between the lavatories and the hot water heaters (see Figure 3.8a). There is no health code violation with respect to the water temperature, only occupant comfort concerns. Unfortunately, there is no quick, easy or inexpensive way to solve the problem.
Figure 3.8a: DLCC's Domestic Hot Water System

With
CJL Engineering Carnegie Mellon University Center for Building Performance and Diagnostics Civil and Environmental Consultants
©2011
Building in Operation (BiO) Case Study | David L. Lawrence Convention Center page | 25 November 2011
For By
The recent application of a filter that allows aquifer water to be used for the Tenth Street Water Feature, has enabled the DLCC to use a non‐potable water source with an appropriate end use. In 2010, use of aquifer water for the DLCC water feature reduced potable water demand by almost 1.5 million gallons.
As an additional green strategy, DLCC uses aquifer water instead of potable water for their central plant cooling tower makeup water, avoiding an estimated range of 3,000,000 – 5,500,000 gallons of potable water demand each year. DLCC absorbs some energy and maintenance costs for pumping, filtration, and chemical treatment to reduce iron content, although there is no utility cost for the aquifer water.
Based on PWSA water utility bills, DLCC has reduced annual potable water demand in the range of 54 ‐77% over the last several years. See Figure 3.8b for annual estimates. By using 100% aquifer water in the water feature, the convention center can potentially reach annual reductions in potable water of 80 – 85%. Reclaimed water represents an estimated 30 ‐ 40% of total DLCC annual water usage.
2008 2009 2010
PWSA Potable Water PWSA Interior Water Use 2,128,000 2,192,000 2,086,000
PWSA Water Feature 5,333,779* 1,176,270 440,410+
PWSA Potable Water Subtotal 7,461,779 3,368,270 2,526,410
Aquifer Water Aquifer Water Feature 0 0 1,455,100+
Aquifer Cooling Tower 3,349,363 3,173,900 3,814,104
Aquifer Water Subtotal 3,349,363 3,173,900 5,269,204
Wastewater Treatment Plant Reclaimed Water
Reclaimed Water Subtotal 5,323,489 4,273,200 3,006,195
TOTAL Gallons Used 16,134,631 10,815,370 10,801,809
Total Potable Water Saved (aquifer+reused wastewater –potable)
8,672,852 7,447,100 8,275,399
Percent of Total 54%* 69% 77%
* A mechanical malfunction resulted in unusually high water usage in the water feature. + Water feature operated partial year on potable water and partial year on aquifer water, moving forward the water feature is
exclusively aquifer water use.
Recommendations
DLCC has optimized water sources and end‐uses within the building to minimize its impact on infrastructure by 70 – 80%. Their highest demand uses, including the cooling towers, toilets and water feature, utilize reclaimed blackwater or non‐potable aquifer water. However, as a showcase for water conservation and stewardship, DLCC may want to consider upgrading some of their plumbing fixtures, including dual flush valves and pressure‐assisted 1 gallon/flush toilets; waterless or ultra‐low (1 pint) flush urinals. Since DLCC recycles their toilet flushing water through the blackwater treatment plant, these technologies would primarily provide a demonstration for new technologies.
There is no low‐cost solution for user complaints regarding the service hot water supply at the event hall lavatories. Potential solutions include replacing existing piping with smaller diameter pipes, installing a hot water recirculation loop, instantaneous heaters, or installing a temperature maintenance heating cable on the existing piping.
Figure 3.8b: DLCC Water Usage

With
CJL Engineering Carnegie Mellon University Center for Building Performance and Diagnostics Civil and Environmental Consultants
©2011
Building in Operation (BiO) Case Study | David L. Lawrence Convention Center page | 26 November 2011
For By
Due to varying event schedules, a significant portion of the energy used to provide hot water is expended as standby losses. However, the hot water tanks cannot be turned down or off because of potential health code violations and public safety. This might represent a potential opportunity for solar hot water panels to provide hot water to offset some or most of the standby losses. A distributed approach for vertically aligned toilet room stacks should be further evaluated.

With
CJL Engineering Carnegie Mellon University Center for Building Performance and Diagnostics Civil and Environmental Consultants
©2011
Building in Operation (BiO) Case Study | David L. Lawrence Convention Center page | 27 November 2011
For By
3.9 Building Performance | Blackwater Treatment System The DLCC’s blackwater treatment plant was designed and constructed to recycle effluent from both the DLCC and a future adjacent hotel. This analysis reviewed the DLCC blackwater treatment plant’s process, capacity, and energy intensity.
Findings
A primary sustainable design measure that was incorporated in the convention center is the on‐site blackwater treatment system (BWTS), which is used to treat the sanitary (toilet, lavatory, kitchen, laundry, floor drains) wastewater generated at the convention center. This wastewater is processed in steps similar to a sewage treatment facility using microbes to breakdown and digest waste materials. Water is then reclaimed through special filtration and ultra‐violet purification, stored in tanks, and then recycled in the convention center building to flush toilets and urinals, thus reducing the amount of potable water the owner must purchase from the Pittsburgh Water and Sewer Authority (PWSA).
The BWTS helps to reduce the sewage loads on the sewer system and Allegheny County Sanitary Authority (ALCOSAN) treatment plant. It also helps to offset Pittsburgh municipal costs by reducing impact on the potable water supply infrastructure. Wastewater and potable water treatment and transport represent significant energy demands at the municipal level. In addition, by treating wastewater on site and through the incorporation of a dedicated stormwater sewer, DLCC avoids contributing to a significant issue in Pittsburgh, Combined Sewer Overflow (CSO). The DLCC is one of the first major buildings in Pittsburgh to address this issue. See Section 3.9 of the report’s supporting materials for more information.
As per the annual BWTS pump meter logs for 2008‐ 2010, the BWTS reduces DLCC potable water demand by 3 – 5.3 million gallons per year, which is equivalent to an average 16 – 23,000 gallons of potable water saved per event. See Figure 3.9a below.
2008 2009 2010
Blackwater Recycled 5,323,489 4,273,200 3,006,195
Number of Events 248 183 (G20) 180
Average Gallons per Event 21,465 23,349 16,701
The project team reviewed BWTS as‐built drawings and the 2010 Wastewater Treatment Plant Condition Assessment Report produced by Apex, a wastewater treatment consultant14. The DLCC’s blackwater plant energy intensity was estimated based on a survey of equipment sizes, nameplate information and water meter data.
It should be understood that an onsite BWTS shifts the energy typically expended by the municipality, as well as operating and maintenance costs, to the DLCC. For 2009, annual energy costs for the BWTS were estimated at approximately $75,000. There are additional maintenance costs, which have not been included for this study. For 2009, the equivalent costs of 4,273,000 gallons of reclaimed water, if purchased from the utility would have been approximately $51,000. However, the reduced loads on ALCOSAN and Pittsburgh infrastructure and the demonstration, education, and research value of water conservation and on‐site treatment are immeasurable.
Additional submetering of DLCC blackwater and reclaimed water could provide better measurement and verification of end use. Recommendations are provided below.
The capacity of the plant is oversized based on current building usage and experiences significant load variations due to the event‐driven schedules of the convention center. The plant was sized to accommodate a
14 ”David L. Lawrence Convention Center Wastewater Treatment Plant Condition Assessment Report.” October, 2010. APEX Companies, LLC.
Figure 3.9a: Blackwater Usage

With
CJL Engineering Carnegie Mellon University Center for Building Performance and Diagnostics Civil and Environmental Consultants
©2011
Building in Operation (BiO) Case Study | David L. Lawrence Convention Center page | 28 November 2011
For By
headquarters hotel as well as DLCC. With the additional 24/7 loads from an adjacent hotel, there would be more consistent waste flows, the treated water in the storage tanks would be “turned over” more frequently, and in general the plant would operate more efficiently. During slow times of the year, the bioreactor stage of the system is currently “fed” sugar water to maintain the populations of waste‐digesting microbes. See Figure 3.9b below for a schematic diagram of the DLCC’s blackwater treatment system.
Recommendations
To better monitor usage of reclaimed water, DLCC should consider the installation of a submeter to track water leaving the storage tanks; this submeter would help track how much reclaimed blackwater water is being reused within the building. Additional tracking of reclaimed water, which does not enter the ALCOSAN sewage treatment plant, provides the opportunity to continue talks with ALCOSAN on sewage fees paid by DLCC.
The electricity necessary to run the blackwater treatment plant is not currently metered. It is recommended that submeters be installed so that the energy intensity of the plant can be tracked.
If an adjacent convention center hotel is built, the wastewater should be tied into the DLCC’s blackwater treatment plant to help the plant become more operationally efficient.
The DLCC should consider best practice recommendations from the 2010 APEX Report and the Managers Monthly Operations Reports by Constellation Energy that include recommendations for regular maintenance and improvements to the filtration process to increase equipment life.
Figure 3.9b: DLCC Blackwater Treatment System Diagram

With
CJL Engineering Carnegie Mellon University Center for Building Performance and Diagnostics Civil and Environmental Consultants
©2011
Building in Operation (BiO) Case Study | David L. Lawrence Convention Center page | 29 November 2011
For By
4.1 Site Performance | Site Review To understand opportunities for improvement and current compliance with LEED‐EBOM, this analysis examined existing green space at the DLCC and associated irrigation systems. LEED‐EBOM encourages pervious open spaces and on‐site rainwater management without additional irrigation.
Findings
As part of this analysis, the DLCC’s existing and proposed planted areas were quantified to determine if the building qualifies for LEED‐EBOM open space credits. With the addition of the new green roof outside Rooms 309 ‐ 322, the DLCC will exceed the desired LEED threshold of 5% open habitat.
o The total DLCC site area is 624,000 ft2, with the existing landscaped area totaling 28,850 ft2, or 4.6% of the total site area.
o The third floor green roof that is currently under construction will add 11,950 ft2 of vegetation, which will increase the total DLCC landscaped area to 40,800 ft2 or 6.5%. This increase puts the project over the desired 5% threshold for LEED‐EBOM Sustainable Sites Credit 5 (SSc5): Site Development –Protect and Restore Open Space.
The DLCC’s irrigation methods for planted areas were evaluated to see if the building qualifies for LEED water efficiency (WE) credits (e.g., WEc3: Water Efficient Landscaping). Including the new green roof, the current design of the DLCC’s irrigation system is estimated to be 53% more efficient than the site‐specific LEED baseline as calculated by Civil and Environmental Consultants, making the DLCC eligible for 1 point under LEED EBOM WEc3.
Due to sanitation concerns and strict permitting requirements by the Pennsylvania Department of Environmental Protection, reuse of treated blackwater for irrigation is not feasible in areas where there is any potential for human contact (even when the water is treated and disinfected, as is done via the DLCC’s on‐site blackwater treatment plant). Thus, in terms of LEED compliance, the DLCC could begin to use captured rainwater in irrigation systems (instead of potable water from the local water utility). Though it will not assist the building’s pursuit of LEED‐EBOM certification, the DLCC already uses aquifer water for irrigation needs; this water source is not recognized by LEED‐EBOM as non‐potable, but reduces water costs and the associated infrastructure demands.
Recommendations
There are two options for the DLCC’s planted area on Eleventh Street that could affect the building’s potential LEED‐EBOM points for irrigation systems:
o If the DLCC were to switch irrigation at the Eleventh Street planting area to drip irrigation, the DLCC’s irrigation efficiency would be 62% (complying with 1 LEED‐EBOM point, which includes the green roof). Given that irrigation is already installed on Eleventh Street, removing infrastructure is cost prohibitive.
o If the DLCC were to eliminate irrigation of the Eleventh Street planting area (it is willing to commit to not using the irrigation to achieve LEED compliance) its irrigation efficiency would be 83% for 3 points, which includes the green roof). To receive LEED credit for SMG’s pledge to only irrigate during drought conditions, a formal policy should be written about procedures that highlights native plantings.
If achievement of points in the LEED‐EBOM system are sought for irrigation reduction, the irrigation and planting design of the green roof will play a significant role in the final calculations. Because the green roof is in a very visible area, eliminating irrigation does not seem to be a viable option. For this reason, the project is using native and adapted plants that require minimal water and using efficient irrigation options. The project team recommends determining if rainwater harvesting is feasible. Ideally, the number of desired LEED‐EBOM water use reduction points will affect the site irrigation design required to meet the desired reduction.

With
CJL Engineering Carnegie Mellon University Center for Building Performance and Diagnostics Civil and Environmental Consultants
©2011
Building in Operation (BiO) Case Study | David L. Lawrence Convention Center page | 30 November 2011
For By
Given the large, sloping roof inherent to the DLCC’s design, there is significant roof area from which to collect rainwater, thus, rainwater harvesting presents a great opportunity. However, storage of collected rainwater would require appropriate locations for storage tanks, pumps, and piping infrastructure. If rainwater harvesting were investigated in the future, such a system would be best implemented with the collection and storage source in close proximity to end use.

With
CJL Engineering Carnegie Mellon University Center for Building Performance and Diagnostics Civil and Environmental Consultants
©2011
Building in Operation (BiO) Case Study | David L. Lawrence Convention Center page | 31 November 2011
For By
5.1 Operations | Waste Review Due to the varied nature of events, convention centers must be prepared to deal with pulsed and voluminous waste streams. As part of this analysis, a waste audit of the DLCC was performed; it entailed a process walk‐through, a pre‐event sort, a mid‐event sort focused on compost, a post‐event analysis, and data trending.
Findings
On‐site audit findings (performed during 3 events in 2010) indicate that of the 27,500 pounds of waste audited at the DLCC, 8,500 pounds were recyclable; 16,000 pounds were compostable; and 3,000 pounds were unrecyclable. Of the unrecyclable waste, 1,500 pounds was carpeting; 1,000 pounds was mixed plastic wrap; and 500 pounds was miscellaneous waste.
Compared to the DLCC’s originally designed waste management process, the DLCC’s current waste management process is substantially different due to many issues (e.g., efficiency upgrades, training, and the dynamic recycling industry).
The DLCC’s waste audit results suggest that diversion rates exceeding 70% are possible, but are a function of labor hours and cost.
The DLCC’s 2010 waste diversion rate was 56%; for 2009, the DLCC’s waste diversion rate was 49%. Compared to other facilities, the DLCC fell behind two other waste reduction leaders, who had 64% and 80% waste diversion rates in 2009. However, compared to its surveyed cohort, the DLCC was much more effective at source reduction (reducing waste before it was made), yielding only 1.6 pounds of waste per visitor (versus 4.7 and 8.3 pounds per visitor, respectively, at the facilities with the higher diversion rates).
The DLCC has an untapped opportunity to recycle 10 to 20 tons of plastic wrap (6 to 12% of its unrecycled materials stream) and 20 to 25 tons of carpet scraps (10 to 15% of its un‐recycled materials stream) annually. Pittsburgh’s local building materials salvager, Construction Junction (CJ) accepts intact rolls of carpet, but not small scraps. Some DLCC show decorators are already donating rolls of carpet to CJ. As a result of this study, the DLCC has also begun directly donating carpet to CJ.
Additionally, the DLCC’s caterer, Levy Restaurants Catering, has been donating cooking oil to be recycled elsewhere. Neither of these diversions are included in the DLCC diversion rate calculated here.
Recommendations The DLCC has the following waste related opportunities, depending on its goals:
Reduced labor costs: Move significantly toward single stream recycling and management approaches for materials other than food and cardboard. This shift would reduce on‐site sorting time, but could have upfront costs, the DLCC would have to locate an acceptable vendor, and it could have an adverse affect on the public perception of the DLCC’s overall sustainability.
Higher Diversion Rates, possible labor cost savings and or possible commodity sale: Move toward additional on‐site sorting and separation of existing waste streams and additional materials identified for sale as commodities such as baled plastic.
Unchanged or lower labor costs/higher diversion rate/possible commodity sale: Maintain but optimize current infrastructure and processes. Focus on increasing value of separated materials by determining if existing relationships with waste processors and/or haulers can be improved from both a performance and financial perspective. Continue to divert additional materials using pilot approaches.
Areas to optimize the current system include:
o Contact local material haulers and processors to understand if existing waste agreements still reflect best practices and economic benefits for both parties. Certain material processors may be willing to pick up baled materials

With
CJL Engineering Carnegie Mellon University Center for Building Performance and Diagnostics Civil and Environmental Consultants
©2011
Building in Operation (BiO) Case Study | David L. Lawrence Convention Center page | 32 November 2011
For By
o To increase efficiency, re‐site existing horizontal baler in central recycling area on first floor loading dock (estimated cost savings are $1,000+ in annual operating cost efficiencies, as well as better overall space utilization); OR, to increase space availability and potentially be able to bale other materials, purchase a vertical multi‐material baler for $12,000 to $20,000.
If the vertical baler option is chosen, sale of the existing horizontal baler could generate $5,000 in revenue, plus $4,000 in annual operating cost savings, and add potential for the sale of additional commodities that the DLCC could bale. It is important to note that any sale of the hauler would need to be discussed with Allegheny County because it was purchased through a grant program.
o If the DLCC plans to bale plastics in the future, it will need to purchase 10 to 15 gaylord bins for temporary storage. The upfront cost for the gaylords is estimated to be $4,000 to $8,000.
o Ensure that all recycled and donated oil, food, and carpet are cataloged as waste diverted from the DLCC’s waste stream.
o Increase the number of events held at the DLCC that are dedicated composting events. The DLCC should only compost when volumes are expected to be sufficient enough to decrease back of house sorting time.
o Update the waste related signage in key waste disposal areas to make waste sorting straightforward for visitors. Consider displays that show the actual materials that go into each bin, and ensure that compostable bins are available for events with high anticipated amounts of food waste. Increased sorting on the front‐end will lead to less back of house sorting.
o If clear compostable bags can be sourced, the DLCC should begin using them to decrease sorting time as well. These bags would have a $500 to $1,000 annual premium.
o Alter the DLCC’s waste management policy to reflect its current processes and review annually.

With
CJL Engineering Carnegie Mellon University Center for Building Performance and Diagnostics Civil and Environmental Consultants
©2011
Building in Operation (BiO) Case Study | David L. Lawrence Convention Center page | 33 November 2011
For By
5.2 Operations | Transportation Review Transportation of employees, exhibitors and attendees to and from a convention center is one of the largest environmental impacts of the facility. Through this analysis, an in‐depth audit of the transportation patterns of DLCC’s stakeholders was undertaken to understand current behavior and opportunities for improvement.
Findings
Two types of transportation patterns were considered, full/part time employee transportation and local/non‐local visitor transportation.
Three (3) employee surveys were conducted to understand the percentage of weekly employee commutes that use alternative transportation. The third survey had 62 full‐time respondents and 68 part‐time respondents for a total of 130 survey takers.
o With part‐timers included, approximately 37% of the employee trips during the week in question used alternative transportation. This level of employee participation in alternative transportation makes the facility eligible for 8 points in the LEED‐EBOM 2009 system.
o With part‐timers excluded, approximately 20% of the employee trips were in the form of alternative transportation, making the facility eligible for 5 points in the LEED‐EBOM 2009 system.
The employee surveys indicated that the irregularity of the DLCC’s schedule and the elimination of and service cuts to local bus routes makes it difficult for full‐timers to regularly ride the bus.
Visitor surveys showed that:
o 39% of all visitors surveyed walked to the DLCC; o 44% of non‐local visitors flew to Pittsburgh and 50% drove; o 51% of flyers took a taxi from the airport to downtown, 23% took a bus, and 22% drove a car; and o 75% of visitors found the public transit options around DLCC to be adequate, while 55% of visitors found
the communication of public transit options to be inadequate.
Recommendations
Transit options for employees and visitors could be improved with a focus on analysis and communication. These DLCC should:
o Facilitate a communication network for ridesharing by listing employees by zip code. o Use demographic data for non local visitors to promote public transit especially for the airport routes. o Provide information about the 28X bus route directly to all event planners so that they can disburse this
information to all event attendees. Information on the 28X “airport flyer” bus route should also be available online at both the DLCC websites and the g1 website.
o Link the DLCC15 and greenfirst16 (DLCC’s sustainability program‐‐see section 7.1 | greenfirst) websites to VisitPittsburgh’s17 website. For visitor convenience, all three (3) websites should link directly to the Port Authority Trip Planner website .
o Include a Port Authority section that provides bus information and maps at the VisitPittsburgh booth that is set up at many events.
o Provide a list of the most common Pittsburgh visitor attractions that includes information regarding the bus routes that service these attractions. This cross‐referenced list should be provided in print either in the DLCC lobby or at the VisitPittsburgh booth, on all 3 websites mentioned above, as well as in a downloadable form online. Similar information should be provided for the most commonly used hotels.
The DLCC has done three employee surveys. If the DLCC decides to include the third survey in the LEED EBOM performance period, then the results can be submitted for LEED. If it is not included in the performance
15SMG Site: http://www.pittsburghcc.com/cc/, SEA Site: http://www.pgh‐sea.com/conventioncenter.htm .
16 g1 Site: http://www.greenfirst.us/index.html.
17VisitPittsburgh Site: http://www.visitpittsburgh.com/.
With
CJL Engineering Carnegie Mellon University Center for Building Performance and Diagnostics Civil and Environmental Consultants
©2011
Building in Operation (BiO) Case Study | David L. Lawrence Convention Center page | 34 November 2011
For By
period, or if SEA would like to pursue better results, it should provide better information and incentives for employees regarding alternative transportation and then re‐survey accordingly.

With
CJL Engineering Carnegie Mellon University Center for Building Performance and Diagnostics Civil and Environmental Consultants
©2011
Building in Operation (BiO) Case Study | David L. Lawrence Convention Center page | 35 November 2011
For By
5.3 Operations | Sustainable Purchasing Policy Purchasing offers an opportunity to improve sustainability performance, support a growing market of sustainable products and services, and provide a very visible example of the DLCC’s sustainability commitment. This analysis has measured the effectiveness of the DLCC’s existing sustainable purchasing policies to identify opportunities for improvement and provide support for the building’s pursuit of LEED‐EBOM certification.
Findings
The analysis of the DLCC’s sustainable purchasing included a visit aimed at reviewing current inventory and two (2) interviews regarding sustainable purchasing procedures used at the DLCC. The resulting data collection reviewed ongoing consumables (office supplies), durable goods, renovation materials, light bulbs, and food.
Food service is a large amount of DLCC’s purchases and is often outside of the direct control of the facility or Levy, the vendor. Its current catering practice is driven by the event clients’ budget, vision and number of visitors, although all disposable dishware, silverware and other food‐related products are compostable.
While the DLCC does make many sustainable purchases for both ongoing consumables (office supplies) and green cleaning materials, no formal sustainable purchasing policy exists.
A formal sustainable purchasing policy for the DLCC should include periodic product review, minimum performance criteria, acceptable cost premiums for switching greener options, a list of existing sustainable products, and a process for specifying green product preferences to vendors.
The recycled content of the DLCC’s office paper alone allows the DLCC to comply with LEED‐EBOM, but further opportunities have been found to enhance compliance and sustainable purchasing commitment. The DLCC should consider purchasing recycled content folders, notepads, and other paper supplies; purchasing remanufactured toner cartridges; and should include g1 purchases in the sustainable purchasing policy, practice, and record keeping.
In terms of compliance with the LEED‐EBOM 2009 rating system, the DLCC stands as follows:
o The DLCC should be able to achieve MRc1: Ongoing Consumables, MRc2 Durable Goods, MRc3 Renovation Materials, and EQc3.3 Green Cleaning Supplies. Purchasing in these areas during the Performance Period will ultimately determine compliance.
o Compliance with MRc4: Light Bulbs will depend on the lighting purchases that result from the case study; however the weighted average of the DLCC’s average mercury content per lumen hour is between 60‐70 picograms, which falls below the 90 picogram per lumen hour threshold.
o MRc5: Food is not likely due to limited purchases that fall within the LEED criteria. o It is necessary to craft and adopt a Sustainable Purchasing Policy to comply with MRp1: Sustainable
Purchasing Policy Prerequisite.
Recommendations
The DLCC should write and institute a formal sustainable purchasing policies that will govern future sustainable purchasing practices at the DLCC. The DLCC should:
o Write improvement opportunities into Administrative, Repair & Maintenance budgets. o Maintain a file of product data sheets for all sustainable purchasing‐compliant materials. o Develop specs for application of Energy Star and green renovation materials. o Coordinate with all purchasing stakeholders (e.g., Levy Restaurants Catering and DLCC operations staff) to
spread awareness of sustainable purchasing compliance opportunities, develop internal DLCC specifications for sustainable purchasing requirements, and share these specifications with vendors before product selection.
Although many of the current purchases meet the LEED thresholds, further opportunities have been identified that may save money and/or increase brand value. Food service should:

With
CJL Engineering Carnegie Mellon University Center for Building Performance and Diagnostics Civil and Environmental Consultants
©2011
Building in Operation (BiO) Case Study | David L. Lawrence Convention Center page | 36 November 2011
For By
o Challenge the broadline food provider and all other suppliers to provide green options that have broad application (fair trade coffee).
o Negotiate lower mark‐ups for sustainable options so premiums are not multiplied. o Use choice editing to make green products a baseline purchase (i.e. coffee, hot dogs). o Add seasonal menu items and market them early in the engagement process.

With
CJL Engineering Carnegie Mellon University Center for Building Performance and Diagnostics Civil and Environmental Consultants
©2011
Building in Operation (BiO) Case Study | David L. Lawrence Convention Center page | 37 November 2011
For By
6.1 User Satisfaction | Thermal, Air Quality, Visual & Acoustic Environments As part of this analysis, quantitative measurements of the DLCC’s thermal, air quality, lighting and acoustic environments were taken. Additional surveying of visitors and staff in the DLCC exhibit halls, ballroom, meeting rooms, and offices was also performed to obtain qualitative user satisfaction data.
Findings
The project team took site measurements during events and compared measured data recorded by the building management systems. The team also surveyed occupants of those spaces to judge satisfaction levels and responses to individual environmental stimuli. Targeted events occurred in warm, cold and swing‐season outdoor temperatures.
Exhibit Hall temperatures were found to be excellent in the summer and fall, but too cold in winter. Air quality as measured by CO2, particulates, total volatile organic compounds (TVOC) and CO were found to be excellent in all seasons with over 90% vendor and visitor satisfaction. Daylight was found to be very effective for high satisfaction and energy savings with electric lights often off during the daytime. Acoustics were found to be adequately managed except for construction noise on the river and high density poster sessions. Overall satisfaction with the indoor environment was found to be 93%. Temperature was found to be the most important environmental characteristic related to vendor effectiveness.
Ballroom temperatures were low during the fall event studied, with 45% of visitors expressing some level of dissatisfaction with temperature. Air quality was found to be excellent with 100% satisfaction. While light levels are low for reading, 96% were satisfied with lighting conditions. 11% were dissatisfied with the presentation visual clarity due to the small screen size compared to the size of the room. Acoustics were found to be very effective, minimizing acoustic distraction and background noise. Satisfaction with the environment was 81%, with the only complaints due to the coldness and overall dark aesthetics.
Meeting Room temperatures met ASHRAE 55‐2004 code requirements during the summer and fall events, though were on the warm side in summer by request, and cooler in the fall, with 80% satisfaction. Meeting rooms met recommended ASHRAE 62.1‐2007 ventilation levels, although a few rooms had high CO2 and fine particulate levels during the Ecological Society of America (ESA) conference when construction was ongoing outside. Light levels in meeting rooms were set by speaker preference, with 93% of the attendees satisfied. However, complaints were stated related to lighting glare on the projection screens. Sound levels in the meeting rooms were found to be low, with over 92% satisfaction. Noise from adjacent pre‐function areas was an issue, as was the loud clicking of the doors. Environmental satisfaction was 100% in river side rooms, and 96% in city‐side rooms.
Office temperatures were too stratified with floor level temperatures below comfort conditions, and large variations between morning and afternoon temperatures. 41% reported dissatisfaction with temperatures, 82% due to too cold conditions. The office ventilation and air quality was found to be excellent. Perimeter offices were found to receive a lot of daylight, with occasional glare that can be managed with blinds. Employees in interior cubicles were found to have higher levels of dissatisfaction with views and daylight. The acoustic environment in the open and closed offices was found to meet code recommendations, however 35% of workers in open stations complained about distraction from conversations. The staff were found to be 94% satisfied with the overall indoor environment and feel that the office is a good place to work.

With
CJL Engineering Carnegie Mellon University Center for Building Performance and Diagnostics Civil and Environmental Consultants
©2011
Building in Operation (BiO) Case Study | David L. Lawrence Convention Center page | 38 November 2011
For By
Recommendations
Exhibit Halls
For the highest occupant satisfaction rates, the DLCC should raise summer temperatures in the Exhibit Halls to the mid‐ to upper 70s, unless event planners request otherwise.
DLCC Exhibit Hall temperatures for the winter should be increased to at least 68oF (which might be easier to achieve at a lower cost after recommended changes to the natural ventilation system are made).
The DLCC should take advantage of the DLCC’s river views, or biophilic advantage (a term coined by E. O. Wilson at Yale to capture man’s love of nature and the importance of ongoing physical connections to nature). With its grand views over the river and the city, the DLCC changes the paradigm for convention centers as links to the city. The DLCC should encourage event planners to use the river side pre‐function spaces for exhibits and poster sessions. Additionally, the DLCC should assign the halls with best views first, starting with Hall A.
Ballroom
In summer, the DLCC should maintain the Ballroom temperature at the mid‐ to high end of comfort levels (75 to 78oF).
For the ballroom and other high occupancy spaces, the DLCC should introduce exhaust heat recovery for warmer temperatures without energy penalty in winter. The CJL team reviewed this option, and found that although it would save significant energy, the capital investment and ROI are cost‐prohibitive.
Especially given the dark nature of the Ballroom, the DLCC should consider brightening the room through modifications in lighting, finishes, or event features when needed.
Given occupant complaints regarding screen size, the DLCC should encourage event planners that select the Ballroom to increase screen size for presentations and/or choose projectors that provide brighter presentations. Guidelines for this space should recommend a screen of adequate size for the scale of the room and the farthest distance of the audience.
The DLCC should increase the visual connection with the daylit prefunction space and provide more access to electric outlets to allow laptop users means to charge their computers.
Meeting Rooms
The DLCC should verify that meeting room default setpoints are at 74oF in the winter and 76 to 77 oF in the summer, and suggest that clients keep the meeting rooms at these temperatures.
To address fine particulate issues in a few of the meeting rooms, replace the filters with the highest compatible MERV (Minimum Efficiency Reporting Value) ratings to filter fine particulates.
To reduce glare on projection screens, the DLCC should consider either resetting lighting options to turn off the row of lights closest to the projector screen in each room or delamping that row of lights. Additionally, if possible, the DLCC should have audio visual contractors raise the screen height to help reduce glare.
Given the biophilic advantage, the DLCC should encourage event planners to use the river side rooms as much as possible.
The DLCC should assign rooms 310‐311 last to avoid noise distraction at the "cross‐roads".
To avoid noise infiltration into meeting rooms from adjacent circulation space, event organizers should be encouraged to position display tables away from meeting rooms.
If possible, the DLCC meeting room doors should be modified to eliminate or reduce the clicking noise upon closing them.

With
CJL Engineering Carnegie Mellon University Center for Building Performance and Diagnostics Civil and Environmental Consultants
©2011
Building in Operation (BiO) Case Study | David L. Lawrence Convention Center page | 39 November 2011
For By
Offices
Given the cold and striated temperatures in the DLCC offices, winter setpoint temperatures should be increased. Radiant heaters should be considered for the coldest offices. Additionally, after the weekend, heating startup should commence earlier.
The DLCC should reduce any incidence of TVOC by more carefully screening products that potentially contain them from being brought into the offices (this is the assumed source, not measured).
To address noise concerns, the DLCC should set office protocols to: avoid conversation in certain areas, relocate coffee/water/printers, eliminate speaker phones, organize circulation aisles to minimize distraction, and situate chairs so workers are not facing each other.

With
CJL Engineering Carnegie Mellon University Center for Building Performance and Diagnostics Civil and Environmental Consultants
©2011
Building in Operation (BiO) Case Study | David L. Lawrence Convention Center page | 40 November 2011
For By
7.1 Sustainable Operating Systems |greenfirst Review greenfirst (g1) is the DLCC’s internal and external sustainability communications and marketing program, whose name originated from the mindset shared by the staff at the DLCC. When making decisions they always think green first. This analysis evaluated g1’s visibility to stakeholders, effectiveness in communicating green initiatives and drawing business, opportunities for improving building and event performance, and the value of green initiatives to the DLCC.
Findings
This analysis took a multi‐pronged approach at evaluating the greenfirst (g1) program, which included: surveying external stakeholders (i.e., visitors, event planners, and exhibitors), interviewing internal stakeholders (i.e., employees and management), reviewing the largest impact areas of a typical event, and reviewing g1‐related marketing materials compared to various DLCC cohorts.
The external survey results indicate the following:
o Visitors participate in green activities while on site. A high percentage of external respondents participate in g1 activities while onsite at the DLCC, but most don’t associate their actions with the g1 program. Awareness of g1 is low among external stakeholders (15% of respondents recognized g1).
o Environmental initiatives attract business. 29% of event planners reported that the DLCC’s LEED‐NC certification positively affected booking decisions; 82% reported marketing of the DLCC’s environmental initiatives positively impacted their decisions; and 62% of event planners identified green operations as important to their event process.
o g1 is effective in guiding DLCC employees’ actions. Most DLCC employees (94%) are aware of the g1 program and are impacted by it at work. Many DLCC employees (67%) follow similar principles at home. The majority of employees (82%) feel that the g1 program is implemented successfully.
Interviews with internal DLCC stakeholders revealed that:
o When events are deciding about whether to choose Pittsburgh as a venue, VisitPittsburgh and SMG work closely in the client engagement process.
o Customer desires often affect the level of sustainability initiatives integrated into an event. o The DLCC operator (SMG) manages g1 marketing and the Sports and Exhibition Authority of Pittsburgh
and Allegheny County (SEA) (which owns the DLCC) owns the g1 trademark. o g1 is part of the larger DLCC marketing strategy and does not have its own strategic plan or budget. Its
funding comes from the larger marketing budget for DLCC. o The largest obstacle to advancing the g1 program as an internal tool and external recognition program is
lack of resources.
A review and benchmarking of the DLCC’s sustainability communications revealed that:
o The DLCC’s sustainability communications are fragmented across its multiple stakeholders. The SEA, SMG, and VisitPittsburgh have decision‐making control over how the DLCC is marketed on both a local and national stage.
o Among convention centers, LEED certification is becoming more prevalent (14 others are certified in the U.S., one‐Vancouver‐has a LEED Platinum rating in the LEED for New Construction rating system).18
o High‐performing convention facilities nurture demand for sustainable options with early engagement, green event menus, and thoroughly developed sustainable service provider networks.
The largest impact areas of an event hosted at the DLCC include the following: transportation, visitor hospitality needs (hotel accommodations and dining out), food and beverage demand, event waste generation, and on‐site energy and water use.
18 U.S. Green Building Council. (2011). LEED Projects and Case Study Directory: Certified Project Directory.
http://www.usgbc.org/LEED/Project/CertifiedProjectList.aspx.

With
CJL Engineering Carnegie Mellon University Center for Building Performance and Diagnostics Civil and Environmental Consultants
©2011
Building in Operation (BiO) Case Study | David L. Lawrence Convention Center page | 41 November 2011
For By
Recommendations
As part of this analysis, it has been determined that the main goals of the DLCC’s g1 program should be formalized as follows: (1) Increase Business and (2) Improve Performance. The evolveEA team has proposed that these two goals can be achieved with two strategic actions: (1) Building sustainability into its value chain, and (2) Formally reporting its sustainability performance. Key DLCC tactical initiatives to support these goals and strategic actions include:
o Develop and implement a strategic plan for the g1 program (a draft is included in the supporting materials section of the report).
o Hire a Sustainability Coordinator to focus on g1 organization, communications, and public relations. o Develop marketing materials that summarize the DLCC’s sustainability initiatives in clear terms (and make
sure this message is used consistently by SEA, SMG, and VisitPittsburgh). o Provide a “Green Event Menu” for event planners that covers all aspects they should consider (and that
the DLCC already addresses) in planning a sustainable event. o Build a local “g1 Service Provider Network.”
Additional personnel and financial resources will help leverage increased business and brand value from the DLCC’s sustainability efforts. A full‐time Sustainability Coordinator position could help develop a service provider network that more broadly leverages the DLCC’S existing and future efforts, making Pittsburgh and the DLCC a more attractive sustainable events venue. It is estimated that the costs to add a DLCC Sustainability Coordinator position could be covered with the attraction of a single additional event per year.
Because customer decisions greatly affect overall building, operational, and event performance, event planners should be engaged in sustainable decision‐making early.

With
CJL Engineering Carnegie Mellon University Center for Building Performance and Diagnostics Civil and Environmental Consultants
©2011
Building in Operation (BiO) Case Study | David L. Lawrence Convention Center page | 42 November 2011
For By
8.1 LEED EBOM Submission | Recommendations The David Lawrence Convention Center (DLCC) is continuing to set the standard for building performance and excellence by pursuing LEED for Operations and Maintenance Existing Buildings (EBOM) Gold Certification. The project team has contributed information that will directly support the achievement of specific credits, and has advised the DLCC team on others.
Findings
LEED certification is becoming popular among leading convention centers, as many are aspiring to meet green building certifications. Although numerous facilities have registered for certification, there are only seven (7) LEED‐EBOM certified convention centers in the world; all are in the U.S. and only 2 of those (Virginia Beach and Los Angeles) achieved LEED‐EBOM Gold. No convention center has achieved LEED Platinum certification in the EBOM rating system, and only 1 has in the LEED for New Construction rating system (Vancouver).
The evolveEA team has met with the DLCC team throughout the case study process to update credit and prerequisite compliance and discuss administrative issues such as when to begin and end the formal “performance period,” how, and when to survey employees, etc.
The DLCC is aspiring for LEED‐EBOM Gold, which requires the achievement of at least 80 LEED points under the 2009 LEED‐EBOM rating system. The range for LEED Gold certification is 60‐79 points.
o The DLCC’s original design strategies contribute to the achievement of 3 prerequisites and 20 points. o The DLCC is currently targeting the achievement of 72 credits and has the potential to achieve another 18
credits for a total of 90 credits pursued.
This project team has been directly involved with the accomplishment of many LEED‐EBOM prerequisite and credit strategies, including, but not limited to:
o SSc4: Alternative Commuter Transportation; o SSc5: Site Development – Protect or Restore Open Habitat; o WEc3 ‐ Water Efficient Landscaping; o EAp1, EAp2, & EAc1: Energy Efficiency Best Management Practices, Minimum Energy Performance, and
Optimize Energy Efficiency Performance; o EAc2.1: Building Commissioning and Investigation; o MRc1, MRc2.1, MRc2.2, MRc3, MRc4, MRc5, & EQc3.3: Sustainable Purchasing; o MRc6: Solid Waste Management ‐ Waste Stream Audit; and, o EQc2.1: Occupant Comfort – Occupant Survey.
The project team is also advising the DLCC on strategies to pursue for other LEED‐EBOM prerequisites and credits. Deliverables of this case study also provide strategic guidance for eventual submittal of DLCC LEED‐EBOM documentation, credit requirements, and credit compliance approaches.
When compared to the cohort of convention centers examined for this analysis (see Section 2.2 on External Benchmarking), the DLCC is a market leader in many operational sustainability categories. The benchmarking process undergone for this study will also serve as further evidence of LEED‐EBOM credit compliance or exemplary performance.
The DLCC has a variety of options for documenting minimum energy performance compliance (EAc1). The recommendation resulting from this analysis is to benchmark the facility on a square foot basis against other cultural/entertainment facilities data provided in ENERGY STAR Portfolio Manager.
o The DLCC has an energy utilization index (EUI) for 2010 of 154; the national EUI average for cultural and entertainment venues is 265. Thus, compared to the ENERGY STAR cultural/entertainment benchmark, the DLCC operates at a 30% better EUI than national median results, making the DLCC eligible for 9 LEED points in the LEED‐EBOM 2009 rating system.

With
CJL Engineering Carnegie Mellon University Center for Building Performance and Diagnostics Civil and Environmental Consultants
©2011
Building in Operation (BiO) Case Study | David L. Lawrence Convention Center page | 43 November 2011
For By
Recommendations
The DLCC needs to finalize its LEED‐EBOM performance period(s) and create a final timeline for application.
For technically complex credits the DLCC is pursuing which have not been fully addressed by this case study (i.e. EQc3: Occupant Comfort ‐ Thermal Comfort Monitoring), the DLCC team needs to better understand the feasibility of credit achievement (e.g., compliance with ASHRAE 62.1‐2007).
The DLCC LEED project manager should:
o Proactively meet with key SEA and SMG personnel to clarify relevant credits and associated requirements for compliance and documentation prior to the start of the performance period(s).
o Be prepared to provide guidance to DLCC internal stakeholders regarding LEED‐EBOM documentation requests.
o Gather and develop documentation required for submittals (including prerequisite policies). o Continue to update key LEED‐EBOM performance metrics summarized as part of this report (e.g., energy
performance, waste management, and sustainable purchasing).

With
CJL Engineering Carnegie Mellon University Center for Building Performance and Diagnostics Civil and Environmental Consultants
©2011
Building in Operation (BiO) Case Study | David L. Lawrence Convention Center page | 44 November 2011
For By
9.1 Ongoing Data Collection | Recommendations Throughout this analysis of the DLCC, several opportunities for improving and continuing current data collection practices were recorded.
Findings
Energy Review found that the DLCC maintains detailed utility logs that track steam, potable water, aquifer water, electricity, and chiller energy consumption. Data collection is not currently available by area or individual systems such as HVAC, lighting, water treatment plant, etc.
Natural Ventilation system usage is tracked manually during event hours. The log includes the time, date, and outside air temperature. The natural ventilation system is used during set‐up and break‐down, for occupant comfort, though those hours are not always tracked.
Building Water and Sewage data collection findings show: o Via 3 PWSA water meters, the DLCC tracks the building’s potable water supply. o The DLCC also has submeters on its aquifer water use, allowing it to track the aquifer water used in the
water feature and the cooling towers separately. o The DLCC tracks the amount of effluent that is moved through the filters in the blackwater treatment
plant.
Waste Review data collection findings show: o The methods used by the DLCC to track the cost of managing and diverting waste and compost have
varied over the years. o The DLCC tracks cost/labor hour information for waste. As of this writing, 2009 data was available, but
2010 data was still being processed. o The DLCC’s current waste diversion rate does not include recycled cooking oil or donated carpet. o The DLCC has tracked the amount of food it donated to local food pantries and food banks since 2009.
Transportation Review data collection findings show: o SMG currently tracks demographic information for upcoming events, but does not track where visitors are
coming from or how they are travelling to and from the DLCC. o The DLCC does not collect information about which local bus routes service the building (or are within a
walkable distance from it).
g1 Review data collection findings show: o SMG currently tracks which events value green practices, but neither SMG nor VisitPittsburgh,
respectively, tracks associated revenue or direct spending from these events separately. o The DLCC does not have a list of sustainable service providers in Downtown Pittsburgh. o The DLCC’s current sustainability best practices tracking is done informally by DLCC executives, but there
is no database where they are formally and regularly tracked. o The DLCC does not track or offset its own carbon emissions or those of its visitors.
Recommendations Energy ongoing data collection recommendations include:
o The DLCC should continue to regularly track its energy sources and uses so that this data can be used for regular internal and external benchmarking.
o The DLCC should consider installing energy system submeters to track energy use at a finer level. o The DLCC should upgrade the existing building automation system (BAS) and its BAS controls. This system
improvement would allow the DLCC to do real‐time data tracking and analysis of energy conservation measures, while also identifying any building operational issues more quickly.

With
CJL Engineering Carnegie Mellon University Center for Building Performance and Diagnostics Civil and Environmental Consultants
©2011
Building in Operation (BiO) Case Study | David L. Lawrence Convention Center page | 45 November 2011
For By
Natural Ventilation ongoing data collection recommendations include: o In addition to the information it currently collects about the natural ventilation system’s operation, the
DLCC should also note the outdoor humidity. Collection of this information will help the DLCC identify whether or not the natural ventilation system could be utilized more frequently. Additionally, the DLCC already collects general event information that could inform natural ventilation decisions including spaces utilized, number of attendees, and male/female breakdown.
o Installing the BAS and control upgrades will allow for real‐time tracking of the natural ventilation system, which will increase its already substantial benefits to the DLCC’s operations.
o Given the unique nature of the natural ventilation system, once the natural ventilation system louvers have been repaired, an annual louver maintenance program should be instituted and any repairs should be tracked to document the pattern of wear and any repetitive maintenance issues.
Water ongoing data collection recommendations include: o The DLCC should continue to regularly track its water use and supply so that this data can be used for
regular internal and external benchmarking. o The DLCC should install a submeter to track the amount of treated blackwater reentering the building.
Currently there is no way to monitor how much of the treated blackwater is being reused within the DLCC.
o If a convention center headquarter hotel is built adjacent to the DLCC in the future, it should tie into the DLCC’s blackwater treatment plant to increase the efficiency.
Waste ongoing data collection recommendation include: o The DLCC should continue to use the waste tracking methods it used in 2009 for future years so that this
data can be used for regular internal and external benchmarking. o The DLCC should include the following diverted wastes in its regularly calculated waste diversion
percentages: Recycled carpet, Recycled cooking oil, and Donated food.
Transportation ongoing data collection recommendations include: o To better understand event transportation needs and satisfaction, the DLCC should collect information
regarding the number and percentage of visitors that will be flying into Pittsburgh for each event. o To better serve visitors transportation needs, the DLCC should collect, regularly update, and be proactive
about providing event planners and visitors with information about the 28X “Airport Flyer” and other local bus routes that service the building (or are within a walkable distance from it).
g1 ongoing data collection recommendations include: o The DLCC should track a variety of data points about green seeking events, including:
The number and size of events that pursue green practices. What specific green offerings event planners request and use. Whether or not events they would have selected the DLCC as their venue if the DLCC did not
have green practices, was not LEED certified, etc. o As covered in Section 7.1 | greenfirst, the DLCC should collect information on and promote local
sustainable service providers. o The DLCC should regularly perform benchmarking of how its green practices compare to industry best
practices in sustainability. This will involve determining the best standards for measurement and verification of its environmental performance. This will evolve as the industry progresses.
o The DLCC should consider adopting a system that allows for disparate metrics to be compared such as waste and energy, and to take part in larger climate efforts, such as the City of Pittsburgh’s climate action plan. The metric that is most widely accepted is carbon. The DLCC should calculate and manage its carbon footprint using an accepted carbon accounting methodology like the World Resources Institute (WRI) GHG Protocol Corporate Standard.

With
CJL Engineering Carnegie Mellon University Center for Building Performance and Diagnostics Civil and Environmental Consultants
©2011
Building in Operation (BiO) Case Study | David L. Lawrence Convention Center page | 46 November 2011
For By
10.1 Conclusion As sustainability has become a marketing point for event destinations and convention centers across the country, green buildings have become a mainstay for these institutions, serving as tactile representations of each destination’s commitment to sustainability. This is an inspiring trend, especially now that more events are demanding sustainable venues, but too often these projects are focused on meeting certain rating system thresholds (i.e. LEED) and implementing the most advanced sustainable design systems possible without understanding the full business case for doing them or how to sustain the performance of these systems in the long run. After all, this is where the true sustainable value of a green building is realized.
The visionary leadership exhibited by Heinz Endowments and Sports and Exhibition Authority of Pittsburgh and Allegheny County has led these organizations to the realization that there is extreme value in understanding this important information. As a result, they have funded this analysis of the DLCC’s green features, performance, and operations, past, present, and future to capitalize on the original, long‐term, and ongoing support of the Convention Center operation. In addition to studying the DLCC’s compliance with LEED for Existing Buildings Operations and Maintenance, this analysis has dug deeper to understand key building characteristics and the full business case for pursuing sustainable culture, operations, building systems, and marketing for the DLCC. The findings show that this case was initially strong, and continues to be so for current and recommended investments.
Performing a study of this magnitude illustrates the DLCC’s progressive nature, which was first evident upon its completion in 2003, when it received LEED NC Gold Certification, and was the world’s largest green building. Given the DLCC’s “first‐mover” status in the convention industry, its leadership has played a significant role in pushing the rest of the convention market forward to its current point of green event demand. As a result, the number of LEED certified event facilities nationally are easily in the double digits and over 20% of events are seeking green facilities.
This type of study is not common, and in addition to being a marketing opportunity in and of itself, it positions the DLCC for even greater operational success, cost savings, and future business. It also places the DLCC in a unique position to use the knowledge it has gained through this process for the greater good of the convention industry, and the communities in which the industry operates. This is NOT just a case study of a single‐building, but can serve as a demonstration for other projects about how to systematically approach similar evaluations of high performance buildings, and gain multiple types of organizational value. Sharing this process and the results that it has produced will only further its legacy as a sustainability leader.