case study competition 2012 mobile radio testers … · case study competition 2012 mobile radio...
TRANSCRIPT

-
Case Study Competition 2012 Mobile Radio Testers
Station: Data transfer in mobile networks
The success of smartphones and Internet
services in general has increased the
need for high-performance data transfer
over mobile networks.
At this station you will investigate how the
two radio access network standards,
WCDMA and LTE, perform while
transferring data.
Cas
e S
tudy
Com
petit
ion
201
2
6/9/
2012
11:
08:0
0 A
M
1.0

Case Study Competition Final 2012
Responsible
Braun/1CM9
State
Draft
Version
1
Page
2 of 7
1 Introduction The launch of the Global System for Mobile Communications (GSM) standard in the 1990s was
the beginning of digital mobile communications. GSM has been optimized to support voice
communications that were already handled by landline voice connections, e.g. ISDN.
The emerging success of the Internet in general and its services such as social media, in
combination with the success of smartphones, has increased the demand for high-performance
mobile data connections.
The first release of the WCDMA standard supports up to 386 kbit/s, and its extension HSPA
supports impressive data rates of up to 42 Mbit/s.
Long Term Evolution (LTE), the successor standard to GSM, offers, besides data rates above
100 Mbit/s, even more:
- All IP network
- Scalable bandwidth
- High spectral efficiency
Along with the availability of higher data rates, the demand for shorter round-trip times, as well as
lower jitter for packet data transmission has increased. A typical mobile data session rarely
exhibits single large downloads, but has a highly interactive character, where both high bandwidth
as well as low latency play an important role.
In the developmental and evolutionary path from GSM toward LTE, the two key user experience
parameters, bandwidth and latency, have changed dramatically, and now provide the instant-on
feeling of a wired connection in a mobile environment.
Alongside the measurement of modulation quality and transmitted power, increasingly the
importance of higher-layer measurements has risen, for example, to reliably and repeatably check
the TCP/IP performance of a mobile device. Therefore, a modern mobile radio tester also needs to
support this type of measurement, and provide access to these measurements in a single box.
The following exercise will use the built-in functionality of a state-of-the-art mobile radio tester to
compare the user-experienced performance of two different radio access technologies.
CMW500
Radio Communication Tester
LTE
WCDMA
or
IP connection IMS VoIP client IMS VoIP server
Fig. 1: User experience test setup.

Case Study Competition Final 2012
Responsible
Braun/1CM9
State
Draft
Version
1
Page
3 of 7
R&S CMW500 application Purpose
WCDMA Signaling
Controls and configures the WCDMA base
station simulation.
Press Tasks button,
then WCDMA Signaling:
LTE Signaling
Controls and configures the LTE base station
simulation.
Press Tasks button,
then LTE Signaling:
Data Application Measurement
Supports IP-based measurements such as
Throughput, IP logging and Ping.
Furthermore, it can be used to impair the IP
communications between the UE and the
R&S CMW500 server.
Press Tasks button,
then Data 1 Meas:

Case Study Competition Final 2012
Responsible
Braun/1CM9
State
Draft
Version
1
Page
4 of 7
Data Application Control
Controls and configures the R&S CMW500
IP servers and services, such as the IMS
VoIP server.
Go to Data Application Measurements
(shown on preceding page),
then press Configure Services:
ON/OFF button
Starts or stops a network simulation, a server
or a measurement.
Wireshark
Captures and decodes e.g. IP traffic and
shows the messages and content.
www.wireshark.org
In Data Meas 1, the tool can be started from
the IP logging tab.
On the laptop, it can be started from the
Desktop.
Mercuro IMS VoIP Client
IMS VoIP client for Windows operating
systems.
To set up a VoIP call, type e.g. 123 as phone
number:
123

Case Study Competition Final 2012
Responsible
Braun/1CM9
State
Draft
Version
1
Page
5 of 7
2 Abbreviations 3GPP Third Generation Partnership Project
DL Downlink (signal from base station to mobile station)
DUT Device under test (see UE)
IMS IP multimedia subsystem
IP Internet protocol
LTE Long Term Evolution (3.9G, 4G)
MAC Medium access control
OS Operating system
PDCP Packet data convergence protocol
PDU Protocol data unit
RAT Radio access technology
RF Radio frequency
RTP Realtime transport protocol
TX Transmission
UDP User datagram protocol
UE User equipment (mobile phone, data dongle, smartphone, terminal, device under test)
UL Uplink (signal from mobile station to base station)
UMTS Universal Mobile Telecommunications Service (3G)
USB Universal serial bus
VoIP Voice over Internet protocol
VoLTE Voice over LTE
WAN Wide area network
WCDMA Wideband Code Division Multiple Access (see UMTS)

Case Study Competition Final 2012
Responsible
Braun/1CM9
State
Draft
Version
1
Page
6 of 7
3 Exercise The improvements in the data transport domain of mobile networks is not only important for increased data throughput, it also provides the performance to achieve an adequate user experience for multimedia services such as voice. The aim of this exercise is to compare the user experience of a voice session over IP connections based on WCDMA and LTE. The test setup in Fig. 1 shows the R&S CMW500 in combination with a PC and a WCDMA and LTE capable data card (USB stick). Hint: Take screenshots of your measurement results
using the Print button on the left of the R&S CMW front panel.
a. VoIP loopback connection over a WCDMA network simulation
1. Start a WCDMA network simulation on the R&S CMW500 by pressing the ON/OFF button. 2. Start the IP logging functionality and the throughput measurement on the R&S CMW500
by pressing the ON/OFF button. 3. Plug-in the USB stick to a USB port of the laptop and wait till an IP connection has been
established. 4. Start the IP logging functionality on the VoIP client (laptop) by starting Wireshark and
selecting the correct network interface. 5. Verify the IP connectivity and the RTT of this IP connection. 6. Start the Mercuro VoIP client on the laptop and press the Connect button. 7. Dial any number (e.g. 123) and establish a VoIP connection. 8. Verify that a VoIP session has been established. Is the delay audible? 9. Hang up the VoIP call and close the Mercuro VoIP client. 10. Stop the IP logging on the R&S CMW500 and the laptop.
b. VoIP loopback connection over LTE connection
1. Start an LTE cell simulation on the R&S CMW500 by pressing the ON/OFF button. 2. Repeat steps 2 to 10 from measurement a.
a. Bonus: To simulate an IP connection over a GSM/GPRS connection, try to use the network impairment functionality. A GSM network has an RTT of ~800 ms.
Exercise App-1: Compare the IP logs from the R&S CMW and the laptop: How long does a packet need for the transmission in WCDMA and LTE? Exercise App-2: What is the interval of the VoIP audio packets sent by the Mercuro VoIP client? Exercise App-3: At what data rate does the VoIP client send the audio stream? Exercise App-4: Name three key measures that contributed to the latency reduction in LTE compared with older radio access technologies.

Case Study Competition Final 2012
Responsible
Braun/1CM9
State
Draft
Version
1
Page
7 of 7
4 Feedback
Rohde & Schwarz GmbH & Co. KG
Mobile Radio Testers
www.rohde-schwarz.com

-
Case Study Competition 2012 Mobile Radio Testers
Station: LTE physical layer
Configuration of LTE parameters that
influence data throughput
Cas
e S
tudy
Com
petit
ion
201
2
6/11
/201
2 10
:49:
00 A
M
1.0
Case Study Competition Final 2012
Responsible
Braun/1CM9
State
Draft
Version
1
Page
2 of 8
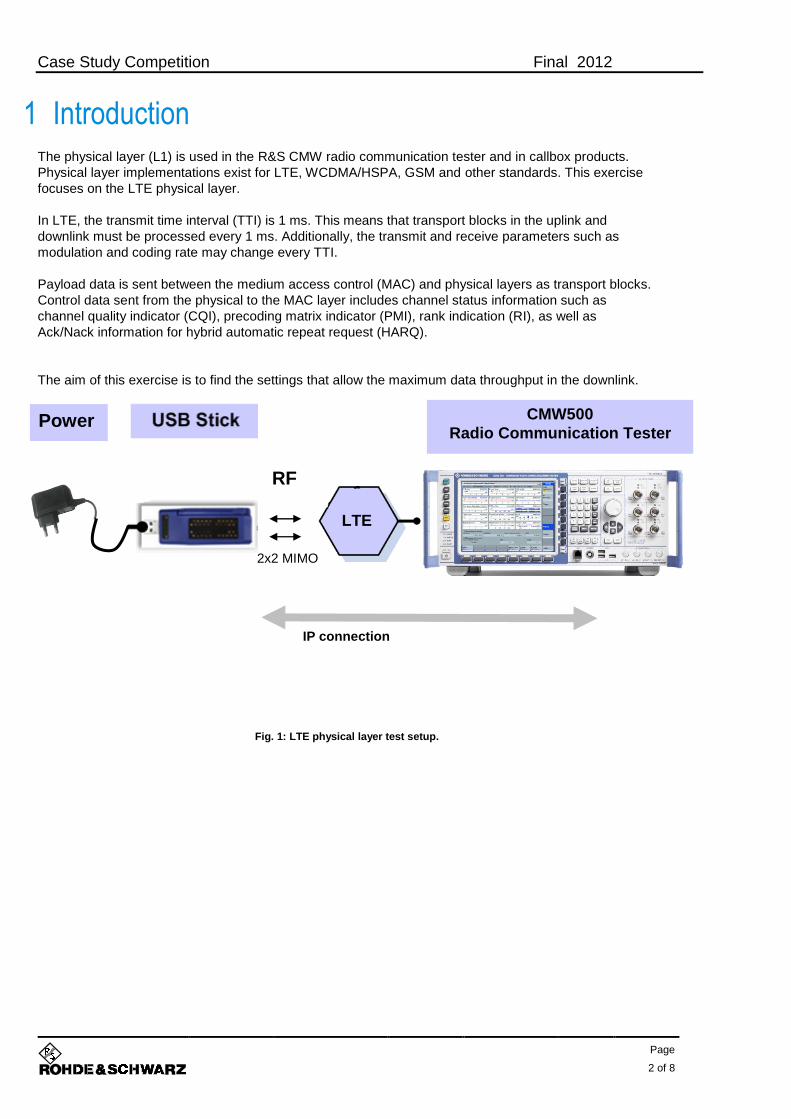
1 Introduction The physical layer (L1) is used in the R&S CMW radio communication tester and in callbox products.
Physical layer implementations exist for LTE, WCDMA/HSPA, GSM and other standards. This exercise
focuses on the LTE physical layer.
In LTE, the transmit time interval (TTI) is 1 ms. This means that transport blocks in the uplink and
downlink must be processed every 1 ms. Additionally, the transmit and receive parameters such as
modulation and coding rate may change every TTI.
Payload data is sent between the medium access control (MAC) and physical layers as transport blocks.
Control data sent from the physical to the MAC layer includes channel status information such as
channel quality indicator (CQI), precoding matrix indicator (PMI), rank indication (RI), as well as
Ack/Nack information for hybrid automatic repeat request (HARQ).
The aim of this exercise is to find the settings that allow the maximum data throughput in the downlink.
Fig. 1: LTE physical layer test setup.
CMW500
Radio Communication Tester
LTE
IP connection
Power
RF
2x2 MIMO
Case Study Competition Final 2012
Responsible
Braun/1CM9
State
Draft
Version
1
Page
3 of 8
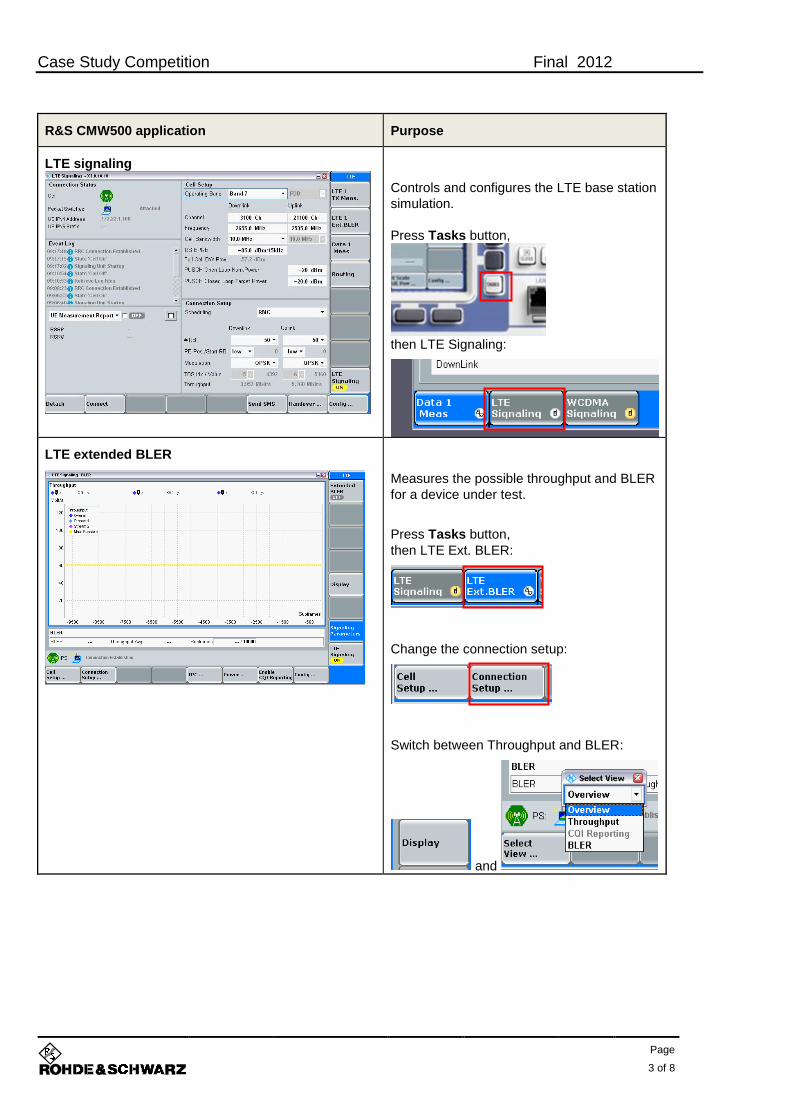
R&S CMW500 application Purpose
LTE signaling
Controls and configures the LTE base station
simulation.
Press Tasks button,
then LTE Signaling:
LTE extended BLER
Measures the possible throughput and BLER
for a device under test.
Press Tasks button,
then LTE Ext. BLER:
Change the connection setup:
Switch between Throughput and BLER:
and

Case Study Competition Final 2012
Responsible
Braun/1CM9
State
Draft
Version
1
Page
4 of 8
2 Abbreviations
3GPP Third Generation Partnership Project
ADC Analog/digital converter
AWGN Additive white Gaussian noise BLER Block error rate CQI Channel quality indicator
DL Downlink (signal from base station to mobile station)
DUT Device under test (see UE)
HARQ Hybrid automatic repeat request
LTE Long Term Evolution (3.9G, 4G)
MAC Medium access control
MIMO Multiple input multiple output
PHY Physical
RAT Radio access technology
RF Radio frequency
SNR Signal-to-noise ratio
SS System simulator (network simulator, R&S CMW500, LTE protocol test equipment)
TBS Transport block size
TX Transmission
UE User equipment (mobile phone, data dongle, smartphone, terminal, device under test)
UL Uplink (signal from mobile station to base station)

Case Study Competition Final 2012
Responsible
Braun/1CM9
State
Draft
Version
1
Page
5 of 8
3 Exercise
3.1 Description
The R&S CMW500 radio communication tester simulates an LTE base station. As soon as the UE is
powered up, it searches for an LTE cell and, if found, will register and attach to it.
In this exercise the R&S CMW500 simulates a special LTE cell in a configuration called Testmode. This
Testmode is meant to measure the performance of the UE on the PHY and MAC layers, by sending
generated data to the UE and verifying if this data has been correctly received.
The Testmode does not support a real IP connection. Therefore, no laptop behind the UE is required.
In the test setup, two antennas of the UE are connected to the R&S CMW, in order to allow a MIMO 2x2
connection with transmission mode 4 (closed loop spatial multiplexing).
The R&S CMW generates a downlink signal for each of the two antennas with a power of –85 dBm per
subcarrier.
To simulate a real-world scenario, AWGN is generated in the R&S CMW and added to the signal. The
SNR is fixed during the exercise (+15 dB).
Fig. 2: LTE signal – power and noise level.
The R&S CMW sends two transport blocks of data in every subframe (1 ms). The UE tries to decode the
transport blocks and checks the decoding success with a cyclic redundancy check. If the decoding is
successful, the UE will send an Ack per transport block to the R&S CMW. If the decoding fails, it will
send a Nack.
The “Extended BLER” measurement measures the throughput and BLER over a user-defined period
(here set to 10000 subframes = 10 s).

Case Study Competition Final 2012
Responsible
Braun/1CM9
State
Draft
Version
1
Page
6 of 8
The transport block size for the two MIMO streams depends on the modulation and on the transport
block size index (TBS Idx). Fig. 3 shows the transport block size and overall theoretical throughput
(circled in red) displayed on the R&S CMW.
Fig. 3: LTE connection setup – theoretical throughput.

Case Study Competition Final 2012
Responsible
Braun/1CM9
State
Draft
Version
1
Page
7 of 8
3.2 Exercise
Hint: Take screenshots of your measurement results
using the Print button on the left of the R&S CMW front panel.
1. Connect the UE to the active RF connectors on the R&S CMW. The UE will start searching for
an LTE network and attach to it as soon as it has been connected to the USB power adapter.
2. Start a data connection (“Connect” button). All 100 resource blocks of the cell should be used in
this exercise.
a. Go to the “Extended BLER” measurement and measure the BLER and throughput for
different DL data rates.
b. Start with TBS Index = 5 and QPSK and increase the TBS and modulation. Note the
BLER and average throughput for each step. They are circled in red in the screenshot.
c. Restart the measurement after every change of the transport block size.
d. Make a screenshot of the BLER measurement with the highest throughput.
Fig. 4: Throughput and BLER measurement.
Exercise PHY-1: Draw diagrams for BLER vs. transport block size and throughput vs. transport
block size and present them to the jury. Explain your findings.

Case Study Competition Final 2012
Responsible
Braun/1CM9
State
Draft
Version
1
Page
8 of 8
4 Feedback
Rohde & Schwarz GmbH & Co. KG
Mobile Radio Testers
www.rohde-schwarz.com

-
Case Study Competition 2012 Mobile Radio Testers
Station: Protocol testing
LTE / WCDMA handover and data
throughput measurements
Cas
e S
tudy
Com
petit
ion
201
2
6/6/
2012
11:
12:0
0 A
M
1.0

Case Study Competition Final 2012
Responsible
Braun/1CM9
State
Draft
Version
1
Page
2 of 7
1 Introduction In this hands-on lab test you will use the R&S CMW500 radio communication tester to perform
data throughput measurements using an LTE / WCDMA USB data stick.
Firstly, you will measure the real end-to-end throughput that can be achieved in an
WCDMA network on IP level by downloading a file from an FTP server and compare the
results with the maximum data rate in the LTE network.
Secondly, you will perform two different types of LTE / WCDMA mobility procedures and
analyze their impact on a real end-to-end data connection.
The above tests will be performed with the R&S CMW500 radio communication tester and a
selection of R&S CMW500 applications.
Test setup
The following figure shows the test setup at this station:
Laptop USB Stick CMW500 Protocol Tester
LTE
WCDMA
FTP Client
RF
RF
USB
FTP ServerIP connection
Hand
over
Test procedure
The R&S CMW500 radio communication tester creates two independent cells, one for LTE and
the other for WCDMA. The device under test is a USB data stick that is controlled by a laptop
and connected to the R&S CMW500 with an RF cable. The R&S CMW500 hosts an FTP server
that acts as a data source, whereas the FTP client resides on the laptop.
The following applications are provided to control the R&S CMW500,in order to measure the
data throughput and to analyze signaling procedures between the device under test and the
R&S CMW500. All applications run on the Windows PC integrated in the R&S CMW500.

Case Study Competition Final 2012
Responsible
Braun/1CM9
State
Draft
Version
1
Page
3 of 7
R&S CMW500 application Purpose
Project Explorer (PE)
Controls and configures
R&S CMW500 radio
communication tester
- Start test script to setup LTE
and WCDMA cell
- Perform handover between
LTE and WCDMA
Protocol Testing Monitor (PTM)
Measures data throughput in
LTE and WCDMA network in
different protocol states

Case Study Competition Final 2012
Responsible
Braun/1CM9
State
Draft
Version
1
Page
4 of 7
Message Analyzer (MA)
Analyzes signaling procedures during handover
To open a message log in Message Analyzer, right-click on a test case result in the "Test Project Results" tab of Project Explorer and select "Open message log”:
Taking screenshots
Screenshots can be taken by
pressing the PrintScreen key.
The screen contents are
stored in the clipboard and
can be pasted to paint.
Case Study Competition Final 2012
Responsible
Braun/1CM9
State
Draft
Version
1
Page
5 of 7
2 Exercise
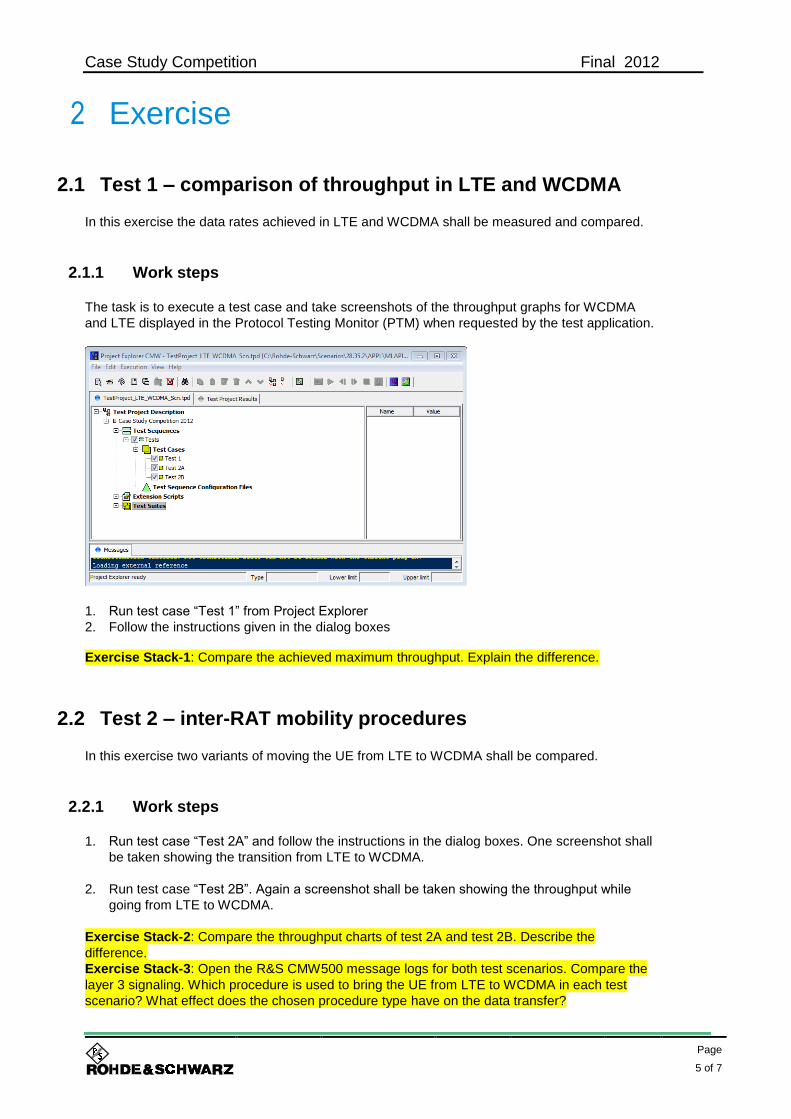
2.1 Test 1 – comparison of throughput in LTE and WCDMA
In this exercise the data rates achieved in LTE and WCDMA shall be measured and compared.
2.1.1 Work steps
The task is to execute a test case and take screenshots of the throughput graphs for WCDMA
and LTE displayed in the Protocol Testing Monitor (PTM) when requested by the test application.
1. Run test case “Test 1” from Project Explorer
2. Follow the instructions given in the dialog boxes Exercise Stack-1: Compare the achieved maximum throughput. Explain the difference.
2.2 Test 2 – inter-RAT mobility procedures
In this exercise two variants of moving the UE from LTE to WCDMA shall be compared.
2.2.1 Work steps
1. Run test case “Test 2A” and follow the instructions in the dialog boxes. One screenshot shall
be taken showing the transition from LTE to WCDMA.
2. Run test case “Test 2B”. Again a screenshot shall be taken showing the throughput while
going from LTE to WCDMA.
Exercise Stack-2: Compare the throughput charts of test 2A and test 2B. Describe the
difference.
Exercise Stack-3: Open the R&S CMW500 message logs for both test scenarios. Compare the
layer 3 signaling. Which procedure is used to bring the UE from LTE to WCDMA in each test
scenario? What effect does the chosen procedure type have on the data transfer?

Case Study Competition Final 2012
Responsible
Braun/1CM9
State
Draft
Version
1
Page
6 of 7
MMI command dialogs
Perform the requested action first and then confirm e.g. the “Please switch on the UE”
command by clicking the Send button.

Case Study Competition Final 2012
Responsible
Braun/1CM9
State
Draft
Version
1
Page
7 of 7
3 Feedback
Rohde & Schwarz GmbH & Co. KG
Mobile Radio Testers
www.rohde-schwarz.com

-
Case Study Competition 2012 Mobile Radio Testers
Station: Signals in the air
Measure the signals between base
stations and mobile stations
Cas
e S
tudy
Com
petit
ion
201
2
6/14
/201
2 10
:18:
00 A
M
0.1

Case Study Competition Final 2012
Responsible
Braun/1CM9
State
Draft
Version
1
Page
2 of 4
1 Introduction
Our world is full of radio signals. A mobile phone communicates with a base station, the entry gate to the
core mobile network. A spectrum analyzer in combination with an antenna can be used to analyze the
RF signals and determine whether communications function as expected.

Case Study Competition Final 2012
Responsible
Braun/1CM9
State
Draft
Version
1
Page
3 of 4
2 Exercise
2.1 Test setup
Required equipment: - R&S FSH8 spectrum analyzer - Antenna
The following measurements should be performed inside the building for the available Rohde & Schwarz WLAN. For mobile phone signals, they should be performed outside the building. Connect the antenna to the spectrum analyzer (SA) and switch on the SA. Press the green PRESET button on the SA.
2.2 Test procedure
1) Find which signals are available in the air. Search especially for WLAN signals. Measure the frequencies, power levels, bandwidths. What does the spectrum look like? What is the time domain? Measure whether the signals are continuous or burst. What duration do burst signal have? 2) Please classify the signal. To which networks do they belong? WLAN IEEE 802.11x? Others? Uplink/downlink? 3) Please present your results.

Case Study Competition Final 2012
Responsible
Braun/1CM9
State
Draft
Version
1
Page
4 of 4
3 Feedback
Rohde & Schwarz GmbH & Co. KG
Mobile Radio Testers
www.rohde-schwarz.com

-
Case Study Competition 2012 Mobile Radio Testers
Mobile channel and MISO systems
Understand and exploit the properties of
mobile radio channels
Cas
e S
tudy
Com
petit
ion
201
2
6/14
/201
2 10
:20:
00 A
M
0.1

Case Study Competition Final 2012
Responsible
Braun/1CM9
State
Draft
Version
1
Page
2 of 12
1 Introduction Due to effects such as multipath propagation and shadowing, the mobile channel imposes severe
constraints on communications receivers. In this exercise you will study the properties of mobile
channels and analyze a transmission scheme that is designed to exploit such channels.

Case Study Competition Final 2012
Responsible
Braun/1CM9
State
Draft
Version
1
Page
3 of 12
2 Exercise
Mobile channel
Time dispersion
The mobile channel at a given time instant can be modeled as a finite impulse response (FIR) filter, h(t).
Tx Rx
h(t)x(t) y(t)
Fig. 1: Time dispersion in mobile channels.
Assume that signal x(t) is transmitted at transmitter antenna Tx. If there is no noise and no other interfering signals, signal y(t) received at receiver antenna Rx is given as linear convolution of x(t) and h(t):
d)t(h)(x)t(h)t(x)t(y
In Fig. 2 a typical channel h(t), transmitted signal x(t) (three symbols) and received signal y(t) are visualized.
y(t)
t
t
h(t)
1
x(t)
symbol 1 symbol 2
t
symbol 3
Tsymb
Reception Window
Tsymb
Taps
Fig. 2: Typical transmission scenario for mobile channel.

Case Study Competition Final 2012
Responsible
Braun/1CM9
State
Draft
Version
1
Page
4 of 12
The received signal y(t) consists of several scaled and delayed versions of the transmitted signal x(t) (tapped delay line model). As can be observed, it is not possible to choose a reception window (duration = Tsymb = 1 symbol period) such that e.g. symbol 2 can be received without interference from either symbol 1 or symbol 2 or even both. This interference is called intersymbol interference (ISI). In order to overcome that problem, a cyclic prefix (CP) can be added to the signal. This means that the end of the symbol is repeated at its beginning (see Fig. 3).
Tsymb TsymbTcp
Fig. 3: Cyclic prefix is added. In Fig. 4 you can observe that by introducing a CP, it is possible to synchronize the receiver (find a reception window) such that ISI is avoided.
symbol 1 symbol 2
Tsymb
x(t)
Tcp
symbol 3
t
h(t)
1
Reception Window
Tsymb
t
t
Fig. 4: Typical transmission scenario for mobile channel. Consider the following channel impulse response with four channel taps:
Fig. 5: Channel impulse response.

Case Study Competition Final 2012
Responsible
Braun/1CM9
State
Draft
Version
1
Page
5 of 12
Exercise 2-1: (2 points)
What is the relationship between Tcp and max that has to be maintained in order to avoid ISI?
Consider an LTE (Long Term Evolution, state-of-the-art mobile communications standard) symbol given in Fig. 6
x(t)
t
Tcp
4,69 us
Tsymb
66,67 us
Fig. 6: LTE symbol.
and the channel models defined in the LTE test specification (Table 1 through Table 3). These tables define the tap delays and attenuations.
Excess tap delay [ns]
Relative power [dB]
0 0.0
30 –1.0
70 –2.0
90 –3.0
110 –8.0
190 –17.2
410 –20.8
Table 1: Extended pedestrian A (EPA) model.
Excess tap delay
[ns] Relative power
[dB]
0 0.0
30 –1.5
150 –1.4
310 –3.6
370 –0.6
710 –9.1
1090 –7.0
1730 –12.0
2510 –16.9
Table 2: Extended vehicular A (EVA) model.

Case Study Competition Final 2012
Responsible
Braun/1CM9
State
Draft
Version
1
Page
6 of 12
Excess tap delay [ns]
Relative power [dB]
0 –1.0
50 –1.0
120 –1.0
200 0.0
230 0.0
500 0.0
1600 –3.0
2300 –5.0
5000 –7.0
Table 3: Extended typical urban (ETU) model.
Exercise 2-2: (2 points)
Given these channels, is it possible to receive an LTE signal (see Fig. 6) without ISI? Why?

Case Study Competition Final 2012
Responsible
Braun/1CM9
State
Draft
Version
1
Page
7 of 12
Frequency dispersion
Now consider the channel model in Fig. 7:
max
])[(h 2
1
Fig. 7: Channel model.
The Rayleigh fading model assumes that each of the four taps can be considered as a complex random process, where real and imaginary parts are independent, zero mean Gaussian distributed random
variables with a variance of 2
2
.
)t(ib)t(a)t(h , 2
,0N)t(b),t(a , max321 ,,,0
The power spectrum of each tap can be modeled by the well known Clarke’s model:
d
d2
d
dh
ff,0
ff,
f
f1f)f(S
where fd is the maximum Doppler frequency. An important parameter of a random process is its coherence time Tc. Tc is a measure of how fast the random process varies in time.
Assuming that )t(h is a wide sense stationary (WSS) process for each , the correlation between
)t(h 1 and )t(h 2 only depends on the time difference 12 ttt :
2t
)t(hE
)tt(h)t(hE
where E{} denotes the expected value.
The X% coherence time Tc is defined as that value of t such that
100
Xt

Case Study Competition Final 2012
Responsible
Braun/1CM9
State
Draft
Version
1
Page
8 of 12
The coherence time of )t(h is closely related to the maximum Doppler frequency. Assuming Clarke’s
model, the 50% coherence time is given as
d
cf16
9T
In order to reliably demodulate a signal received from a mobile phone (UE), a base station (BS) needs an accurate estimate of the channel impulse response. Consider the LTE uplink (transmitted from UE) subframe in Fig. 8:
symb0 symb1 symb2 DMRS symb4 symb5 symb6 symb0 symb1 symb2 symb4 symb5 symb6DMRS
slot0 (500us) slot1 (500us)
subframe (1ms)
Fig. 8: LTE subframe (uplink).
In the middle of each slot the demodulation reference signal (DMRS) is transmitted from the UE. The DMRS is a signal sequence that is known from the BS. The BS can therefore determine a channel estimate from the DMRS.
Exercise 2-3: (4 points)
What is the maximum Doppler frequency that can be supported in the LTE uplink? Why? (Assume that a random process can be regarded constant during Tc.)
Exercise 2-4: (4 points)
Assume that the UE transmits at a carrier frequency fc = 1.92 GHz. What is the maximum velocity allowed for the UE such that the BS can reliably demodulate its signal?
MISO systems
One of the main problems introduced by a mobile channel are the power fluctuations of the received signal. Consider the non-frequency-selective (only one tap) fading channel in Fig. 9:
n(i)
y(i)d(i)
h
rd(i)
Fig. 9: Non-frequency-selective fading channel.
Case Study Competition Final 2012
Responsible
Braun/1CM9
State
Draft
Version
1
Page
9 of 12
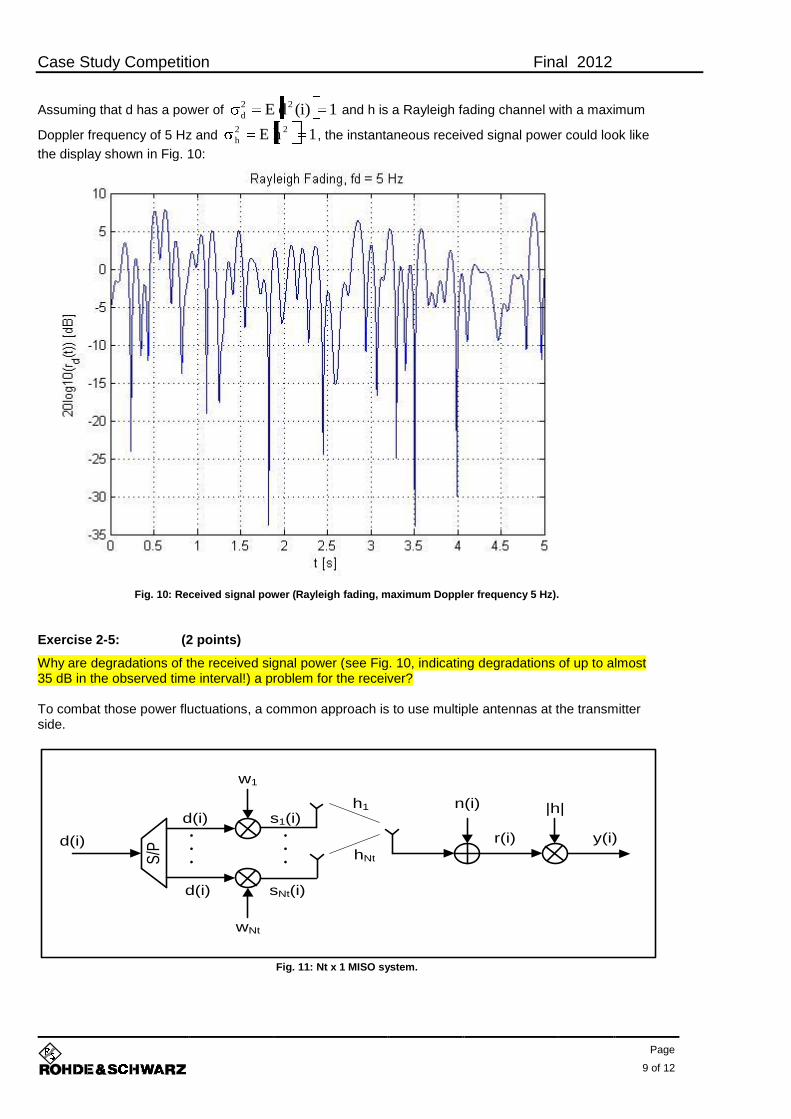
Assuming that d has a power of 1)i(dE 22
d and h is a Rayleigh fading channel with a maximum
Doppler frequency of 5 Hz and 1hE 22
h , the instantaneous received signal power could look like
the display shown in Fig. 10:
Fig. 10: Received signal power (Rayleigh fading, maximum Doppler frequency 5 Hz).
Exercise 2-5: (2 points)
Why are degradations of the received signal power (see Fig. 10, indicating degradations of up to almost 35 dB in the observed time interval!) a problem for the receiver? To combat those power fluctuations, a common approach is to use multiple antennas at the transmitter side.
S/P
d(i)
d(i)
d(i)
w1
wNt
h1
hNt
s1(i)
sNt(i)
n(i)
r(i) y(i)
|h|
Fig. 11: Nt x 1 MISO system.

Case Study Competition Final 2012
Responsible
Braun/1CM9
State
Draft
Version
1
Page
10 of 12
It can be shown that the weight vector w = T
Nt1 w,,w has to be chosen as h
hw
* , where
h = T
Nt1 h,,h in order to maximize the signal-to-noise ratio (SNR) at the receiver.
After renormalizing with h at the receiver, we have:
y(i) = h ( hTs(i) + n(i) ) =
Nt
1v
2
vh)i(d + h n(i)
Exercise 2-6: (2 points)
Give an expression for y(i) for the transmission scheme in Fig. 9.
Exercise 2-7: (5 points)
Define SNR’ = )i(nE
)i(dE2
2
. In addition, define SNR(y) =
N
S
P
P , where PS is the signal power in y(i) and PN
is the noise power in y(i). Express SNR(y) in terms of SNR’ and h for the transmission schemes in Fig. 9
and Fig. 11. Assume that h
hw
*.
Exercise 2-8: (5 points)
Under what conditions on hv for v = 1,…,Nt is the transmission scheme in Fig. 11 advantageous as compared with the transmission scheme in Fig. 9? Why? Explain what the term transmit diversity could mean in this respect. Now consider the transmission scheme with two transmit antennas given in Fig. 12:
S/P
d(i’)
d1
d2
h1
h2
s1(i)
s2(i)
n(i)
Co
de
r
d1
d2
-d2*
d1*
2
1
2
1
S/P
De
co
de
r
*
r1
r2*y(i)
r(i)
2i 2i+1
Fig. 12: 2x1 transmission scheme.
Here we define d = )1'i2(d
)'i2(d
d
d
2
1 and n =
)1i2(n
)i2(n
n
n
2
1.
Exercise 2-9: (3 points)
Derive expressions for r1 = r(2i) and r2 = r(2i+1).

Case Study Competition Final 2012
Responsible
Braun/1CM9
State
Draft
Version
1
Page
11 of 12
Exercise 2-10: (3 points)
Define r =
2
1
r
r. r can be expressed as: r = Hd + n. Determine H.
Exercise 2-11: (3 points)
Assume that the decoder in Fig. 12 performs a matrix multiplication according to y = H
Hr. Compute y in terms of d and n.
Exercise 2-12: (3 points)
Assume that the power )i(dE 22
D = 1 in both Fig. 11 and Fig. 12 and h
hw
*.
Compute the total transmitted power for the transmission schemes in Fig. 11 and Fig. 12, P1 and P2 respectively.
Exercise 2-13: (4 points)
Compare the expressions for y and y(i) derived in exercises 2-11 and 2-6. What is the drawback of the transmission scheme in Fig. 12 as compared with the transmission scheme in Fig. 11 in terms of SNR?
Exercise 2-14: (4 points)
What is the advantage of the transmission scheme in Fig. 12 as compared with the one in Fig. 11?

Case Study Competition Final 2012
Responsible
Braun/1CM9
State
Draft
Version
1
Page
12 of 12
3 Feedback
Rohde & Schwarz GmbH & Co. KG
Mobile Radio Testers
www.rohde-schwarz.com