case studies on waste minimisation practices in …commercial waste 2 hazardous waste 2 paper 2...
TRANSCRIPT

1
Case studies on wasteminimisation practices in Europe
Prepared by:Henrik Jacobsen and Merete Kristoffersen
European Topic Centre on Waste
Project manager:Dimitrios Tsotsos
European Environment Agency
Topic report 2/2002

2 Case studies on waste minimisation practices in Europe
Layout: Brandenborg a/s
Legal notice
The contents of this report do not necessarily reflect the official opinion of the European Commission or other European Communities institutions. Neither the European Environment Agency nor any person or company acting on behalf of the Agency is responsible for the use that may be made of the information contained in this report.
A great deal of additional information on the European Union is available on the Internet.It can be accessed through the Europa server (http://europa.eu.int)
ISBN 92-9167-505-9
©EEA, Copenhagen, 2002
Reproduction is authorised provided the source is acknowledged
European Environment AgencyKongens Nytorv 6DK-1050 Copenhagen KTel. (45) 33 36 71 00Fax (45) 33 36 71 99E-mail: [email protected]: http://www.eea.eu.int
Contents 3
Contents
Executive summary . . . . . . . . . . . . . . . . . . . . . . . . . . . . . . . . . . . . . . . . . . . . . . . . 4
1. Introduction . . . . . . . . . . . . . . . . . . . . . . . . . . . . . . . . . . . . . . . . . . . . . . . . . . . 5
1.1. Purpose of the report . . . . . . . . . . . . . . . . . . . . . . . . . . . . . . . . . . . . . . . 5
1.2. Definition of waste minimisation . . . . . . . . . . . . . . . . . . . . . . . . . . . . . . 6
1.3. Methodology . . . . . . . . . . . . . . . . . . . . . . . . . . . . . . . . . . . . . . . . . . . . . 6
2. Current situation in Europe on waste management . . . . . . . . . . . . . . . . . . . . . 9
2.1. Increasing waste quantities . . . . . . . . . . . . . . . . . . . . . . . . . . . . . . . . . . . 9
2.2. Recycling . . . . . . . . . . . . . . . . . . . . . . . . . . . . . . . . . . . . . . . . . . . . . . . . . 11
2.3. Incineration . . . . . . . . . . . . . . . . . . . . . . . . . . . . . . . . . . . . . . . . . . . . . . . 13
2.4. Landfilling . . . . . . . . . . . . . . . . . . . . . . . . . . . . . . . . . . . . . . . . . . . . . . . . 142.4.1. EU directive on landfilling of biodegradable municipal waste . . . . . . 14
2.5. Landfill taxes . . . . . . . . . . . . . . . . . . . . . . . . . . . . . . . . . . . . . . . . . . . . . . 16
2.6. Producer responsibility for packaging waste . . . . . . . . . . . . . . . . . . . . . 16
3. European activities on waste minimisation . . . . . . . . . . . . . . . . . . . . . . . . . . . 19
3.1. Producer responsibility . . . . . . . . . . . . . . . . . . . . . . . . . . . . . . . . . . . . . . 19
3.2. Voluntary agreements . . . . . . . . . . . . . . . . . . . . . . . . . . . . . . . . . . . . . . . 20
3.3. Legislative requirements . . . . . . . . . . . . . . . . . . . . . . . . . . . . . . . . . . . . . 21
3.4. Information programmes encouraging waste prevention . . . . . . . . . . . . 22
3.5. Taxes and fees on waste generation and disposal . . . . . . . . . . . . . . . . . 23
4. Summary and conclusions . . . . . . . . . . . . . . . . . . . . . . . . . . . . . . . . . . . . . . . . 25
Literature . . . . . . . . . . . . . . . . . . . . . . . . . . . . . . . . . . . . . . . . . . . . . . . . . . . . . . . . 26
Annex 1: 10 cases on waste minimisation . . . . . . . . . . . . . . . . . . . . . . . . . . . . . . . 27
Annex 2: Full list of waste minimisation initiatives case studies . . . . . . . . . . . . . . . 50

4 Case studies on waste minimisation practices in Europe
Executive summary
The objective of this report is to support and inspire the work with waste minimisation in EEA member countries by introducing a catalogue of successful examples of waste prevention, recycling and cleaner technology. Thus, the report is supporting EU waste policy manifested in the EU waste strategy and the sixth environmental action programme.
The emphasis of the report is placed on case studies on waste prevention and recycling. A total of 40 waste minimisation cases were examined and 10 of these cases were selected for presentation in this report. Only those cases are selected for final presentation for which adequate information (including a description of the initiative, material flow and behaviour changes that occurred, and relevant economical data) has been provided, thus allowing an overall evaluation of their practical performance.
In order to understand the need for waste minimisation initiatives a detailed picture of the current waste situation has to be presented. Hence, Chapter 2 of the report addresses a number of issues describing the present waste situation in Europe. By emphasising the issues and showing the need for solutions, the case studies discussed in Chapter 3 can be understood and evaluated in their right context.
It must be pointed out that even though this report is highlighting some of the most successful waste minimisation initiatives applied in Europe, by no means it is an ‘inventorial handbook’ or a catalogue of all case studies.
The selected case studies cover a range of five themes namely producer responsibility, voluntary agreements, legislative requirements, information programmes and waste taxes.
Some major conclusions can be drawn from the case studies presented:
• there are several initiatives in many EEA countries encouraging waste recycling and prevention but most of them are only being applied at the local level;
• promising results can be obtained from most of the case studies which can serve as inspiration for future initiatives on waste prevention;
• continuous cooperation and exchange of technological and organisational experiences is needed to reach progress in waste management.
Introduction 5
1. Introduction
Waste represents the loss of both material and energy resources. Because excessive waste generation is a symptom of inefficient production processes, low durability of goods and unsustainable consumption patterns, waste quantities can be considered as an indicator of how efficiently society uses raw materials. Therefore, good waste management begins with preventing waste from being generated.
In the EU, waste hierarchy and legislation, prevention and minimisation of waste is given the highest priority. For instance, Council Directive 75/442/EEC on waste states that:
‘Member States shall take appropriate steps to encourage firstly the prevention or reduction of waste production and its harmfulness’ (1).
The EU waste hierarchy defines the priorities in waste treatment. It gives preference firstly to waste prevention, then to recycling, then to energy recovery and finally to disposal.
Moreover the strategy emphasises the importance of waste prevention:
‘The Council of the European Union…..reiterates its conviction that waste prevention should be a first priority for all rational waste policy, in relation to minimising waste production and the hazardous properties of waste’ (2).
In spite of the common awareness of the unsustainable pattern in the current waste generation, it has been very difficult to initiate effective initiatives slowing down the generation of waste. On the contrary, waste quantities are steadily increasing in Europe.
Furthermore, most of the generated waste is treated in an inappropriate way, mainly by landfilling, leading to a loss of valuable resources.
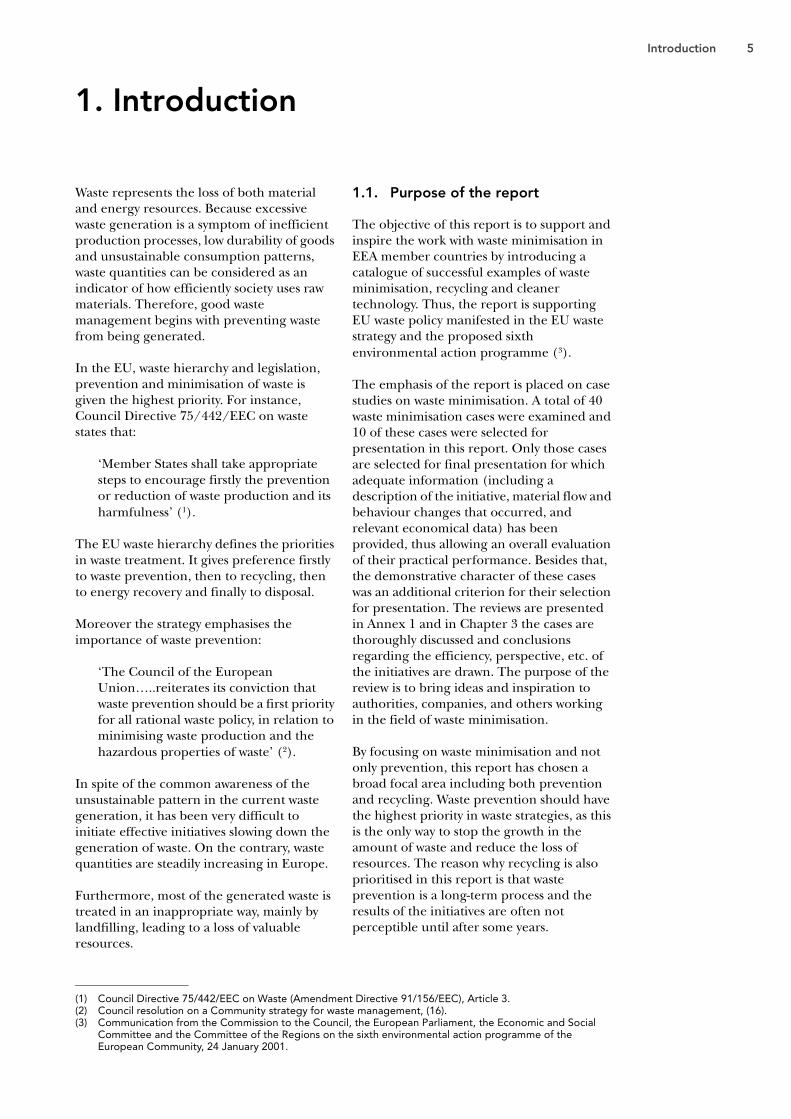
1.1. Purpose of the report
The objective of this report is to support and inspire the work with waste minimisation in EEA member countries by introducing a catalogue of successful examples of waste minimisation, recycling and cleaner technology. Thus, the report is supporting EU waste policy manifested in the EU waste strategy and the proposed sixth environmental action programme (3).
The emphasis of the report is placed on case studies on waste minimisation. A total of 40 waste minimisation cases were examined and 10 of these cases were selected for presentation in this report. Only those cases are selected for final presentation for which adequate information (including a description of the initiative, material flow and behaviour changes that occurred, and relevant economical data) has been provided, thus allowing an overall evaluation of their practical performance. Besides that, the demonstrative character of these cases was an additional criterion for their selection for presentation. The reviews are presented in Annex 1 and in Chapter 3 the cases are thoroughly discussed and conclusions regarding the efficiency, perspective, etc. of the initiatives are drawn. The purpose of the review is to bring ideas and inspiration to authorities, companies, and others working in the field of waste minimisation.
By focusing on waste minimisation and not only prevention, this report has chosen a broad focal area including both prevention and recycling. Waste prevention should have the highest priority in waste strategies, as this is the only way to stop the growth in the amount of waste and reduce the loss of resources. The reason why recycling is also prioritised in this report is that waste prevention is a long-term process and the results of the initiatives are often not perceptible until after some years.
(1) Council Directive 75/442/EEC on Waste (Amendment Directive 91/156/EEC), Article 3.(2) Council resolution on a Community strategy for waste management, (16).(3) Communication from the Commission to the Council, the European Parliament, the Economic and Social
Committee and the Committee of the Regions on the sixth environmental action programme of the European Community, 24 January 2001.

6 Case studies on waste minimisation practices in Europe
Therefore, waste prevention will not, in the short term, be able to solve the issues connected to current waste generation. Simultaneously with the work on prevention, considerable efforts have to be placed on initiatives improving the treatment of waste currently generated, especially those focusing on the encouragement of recycling and the reduction of hazardous substances in waste.
In order to understand the need for waste minimisation initiatives, a detailed picture of the current waste situation has to be drawn. Hence, Chapter 2 of the report addresses a number of issues describing the present waste situation in Europe. By emphasising the issues and showing the need for solutions, the case studies discussed in Chapter 3 can be understood and evaluated in their right context.
The primary target group of the report is national and regional authorities, since they are normally the leading actors in the promotion of waste minimisation initiatives and programmes. It is hoped that they will be inspired by the full-scale initiatives presented and will try to adapt some of them on a national/local level.
1.2. Definition of waste minimisation
The term ‘waste minimisation’ is commonly used, but a strict definition does not exist and in particular the distinction between prevention and minimisation can be difficult.
In the present report the OECD definition of waste minimisation will be applied. Figure 1 shows the OECD definition of waste minimisation agreed at the Berlin meeting (4) in 1996. As it appears from this definition waste minimisation is a broader term than prevention. Waste prevention covers ‘prevention’, ‘reduction at source’ and ‘re-use of products’. Waste minimisation, however, also includes the waste management measures ‘quality improvements’ (such as reducing the hazard) and ‘recycling’.
1.3. Methodology
To collect information on waste minimisation initiatives in the countries, relevant literature on prevention and minimisation of waste was provided and studied. Simultaneously, a questionnaire was sent out in August 2000 by the European Topic Centre on Waste (ETC/W) to EEA member countries asking for two to three (or more) examples of waste minimisation initiatives.
Figure 1 OEDC working definition on waste minimisation agreed at the Berlin Workshop 1996
Prevention
Reductionat source
Re-use ofproduct
Qualityimprovements
Recycling
Energyrecovery
Pre-treatment
Preventive measures Waste management measures
Waste minimisation
(4) ‘Building the basis for a common understanding on waste minimisation’, OECD workshop, October 1996, Berlin.
Introduction 7
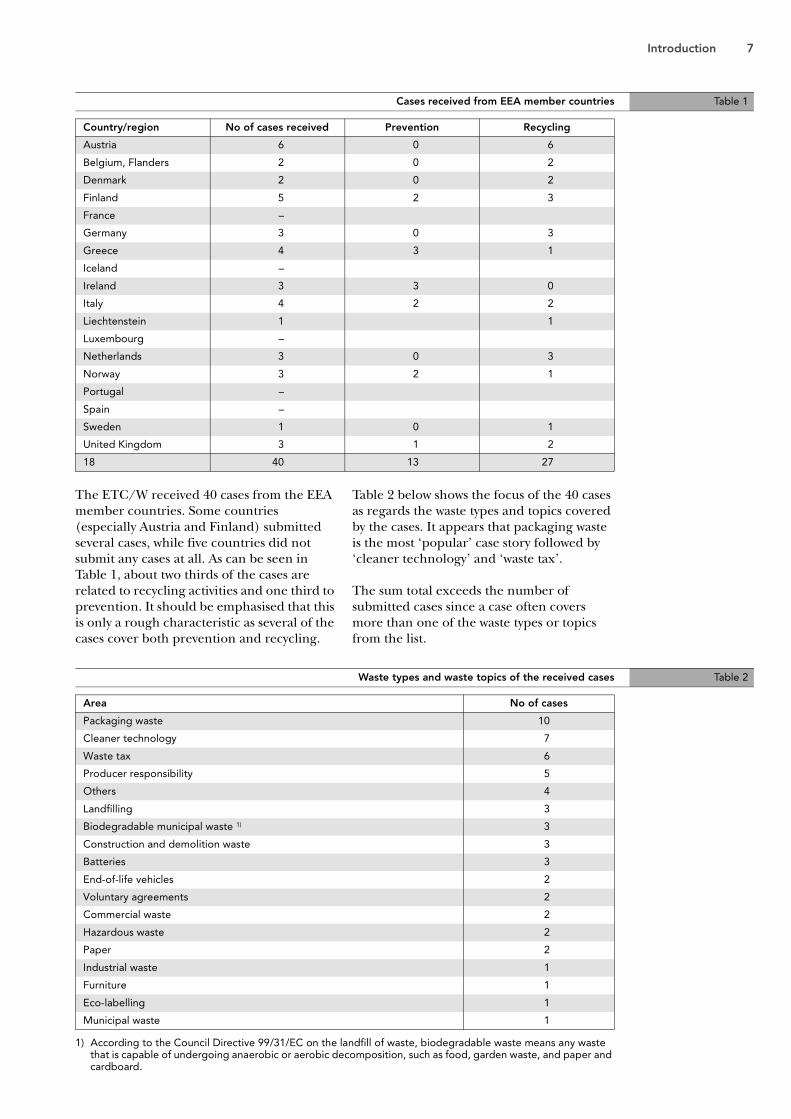
The ETC/W received 40 cases from the EEA member countries. Some countries (especially Austria and Finland) submitted several cases, while five countries did not submit any cases at all. As can be seen in Table 1, about two thirds of the cases are related to recycling activities and one third to prevention. It should be emphasised that this is only a rough characteristic as several of the cases cover both prevention and recycling.
Table 2 below shows the focus of the 40 cases as regards the waste types and topics covered by the cases. It appears that packaging waste is the most ‘popular’ case story followed by ‘cleaner technology’ and ‘waste tax’.
The sum total exceeds the number of submitted cases since a case often covers more than one of the waste types or topics from the list.
1) According to the Council Directive 99/31/EC on the landfill of waste, biodegradable waste means any waste that is capable of undergoing anaerobic or aerobic decomposition, such as food, garden waste, and paper and cardboard.
Cases received from EEA member countries Table 1
Country/region No of cases received Prevention Recycling
Austria 6 0 6
Belgium, Flanders 2 0 2
Denmark 2 0 2
Finland 5 2 3
France –
Germany 3 0 3
Greece 4 3 1
Iceland –
Ireland 3 3 0
Italy 4 2 2
Liechtenstein 1 1
Luxembourg –
Netherlands 3 0 3
Norway 3 2 1
Portugal –
Spain –
Sweden 1 0 1
United Kingdom 3 1 2
18 40 13 27
Waste types and waste topics of the received cases Table 2
Area No of cases
Packaging waste 10
Cleaner technology 7
Waste tax 6
Producer responsibility 5
Others 4
Landfilling 3
Biodegradable municipal waste 1) 3
Construction and demolition waste 3
Batteries 3
End-of-life vehicles 2
Voluntary agreements 2
Commercial waste 2
Hazardous waste 2
Paper 2
Industrial waste 1
Furniture 1
Eco-labelling 1
Municipal waste 1
8 Case studies on waste minimisation practices in Europe
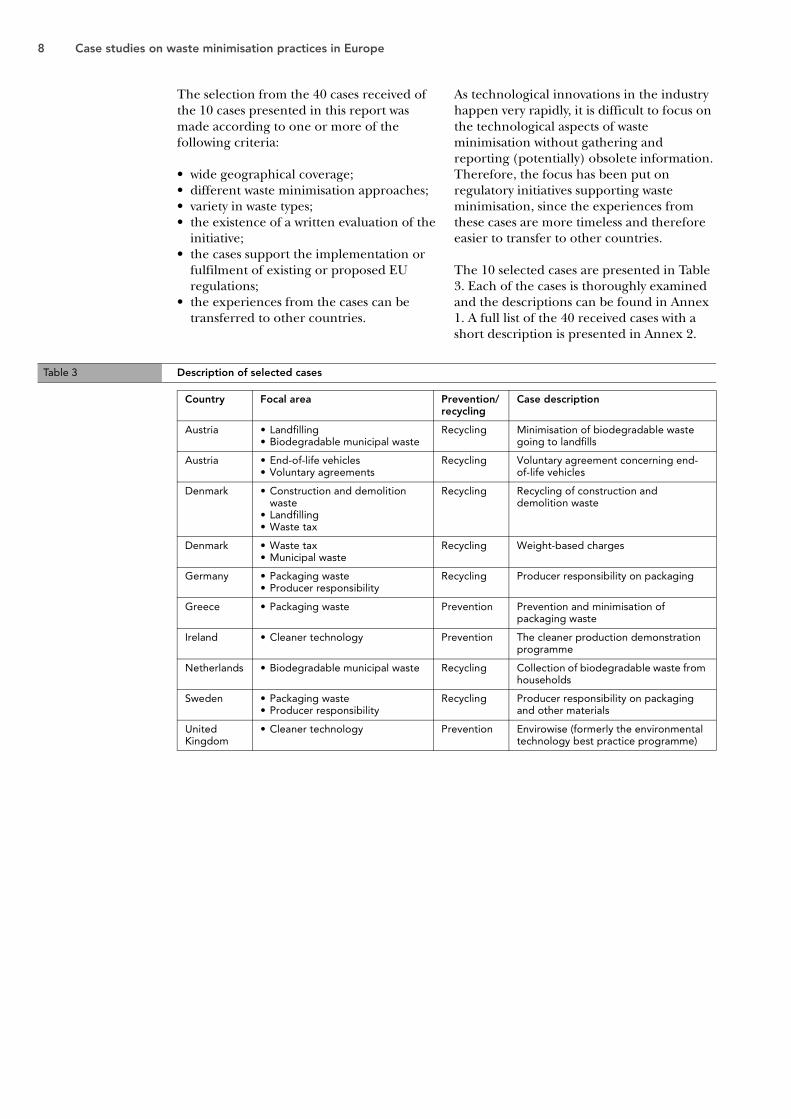
The selection from the 40 cases received of the 10 cases presented in this report was made according to one or more of the following criteria:
• wide geographical coverage;• different waste minimisation approaches;• variety in waste types;• the existence of a written evaluation of the
initiative;• the cases support the implementation or
fulfilment of existing or proposed EU regulations;
• the experiences from the cases can be transferred to other countries.
As technological innovations in the industry happen very rapidly, it is difficult to focus on the technological aspects of waste minimisation without gathering and reporting (potentially) obsolete information. Therefore, the focus has been put on regulatory initiatives supporting waste minimisation, since the experiences from these cases are more timeless and therefore easier to transfer to other countries.
The 10 selected cases are presented in Table 3. Each of the cases is thoroughly examined and the descriptions can be found in Annex 1. A full list of the 40 received cases with a short description is presented in Annex 2.
Table 3 Description of selected cases
Country Focal area Prevention/recycling
Case description
Austria • Landfilling• Biodegradable municipal waste
Recycling Minimisation of biodegradable waste going to landfills
Austria • End-of-life vehicles• Voluntary agreements
Recycling Voluntary agreement concerning end-of-life vehicles
Denmark • Construction and demolition waste
• Landfilling• Waste tax
Recycling Recycling of construction and demolition waste
Denmark • Waste tax• Municipal waste
Recycling Weight-based charges
Germany • Packaging waste• Producer responsibility
Recycling Producer responsibility on packaging
Greece • Packaging waste Prevention Prevention and minimisation of packaging waste
Ireland • Cleaner technology Prevention The cleaner production demonstration programme
Netherlands • Biodegradable municipal waste Recycling Collection of biodegradable waste from households
Sweden • Packaging waste• Producer responsibility
Recycling Producer responsibility on packaging and other materials
United Kingdom
• Cleaner technology Prevention Envirowise (formerly the environmental technology best practice programme)
Current situation in Europe on waste management 9
2. Current situation in Europe on waste management
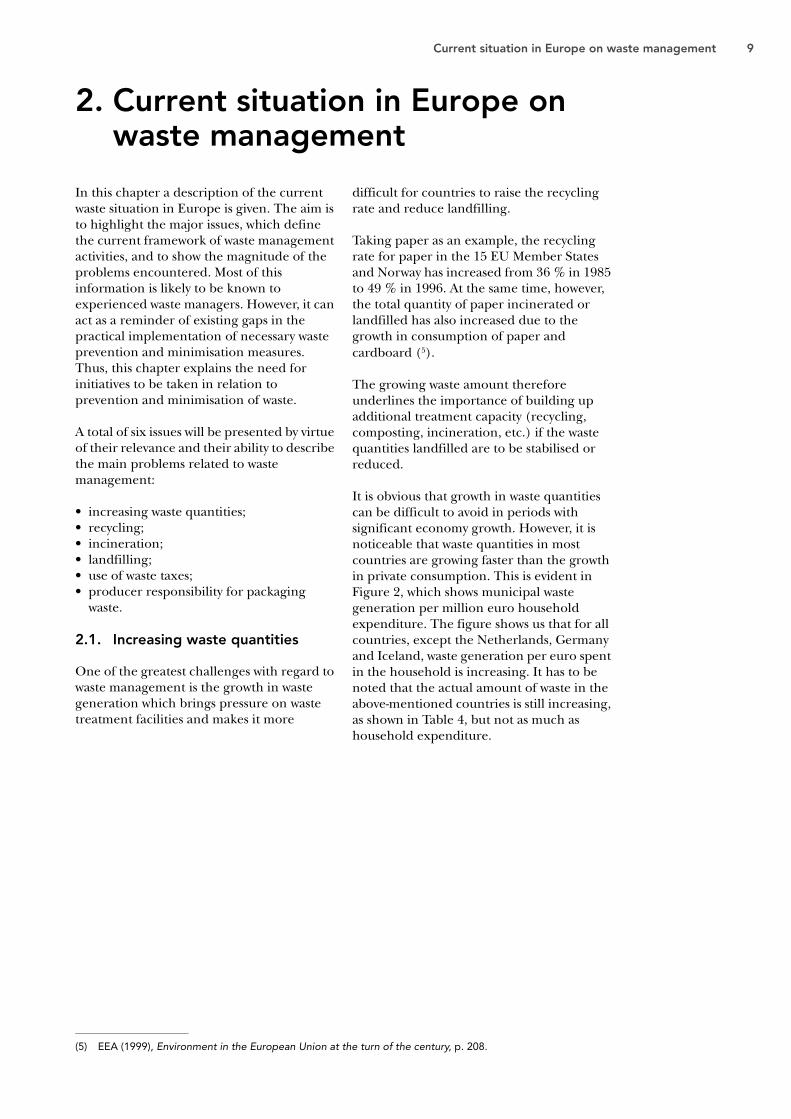
In this chapter a description of the current waste situation in Europe is given. The aim is to highlight the major issues, which define the current framework of waste management activities, and to show the magnitude of the problems encountered. Most of this information is likely to be known to experienced waste managers. However, it can act as a reminder of existing gaps in the practical implementation of necessary waste prevention and minimisation measures. Thus, this chapter explains the need for initiatives to be taken in relation to prevention and minimisation of waste.
A total of six issues will be presented by virtue of their relevance and their ability to describe the main problems related to waste management:
• increasing waste quantities;• recycling;• incineration;• landfilling;• use of waste taxes;• producer responsibility for packaging
waste.
2.1. Increasing waste quantities
One of the greatest challenges with regard to waste management is the growth in waste generation which brings pressure on waste treatment facilities and makes it more
difficult for countries to raise the recycling rate and reduce landfilling.
Taking paper as an example, the recycling rate for paper in the 15 EU Member States and Norway has increased from 36 % in 1985 to 49 % in 1996. At the same time, however, the total quantity of paper incinerated or landfilled has also increased due to the growth in consumption of paper and cardboard (5).
The growing waste amount therefore underlines the importance of building up additional treatment capacity (recycling, composting, incineration, etc.) if the waste quantities landfilled are to be stabilised or reduced.
It is obvious that growth in waste quantities can be difficult to avoid in periods with significant economy growth. However, it is noticeable that waste quantities in most countries are growing faster than the growth in private consumption. This is evident in Figure 2, which shows municipal waste generation per million euro household expenditure. The figure shows us that for all countries, except the Netherlands, Germany and Iceland, waste generation per euro spent in the household is increasing. It has to be noted that the actual amount of waste in the above-mentioned countries is still increasing, as shown in Table 4, but not as much as household expenditure.
(5) EEA (1999), Environment in the European Union at the turn of the century, p. 208.

10 Case studies on waste minimisation practices in Europe
The fifth environmental action programme (1993) set up a target of stabilising annual waste generation at 300 kg per capita by 2000. It has been presumed that the target concerns ‘municipal waste’, which is the most common used standard of reference. However, the statistics for municipal waste generation are not very comparable between countries (6), since no common definition exists.
The 1993 target is neither repeated nor renewed in the Commission’s sixth environmental action programme, and as can be seen in Figure 3 the target is exceeded in all countries except Austria and Iceland.
By recycling the separately collected parts of the household waste six additional countries
have succeeded in keeping the amounts of bagged waste below 300 kg (bagged waste is the traditional remaining fraction of the waste which will not be sorted out for recycling but incinerated or landfilled).
There are no indications that waste generation will be stabilised in the near future. On the contrary an ETC/W study published in September 1999 on projection of selected waste streams (7) clearly indicates that the quantities of municipal waste would continue to increase in the coming 10 years. Table 4 summarises the results of the study and shows that household waste generation in 14 EU Member States will increase by 22 % on average. The results include large variations between the countries and some countries can expect a 30–50 % increase.
Figure 2 Municipal waste generation compared with household expenditure in selected EEA member countries 1985–97
95
25
35
45
55
65
75
85
1984 1986 1988 1990 1992 1994 1996 1998
Portugal
GreeceNetherlandsTo
nnes
of
mun
icip
al w
aste
per
mill
ion
euro
ho
useh
old
exp
end
itur
e
Iceland
Luxembourg
Sweden
Denmark
SpainFrance
Germany
Source: European Environment Agency (2000): Environmental Signals 2000, p. 72. Environmental assessment report No 6.
(6) The lack of comparability between data for municipal waste is described in detail in Household and municipal waste: comparability of data in EEA member countries, prepared by ETC/W, Topic report No 3, published by the EEA, April 2000.
(7) Baseline projection of selected waste streams: development of a methodology. EEA Technical report No 28, 1999.

Current situation in Europe on waste management 11
2.2. Recycling
According to the sixth environmental action programme ‘the aim is to recover and recycle waste to levels that make sense, that is, to the point where there is still a net environmental benefit and it is economical and technically feasible’ (8).
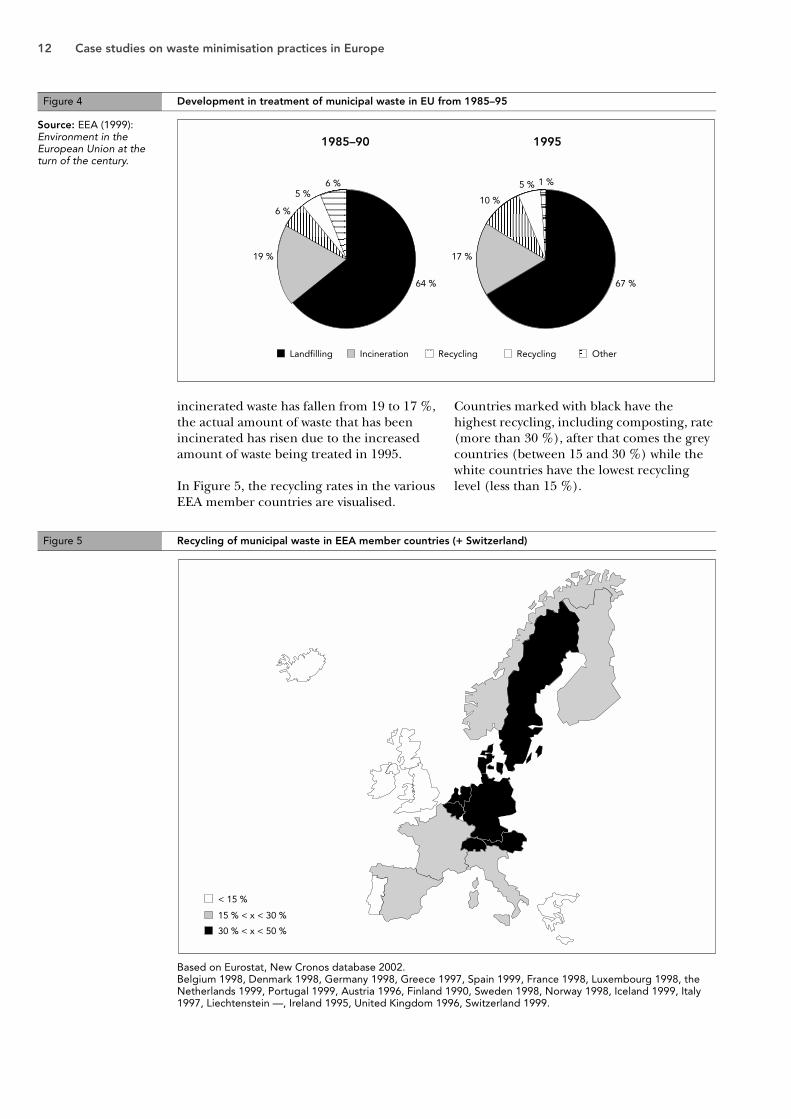
However, two thirds of the total European municipal waste is still landfilled. As shown in Figure 4, the landfill rate has increased from 64 % in the period 1985–90 to 67 % in 1995. Even though recycling has also increased in this period, only 15 % of the waste was recycled or composted in 1995 while 17 % was incinerated. Although the percentage of
Waste generation from daily household and commercial activities in EEA member countries Figure 3
Source: European Environment Agency, 2001: Environmental signals 2001. Environmental assessment report No 8.
(8) Communication from the Commission to the Council, the European Parliament, the Economic and Social Committee and the Committee of the Regions on the sixth environmental action programme of the European Community, 24 January 2001. p. 55.
Estimate results for increasing of household waste in 14 EU countries Table 4
Country Base year 1995–2010 ( %)
Belgium 1994 15
Denmark 1996 36
Germany 1993 26
Greece 1992 28
Spain 1994 25
France 1994 2
Ireland 1995 50
Italy 1995 13
Netherlands 1995 31
Austria 1996 15
Portugal 1995 28
Finland 1994 23
Sweden 1994 29
United Kingdom 1995 36
Total EU-14 22
Source: Baseline projection of selected waste streams. EEA Technical report No 28, 1999.
12 Case studies on waste minimisation practices in Europe
incinerated waste has fallen from 19 to 17 %, the actual amount of waste that has been incinerated has risen due to the increased amount of waste being treated in 1995.
In Figure 5, the recycling rates in the various EEA member countries are visualised.
Countries marked with black have the highest recycling, including composting, rate (more than 30 %), after that comes the grey countries (between 15 and 30 %) while the white countries have the lowest recycling level (less than 15 %).
Based on Eurostat, New Cronos database 2002.Belgium 1998, Denmark 1998, Germany 1998, Greece 1997, Spain 1999, France 1998, Luxembourg 1998, the Netherlands 1999, Portugal 1999, Austria 1996, Finland 1990, Sweden 1998, Norway 1998, Iceland 1999, Italy 1997, Liechtenstein —, Ireland 1995, United Kingdom 1996, Switzerland 1999.
Figure 4 Development in treatment of municipal waste in EU from 1985–95
1985–90
Landfilling
6 % 1 %
6 %
19 %
64 % 67 %
5 %5 %
10 %
17 %
Incineration Recycling Recycling Other
1995Source: EEA (1999): Environment in the European Union at the turn of the century.
Figure 5 Recycling of municipal waste in EEA member countries (+ Switzerland)
Current situation in Europe on waste management 13
Major obstacles to increasing recycling rates are that recycling asks for higher organisational, legal and communicational requirements than waste landfilling/incineration.
Obtaining of the purest possible waste fractions is essential for the success of recycling schemes. Therefore sorting at source and separate collection of these fractions have to be organised, a difficult task which, to a certain extent, depends on user behaviour and environmental awareness. Waste from industries and commerce is the least complicated to collect and recycle, since it arises in large quantities per unit, and in general is more homogenous. In contrast to this, wastes from households are more complicated to recycle, since it arises in small quantities from many waste producers. Thereby, the collection costs and the content of contaminants in household waste are
generally higher compared to wastes from industries.
2.3. Incineration
When recycling or composting is not feasible, for example, for economical or technical reasons, incineration of waste with energy recovery is a preferable step according to the waste hierarchy (9). Incineration of waste is a way of utilising the energy content in waste and during incineration the volume of the waste is reduced to 5 % and the weight to 25 % of the initial totals. Thus, the need for landfill capacity is reduced, especially as it is often possible to use the residual products from incineration in construction works.
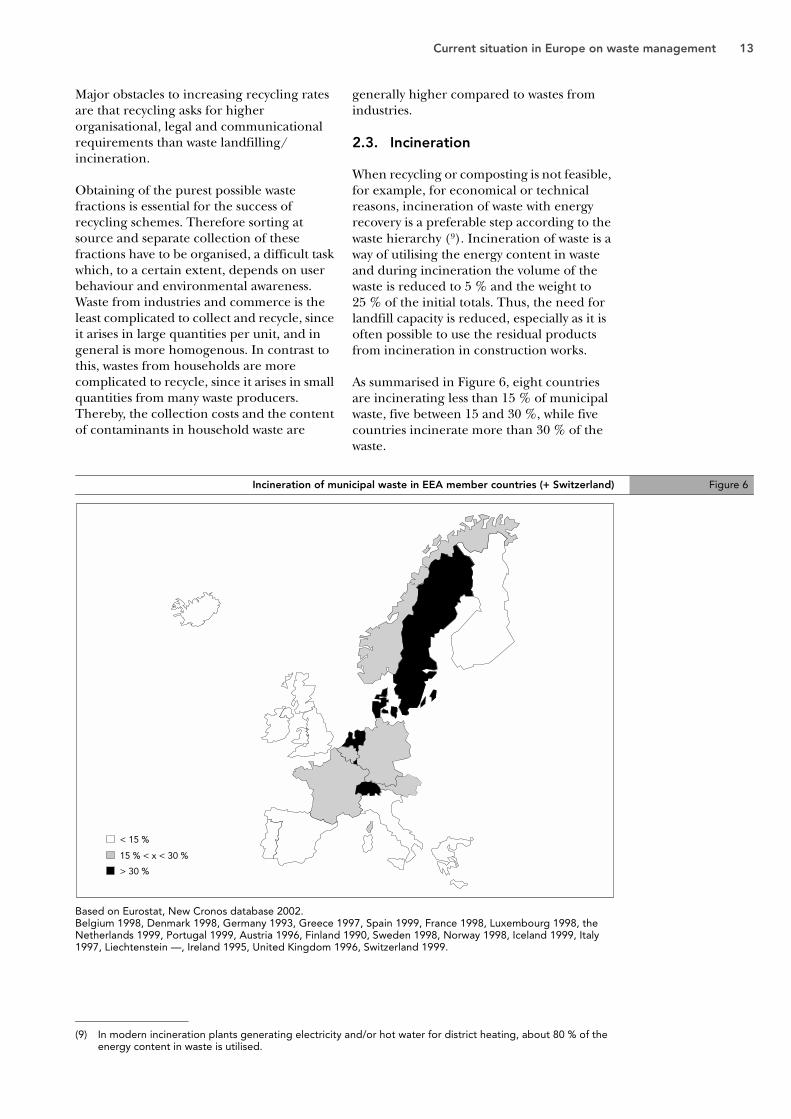
As summarised in Figure 6, eight countries are incinerating less than 15 % of municipal waste, five between 15 and 30 %, while five countries incinerate more than 30 % of the waste.
Based on Eurostat, New Cronos database 2002.Belgium 1998, Denmark 1998, Germany 1993, Greece 1997, Spain 1999, France 1998, Luxembourg 1998, the Netherlands 1999, Portugal 1999, Austria 1996, Finland 1990, Sweden 1998, Norway 1998, Iceland 1999, Italy 1997, Liechtenstein —, Ireland 1995, United Kingdom 1996, Switzerland 1999.
(9) In modern incineration plants generating electricity and/or hot water for district heating, about 80 % of the energy content in waste is utilised.
Incineration of municipal waste in EEA member countries (+ Switzerland) Figure 6
14 Case studies on waste minimisation practices in Europe
Although recycling generally is preferred to incineration or landfilling, it depends on the actual waste type. In some cases collection and recycling require more input of energy than for the extraction of virgin raw materials. Life-cycle assessments and environmental cost/benefit analysis are therefore required to determine the preferred option for treatment.
Incineration of waste produces emissions of flue gas containing various hazardous substances. However, the different steps of flue gas cleaning in modern incineration plants trap most of the hazardous gases. Probably the most problematic substance in flue gas is dioxin. The recently adopted EU directive on incineration (10) lays down a very strict limit value on dioxin emissions which means that only incineration plants with special dioxin filters are able to cope with the standards for dioxin.
As shown in Figure 6, the countries incinerating municipal waste form an axis from north-east to south-west of Europe. This picture reflects the profound distrust in incineration in most south European countries, the United Kingdom and Ireland.
Costs for instalment and operation of modern incineration facilities are generally higher than landfilling. A tax on landfilling of waste or other regulations of the waste streams is therefore often a way to make incineration facilities competitive to landfills.
When establishing new waste incineration facilities, it is important to ensure that the incineration does not obstruct recycling activities. This is the case if the incineration capacity is adequate to attract, as an example, all biodegradable municipal waste so that incentives to establish recycling and composting schemes of this waste stream become less attractive.
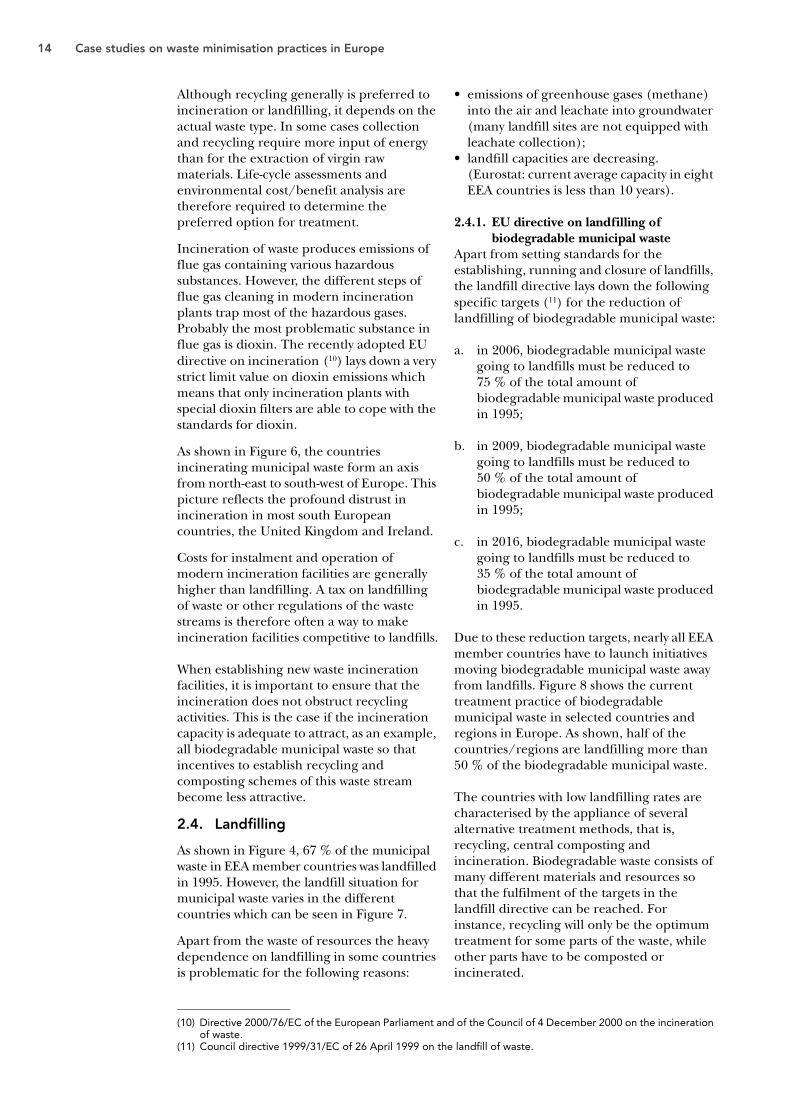
2.4. Landfilling
As shown in Figure 4, 67 % of the municipal waste in EEA member countries was landfilled in 1995. However, the landfill situation for municipal waste varies in the different countries which can be seen in Figure 7.
Apart from the waste of resources the heavy dependence on landfilling in some countries is problematic for the following reasons:
• emissions of greenhouse gases (methane) into the air and leachate into groundwater (many landfill sites are not equipped with leachate collection);
• landfill capacities are decreasing. (Eurostat: current average capacity in eight EEA countries is less than 10 years).
2.4.1. EU directive on landfilling of biodegradable municipal waste
Apart from setting standards for the establishing, running and closure of landfills, the landfill directive lays down the following specific targets (11) for the reduction of landfilling of biodegradable municipal waste:
a. in 2006, biodegradable municipal waste going to landfills must be reduced to 75 % of the total amount of biodegradable municipal waste produced in 1995;
b. in 2009, biodegradable municipal waste going to landfills must be reduced to 50 % of the total amount of biodegradable municipal waste produced in 1995;
c. in 2016, biodegradable municipal waste going to landfills must be reduced to 35 % of the total amount of biodegradable municipal waste produced in 1995.
Due to these reduction targets, nearly all EEA member countries have to launch initiatives moving biodegradable municipal waste away from landfills. Figure 8 shows the current treatment practice of biodegradable municipal waste in selected countries and regions in Europe. As shown, half of the countries/regions are landfilling more than 50 % of the biodegradable municipal waste.
The countries with low landfilling rates are characterised by the appliance of several alternative treatment methods, that is, recycling, central composting and incineration. Biodegradable waste consists of many different materials and resources so that the fulfilment of the targets in the landfill directive can be reached. For instance, recycling will only be the optimum treatment for some parts of the waste, while other parts have to be composted or incinerated.
(10) Directive 2000/76/EC of the European Parliament and of the Council of 4 December 2000 on the incineration of waste.
(11) Council directive 1999/31/EC of 26 April 1999 on the landfill of waste.

Current situation in Europe on waste management 15
Based on Eurostat, New Cronos database 2002.Belgium 1998, Denmark 1998, Germany 1998, Greece 1997, Spain 1999, France 1998, Luxembourg 1998, the Netherlands 1999, Portugal 1999, Austria 1996, Finland 1990, Sweden 1998, Norway 1998, Iceland 1999, Italy 1997, Liechtenstein —, Ireland 1995, United Kingdom 1996, Switzerland 1999.
Landfilling of municipal waste in EEA member countries Figure 7
Treatment practice for biodegradable municipal waste in countries and regions surveyed Figure 8
Source: EEA (2002): Biodegradable municipal waste management in Europe. Topic report No 15/2001.
0%
20%
40%
60%
80%
100%
% o
f b
iod
egra
dab
le m
unic
ipal
was
te t
reat
ed
Den
mar
k
Belg
ium
Bade
n-W
ürtt
embe
rg
(Ger
man
y) Nor
way
Italy
U. K
ingd
om
Other (unspecified)
Mechanical-biologicalpre-treatment
Anaerobic digestion
Recycling
Central composting
Incineration withoutenergy recovery
Incineration with energyrecovery
Landfill
Net
herla
nds
Aus
tria
Fran
ce
Finl
and
Cat
alan
ia (S
pain
)
Irela
nd

16 Case studies on waste minimisation practices in Europe
In order to improve the quality of waste treatment and reduce landfilling, several countries have introduced or are planning to introduce a ban on landfilling of biodegradable municipal waste. As shown in Table 5, Flanders (Belgium), Denmark, Italy, Norway and the Netherlands have already introduced a ban, while six other countries will introduce a ban on landfilling of biodegradable municipal waste in the near future.
2.5. Landfill taxes
By introducing taxes on landfilling (and in a few cases incineration) of waste, more EEA member countries are attempting to encourage waste minimisation, that is, motivate the waste producers to recycle or prevent the generation of waste. Economic measures are generally effective when the aim is regulation of single actors in a market. By taxation of the least preferable alternative, the market actors will change behaviour in an attempt to avoid the tax. Thus, economic measures are only effective, and should only be applied, when alternative ways of waste management/disposal are possible.
A tax on landfilling of waste will therefore only be effective with regard to waste minimisation if the waste producers are provided with other available alternatives. Otherwise, the tax will first and foremost be a fiscal arrangement, though it could possibly stimulate prevention of waste.
Another precondition for the establishment of a tax on landfilling of waste is that there is an effective public control of the waste streams. Otherwise, a landfill tax instead of waste minimisation can lead to increased illegal disposal of the waste.
As shown in Figure 9, 10 countries have introduced a tax on the landfilling of waste. The three Scandinavian countries and the Netherlands have the highest taxes (EUR 20 to 50 per tonne), while the tax in the other six countries is lower (EUR 5 to 20 per tonne). Eight EEA member countries have no landfill taxes.
In addition to the landfill tax, Denmark, Norway and the Netherlands have taxes on incineration of waste.
2.6. Producer responsibility for packaging waste
A recent trend in EU/national waste regulation is that the responsibility for an increasing part of the waste collection and treatment is delegated to the producers. Producer responsibility is characterised by giving the producers the organisational and economical responsibility for a specific waste stream. Normally, the national authorities specify targets for the producers to fulfil, for example, reaching a certain recycling rate.
Since it is very difficult to delegate a take-back responsibility to each producer or retail store, the normal setup of producer responsibility schemes is to establish a specific company that covers the interests of the whole branch. This company organises the collection and treatment of the waste and manages the fulfilment of the producers’ obligations on behalf of the branch. The collection and treatment activities are, in the first instance, financed by the producers and retailers.
By establishing producer responsibility strategies, the public authorities lose some
Table 5 Countries with a ban on landfilling of biodegradable municipal waste
Country Ban on landfilling of biodegradable municipal waste
Austria To be introduced 2004
Belgium (Flanders) Yes
Denmark Yes
Finland To be introduced 2005
France To be introduced 2002
Germany To be introduced 2005
Italy Yes (1)
(1) Only non-recoverable waste and inert waste are allowed to be landfilled.
Norway Yes
Sweden To be introduced 2005
The Netherlands Yes
Source: EEA (2002): Biodegradable municipal waste management in Europe. Topic report No 15/2001.

Current situation in Europe on waste management 17
influence in waste management and have to invest resources in control systems. In return producer responsibility schemes provide a possibility of reaching recycling or prevention targets that could not be obtained in a public waste management system without extensive public investments.
Producer responsibility schemes are involving still more waste types, but the commonest use is with packaging waste. As shown in Figure 10, most of the EEA member countries have introduced producer responsibility for packaging waste.
A total of 10 EEA member countries (12) have joined ‘PRO Europe’ (13), which is a European organisation founded with the purpose of awarding the ‘green dot’ mark to national collection and recovery systems on the basis of uniform rules and regulations (14).
In addition to the ‘green dot countries’, three countries have introduced other producer responsibility schemes. Only five EEA member countries are today without producer responsibility schemes for packaging. However, instruments such as a general fee on packaging indirectly producing a similar effect to producer responsibility schemes are also in use.
The case studies from Germany and Sweden (see Annex 1) clearly indicate that producer responsibility has led to waste minimisation since the generation of packaging waste has decreased, while recycling of the generated packaging has increased in the same period.
It is likely that the same waste prevention effect would be the result of a general fee on packaging.
In Figure 10, the existing situation in Europe concerning the adoption of producer responsibility schemes is visualised.
Taxes on landfilling in EEA member countries 1998 (EUR/tonne) Figure 9
Source: DG Environment Eco-tax database, Keele University, and OECD database on environmentally related taxes, 1998. The Belgian landfill tax is varying between EUR 3.69 and 22.5.The Norwegian landfill tax is varying between EUR 18 and 36.The Italian landfill tax is varying between EUR 1 and 26.
(12) June 2002.(13) PRO Europe = Packaging recovery organisation Europe.(14) The green dot is originally the mark of the German Duales System Deutschland, but since 1996 the right of
use of the mark has been transferred to PRO Europe. In the nine connected countries, the green dot tells the consumers that the packaging concerned is part of a separate collection system.

18 Case studies on waste minimisation practices in Europe
Figure 10 Producer responsibility schemes for packaging waste in EEA member countries
Source: http://www.gruener-punkt.de and ETC/WMF
Green dot countries
Other producer responsibility
No producer responsibility

European activities on waste minimisation 19
3. European activities on waste minimisation
In this section the selected cases are discussed and conclusions drawn.
The discussion will be presented in five themes, each theme containing one or more of the 10 selected cases. The five themes relate to different types of response option:
• producer responsibility;• voluntary agreements;• legislative requirements;• information programmes;• waste taxes.
As stated in the introduction, the selection for presentations was based on the adequacy of the provided information and the expected demonstration effect of each case. No attempt has been made to present a full inventory of major waste prevention or minimisation schemes applied in Europe.
3.1. Producer responsibility
Three of the 10 selected cases concern producer responsibility in relation to packaging waste.
• producer responsibility on packaging in Germany;
• producer responsibility on packaging etc. in Sweden;
• prevention and minimisation of packaging waste in Greece.
As stated in paragraph 2.5, producer responsibility schemes on packaging waste are in effect in several European countries, including Germany and Sweden. The Greek case is not a typical producer responsibility scheme, since no regulation gives the producers a formal responsibility for the packaging waste. The case can more or less be characterised as a voluntary initiative, since the industry has taken responsibility voluntarily in the packaging minimisation activities. However, the Greek case was found useful for inclusion in the discussion on producer responsibility, due to the similarities in scope and practical implementation of the three cases.
Effects of the initiativesFrom the case descriptions in Annex 1, it is clear that producer responsibility on packaging in Germany and Sweden has been effective as regards waste prevention and increasing of the recycling rate for packaging waste. During the 1990s, the amounts of packaging used in Germany has decreased by approximately 15 %, while the recycling rate is increased drastically by a factor of 6.
Sweden can also present a very positive development as regards the recycling of packaging waste. Recycling rates near 90 % have been achieved for several waste fractions.
In Greece, it is not possible to quantify the recycling rate for packaging waste, but a general decrease of 8 % in the amounts of packaging waste landfilled/generated has been registered since the start of the programme.
Decreasing packaging quantities could possibly also be achieved by introducing a general packaging tax. A weight-related packaging tax as well as the weight-related fee paid to DSD (Germany) and REPA (Sweden) gives the producers incentives to minimise the weight and volume of packaging. However, a tax will only affect the recycling of packaging if the revenue is transferred to recycling activities.
The environmental effects of the producer responsibility schemes for packaging have not been evaluated in this study. It is clear that the costs of packaging collection and recycling are high and it is necessary to assess cost effectiveness of this initiative. It is not possible to give a general answer to this as it depends on several specific aspects (collection and recycling methods, alternative treatment technologies, etc.).
The results from these cases show that producer responsibility schemes for packaging waste is a possible way to reduce some of the waste problems in Europe, especially as regards growing waste amounts and increasing landfilling. Packaging waste minimisation will obviously not be a stand-alone solution, as packaging only represents
20 Case studies on waste minimisation practices in Europe
a minor part of the European waste streams. Thus, initiatives on packaging waste minimisation will only have visible effects on the generation and treatment of waste from household and commercial activities, while, for instance, industrial waste will be mainly unaffected.
Demands on regulation and organisation of the waste systemA big advantage connected to producer responsibility schemes is that it is not necessary for the competent authorities to be in charge of the building up of new collection schemes. This task is transferred to the producers.
Furthermore, producer responsibility is leading to a clear distinction of competence between the part to establish the environmental targets (the competent authorities) and the part to fulfil the targets (the producers). Producer responsibility schemes, however, do not release the authorities from all responsibilities. Apart from setting up targets, the authorities are responsible for establishing the regulatory framework for collection and treatment of the waste and the relevant control activities.
A negative consequence of producer responsibility schemes is that parallel collection schemes are established — one organised by the producers (for example packaging) and one organised by the municipalities (for example, mixed household waste). This emphasises the necessity of clearly defined areas of responsibility. For instance, Sweden has experienced problems in relation to the clarification of responsibility between the producers and the municipalities.
ConclusionPrior to the establishment of a producer responsibility scheme for packaging waste the authorities have to be aware of the following:
• On the one hand, producer responsibility can be a way of reaching some environmental targets that would not have been possible without a considerable rearmament in the public waste system, as regards regulation, material, manpower, etc. On the other hand, the consequence is a reduced public influence on the collection and treatment of the waste.
• The current extension of producer responsibility schemes for packaging waste
indicates that this initiative is easily transferable to other countries, even though differences appear in the actual implementation in the countries.
3.2. Voluntary agreements
Voluntary agreements are widely used in some European countries. Such agreements are normally entered into between the waste authorities and a specific industry about the fulfilment of specific targets in relation to a distinct waste type, in order to stimulate, beyond legal obligations, waste prevention/minimisation practices. Often, voluntary agreements are difficult to differentiate from producer responsibility schemes as both regulations are based on agreements between the authorities and the producers (of the goods or the waste) and some agreements can be characterised as both producer responsibility and voluntary agreements.
However, voluntary agreements are generally a softer regulation than producer responsibility schemes.
One of the selected cases from Austria concerns a voluntary agreement on end-of-life vehicles (ELV). This case is interesting and demonstrative, as it has acted as model for the recently (2001) passed EU directive on ELV. Therefore, the Austrian experiences could be fruitful for other EU countries to examine when they, within the next one to two years, are to establish national schemes for the collection and treatment of ELV.
Effects of the initiativesThe Austrian voluntary agreement implies that the motor vehicle industry takes back ELV from the consumer free of charge upon simultaneous purchase of a new or used vehicle. Thus, there is no incentive for the consumers to dispose the ELV illegally.
The agreement has been effective since the majority of the industry has signed the agreement and nearly all ELV in Austria are handled at authorised receiving facilities. However, the precise rate of return is difficult to estimate, since a large part of the returned cars in Austria are exported for further use in other countries.
Demands on regulation and organisationVoluntary agreements have some advantages compared to legislative requirements. One of the biggest advantages (which also counts for
European activities on waste minimisation 21
producer responsibility) is that the industry gets involved in the fulfilment of waste minimisation targets. This is a very important step because the industry holds the needed know-how and is thereby the key factor to technological solutions to the problems.
If producers, however, are less committed to fulfilling the agreement and the industry is disintegrated (several small units), it is difficult to reach the requested targets with the use of voluntary agreements. The chances of success are therefore higher if the industry is characterised by few producers and if it is possible to lay down acceptable targets that can be easily evaluated by the authorities.
ConclusionVoluntary agreements are often politically easier to establish than legislative requirements and producer responsibility schemes. This is because it is difficult to make a voluntary arrangement a political issue.
It is also possible to combine the voluntary agreement with legislative requirements by formulating a regulation containing the premises agreed with the industry. Thereby, these premises are legally binding for the entire branch and if some importers or producers have not signed the agreement they will eventually be included by the regulation.
3.3. Legislative requirements
Actions needed to meet legislative requirements, which are imposed on a national/regional level as a follow-up to EU policy, have been launched in various countries. It appears that these initiatives are particularly successful in cases where waste reduction targets are explicitly mentioned in European legislation (for example, the landfill directive), so that national authorities have to implement relevant legislative instruments for compliance.
Two of the selected cases concern initiatives to reduce the landfilling of biodegradable municipal waste through the establishment of collection and composting schemes for food and garden waste from households (collection of biodegradable waste from household in the Netherlands and minimisation of biodegradable municipal waste on landfills in Austria).
Effects of the initiativesThe cases from Austria and the Netherlands show that the two countries have succeeded in raising the amounts of separately collected food and garden waste from households during the 1990s. In the Netherlands, about 33 % of the biodegradable municipal waste was collected through the scheme in 1998 (representing 22 % of household waste), and in Austria the same figure was about 23 % in 1996 (representing 13 % of household waste).
Together with initiatives on paper collection/recycling, incineration of mixed waste, and strict regulation on the landfilling of waste, the collection/composting scheme for biodegradable household waste has decreased the landfilling rate of biodegradable municipal waste to 13 % in the Netherlands and 20 % in Austria.
These data demonstrate that initiatives on biodegradable municipal waste — apart from being a necessity due to the landfill directive — can be an effective part of the solution to the problems with increasing landfilling of waste in Europe. Similar to initiatives on packaging waste, schemes for biodegradable waste are mainly directed to household waste, even though large amounts of biodegradable waste from industries are also found.
Recycling schemes for food waste from households is costly due to the need for separate collection and the strict requirements for treatment (composting/anaerobic digestion) if the compost product should be sold on the market. For the treatment of garden waste, more simple technology is often used.
The case study from the Netherlands shows that it is possible to create a market for compost, but it is often difficult to get reasonable prices for the compost product.
From an environmental point of view the best solution would be home composting of food and garden waste. However, this is not possible in cities and in addition it normally does not ensure a recycling rate as high as separate collection schemes since home composting is more time consuming and troublesome for the households.
Demands on regulation and organisationEstablishing recycling schemes for food and garden waste requires substantial efforts from the waste authorities. First of all the
22 Case studies on waste minimisation practices in Europe
technological and organisational aspects of the collection and treatment are considerable. Secondly, the collection is complicated by the fact that the households participate more or less voluntarily in the collection schemes.
Public awareness campaigns organised by the municipalities can substantially increase the participation rates in these schemes.
ConclusionDue to EU targets on the reduction in landfilling of biodegradable municipal waste most countries need to take initiatives to increase the rates of recycling or incineration of biodegradable municipal waste. Establishment of collection schemes for food and garden waste from households are effective ways to reduce landfilling of biodegradable municipal waste as shown by the Austrian and Dutch cases.
As regards the sale of compost it is very important that the purchasers have complete confidence in the quality of the compost product. Therefore the authorities should carefully monitor the quality of compost especially with respect to heavy metals and other hazardous substances.
3.4. Information programmes encouraging waste prevention
Prevention of waste has the highest priority in the waste hierarchy. Therefore, relevant cases on waste prevention are of particular interest. But the initiatives are often difficult to evaluate, especially when waste prevention is parts of a broader cleaner production approach.
Two of the 10 selected cases concern initiatives on waste prevention by the use of information programmes:
• the Cleaner Production Demonstration programme in Ireland;
• Envirowise in the UK.
The Irish programme is a demonstration programme characterised by the establishment of subsidy schemes promoting waste prevention activities in a limited number of companies. In continuation of the programme activities the results are disseminated to a broader group of companies. In the Irish case the total aid was more than EUR 1 million.
The UK information programme, Envirowise, is not a subsidy scheme, as companies are not given any money to carry out waste minimisation. It is a marketing programme backed up by strong technical information specifically tailored to help overcome different barriers to undertaking waste minimisation. The UK government expects to spend EUR 96 million on promotion of resource efficiency and cleaner production activities over a period of 13 years.
Effects of the initiativesBoth cases present very persuasive results with respect to environmental and economical benefits. The environmental gains from the programme are hard to summarise, as they are very different from project to project depending on the specific scope. However, large reductions in landfilling and in the use of dangerous substances, better source separation, etc. are some of the general characteristics of the results.
The economic effects of both programmes are very good. Altogether the participating companies are annually saving more money than the total governmental funding of the programmes. In Ireland the companies concerned financially contribute to the initiatives. In the UK, companies are given free material and advice but carry out all improvement work themselves.
The UK waste minimisation programme has some additional interesting aspects, such as the ‘waste minimisation clubs’ and the ‘helpline’ function. About 100 self-sustaining waste minimisation clubs have so far been established and the purpose is to engage business in making environmental improvements. The clubs arrange workshops and contribute to the dissemination of information on waste minimisation to the members and other companies in the area. Envirowise offers telephone helpline support and limited workshop and on-site consultation support. Each club is organised locally and funding comes from a variety of sources, including the companies. However, Envirowise does not provide any funding for clubs.
These initiatives have reduced the material use of over 240 000 tonnes per year and reduced waste disposal by more than 1 million tonnes per year.

European activities on waste minimisation 23
This indicates that information programmes can be very effective tools in environmental as well as in economic terms in the efforts to reduce waste generation.
Demands on regulation and organisationInformation programmes do not require specific regulation, since the participation is voluntary for the companies. Nevertheless, effective information programmes on waste minimisation require strict guidance of the programme and the companies.
ConclusionInformation programmes on waste minimisation can be very effective at company level. It has proved very effective to concentrate the effort on the establishment of networks where companies can find support and inspiration on waste minimisation activities among each other. That could be in the shape of self-sustaining waste clubs as seen in the UK. In this way information and experiences on waste minimisation is easily available for all companies.
Since effective information programmes require substantial financial support it is important to make considerations concerning financing of the programme, for example, to link the programmes with a taxation (for example, a tax on landfilling of waste). This will make the initiative cost neutral and the taxation could be used indirectly as an instrument to support the motive of the subsidy programme.
3.5. Taxes and fees on waste generation and disposal
Taxes on products/waste and other economic instruments are sometimes effective for waste minimisation. Three of the case studies concern economic measures to promote waste minimisation:
• tax on landfilling of waste in Denmark;• minimisation of biodegradable municipal
waste on landfills in Austria;• weight-related fees on mixed household
waste in Denmark.
Two of the cases are landfill taxes and the third is weight-related fees on household waste. The objective of landfill taxes is to improve the relative competitiveness of alternative treatment technologies
(recycling, incineration, composting, etc.) by imposing a tax on the landfilling of waste. The objective of weight-related fees is to motivate households to improve source separation, thereby reducing the amounts of waste for landfilling/incineration.
Environmental taxes and fees are considered as effective, economic instruments needed to make, in the case of waste management, environmentally sound activities such as separate collection, treatment and recycling of wastes economically attractive by increasing the costs relevant to uncontrolled waste disposal. These cost-based initiatives supplement the legislative framework, which is set at national level following the transposition of EU directives into national law (for example, the landfill directive).
Effects of the initiativesThe cases show that landfill taxes in Austria and Denmark have proved to be very effective. In Austria, the landfill tax (EUR 7.3 to 43.6 per tonnes) together with other initiatives has reduced the landfill rate for household waste from 63 to 32 %, while primarily recycling has increased.
The Danish landfill tax has steadily increased during the 1990s and in the same period the recycling of construction and demolition waste has increased from 25 to 90 %. Less than 10 % of the construction and demolition waste is landfilled and 12 % of the total waste generation was landfilled in 1999.
The current landfill tax in Denmark is EUR 50 per tonne. The case shows that a tax of EUR 17 is enough to reach a recycling rate of about 80 % and the effect of raising the tax above EUR 17 has been minimal as regards construction and demolition waste (15). This, however, can be different in other countries depending on the general waste regulation, the price difference between landfilling and alternative treatment forms, and on how accessible the alternative treatment forms are.
The case study on ‘weight-related waste fees’ indicates that it is possible to motivate the households to increase recycling and reduce the amounts of mixed waste (bagged waste) if the collection fee varies according to the weight of the mixed waste in the household.
(15) This does not exclude that an increased landfill tax could have an effect on other waste types.
24 Case studies on waste minimisation practices in Europe
Demands on regulation and organisationIt is possible to establish a general landfill tax without any changes in the existing waste system and waste regulation. However, if the aim is to promote waste minimisation, it is important to make sure that the waste producers have easy access to alternative treatment forms to landfilling.
Furthermore, an effective waste tax (based on the actual weight of waste) requires installation of weighing machines on all landfills. This will presumably lead to a reduction in the number of landfills, since the smaller ones will eventually not be able to make this investment.
The establishment of weight-related waste fees for households require well-developed recycling schemes for household waste. If municipalities only have one collection scheme for mixed waste, the households are not able to improve the waste sorting and the initiative will have limited effect.
It is also impossible to supervise the acting and behaviour of the households and therefore the system to a great extent relies on the support and acceptance of the population.
ConclusionThe extent and magnitude of environmental taxes and fees has to be carefully considered, in order to avoid undesirable effects such as illegal and uncontrolled waste disposal, which can occur if the economic burden on waste operators (collection/treatment companies) becomes unbalanced to the expected benefits from recycling of waste fractions. Therefore a cost/benefit analysis based on environmental and economical terms should always be elaborated before any decision-making.
Weight-dependent waste collection fees have to be combined with recycling schemes for household waste, and information to the general public.
Summary and conclusions 25
4. Summary and conclusions
The 10 case studies included in this report (Annex 1) represent some of the most important initiatives taken in the EEA countries during the 1990s in order to promote and encourage waste minimisation.
From the description in Chapter 2, it is clear that Europe today and in the coming years is facing huge problems regarding handling and treatment of waste. Nevertheless, the case studies create some basis for optimism due to the fact that only a few problems appear insoluble. On the contrary, EEA countries as a whole are able to present solutions to a lot of the problems such as increasing waste generation, excessive landfilling, lack of recycling and recovery, etc., where one country is behind and another is ahead.
Thus, the challenge for the countries in the coming years will rather be to utilise each other’s experiences rather than to find new solutions. It is obvious that the task will not be easy and not all initiatives can easily be transferred from one country to another. Experiences on waste prevention especially
will have to be carefully examined, as a response to the continuous increasing of waste quantities generated. Some of the cases contain useful inspiration for future work.
Some general conclusions have also been drawn from the case studies presented:
• waste quantities are continuously increasing, two third of the generated waste is landfilled, whereas waste recycling rates show a rather limited increase during the past years;
• solutions encouraging source separation, reducing landfilling, increasing recycling, and waste prevention have been developed in many EEA countries;
• continuous cooperation and exchange of technological and organisational experiences is needed to reach important progress in waste management;
• several cases of waste prevention have been successful, but are still applicable only on a local level;
• most of the cases present promising results and they may serve as inspiration for future initiatives on waste prevention.
26 Case studies on waste minimisation practices in Europe
Literature
Council Directive 96/61/EC of 24 September 1996 concerning integrated pollution prevention and control.
Council Resolution of 24 February 1997 on a Community strategy for waste management.
Council Resolution of the Council and the representatives of the governments of the Member States, meeting within the Council of 1 February 1993 on a Community programme of policy and action in relation to the environment and sustainable development (EU fifth environmental action programme: ‘Towards sustainability’).
Miljøstyrelsen, 2000. Debatoplæg om affaldsforebyggelse i Danmark.
(The Danish EPA, 2000. Introduction to a debate on waste prevention in Denmark (in Danish only).
Miljøstyrelsen, 2000. Affaldsforebyggelse i Danmark – status for den danske indsats.
(The Danish EPA, 2000: Waste prevention in Denmark – status (in Danish only).
Ernst & Young, 2000. Developing the foundation for integrated product policy in the EU. DG Environment, European Commission, 23 June 2000.
European Commission, 7 February 2001: A Green Paper on an integrated product policy.
European Commission, 24 January 2001: Proposal for the sixth environment action programme, 2001–10.
European Environment Agency, 1999. Baseline projections of selected waste streams. Development of a methodology, ETC/W Technical report No 28.
European Environment Agency, 1999. Environment in the European Union at the turn of the century, Environmental assessment report No 2.
European Environment Agency, 2000: Environmental signals 2000. European Environment Agency regular indicator report, Environmental assessment report No 6.
European Environment Agency, 2001. Biodegradable municipal waste management in Europe, ETC/W topic report (to be published).
European Environmental Bureau, 1999. Seminar on waste prevention, 25 June 1999, Brussels. Seminar reader.
OECD, 2000. Design, implementation and evaluation of strategic waste prevention programmes, government self-assessment guide.
Öko-institut. 1999. Waste prevention and minimisation. Darmstadt 29 July 1999.
Annex 1: 10 cases on waste minimisation 27
Annex 1:10 cases on waste minimisation
11. Austria: Minimisation of the landfilling of biodegradable municipal waste
12. Austria: End-of-life vehicles
13. Denmark: Landfill tax on construction and demolition waste
14. Denmark: Weight-related collection schemes for household waste
15. Germany: Producer responsibility for packaging waste
16. Greece: Minimisation of packaging waste
17. Ireland: Cleaner production pilot demonstration programme
18. Netherlands: Organic household waste action programme
19. Sweden: Producer responsibility for packaging waste
10. UK: Envirowise — waste minimisation programme
28 Case studies on waste minimisation practices in Europe
1. Austria: minimisation of the landfilling of biodegradable municipal waste
1.1. Introduction
In Austria, the two principal routes for diversion of waste away from landfill has been recycling (mainly for separately collected paper and paperboard) and composting (mainly for separately collected food and garden waste). The primary initiatives are the landfill ordinance, which sets rules for the landfilling of waste, and the ordinance on collection of biodegradable waste from households.
1.2. Description of the initiative
The target is to minimise the amount of biodegradable waste going to landfills. This is obtained by recycling, separate collection of biological waste and treatment of residual waste. The targets for the EU Landfill Directive (99/31/EC) have already been met, with approximately 20 % of the biodegradable municipal waste going to landfills in 1995 and 1996. With the implementation of the landfill ordinance, the target is that by 2004 all municipal solid waste (with few exceptions) will have to be treated mechanical-biologically or by incineration.
1.3. Use of instruments
The following measures have been taken to minimise the amount of biodegradable waste going to landfills:
• ordinance on the separate collection of bio-waste;
• landfill ordinance (pre-treatment of wastes with organic content exceeding 5 %);
• act on the clean-up of contaminated sites (landfill taxes);
• packaging ordinance (mandatory take-back and reuse or recovery of packaging materials);
• national policy in relation to the incineration with energy recovery.
The ordinance on the separate collection of bio-wasteThe ordinance on separate collection of biological waste (16) came into force on 1 January 1995. The ordinance forms the legal obligation on municipalities to separately collect and treat organic waste from households. The ordinance defines those types of biodegradable waste, which are to be collected separately (unless they are composted in the immediate vicinity of a household or business) (17).
As a consequence of the bio-waste ordinance, a treatment capacity for biodegradable waste of more than 1 million tonnes/year has been established:
• almost 500 plants for the treatment of biodegradable waste from separate collection of organic waste from households, pruning, and grass (total capacity of at least 763 000 tonnes per year);
• nine plants for mechanical-biological pre-treatment of sewage sludge, residual waste from composting plants, etc., (total capacity of at least 303 000 tonnes per year).
The landfill ordinanceThis came into force on 1 January 1997. Owners of existing landfills had to decide by 1 January 1998 whether to adjust their landfill to the requirements according to a step-by-step plan or to close their landfill before 1 July 1999.
The ordinance sets limit values for the overall content of pollutants with respect to waste to be landfilled. The maximum content of organic carbon must not exceed 5 %.
Furthermore, regulations concerning the equipment of landfills depending on the nature of the landfill have been introduced. Four types of landfills have been established:
• excavated-soil landfills;• demolition-waste landfills;• residual-materials landfills;• mass-waste landfills.
(16) BiogeneVO, Fed. Law Gaz. No 68/1992.(17) Federal Ministry of Environment, Youth and Family Affairs (1998): ‘Federal waste management plan 1998’,
Vienna. p. 87.
Annex 1: 10 cases on waste minimisation 29
There are different requirements for each type of landfill in respect to site requirements, sealing, and treatment of gas from the landfill.
Clean-up of contaminated sites actAs an incentive for older landfills to a more rapid adaptation of the state-of-the-art technology, and to ensure suitable pre-treatment of waste, an amendment to the ‘Clean up of contaminated sites’ Act was passed in 1996. The act forms the legal basis for the so-called ’contaminated site contributions’, that is, taxes making possible the financing of the implementation of containment measures and the remediation of contaminated sites in Austria.
Previously, only the type of waste determined the size of the tax to be paid; now the equipment of the landfills on the one hand and the quality of waste on the other are the determining criteria. When waste is disposed in landfills conforming to the state-of-the-art technology (including fulfilment of waste quality requirements), the tax rates are lower than in not conforming landfills.
For landfills conforming to the state-of-the-art technology, the tax varies between EUR 7.3 and 21.8 per tonne (1 January 2001), while the tax varies between EUR 7.3 and 43.6 per tonne (1 January 2001) for non-conforming landfills.
1.4. Change in material flow
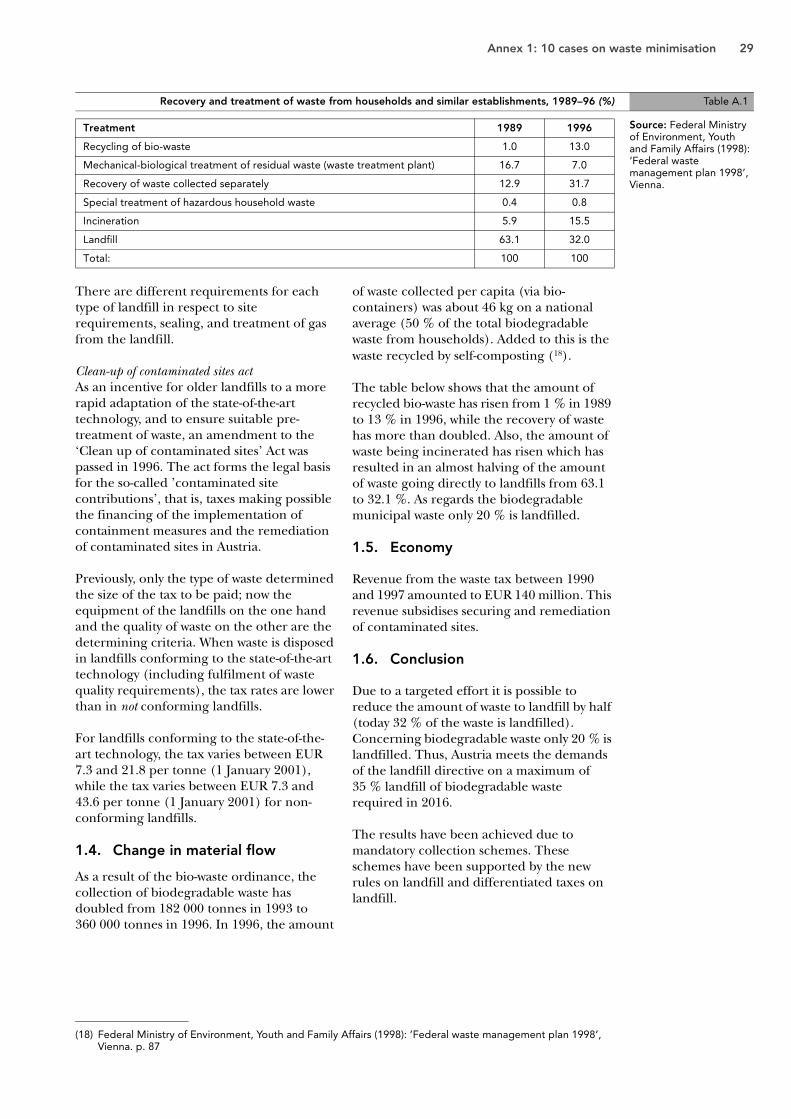
As a result of the bio-waste ordinance, the collection of biodegradable waste has doubled from 182 000 tonnes in 1993 to 360 000 tonnes in 1996. In 1996, the amount
of waste collected per capita (via bio-containers) was about 46 kg on a national average (50 % of the total biodegradable waste from households). Added to this is the waste recycled by self-composting (18).
The table below shows that the amount of recycled bio-waste has risen from 1 % in 1989 to 13 % in 1996, while the recovery of waste has more than doubled. Also, the amount of waste being incinerated has risen which has resulted in an almost halving of the amount of waste going directly to landfills from 63.1 to 32.1 %. As regards the biodegradable municipal waste only 20 % is landfilled.
1.5. Economy
Revenue from the waste tax between 1990 and 1997 amounted to EUR 140 million. This revenue subsidises securing and remediation of contaminated sites.
1.6. Conclusion
Due to a targeted effort it is possible to reduce the amount of waste to landfill by half (today 32 % of the waste is landfilled). Concerning biodegradable waste only 20 % is landfilled. Thus, Austria meets the demands of the landfill directive on a maximum of 35 % landfill of biodegradable waste required in 2016.
The results have been achieved due to mandatory collection schemes. These schemes have been supported by the new rules on landfill and differentiated taxes on landfill.
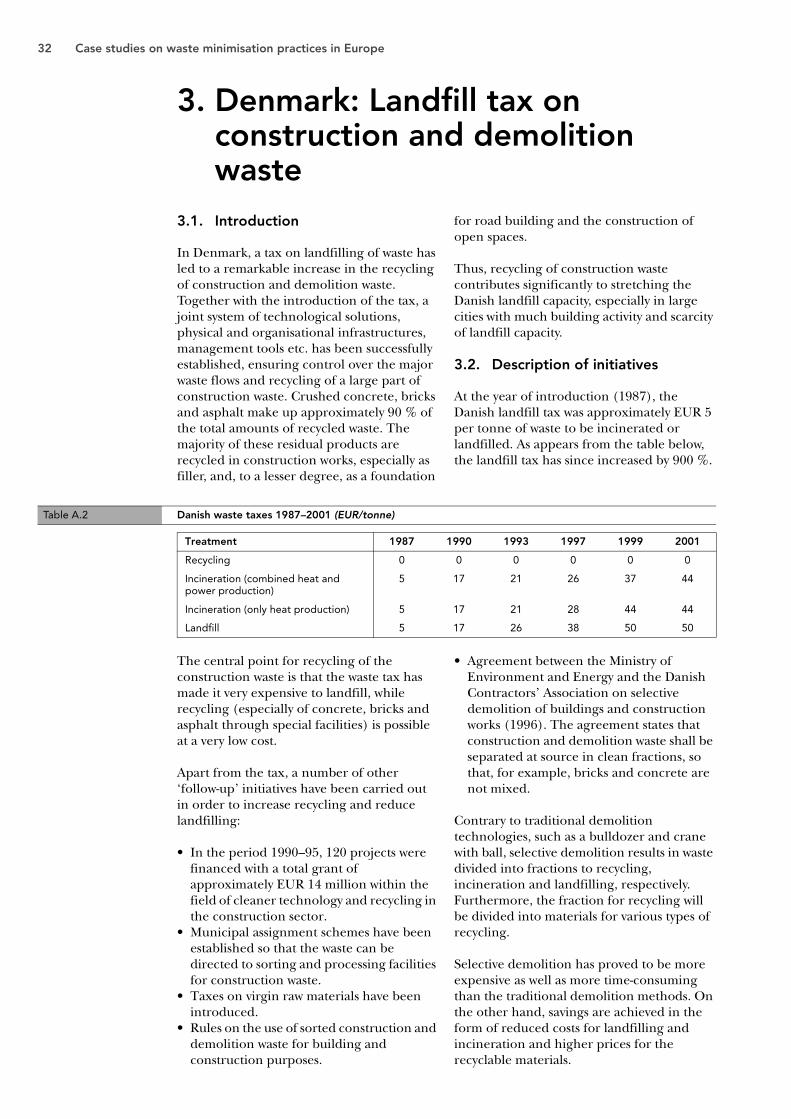
Recovery and treatment of waste from households and similar establishments, 1989–96 (%) Table A.1
Treatment 1989 1996
Recycling of bio-waste 1.0 13.0
Mechanical-biological treatment of residual waste (waste treatment plant) 16.7 7.0
Recovery of waste collected separately 12.9 31.7
Special treatment of hazardous household waste 0.4 0.8
Incineration 5.9 15.5
Landfill 63.1 32.0
Total: 100 100
Source: Federal Ministry of Environment, Youth and Family Affairs (1998): ’Federal waste management plan 1998’, Vienna.
(18) Federal Ministry of Environment, Youth and Family Affairs (1998): ’Federal waste management plan 1998’, Vienna. p. 87
30 Case studies on waste minimisation practices in Europe
2. Austria: End-of-life vehicles
2.1. Introduction
The EU directive on end-of-life vehicles (ELV) was passed in September 2000 (19). The directive gives the Member States an obligation to ensure the collection and proper treatment of ELV (20). The costs related to the collection and treatment of ELV are mainly to be paid by the producers of the vehicles.
In Austria, most of the conditions of the directive are already fulfilled. Since 1992, Austria has had a programme on the take-back of ELV. The programme is a voluntary agreement between the motor vehicle industry, the Federal Ministry of the Economy and the Federal Ministry of Environment, Youth and Family Affairs.
2.2. Description of the initiative
As a result of the agreement, Austrian ELV are free of charge taken back from the customer upon simultaneous purchase of a new or a used vehicle. This agreement originally expired in 1995, but was subsequently extended for an indefinite period of time and further expanded by additions to prevent improper disposal.
The expansion concerns in particular:
• the establishment of ’minimum requirements for the recovery of ELV’;
• issuing of a certificate of proof of recovery for the vehicles final owner.
In order to be approved as an official receiving facility for ELV, companies have to sign the voluntary agreement. A total of 1 325 Austrian companies had signed the agreement in 1999.
Currently, the agreement’s expanded contents have not been sufficiently implemented and documented.
2.3. Change in material flow
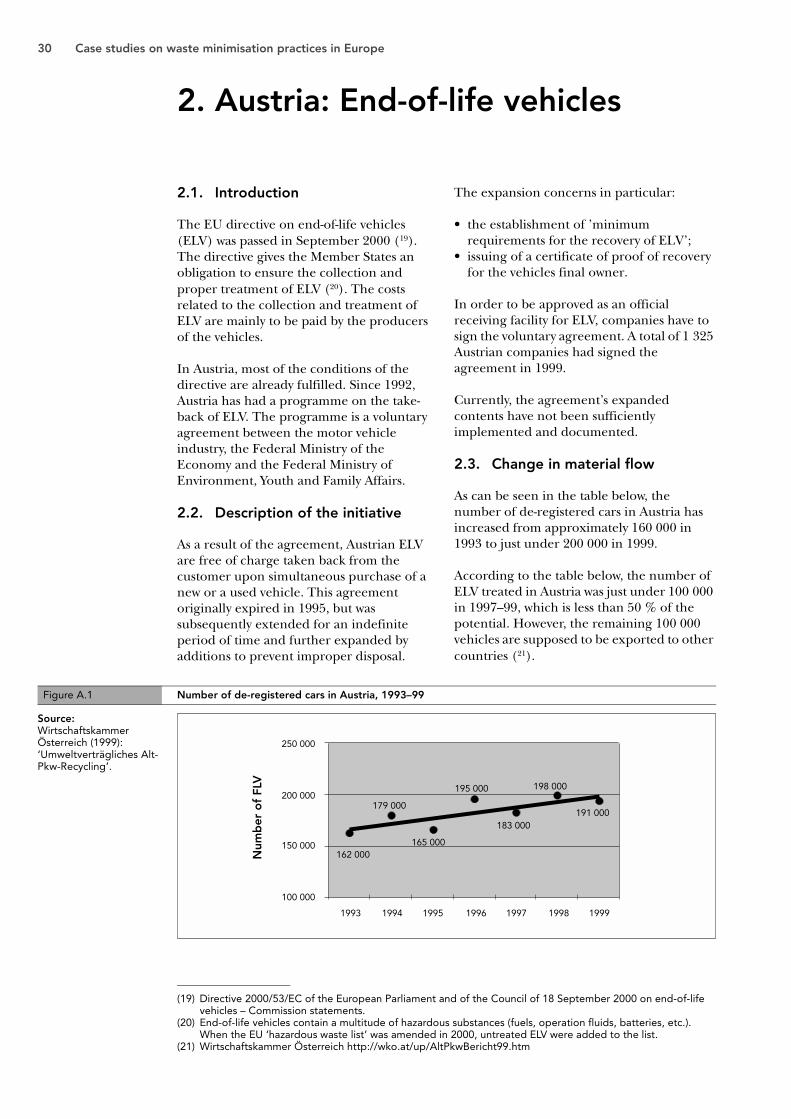
As can be seen in the table below, the number of de-registered cars in Austria has increased from approximately 160 000 in 1993 to just under 200 000 in 1999.
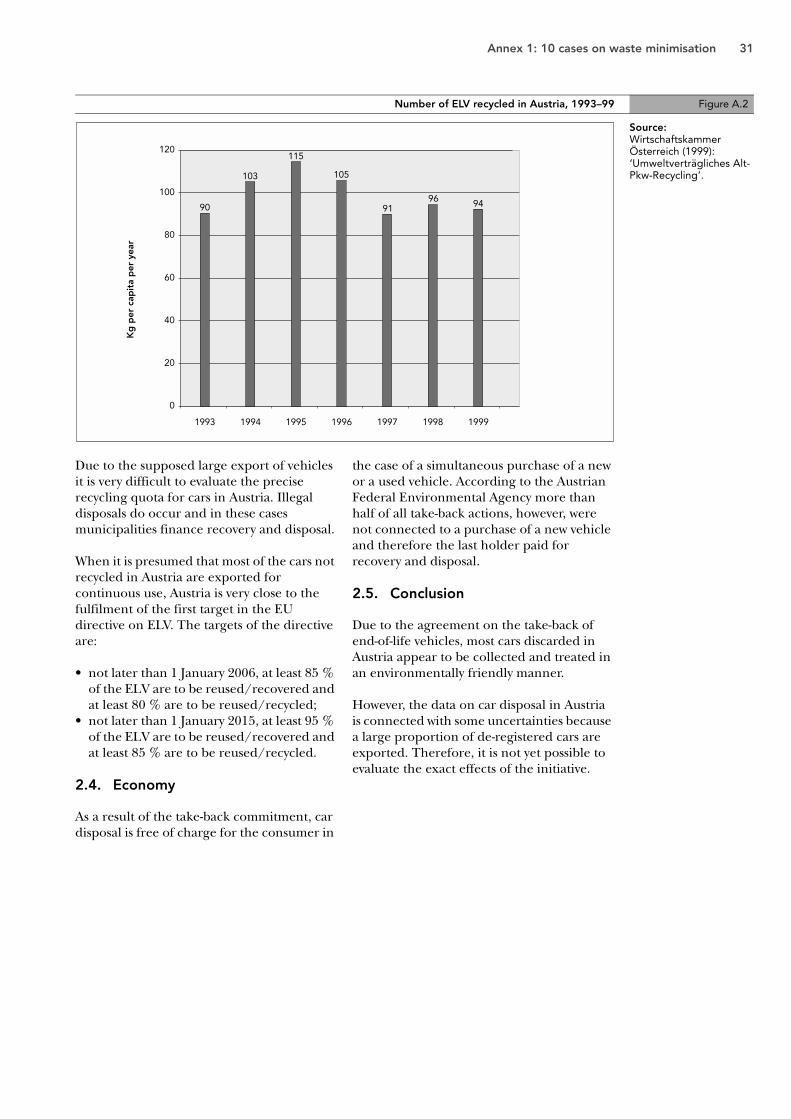
According to the table below, the number of ELV treated in Austria was just under 100 000 in 1997–99, which is less than 50 % of the potential. However, the remaining 100 000 vehicles are supposed to be exported to other countries (21).
(19) Directive 2000/53/EC of the European Parliament and of the Council of 18 September 2000 on end-of-life vehicles – Commission statements.
(20) End-of-life vehicles contain a multitude of hazardous substances (fuels, operation fluids, batteries, etc.). When the EU ‘hazardous waste list’ was amended in 2000, untreated ELV were added to the list.
(21) Wirtschaftskammer Österreich http://wko.at/up/AltPkwBericht99.htm
Figure A.1 Number of de-registered cars in Austria, 1993–99
Source: Wirtschaftskammer Österreich (1999): ‘Umweltverträgliches Alt-Pkw-Recycling’.
195 000
179 000
162 000
1993
100 000
150 000
200 000
250 000
Num
ber
of
FLV
1994 1995 1996 1997 1998 1999
165 000
183 000191 000
198 000
Annex 1: 10 cases on waste minimisation 31
Due to the supposed large export of vehicles it is very difficult to evaluate the precise recycling quota for cars in Austria. Illegal disposals do occur and in these cases municipalities finance recovery and disposal.
When it is presumed that most of the cars not recycled in Austria are exported for continuous use, Austria is very close to the fulfilment of the first target in the EU directive on ELV. The targets of the directive are:
• not later than 1 January 2006, at least 85 % of the ELV are to be reused/recovered and at least 80 % are to be reused/recycled;
• not later than 1 January 2015, at least 95 % of the ELV are to be reused/recovered and at least 85 % are to be reused/recycled.
2.4. Economy
As a result of the take-back commitment, car disposal is free of charge for the consumer in
the case of a simultaneous purchase of a new or a used vehicle. According to the Austrian Federal Environmental Agency more than half of all take-back actions, however, were not connected to a purchase of a new vehicle and therefore the last holder paid for recovery and disposal.
2.5. Conclusion
Due to the agreement on the take-back of end-of-life vehicles, most cars discarded in Austria appear to be collected and treated in an environmentally friendly manner.
However, the data on car disposal in Austria is connected with some uncertainties because a large proportion of de-registered cars are exported. Therefore, it is not yet possible to evaluate the exact effects of the initiative.
Number of ELV recycled in Austria, 1993–99 Figure A.2
Source: Wirtschaftskammer Österreich (1999): ‘Umweltverträgliches Alt-Pkw-Recycling’.
32 Case studies on waste minimisation practices in Europe
3. Denmark: Landfill tax on construction and demolition waste
3.1. Introduction
In Denmark, a tax on landfilling of waste has led to a remarkable increase in the recycling of construction and demolition waste. Together with the introduction of the tax, a joint system of technological solutions, physical and organisational infrastructures, management tools etc. has been successfully established, ensuring control over the major waste flows and recycling of a large part of construction waste. Crushed concrete, bricks and asphalt make up approximately 90 % of the total amounts of recycled waste. The majority of these residual products are recycled in construction works, especially as filler, and, to a lesser degree, as a foundation
for road building and the construction of open spaces.
Thus, recycling of construction waste contributes significantly to stretching the Danish landfill capacity, especially in large cities with much building activity and scarcity of landfill capacity.
3.2. Description of initiatives
At the year of introduction (1987), the Danish landfill tax was approximately EUR 5 per tonne of waste to be incinerated or landfilled. As appears from the table below, the landfill tax has since increased by 900 %.
The central point for recycling of the construction waste is that the waste tax has made it very expensive to landfill, while recycling (especially of concrete, bricks and asphalt through special facilities) is possible at a very low cost.
Apart from the tax, a number of other ‘follow-up’ initiatives have been carried out in order to increase recycling and reduce landfilling:
• In the period 1990–95, 120 projects were financed with a total grant of approximately EUR 14 million within the field of cleaner technology and recycling in the construction sector.
• Municipal assignment schemes have been established so that the waste can be directed to sorting and processing facilities for construction waste.
• Taxes on virgin raw materials have been introduced.
• Rules on the use of sorted construction and demolition waste for building and construction purposes.
• Agreement between the Ministry of Environment and Energy and the Danish Contractors’ Association on selective demolition of buildings and construction works (1996). The agreement states that construction and demolition waste shall be separated at source in clean fractions, so that, for example, bricks and concrete are not mixed.
Contrary to traditional demolition technologies, such as a bulldozer and crane with ball, selective demolition results in waste divided into fractions to recycling, incineration and landfilling, respectively. Furthermore, the fraction for recycling will be divided into materials for various types of recycling.
Selective demolition has proved to be more expensive as well as more time-consuming than the traditional demolition methods. On the other hand, savings are achieved in the form of reduced costs for landfilling and incineration and higher prices for the recyclable materials.
Table A.2 Danish waste taxes 1987–2001 (EUR/tonne)
Treatment 1987 1990 1993 1997 1999 2001
Recycling 0 0 0 0 0 0
Incineration (combined heat and power production)
5 17 21 26 37 44
Incineration (only heat production) 5 17 21 28 44 44
Landfill 5 17 26 38 50 50

Annex 1: 10 cases on waste minimisation 33
The goals for construction and demolition waste according to the Danish Government’s waste management plan for the period 1998–2004, referred to as Waste 21, are:
• 90 % recycling;• sorting and separate collection of
environmentally hazardous types of waste;• enhanced use of environmentally sound
design.
3.3. Change in material flow
A high waste tax involves a risk of illegal disposal. However, nothing indicates that large-scale illegal disposal has taken place in Denmark.
Since the introduction of the waste tax a substantial increase in recycling rate has occurred:
3.4. Economy
Enterprises with large amounts of construction waste can achieve considerable savings by prioritising sorting and recycling instead of landfilling. The present tax on landfilling permits savings of approximately
EUR 40 to 47 per tonne by recycling instead of landfilling the waste.
Below, the typical gate fees and selling prices for the most important fractions in terms of amounts of recyclable construction waste are shown.
Based on price lists from receiver/treatment facilities, October 2000.
The above gate fees for construction waste for recycling should be compared with
landfill rates of EUR 50 to 80 per tonne.
Based on price lists from receiver/treatment facilities, October 2000.
For recyclable building materials, as for instance floorboards, timber, doors, windows, sanitary appliances etc., the selling price at scrap dealers and demolition contractors corresponds approximately to half the price for similar new materials.
3.5. Conclusion
The Danish waste tax has created a market for recycling of construction and demolition waste. The relation between the development in recycling and in the waste tax for landfilling is seen in the figure below. The taxincrease from EUR 5 to 17 per tonne has increased in the recycling rate from 25 to nearly 80 %.
Recycling of construction and demolition waste in Denmark 1990–99 Table A.3
1990 1991 1992 1993 1994 1995 1996 1997 1998 1999
Recycling rate ( %) 25 50 75 77 84 85 89 92 90 90
Source: 1990–93: Rendan’s survey on construction and demolition waste; 1994–99: Danish EPA.
Approximate treatment fees at crushing facilities by the end of 2000 Table A.4
Type Price in EUR per tonne
Pure asphalt EUR 11 to12 per tonne
Mixed asphalt/concrete EUR 9 to 16 per tonne
Pure concrete EUR 5.5 to 16 per tonne (depending on reinforcement)
Pure bricks Approximately EUR 8 per tonne
Mixed bricks/concrete EUR 8 to 17.5 per tonne (depending on reinforcement)
Selling prices for processed construction and demolition waste by the end of 2000 Table A.5
Type Price in EUR per tonne
Crushed asphalt/concrete EUR 7
Crushed concrete Approximately EUR 8
Mixed bricks/concrete Approximately EUR 4
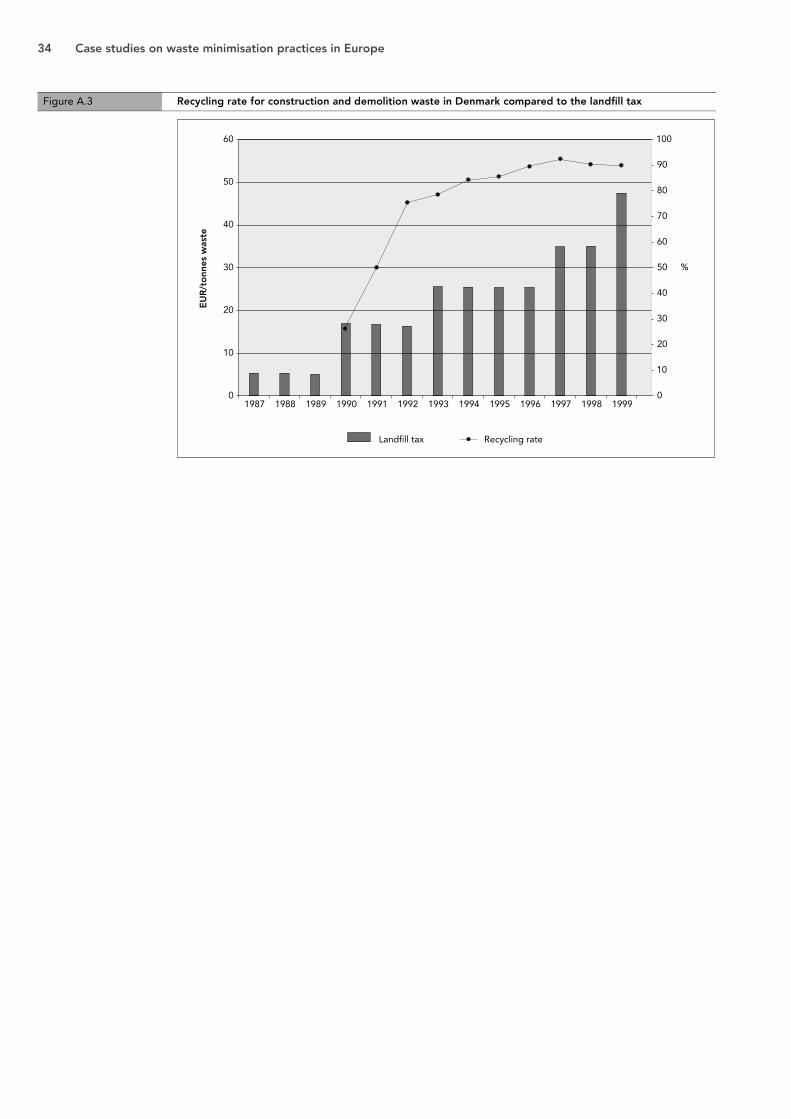
34 Case studies on waste minimisation practices in Europe
Figure A.3 Recycling rate for construction and demolition waste in Denmark compared to the landfill tax
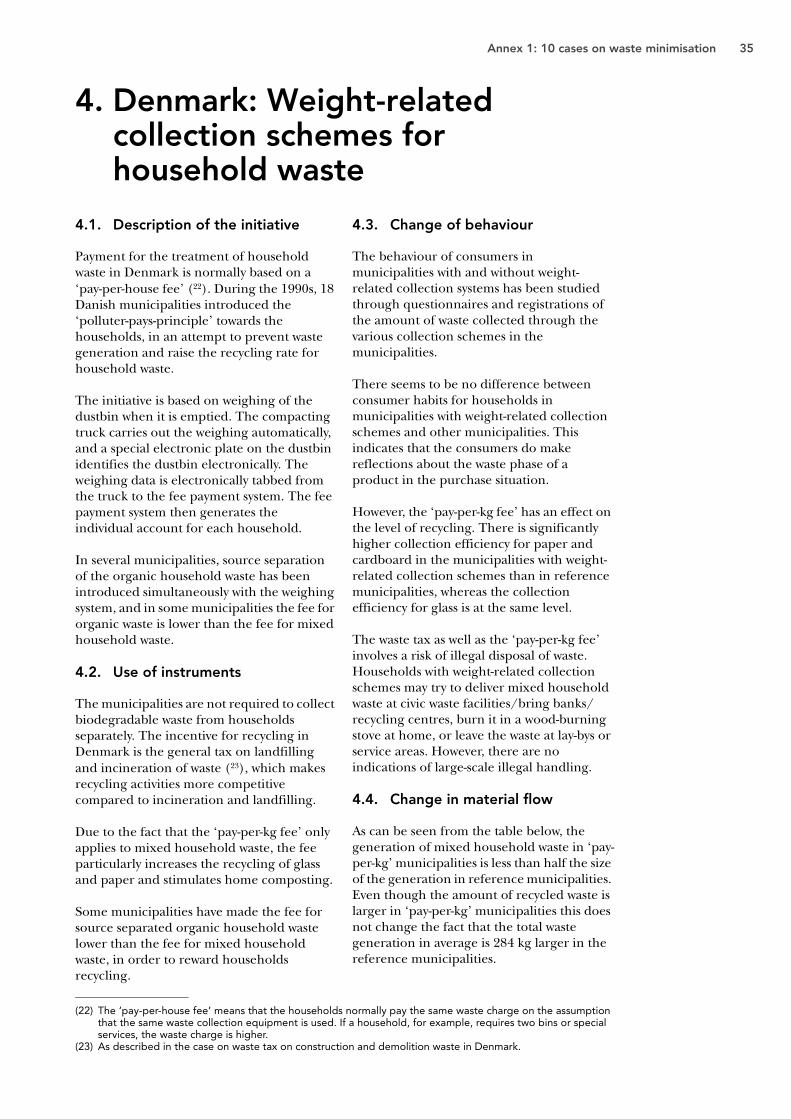
Annex 1: 10 cases on waste minimisation 35
4. Denmark: Weight-related collection schemes for household waste
4.1. Description of the initiative
Payment for the treatment of household waste in Denmark is normally based on a ‘pay-per-house fee’ (22). During the 1990s, 18 Danish municipalities introduced the ‘polluter-pays-principle’ towards the households, in an attempt to prevent waste generation and raise the recycling rate for household waste.
The initiative is based on weighing of the dustbin when it is emptied. The compacting truck carries out the weighing automatically, and a special electronic plate on the dustbin identifies the dustbin electronically. The weighing data is electronically tabbed from the truck to the fee payment system. The fee payment system then generates the individual account for each household.
In several municipalities, source separation of the organic household waste has been introduced simultaneously with the weighing system, and in some municipalities the fee for organic waste is lower than the fee for mixed household waste.
4.2. Use of instruments
The municipalities are not required to collect biodegradable waste from households separately. The incentive for recycling in Denmark is the general tax on landfilling and incineration of waste (23), which makes recycling activities more competitive compared to incineration and landfilling.
Due to the fact that the ‘pay-per-kg fee’ only applies to mixed household waste, the fee particularly increases the recycling of glass and paper and stimulates home composting.
Some municipalities have made the fee for source separated organic household waste lower than the fee for mixed household waste, in order to reward households recycling.
4.3. Change of behaviour
The behaviour of consumers in municipalities with and without weight-related collection systems has been studied through questionnaires and registrations of the amount of waste collected through the various collection schemes in the municipalities.
There seems to be no difference between consumer habits for households in municipalities with weight-related collection schemes and other municipalities. This indicates that the consumers do make reflections about the waste phase of a product in the purchase situation.
However, the ‘pay-per-kg fee’ has an effect on the level of recycling. There is significantly higher collection efficiency for paper and cardboard in the municipalities with weight-related collection schemes than in reference municipalities, whereas the collection efficiency for glass is at the same level.
The waste tax as well as the ‘pay-per-kg fee’ involves a risk of illegal disposal of waste. Households with weight-related collection schemes may try to deliver mixed household waste at civic waste facilities/bring banks/recycling centres, burn it in a wood-burning stove at home, or leave the waste at lay-bys or service areas. However, there are no indications of large-scale illegal handling.
4.4. Change in material flow
As can be seen from the table below, the generation of mixed household waste in ‘pay-per-kg’ municipalities is less than half the size of the generation in reference municipalities. Even though the amount of recycled waste is larger in ‘pay-per-kg’ municipalities this does not change the fact that the total waste generation in average is 284 kg larger in the reference municipalities.
(22) The ‘pay-per-house fee’ means that the households normally pay the same waste charge on the assumption that the same waste collection equipment is used. If a household, for example, requires two bins or special services, the waste charge is higher.
(23) As described in the case on waste tax on construction and demolition waste in Denmark.

36 Case studies on waste minimisation practices in Europe
The difference in the waste amounts may be explained by overestimated amounts of mixed household waste from the reference municipalities. This is the case if the mixed household waste contains waste other than the waste from the daily household activities, that is, garden waste, bulky waste, commercial waste, and similar items that are covered by other collection schemes. In municipalities with ‘pay-per-kg-fees’ this waste will only rarely end up with the mixed household waste, as households will attempt to avoid the fee by reducing the amounts of mixed waste. In the reference municipalities the waste often ends up with the mixed waste if there is sufficient space in the dustbin.
4.5. Economy
The average household expenses for waste collection fees in municipalities with the weighing system tend to be in the lower end of the average fees in Denmark.
Households in municipalities with weigh-based systems usually pay a fixed fee including expenses for collection and recycling of glass and paper/cardboard, recycling stations, handling of hazardous waste etc. and a certain number of ‘free kilos’ per collection (usually 5 kg per 14 days). In addition to this a ‘fee-per-kg’ for the kilos exceeding the ‘free kilos’ is paid. The total fee per household is EUR 150 to 230 per year.
In municipalities with weight-related collection schemes, most citizens believe that a weight-related fee is an advantage to them, and they believe a weight-related system is the fairest way of calculating the refuse collection fee.
The majority of municipalities with weight-related systems report an increase in administrative efforts since the introduction of the system. It is mainly the activities of writing out the individual accounts for each household (once a year) and making up the account in case of change of addresses (when people move) that cost the extra hours.
4.6. Conclusion
The introduction of the Danish payment system based on the amount of waste delivered has clearly reduced the amount of mixed household waste and more waste is collected through recycling schemes. The preliminary surveys show that ‘pay-per-kg fees’ have not changed consumer behaviour and no reduction (prevention) in the waste generation can therefore be expected. Nevertheless, the households in municipalities with ‘pay-per-kg fees’ deliver less waste than similar municipalities.
The citizens in municipalities with ‘pay-per-kg fees’ are generally satisfied with the system and the total fees tend to be lower in these municipalities.
Table A.6 Waste generation in ‘pay-per-kg’ municipalities and reference municipalities
Fraction Average households in‘pay-per-kg’ municipalities
Average households in reference municipalities
Mixed household waste 325 kg/year 729 kg/year
Paper and cardboard 105 kg/year 67 kg/year
Glass 38 kg/year 36 kg/year
Biodegradable waste 124 kg/year 44 kg/year
Total 592 kg/year 876 kg/year
Source: Miljøstyrelsen (2000): ‘Fordele og ulemper ved gebyrdifferentierede indsamlingssystemer for husholdningsaffald’, Miljøprojekt No 576.

Annex 1: 10 cases on waste minimisation 37
5. Germany: Producer responsibility for packaging waste
5.1. Introduction
Duales System Deutschland AG (DSD) was founded in 1990 in anticipation of the packaging ordinance, which came into force in 1991. The main aim was to increase recycling of sales packaging waste from private households and thereby to minimise the amount of waste going to landfills. The new system had to be harmonised with the existing municipal collection system for household waste.
DSD organises the collection, sorting and recycling of sales packaging materials. A total of 537 waste companies contracted by DSD are responsible for the collection, sorting and recycling activities. The system is financed by means of licence fees, where the producers of the goods pay a licence according to the weight/volume of the packaging used for the products. Thereby they obtain the right to mark their products with ‘the green dot’ symbol.
Plastics, composites, aluminium and tinplate are put together in the same yellow sack, container or bin, and the materials are collected by the kerbside. In some regions, paper is also collected in this system. The yellow sack requires subsequent sorting by hand or machine. Glass, cardboard and paper is collected by means of a ‘bring system’, where the consumers bring the materials to containers in the district.
5.2. Description of the initiative
The main driver of the system is the packaging ordinance, which states that producers and importers are obliged to
collect and recycle the packaging waste from their products. By joining DSD the producers and importers can be released from individual take-back obligations. When joining a collection scheme the company pays a licence fee based on the weight and volume of the applied packaging material. The fee encourages the companies to minimise their use of packaging.
DSD only takes care of sales packaging, but the packaging ordinance is also dealing with transport packaging. The handling of transport packaging is organised by other companies.
5.3. Change of behaviour
The fact that the companies pay licence according to weight and volume makes an incentive to reduce the weight of packaging. The companies have therefore actively tried new methods for the packaging of their products. For instance, the weight of tissue packs, beverage cartons, glass bottles and beverage cans has dropped since the introduction of the DSD. Similarly, more refill packs and concentrates are now available.
5.4. Change in material flow
Packaging consumption decreased from 6.9 to 6.0 million tonnes between 1991 and 1997. In the same period, increasing amounts of packaging were collected and returned to the production loop. The table shows the development in the amount of recovered materials through DSD. It can be seen that the recycled amount of all packaging materials has risen.
Packaging collected by DSD (quantity in 1 000 tonnes) Table A.7
Packaging material 1992 1993 1994 1995 1996 1997 1998 1999
Glass 510 2 390 2 470 2 570 2 690 2 740 2 700 2 710
Paper/cardboard 300 970 1 180 1 260 1 320 1 370 1 420 1 480
Plastics 41 281 461 504 535 567 600 610
Tin 29 249 354 259 302 312 375 322
Aluminium >1 9 29 32 36 40 43 37
Composites 5 52 78 296 445 420 345 391
Total 920 3 940 4 570 4 920 5 320 5 450 5 480 5 550
Source: http://www.gruener-punkt.de
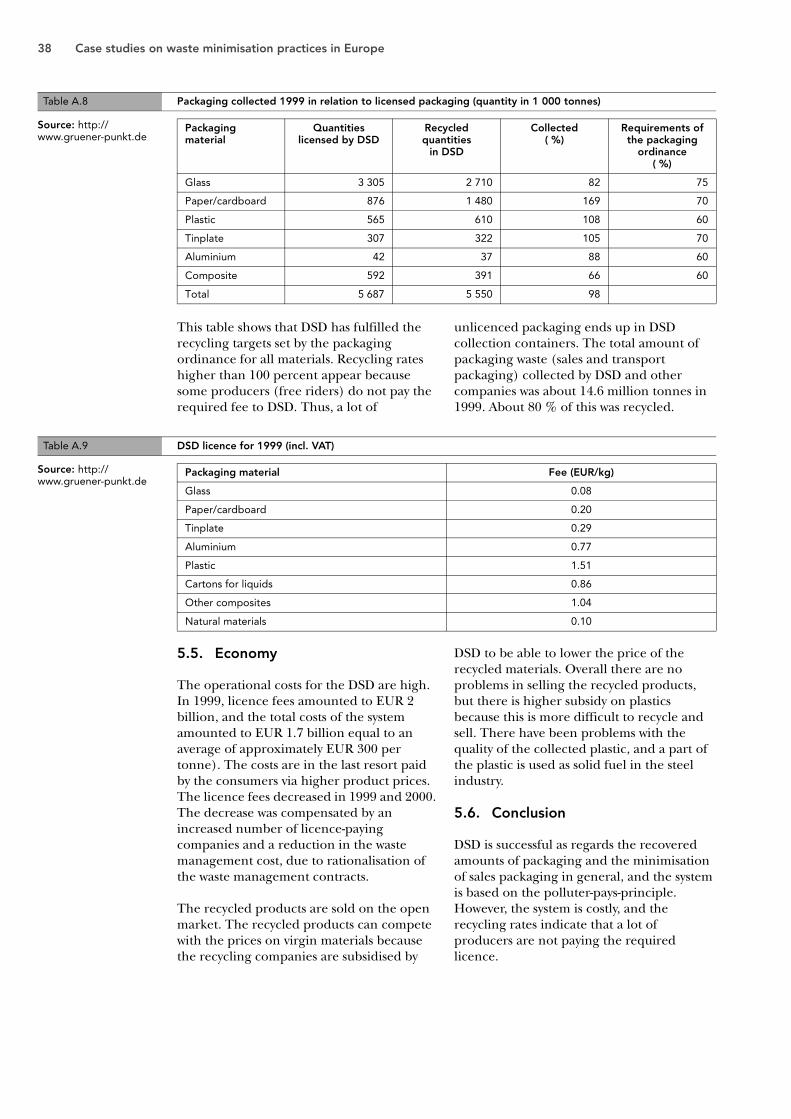
38 Case studies on waste minimisation practices in Europe
This table shows that DSD has fulfilled the recycling targets set by the packaging ordinance for all materials. Recycling rates higher than 100 percent appear because some producers (free riders) do not pay the required fee to DSD. Thus, a lot of
unlicenced packaging ends up in DSD collection containers. The total amount of packaging waste (sales and transport packaging) collected by DSD and other companies was about 14.6 million tonnes in 1999. About 80 % of this was recycled.
5.5. Economy
The operational costs for the DSD are high. In 1999, licence fees amounted to EUR 2 billion, and the total costs of the system amounted to EUR 1.7 billion equal to an average of approximately EUR 300 per tonne). The costs are in the last resort paid by the consumers via higher product prices. The licence fees decreased in 1999 and 2000. The decrease was compensated by an increased number of licence-paying companies and a reduction in the waste management cost, due to rationalisation of the waste management contracts.
The recycled products are sold on the open market. The recycled products can compete with the prices on virgin materials because the recycling companies are subsidised by
DSD to be able to lower the price of the recycled materials. Overall there are no problems in selling the recycled products, but there is higher subsidy on plastics because this is more difficult to recycle and sell. There have been problems with the quality of the collected plastic, and a part of the plastic is used as solid fuel in the steel industry.
5.6. Conclusion
DSD is successful as regards the recovered amounts of packaging and the minimisation of sales packaging in general, and the system is based on the polluter-pays-principle. However, the system is costly, and the recycling rates indicate that a lot of producers are not paying the required licence.
Table A.8 Packaging collected 1999 in relation to licensed packaging (quantity in 1 000 tonnes)
Packaging material
Quantitieslicensed by DSD
Recycled quantities
in DSD
Collected( %)
Requirements of the packaging
ordinance( %)
Glass 3 305 2 710 82 75
Paper/cardboard 876 1 480 169 70
Plastic 565 610 108 60
Tinplate 307 322 105 70
Aluminium 42 37 88 60
Composite 592 391 66 60
Total 5 687 5 550 98
Source: http://www.gruener-punkt.de
Table A.9 DSD licence for 1999 (incl. VAT)
Packaging material Fee (EUR/kg)
Glass 0.08
Paper/cardboard 0.20
Tinplate 0.29
Aluminium 0.77
Plastic 1.51
Cartons for liquids 0.86
Other composites 1.04
Natural materials 0.10
Source: http://www.gruener-punkt.de

Annex 1: 10 cases on waste minimisation 39
6. Greece: Minimisation of packaging waste
6.1. Introduction
The programme is a voluntary initiative undertaken by several industries, such as the food industry, packaging industry, and chemical industry. The basic aim is to reduce packaging waste by redesigning the packaging and increasing recovery and recycling of packaging. The initiative also promotes the use of cleaner technology to cut energy costs. The programme started in 1994 and includes five municipalities in northern Athens. Now, more than 150 000 citizens participate. More than 300 tonnes of materials is recycled and recovered each month. The system was set up by HERRA (Hellenic Recovery Recycling Association). HERRA is a non-profit organisation, which was founded by Greek industries producing and distributing consumer goods and packaging materials.
6.2. Description of the initiative
• The programme has no particular targets. The objectives were:
• to organise and monitor the first multi-material packaging waste recovery project in Greece;
• to draw some conclusions concerning costs, behaviour of the public, the secondary materials market etc;
• to use this project as an example of the possible cooperation between industry and the participating municipalities, thus forming a compliance model for the forthcoming legislative measures;
• to prepare the Greek packaging chain for the liabilities that the related Greek law would create.
The participant is given a reusable bag for free and is asked to put the appropriate materials in it. Then he has to carry the bag to the nearest blue bin (for recyclables) and empty it. The materials collected are plastics,
glass, metals and paper. These bins are collected and the materials are hand-sorted and balled in a material recovery facility (MRF). It is sorted into 10 different products: three paper qualities, aluminium, steel, glass and four kinds of plastic.
This project is supported by a communication campaign (door-to-door visits, school seminars, radio and TV spots, etc.).
6.3. Change of behaviour
Almost 40 % of the served inhabitants participate regularly in the project. The project is well accepted by the public showing a strong interest in participation.
6.4. Change in material flow
Today, approximately 300 tonnes of recyclables are recovered from the MRF each month.
6.5. Economy
The collection schemes have no economic consequence for the households. HERRA covers all capital expenditure and finances the operating deficit of processing, approximately EUR 1 900 000, while each municipality covers the collection operating expenses. The per capita cost of the project is EUR 1.9 per year and served inhabitant for the collection, EUR 2.4 for processing and EUR 2.0 for capital expenditure. The following figure presents economic data in euro per recovered tonne in three 12-months periods.
The materials recovered from the recycling programme of Athens are easily sold. The recycling companies produce high quality secondary materials or recycle them for the production of new end products.
Prices of secondary materials recovered (September 1997) Table A.10
Material: Aluminium PET PVC PE PP/PS Paper Tin Glass
EUR/tonnes 1 100 97 59 59 59 65 29 9
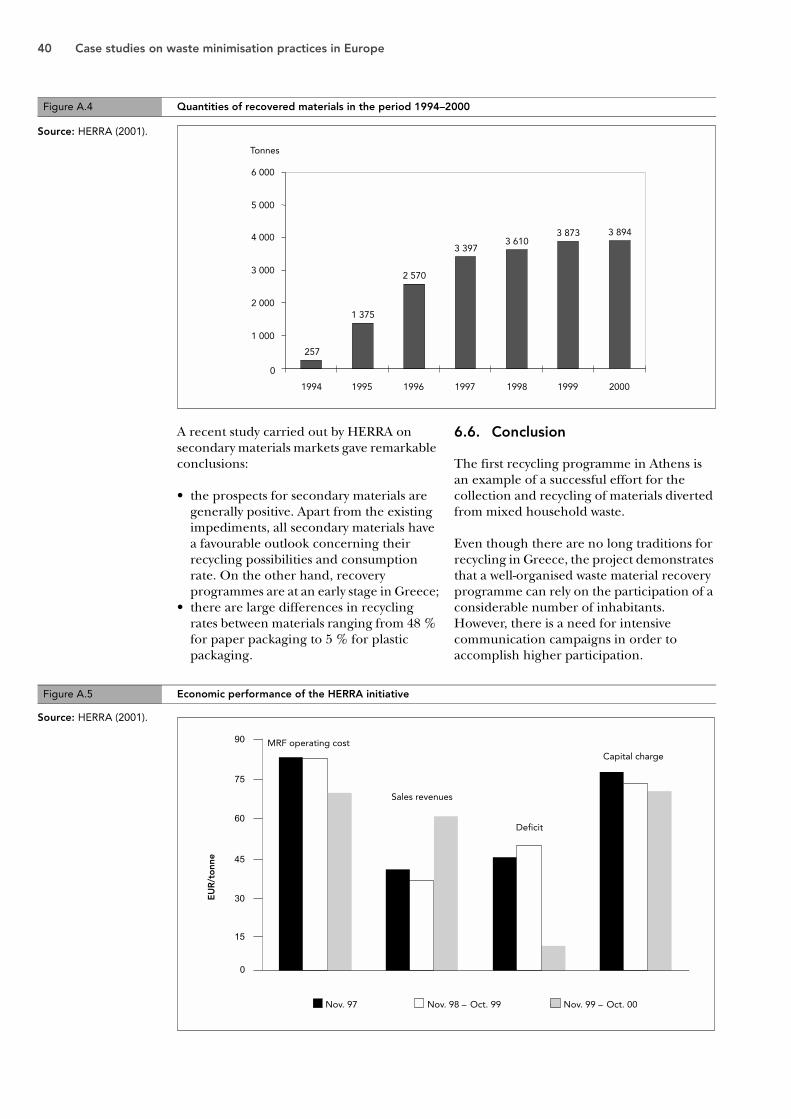
40 Case studies on waste minimisation practices in Europe
A recent study carried out by HERRA on secondary materials markets gave remarkable conclusions:
• the prospects for secondary materials are generally positive. Apart from the existing impediments, all secondary materials have a favourable outlook concerning their recycling possibilities and consumption rate. On the other hand, recovery programmes are at an early stage in Greece;
• there are large differences in recycling rates between materials ranging from 48 % for paper packaging to 5 % for plastic packaging.
6.6. Conclusion
The first recycling programme in Athens is an example of a successful effort for the collection and recycling of materials diverted from mixed household waste.
Even though there are no long traditions for recycling in Greece, the project demonstrates that a well-organised waste material recovery programme can rely on the participation of a considerable number of inhabitants. However, there is a need for intensive communication campaigns in order to accomplish higher participation.
Figure A.4 Quantities of recovered materials in the period 1994–2000
Source: HERRA (2001).
257
1 375
2 570
3 3973 610
3 873 3 894
0
1 000
2 000
3 000
4 000
5 000
6 000
1994 1995 1996 1997 1998 1999 2000
Tonnes
Figure A.5 Economic performance of the HERRA initiative
0
15
30
45
60
75
90
Nov. 97 Nov. 98 – Oct. 99 Nov. 99 – Oct. 00
MRF operating cost
Sales revenues
Deficit
Capital charge
EU
R/t
onn
e
Source: HERRA (2001).
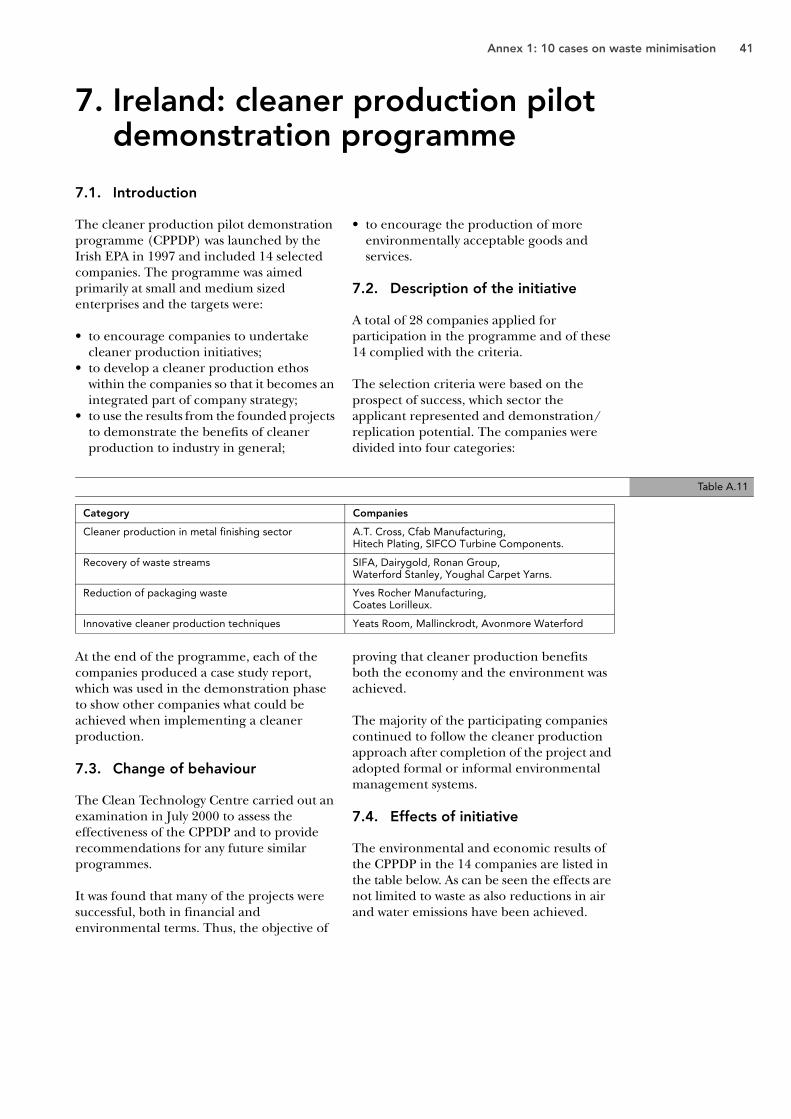
Annex 1: 10 cases on waste minimisation 41
7. Ireland: cleaner production pilot demonstration programme
7.1. Introduction
The cleaner production pilot demonstration programme (CPPDP) was launched by the Irish EPA in 1997 and included 14 selected companies. The programme was aimed primarily at small and medium sized enterprises and the targets were:
• to encourage companies to undertake cleaner production initiatives;
• to develop a cleaner production ethos within the companies so that it becomes an integrated part of company strategy;
• to use the results from the founded projects to demonstrate the benefits of cleaner production to industry in general;
• to encourage the production of more environmentally acceptable goods and services.
7.2. Description of the initiative
A total of 28 companies applied for participation in the programme and of these 14 complied with the criteria.
The selection criteria were based on the prospect of success, which sector the applicant represented and demonstration/replication potential. The companies were divided into four categories:
At the end of the programme, each of the companies produced a case study report, which was used in the demonstration phase to show other companies what could be achieved when implementing a cleaner production.
7.3. Change of behaviour
The Clean Technology Centre carried out an examination in July 2000 to assess the effectiveness of the CPPDP and to provide recommendations for any future similar programmes.
It was found that many of the projects were successful, both in financial and environmental terms. Thus, the objective of
proving that cleaner production benefits both the economy and the environment was achieved.
The majority of the participating companies continued to follow the cleaner production approach after completion of the project and adopted formal or informal environmental management systems.
7.4. Effects of initiative
The environmental and economic results of the CPPDP in the 14 companies are listed in the table below. As can be seen the effects are not limited to waste as also reductions in air and water emissions have been achieved.
Table A.11
Category Companies
Cleaner production in metal finishing sector A.T. Cross, Cfab Manufacturing,Hitech Plating, SIFCO Turbine Components.
Recovery of waste streams SIFA, Dairygold, Ronan Group,Waterford Stanley, Youghal Carpet Yarns.
Reduction of packaging waste Yves Rocher Manufacturing,Coates Lorilleux.
Innovative cleaner production techniques Yeats Room, Mallinckrodt, Avonmore Waterford
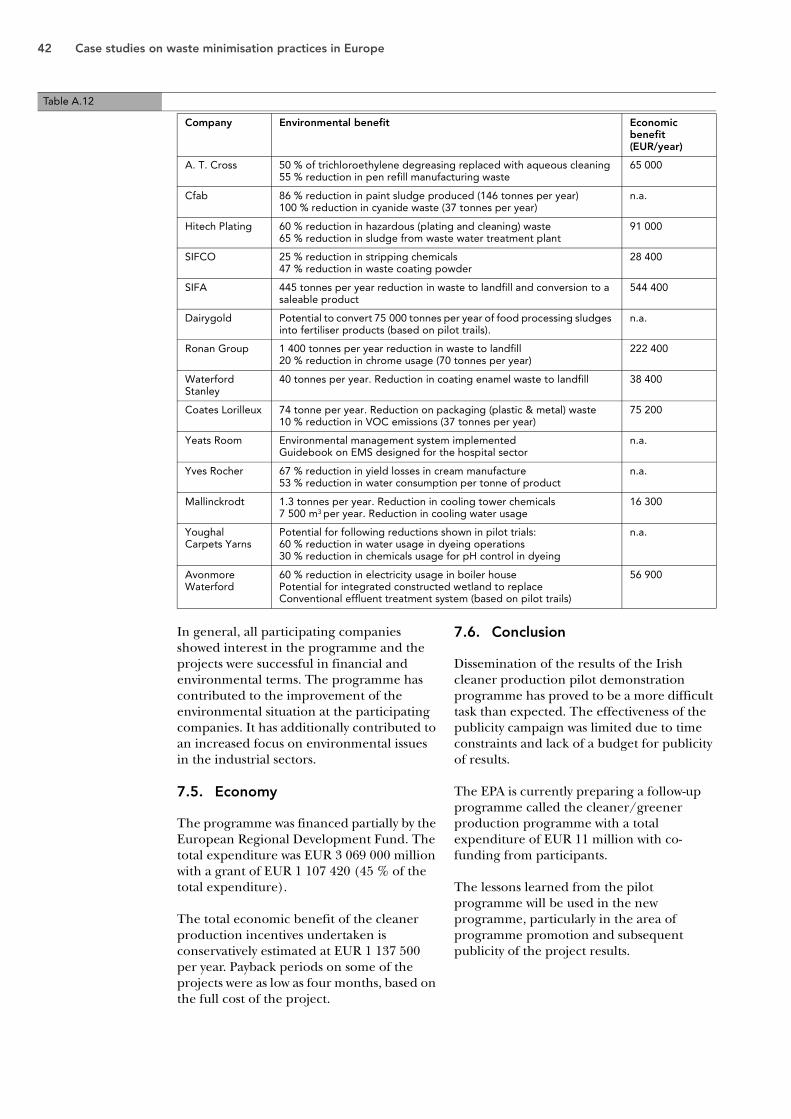
42 Case studies on waste minimisation practices in Europe
In general, all participating companies showed interest in the programme and the projects were successful in financial and environmental terms. The programme has contributed to the improvement of the environmental situation at the participating companies. It has additionally contributed to an increased focus on environmental issues in the industrial sectors.
7.5. Economy
The programme was financed partially by the European Regional Development Fund. The total expenditure was EUR 3 069 000 million with a grant of EUR 1 107 420 (45 % of the total expenditure).
The total economic benefit of the cleaner production incentives undertaken is conservatively estimated at EUR 1 137 500 per year. Payback periods on some of the projects were as low as four months, based on the full cost of the project.
7.6. Conclusion
Dissemination of the results of the Irish cleaner production pilot demonstration programme has proved to be a more difficult task than expected. The effectiveness of the publicity campaign was limited due to time constraints and lack of a budget for publicity of results.
The EPA is currently preparing a follow-up programme called the cleaner/greener production programme with a total expenditure of EUR 11 million with co-funding from participants.
The lessons learned from the pilot programme will be used in the new programme, particularly in the area of programme promotion and subsequent publicity of the project results.
Table A.12
Company Environmental benefit Economic benefit(EUR/year)
A. T. Cross 50 % of trichloroethylene degreasing replaced with aqueous cleaning55 % reduction in pen refill manufacturing waste
65 000
Cfab 86 % reduction in paint sludge produced (146 tonnes per year)100 % reduction in cyanide waste (37 tonnes per year)
n.a.
Hitech Plating 60 % reduction in hazardous (plating and cleaning) waste65 % reduction in sludge from waste water treatment plant
91 000
SIFCO 25 % reduction in stripping chemicals47 % reduction in waste coating powder
28 400
SIFA 445 tonnes per year reduction in waste to landfill and conversion to a saleable product
544 400
Dairygold Potential to convert 75 000 tonnes per year of food processing sludges into fertiliser products (based on pilot trails).
n.a.
Ronan Group 1 400 tonnes per year reduction in waste to landfill20 % reduction in chrome usage (70 tonnes per year)
222 400
Waterford Stanley
40 tonnes per year. Reduction in coating enamel waste to landfill 38 400
Coates Lorilleux 74 tonne per year. Reduction on packaging (plastic & metal) waste10 % reduction in VOC emissions (37 tonnes per year)
75 200
Yeats Room Environmental management system implementedGuidebook on EMS designed for the hospital sector
n.a.
Yves Rocher 67 % reduction in yield losses in cream manufacture53 % reduction in water consumption per tonne of product
n.a.
Mallinckrodt 1.3 tonnes per year. Reduction in cooling tower chemicals7 500 m3 per year. Reduction in cooling water usage
16 300
Youghal Carpets Yarns
Potential for following reductions shown in pilot trials:60 % reduction in water usage in dyeing operations30 % reduction in chemicals usage for pH control in dyeing
n.a.
Avonmore Waterford
60 % reduction in electricity usage in boiler housePotential for integrated constructed wetland to replaceConventional effluent treatment system (based on pilot trails)
56 900
Annex 1: 10 cases on waste minimisation 43
8. The Netherlands: organic household waste action programme
8.1. Introduction
Due to a high population density and lack of space for landfills, waste policy in the Netherlands has focused on waste prevention and recycling of any valuable components. This has lead to a very high degree of source separation of household waste. Paper/cardboard, glass, organic household waste, textiles, bulky waste, chemical waste and garden waste are collected and treated separately, and the participation amongst the households is as high as 80 to 90 %.
The organic household waste action programme was launched in 1991 (24). The main aim was to impose a duty on local authorities to collect organic household waste separately, as of 1 January 1994, and to create the necessary processing capacity in order to produce compost with a specified quality. In this way, the amount of waste going to landfills and incineration plants could be minimised.
During the years 1997–99, the amount of separately collected organic household waste was about 1 500 000 tonnes per year. This amount is processed into about 600 000 tonnes of saleable compost.
8.2. Initiatives
The following aims were set for the organic household waste action programme:
• a duty on local authorities from 1 January 1994 to collect organic household waste separately;
• to create a processing capacity of 750 000 tonnes as on 1 January 1994 and 1 000 000 tonnes as on 1 January 1995. By the end of 1994, the final goal was fixed at 1 600 000 tonnes based on new forecasts for organic household arising;
• to contribute to the reduction of CO2 emissions by employing fermentation (anaerobic digestion). The preliminary aim was a fermentation capacity of 300 000 tonnes of overall bio-waste in 1995;
• to produce ‘clean compost’’ with a technical and chemical composition that satisfies the requirements for compost as laid down in the order governing the quality and use of other organic fertilisers (BOOM).
The Environmental Management Act, which came into force in 1993, directs the local authorities to collect organic household waste separately. This is done in all municipalities in the Netherlands. About 75 % of the population participate in the system. In the centres of the old cities, technical problems remains concerning the placement of containers for organic household waste, and a few minor municipalities are trying out home composting.
The treatment of organic material is done by either aerobic (composting) or anaerobic (fermentation) techniques. Currently, the treatment of organic household waste in the Netherlands is done primarily by aerobic techniques. At the end of 1999, 23 composting plants and two fermentation plant were in operation. The composting capacity was 1 670 000 tonnes. An amount of 50 000 tonnes of the capacity is still in preparation. The fermentation capacity is 52 000 tonnes.
Since 1996, landfilling of organic waste from households has been prohibited.
8.3. Change in material flow
As can be seen in the table below the amount of composted organic household waste has risen since 1991. The total amount of organic household waste produced in 1999 was 2 835 000 tonnes of which 1 460 000 tonnes were collected (approximately 58 %) and processed into 620 000 tonnes of compost.
The compost generally meets the standards set for clean compost by the order governing the quality and use of other organic fertilisers (BOOM), and the target in the organic household waste action programme has been met.
(24) The programme terminated at the end of 1994 as the main targets were met.
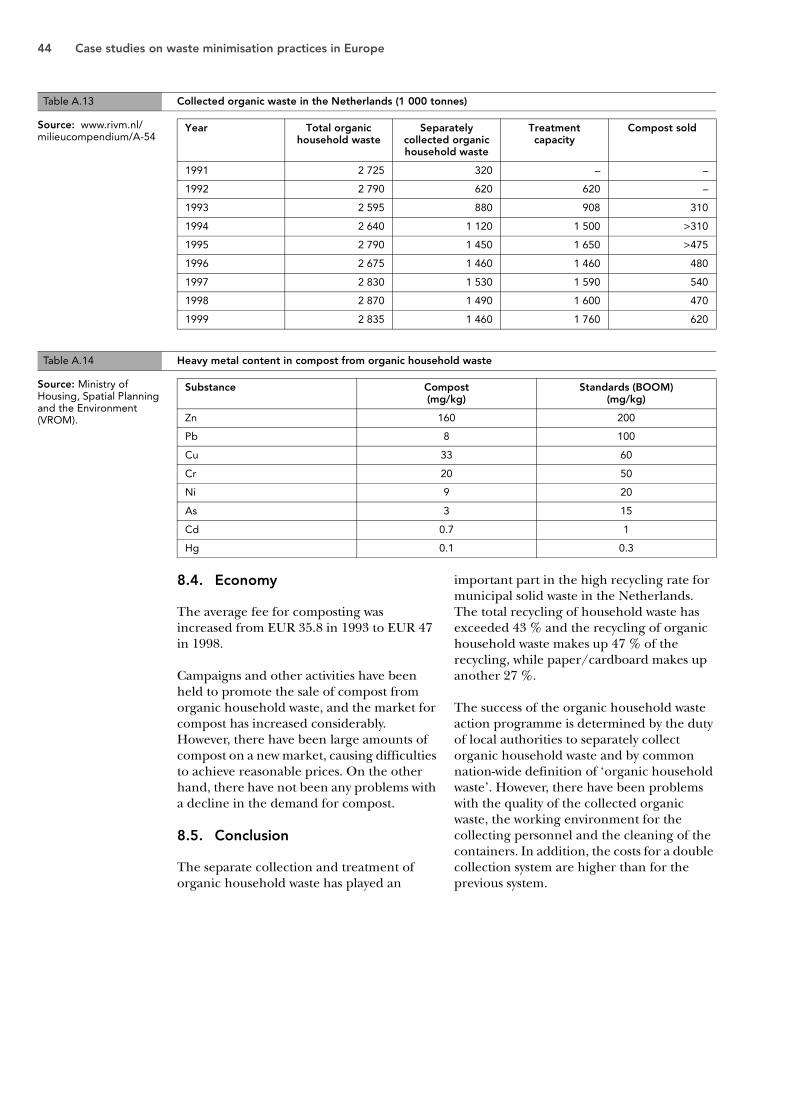
44 Case studies on waste minimisation practices in Europe
8.4. Economy
The average fee for composting was increased from EUR 35.8 in 1993 to EUR 47 in 1998.
Campaigns and other activities have been held to promote the sale of compost from organic household waste, and the market for compost has increased considerably. However, there have been large amounts of compost on a new market, causing difficulties to achieve reasonable prices. On the other hand, there have not been any problems with a decline in the demand for compost.
8.5. Conclusion
The separate collection and treatment of organic household waste has played an
important part in the high recycling rate for municipal solid waste in the Netherlands. The total recycling of household waste has exceeded 43 % and the recycling of organic household waste makes up 47 % of the recycling, while paper/cardboard makes up another 27 %.
The success of the organic household waste action programme is determined by the duty of local authorities to separately collect organic household waste and by common nation-wide definition of ‘organic household waste’. However, there have been problems with the quality of the collected organic waste, the working environment for the collecting personnel and the cleaning of the containers. In addition, the costs for a double collection system are higher than for the previous system.
Table A.13 Collected organic waste in the Netherlands (1 000 tonnes)
Year Total organic household waste
Separately collected organic household waste
Treatment capacity
Compost sold
1991 2 725 320 – –
1992 2 790 620 620 –
1993 2 595 880 908 310
1994 2 640 1 120 1 500 >310
1995 2 790 1 450 1 650 >475
1996 2 675 1 460 1 460 480
1997 2 830 1 530 1 590 540
1998 2 870 1 490 1 600 470
1999 2 835 1 460 1 760 620
Table A.14 Heavy metal content in compost from organic household waste
Substance Compost(mg/kg)
Standards (BOOM)(mg/kg)
Zn 160 200
Pb 8 100
Cu 33 60
Cr 20 50
Ni 9 20
As 3 15
Cd 0.7 1
Hg 0.1 0.3
Source: www.rivm.nl/milieucompendium/A-54
Source: Ministry of Housing, Spatial Planning and the Environment (VROM).
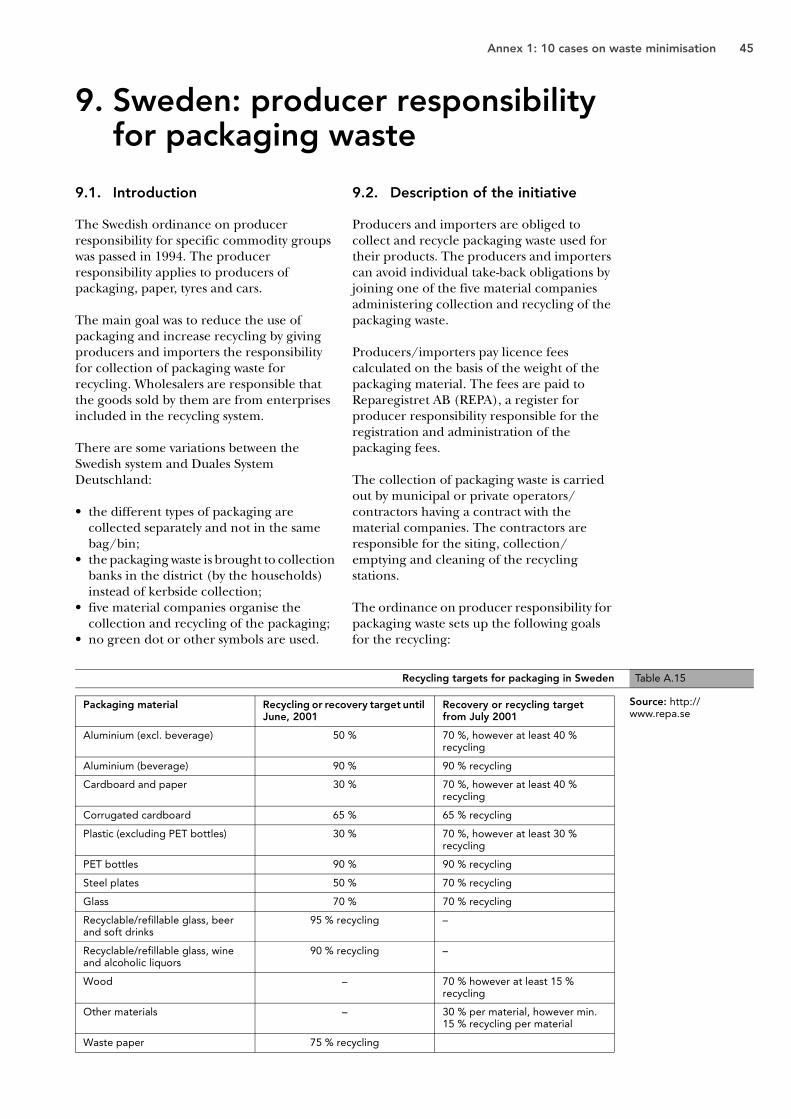
Annex 1: 10 cases on waste minimisation 45
9. Sweden: producer responsibility for packaging waste
9.1. Introduction
The Swedish ordinance on producer responsibility for specific commodity groups was passed in 1994. The producer responsibility applies to producers of packaging, paper, tyres and cars.
The main goal was to reduce the use of packaging and increase recycling by giving producers and importers the responsibility for collection of packaging waste for recycling. Wholesalers are responsible that the goods sold by them are from enterprises included in the recycling system.
There are some variations between the Swedish system and Duales System Deutschland:
• the different types of packaging are collected separately and not in the same bag/bin;
• the packaging waste is brought to collection banks in the district (by the households) instead of kerbside collection;
• five material companies organise the collection and recycling of the packaging;
• no green dot or other symbols are used.
9.2. Description of the initiative
Producers and importers are obliged to collect and recycle packaging waste used for their products. The producers and importers can avoid individual take-back obligations by joining one of the five material companies administering collection and recycling of the packaging waste.
Producers/importers pay licence fees calculated on the basis of the weight of the packaging material. The fees are paid to Reparegistret AB (REPA), a register for producer responsibility responsible for the registration and administration of the packaging fees.
The collection of packaging waste is carried out by municipal or private operators/contractors having a contract with the material companies. The contractors are responsible for the siting, collection/emptying and cleaning of the recycling stations.
The ordinance on producer responsibility for packaging waste sets up the following goals for the recycling:
Recycling targets for packaging in Sweden Table A.15
Packaging material Recycling or recovery target until June, 2001
Recovery or recycling target from July 2001
Aluminium (excl. beverage) 50 % 70 %, however at least 40 % recycling
Aluminium (beverage) 90 % 90 % recycling
Cardboard and paper 30 % 70 %, however at least 40 % recycling
Corrugated cardboard 65 % 65 % recycling
Plastic (excluding PET bottles) 30 % 70 %, however at least 30 % recycling
PET bottles 90 % 90 % recycling
Steel plates 50 % 70 % recycling
Glass 70 % 70 % recycling
Recyclable/refillable glass, beer and soft drinks
95 % recycling –
Recyclable/refillable glass, wine and alcoholic liquors
90 % recycling –
Wood – 70 % however at least 15 % recycling
Other materials – 30 % per material, however min. 15 % recycling per material
Waste paper 75 % recycling
Source: http://www.repa.se

46 Case studies on waste minimisation practices in Europe
In general, the targets for recycling have been reached. As an example, for glass the target is 70 % recovery and in 1999 84 % was recovered. The only packaging that did not reach the target is aluminum (beverage
excluded), where the target is 50 % recovery and by 1999 only 33 % was recovered, and cans where the target is 90 % and only 84 % was collected.
9.3. Economy
Packaging fees finance the collection and recycling of packaging waste:
Table A.16 Recycling of packaging waste 1999
MaterialsIn tonnes
Total in market
Recycling Energyrecovery
TotalRecycling
Recycling in %
(excluding energy
recovery)
Materialrecovery
Reuse
Glass 174 000 146 000 0 0 146 000 84
Plastic 150 000 24 400 23 700 24 000 48 100 32
Paper, cardboard 196 000 ? ? ? 67 000 34
Corrugated cardboard 386 000 325 000 0 54 000 325 000 84
Steel 44 600 19 200 8 500 0 27 700 62
Aluminium 8 900 2 500 500 0 3 000 34
Recyclable/refillable glass 305 000 0 300 500 0 300 500 99
Recyclable cans 15 500 0 13 100 0 13 100 85
Recyclable PET 26 000 5 600 18 200 0 23 800 92
Total 1 306 000 957 000 73
Source: ‘Har producenterna nått målen? Uppföljning av producentansvaret för 1999’, Naturvårdsverket, 2000).
Table A.17 Recycling rates 1996–99 (%)
Material 1996 1997 1998 1999 Targets until June 2001
Glass 72 77 83 84 70
Plastic 15 18 19 34 30
Corrugated cardboard 81 84 85 84 65
Steel 54 64 71 62 50
Aluminium 19 12 27 34 50
Cans - - 87 85 90
Waste paper 74 78 79 79 75
Source: ‘Har producenterna nått målen? Uppföljning av producentansvaret för 1999’, Naturvårdsverket, 2000).
Table A.18 Packaging fees in 2001(EUR/kg)
Material Packaging fees
Cardboard/paper 0.04
Metal (aluminium) 0.17
Metal (steel drums) 0.01
Metal (steel plates) 0.17
Plastic 0.17
Plastic (plastic foam) 0.17
Corrugated cardboard 0.02
Source: http://www.repa.se/

Annex 1: 10 cases on waste minimisation 47
The packaging fees are in the end paid by the consumers. In 1999, REPA received approximately EUR 40 million in fees, which is approximately EUR 11 per household per year.
In general there has been no problems regarding sale of recyclables. As a matter of fact it would be possible to sell more aluminium and plastics because the demand for these materials is high.
9.4. Conclusion
Except for aluminium and cans, the recycling goals in the Swedish producer responsibility scheme have been reached. The total costs of the system are not very high due to the fact
that the waste is not kerbside-collected, but brought to district collection banks by the householders.
In 1999, a working group published a report evaluating the producer responsibility on commission from the Swedish Parliament. The group stated that there had been no clear definition of responsibilities between the material companies and the municipalities concerning, for example, information to the households and cleaning of the collection banks. The group also stated that the system provides insufficient services towards the households in many municipalities, and that the government should initiate a study on the environmental effects of the producer responsibility system.
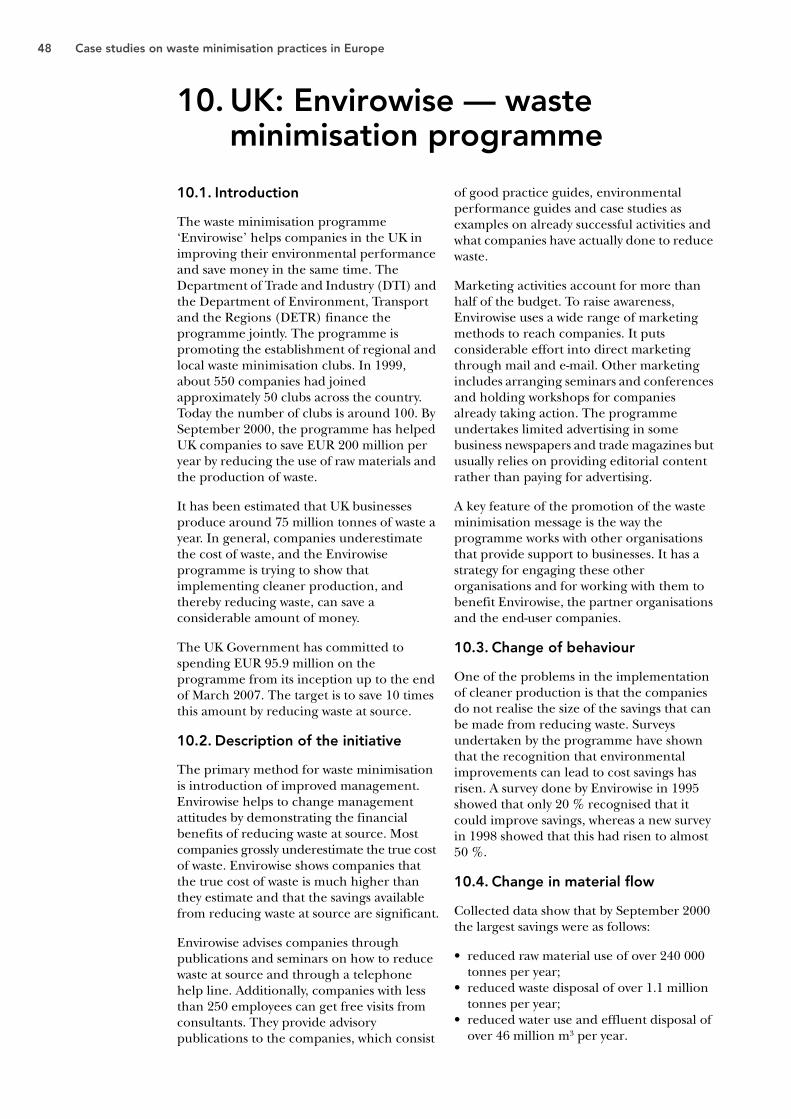
48 Case studies on waste minimisation practices in Europe
10. UK: Envirowise — waste minimisation programme
10.1. Introduction
The waste minimisation programme ‘Envirowise’ helps companies in the UK in improving their environmental performance and save money in the same time. The Department of Trade and Industry (DTI) and the Department of Environment, Transport and the Regions (DETR) finance the programme jointly. The programme is promoting the establishment of regional and local waste minimisation clubs. In 1999, about 550 companies had joined approximately 50 clubs across the country. Today the number of clubs is around 100. By September 2000, the programme has helped UK companies to save EUR 200 million per year by reducing the use of raw materials and the production of waste.
It has been estimated that UK businesses produce around 75 million tonnes of waste a year. In general, companies underestimate the cost of waste, and the Envirowise programme is trying to show that implementing cleaner production, and thereby reducing waste, can save a considerable amount of money.
The UK Government has committed to spending EUR 95.9 million on the programme from its inception up to the end of March 2007. The target is to save 10 times this amount by reducing waste at source.
10.2. Description of the initiative
The primary method for waste minimisation is introduction of improved management. Envirowise helps to change management attitudes by demonstrating the financial benefits of reducing waste at source. Most companies grossly underestimate the true cost of waste. Envirowise shows companies that the true cost of waste is much higher than they estimate and that the savings available from reducing waste at source are significant.
Envirowise advises companies through publications and seminars on how to reduce waste at source and through a telephone help line. Additionally, companies with less than 250 employees can get free visits from consultants. They provide advisory publications to the companies, which consist
of good practice guides, environmental performance guides and case studies as examples on already successful activities and what companies have actually done to reduce waste.
Marketing activities account for more than half of the budget. To raise awareness, Envirowise uses a wide range of marketing methods to reach companies. It puts considerable effort into direct marketing through mail and e-mail. Other marketing includes arranging seminars and conferences and holding workshops for companies already taking action. The programme undertakes limited advertising in some business newspapers and trade magazines but usually relies on providing editorial content rather than paying for advertising.
A key feature of the promotion of the waste minimisation message is the way the programme works with other organisations that provide support to businesses. It has a strategy for engaging these other organisations and for working with them to benefit Envirowise, the partner organisations and the end-user companies.
10.3. Change of behaviour
One of the problems in the implementation of cleaner production is that the companies do not realise the size of the savings that can be made from reducing waste. Surveys undertaken by the programme have shown that the recognition that environmental improvements can lead to cost savings has risen. A survey done by Envirowise in 1995 showed that only 20 % recognised that it could improve savings, whereas a new survey in 1998 showed that this had risen to almost 50 %.
10.4. Change in material flow
Collected data show that by September 2000 the largest savings were as follows:
• reduced raw material use of over 240 000 tonnes per year;
• reduced waste disposal of over 1.1 million tonnes per year;
• reduced water use and effluent disposal of over 46 million m3 per year.

Annex 1: 10 cases on waste minimisation 49
(Envirowise, 2000).
10.5. Economy
Overall, the programme has helped companies to save about EUR 200 million. The table above presents some of the key savings split into sectors.
It can be seen that the help line alone has helped companies save approximately EUR 30 000 000 per year by giving advice on how to reduce cost in the waste management area.
The majority of savings from Envirowise arise from activities that companies have undertaken independently by using the material the programme provides. However, considerable marketing is essential to the Envirowise approach and over 60 % of the budget is for targeted marketing activities.
10.6. Conclusion
The UK Envirowise programme has some very interesting aspects, such as the ‘waste minimisation clubs’. These clubs contribute to the dissemination of information on waste minimisation thus giving the companies inspiration to effective initiatives.
The same waste minimisation supporting function is found at the telephone help line, established to support companies seeking advice on waste minimisation. In addition, companies can get free visits from consultants giving advice on actions can be taken to reduce waste. The initiatives have reduced the material use of over 240 000 tonnes per year, reduced waste disposal on over 1 million tonnes per year and reduced the costs on about EUR 200 million per year.
Yearly cost savings as a result of the Envirowise programme (EUR per year) Table A.19
Savings to date
Cross sectoral portfolios
Helpline 29 499 000
Waste minimisation 97 454 000
Cleaner technology 4 448 000
Volatile organic compound reduction 6 490 000
Sectoral portfolios
Metal finishing 9 462 000
Foundries 5 256 000
Textiles 1 163 000
Paper & board 7 923 000
Glass manufacturing 3 974 000
Printing 3 149 000
Ceramics 636 000
Food and drink manufacturing/processing 512 000
Speciality chemicals 1 323 000
Engineering 6 379 000
Total 178 000 000

50 Case studies on waste minimisation practices in Europe
Annex 2:Full list of waste minimisation initiatives case studies
Table A.2
Country Focal area Case description Evaluation
Austria LandfillingBMW
Minimisation of the biodegradable waste going to landfills. With initiatives mainly on recycling and composting, Austria has succeeded in reducing the landfilling of biodegradable waste to less than 20 %.
Yes
Austria LandfillingWaste tax
Waste tax for landfilling. Revenues found the basis for the surveying, financing and implementation of securing and remediation of contaminated sites.
No (but a detailed description of initiative enclosed)
Austria Packaging waste Packaging collection system. It is obligatory either to re-use or to recover taken-back packaging materials, in compliance with the recycling quotas set out according to packaging-material type.
Yes1997 all pre-set target quotas of beverage packaging, in terms of the refilling, collecting and recovery had been met.
Austria End-of-life vehiclesVoluntary agreements
Voluntary agreement concerning end-of-life vehicles. Vehicles are taken back from the market; this is done free of charge to the consumer upon the simultaneous purchase of a new or used vehicle.
YesStatus report every year. The agreement’s expanded contents have not yet been documented.
Austria BMW Separate collection and treatment of biodegradable waste. The ordinance on the separate collection of biogenic waste defines those types of biodegradable waste which are to be collected separately.
NoThe long-term objective of 80 % coverage can indeed be attained under optimal general conditions.
Austria Producer’s liabilityBatteries
Producer responsibility for batteries, lamps, and refrigerating equipment. Deposit refund scheme covering refrigerators and air-conditioning devices as well as certain lamp bulbs. Also, batteries have to be taken back by importers and distributors.
NoReports with the number of sold and taken back devices submitted to the Federal Ministry of Environment twice a year.
Belgium/Flanders
Cleaner technology
Establishment of an information and knowledge centre on production and consumption in an eco-friendly way. The purpose is to collect information on waste and emission prevention and present the results in workshops, newsletters, websites, etc.
NoThe centre is brand new.
Belgium/Flanders
Cleaner technologyIndustrial waste
The Presti programmes aim to stimulate prevention by investigating environmental problems and finding solutions. Information on environmental advantages and economic feasibilities is disseminated. The latest initiative is to support companies making a specific waste prevention plan and implementing the selected waste management prevention measures.
No10 % of the target group of 40 000 companies have participated in at least one of the activities.
Denmark C&D wasteLandfillingWaste tax
Increase in the recycling of construction and demolition waste, especially due to taxes on incineration and landfilling of waste.
Yes
Denmark Waste tax Differentiation in waste collection fees depending on the weight of the waste.
(Yes)
Finland Hazardous waste The national hazardous waste campaign 1999. The aim was to increase collection of hazardous waste by 20 %. The campaign made use of TV, radio, newspapers and the Internet, etc.
YesThe target was achieved.
Finland Commercial waste
Finland Post Group supporting environmental values. Target in relation to waste: 30 % decrease in the amounts of waste landfilled.
Yes60 % decrease in landfilling of waste.
Finland Furniture Development of a recycling system for used furniture. No
Finland C&D waste Construction loop — databank on ecological construction. The database is a kind of waste exchange for second-hand construction materials.
No
Finland Other Machine-room-less freight elevator. KONE Elevator has developed a new generation of lifts using just 50 % of the power needed by conventional elevators. The lift saves space (no machine room needed) and energy, and reduces harmful substances, as no oil is required.
No
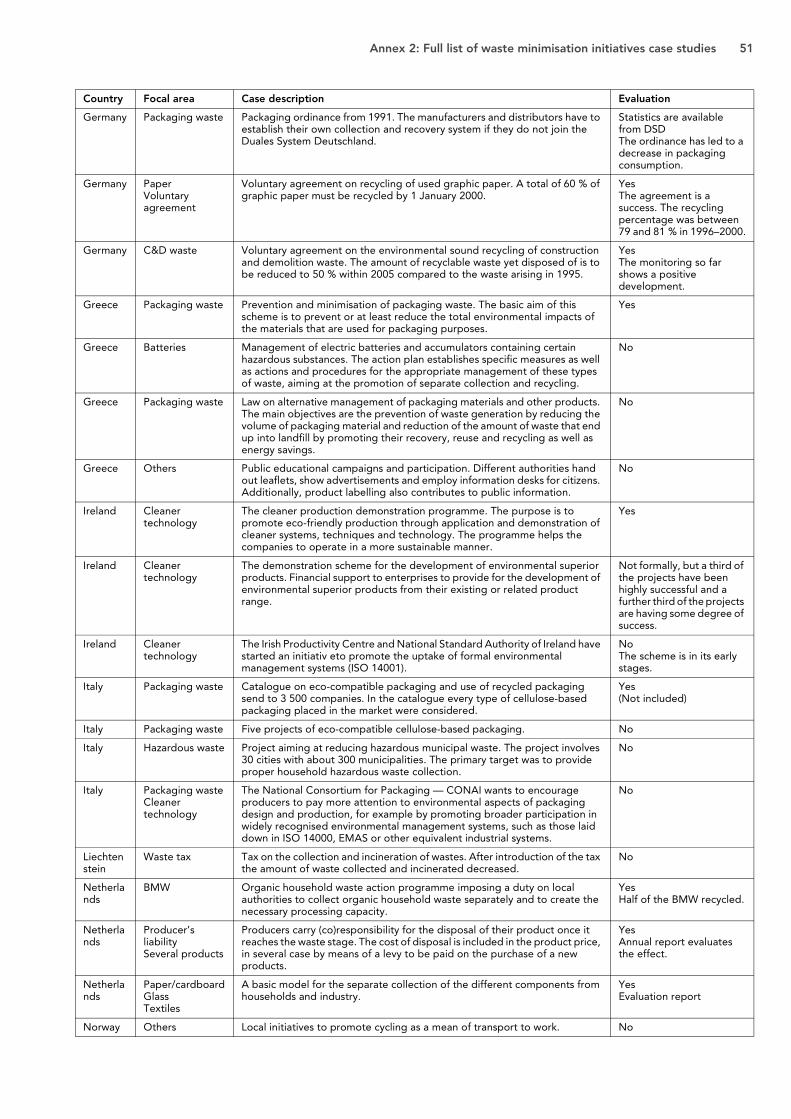
Annex 2: Full list of waste minimisation initiatives case studies 51
Country Focal area Case description Evaluation
Germany Packaging waste Packaging ordinance from 1991. The manufacturers and distributors have to establish their own collection and recovery system if they do not join the Duales System Deutschland.
Statistics are available from DSDThe ordinance has led to a decrease in packaging consumption.
Germany PaperVoluntary agreement
Voluntary agreement on recycling of used graphic paper. A total of 60 % of graphic paper must be recycled by 1 January 2000.
YesThe agreement is a success. The recycling percentage was between 79 and 81 % in 1996–2000.
Germany C&D waste Voluntary agreement on the environmental sound recycling of construction and demolition waste. The amount of recyclable waste yet disposed of is to be reduced to 50 % within 2005 compared to the waste arising in 1995.
YesThe monitoring so far shows a positive development.
Greece Packaging waste Prevention and minimisation of packaging waste. The basic aim of this scheme is to prevent or at least reduce the total environmental impacts of the materials that are used for packaging purposes.
Yes
Greece Batteries Management of electric batteries and accumulators containing certain hazardous substances. The action plan establishes specific measures as well as actions and procedures for the appropriate management of these types of waste, aiming at the promotion of separate collection and recycling.
No
Greece Packaging waste Law on alternative management of packaging materials and other products. The main objectives are the prevention of waste generation by reducing the volume of packaging material and reduction of the amount of waste that end up into landfill by promoting their recovery, reuse and recycling as well as energy savings.
No
Greece Others Public educational campaigns and participation. Different authorities hand out leaflets, show advertisements and employ information desks for citizens. Additionally, product labelling also contributes to public information.
No
Ireland Cleaner technology
The cleaner production demonstration programme. The purpose is to promote eco-friendly production through application and demonstration of cleaner systems, techniques and technology. The programme helps the companies to operate in a more sustainable manner.
Yes
Ireland Cleaner technology
The demonstration scheme for the development of environmental superior products. Financial support to enterprises to provide for the development of environmental superior products from their existing or related product range.
Not formally, but a third of the projects have been highly successful and a further third of the projects are having some degree of success.
Ireland Cleaner technology
The Irish Productivity Centre and National Standard Authority of Ireland have started an initiativ eto promote the uptake of formal environmental management systems (ISO 14001).
NoThe scheme is in its early stages.
Italy Packaging waste Catalogue on eco-compatible packaging and use of recycled packaging send to 3 500 companies. In the catalogue every type of cellulose-based packaging placed in the market were considered.
Yes(Not included)
Italy Packaging waste Five projects of eco-compatible cellulose-based packaging. No
Italy Hazardous waste Project aiming at reducing hazardous municipal waste. The project involves 30 cities with about 300 municipalities. The primary target was to provide proper household hazardous waste collection.
No
Italy Packaging wasteCleaner technology
The National Consortium for Packaging — CONAI wants to encourage producers to pay more attention to environmental aspects of packaging design and production, for example by promoting broader participation in widely recognised environmental management systems, such as those laid down in ISO 14000, EMAS or other equivalent industrial systems.
No
Liechtenstein
Waste tax Tax on the collection and incineration of wastes. After introduction of the tax the amount of waste collected and incinerated decreased.
No
Netherlands
BMW Organic household waste action programme imposing a duty on local authorities to collect organic household waste separately and to create the necessary processing capacity.
YesHalf of the BMW recycled.
Netherlands
Producer’s liabilitySeveral products
Producers carry (co)responsibility for the disposal of their product once it reaches the waste stage. The cost of disposal is included in the product price, in several case by means of a levy to be paid on the purchase of a new products.
YesAnnual report evaluates the effect.
Netherlands
Paper/cardboardGlassTextiles
A basic model for the separate collection of the different components from households and industry.
YesEvaluation report
Norway Others Local initiatives to promote cycling as a mean of transport to work. No

52 Case studies on waste minimisation practices in Europe
Country Focal area Case description Evaluation
Norway Eco-labelling Eco-labelling as guidance to the consumers in buying the most environmental friendly products.
No
Norway Waste tax Differentiation in waste collection fees depending on weight, volume, composition, etc.
No
Sweden Packaging wasteProducer’s liability
Producer responsibility on packaging and other materials. Since 1994 Sweden has had a producer responsibility for packaging waste, tyres, paper and cars. The recycling of all waste types has increased during the 1990s and nearly all aims have been attained.
Yes
UK Packaging wasteProducer’s liability
The Producer Responsibility Obligation Regulation 1997. The regulation gives the industry a shared responsibility for meeting the targets of the EU packaging directive. Companies are responsible for the collection and recovery of a defined percentage of their packaging waste. Individual targets have been set for each sector of industry.
YesMuch effort on the collection of recyclable packaging waste. But lack of treatment capacity.
UK Resource efficiency and cleaner technology
Envirowise. UK-sponsored programme to promote information on cost-effective waste minimisation and clean technology. Works to identify and publish and market advice and guidance on best practice in waste minimisation
YesThe UK industry has saved over GBP 125 000 000 per year.
UK Others Waste resource action programme to overcome marked barriers to promote re-use and recycling. In the first instance, the programme will focus on development of markets and end-users for secondary materials.
NoThe body is currently being created.