cascade the continuum of hiv care florida, 2013
DESCRIPTION
Cascade The Continuum of HIV Care Florida, 2013. Lorene Maddox, MPH Karalee Poschman, MPH. Living data through 2013, as of 06/30/2014. National HIV/AIDS Strategy. Goals Reduce the number of people who become infected with HIV - PowerPoint PPT PresentationTRANSCRIPT
Cascade The Continuum of HIV Care
Florida, 2013
Lorene Maddox, MPHKaralee Poschman, MPH
Living data through 2013, as of 06/30/2014
National HIV/AIDS Strategy•Goals–Reduce the number of people who become infected
with HIV–Increase access to care and improve health outcomes
for people living with HIV–Reduce HIV-related health disparities
•Vital to improve engagement at every stage in a continuum of care that includes:–HIV testing and subsequent diagnosis–Linkage to HIV medical care–Continuous engagement in HIV medical care (retention)–Initiation of antiretroviral therapy (ART)–Suppressed viral load (<200 copies/mL)
Definitions (part 1 of 2)• HIV-infected=HIV diagnosed cases divided by 84.2% (to account for 15.8%
national estimated unaware of their status in Florida). The 2011 indicator report (http://www.cdc.gov/hiv/pdf/2011_Monitoring_HIV_Indicators_HSSR_FINAL.pdf ) estimates that 15.8% are undiagnosed (Table 9a) – this report uses 2010 data and was published in October 2013.
• HIV Diagnosed=Number of cases known to be alive and living in Florida through 2013, regardless where diagnosed, as of 06/30/2014 (used for unmet need calculations).
• Linked to Care (Ever in Care) =86% of those cases were linked to care, based on persons living with HIV disease in Florida (regardless of where diagnosed) who ever had a CD4 or Viral load (VL) test in the electronic HIV/AIDS Reporting System (eHARS) (2010 National estimates are 79%*).
*Continuum of HIV care among Ryan White HIV/AIDS Program clients, U.S., 2010 (http://hab.hrsa.gov/data/reports/continuumofcare/index.html )
Definitions (part 2 of 2)• In Care this Year=55% of cases were in care this year, based on Health Resources
and Services Administration (HRSA) unmet need definition, for persons living with HIV in Florida (regardless of where diagnosed) and having at least 1 HIV-related care service involving either a Viral Load or CD4 test or a refill of HIV-related prescription (2010 National estimates for in care are 56%*).
• On Antiretroviral Therapy (ART) =Estimated 90.6% of In care this year in Florida per 2011 Medical Monitoring Project (MMP) data (2010 National estimates are 80%*).
• Suppressed Viral Load (VL) =Estimated 78.0% on ART & a suppressed VL (<200 copies /mL)this year in Florida per 2011 MMP data (2010 National estimates are 70%*).
*Continuum of HIV care among Ryan White HIV/AIDS Program clients, U.S., 2010 (http://hab.hrsa.gov/data/reports/continuumofcare/index.html)
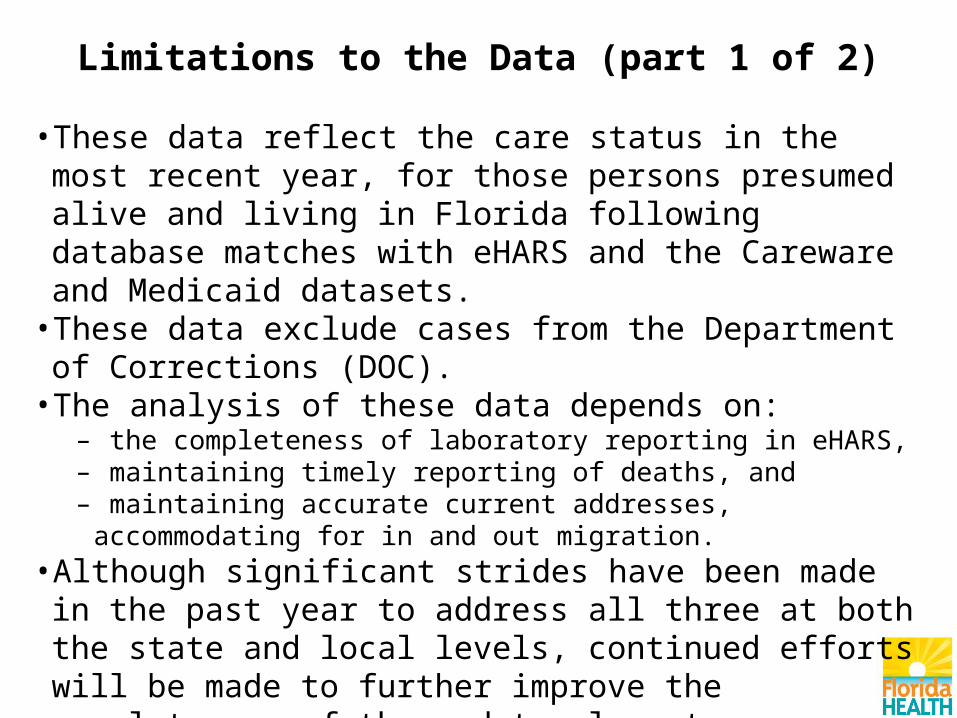
Limitations to the Data (part 1 of 2)• These data reflect the care status in the most recent year, for
those persons presumed alive and living in Florida following database matches with eHARS and the Careware and Medicaid datasets. • These data exclude cases from the Department of Corrections
(DOC).• The analysis of these data depends on:
– the completeness of laboratory reporting in eHARS, – maintaining timely reporting of deaths, and– maintaining accurate current addresses, accommodating for in and out
migration. • Although significant strides have been made in the past year to
address all three at both the state and local levels, continued efforts will be made to further improve the completeness of these data elements.
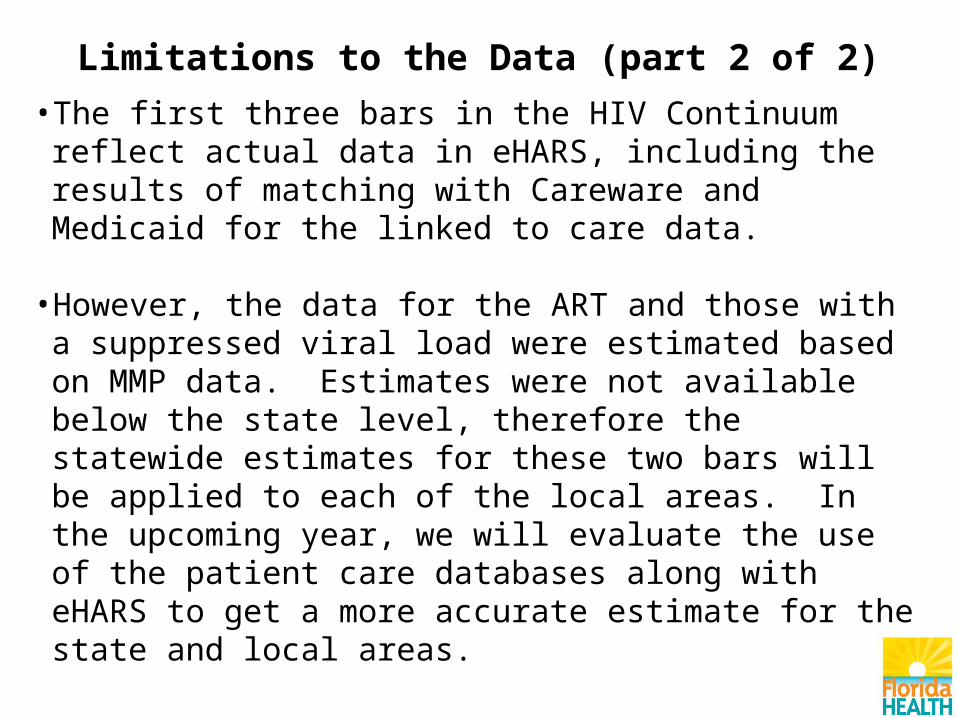
Limitations to the Data (part 2 of 2)• The first three bars in the HIV Continuum reflect actual data in
eHARS, including the results of matching with Careware and Medicaid for the linked to care data.
• However, the data for the ART and those with a suppressed viral load were estimated based on MMP data. Estimates were not available below the state level, therefore the statewide estimates for these two bars will be applied to each of the local areas. In the upcoming year, we will evaluate the use of the patient care databases along with eHARS to get a more accurate estimate for the state and local areas.
Number and Percentage of HIV-Diagnosed PersonsEngaged in Selected Stages of
The Continuum of HIV Care — Florida, 2013
Series10%
10%20%30%40%50%60%70%80%90%
100%100%
86%
55%50%
35%
(1) HIV Diagnosed
(2) Linked to Care
(3) In Care this Year
(4) On ART
(5) Suppressed Viral Load (<200 copies/mL on ART)
Continuum of HIV Care
Perc
ent o
f Cas
es
HIV-infected = 121,387102,208
87,664
56,14750,869
35,965
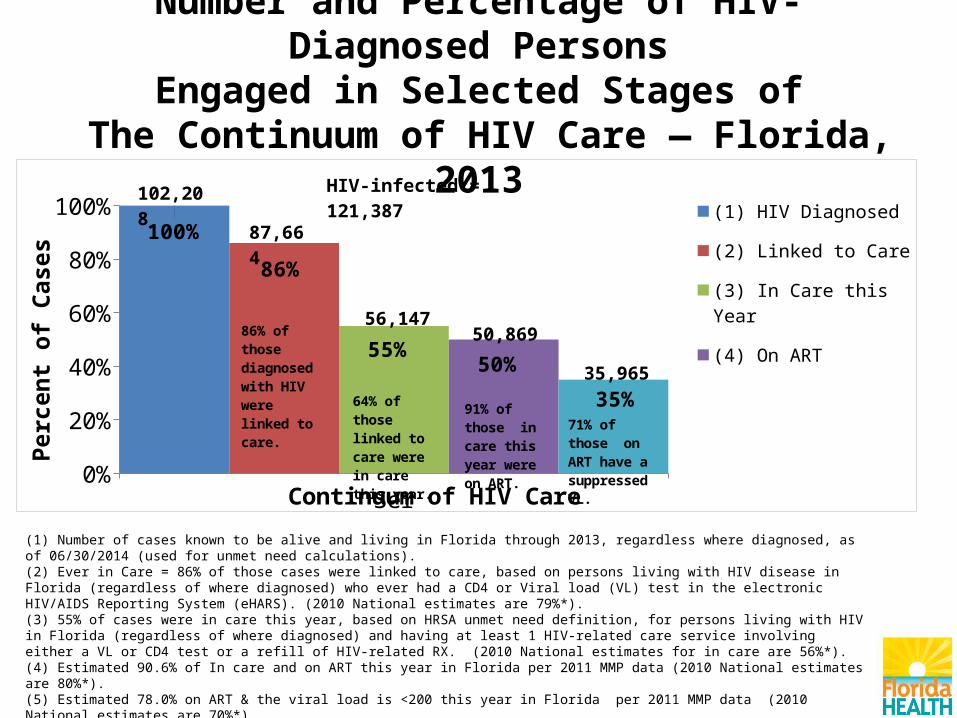
86% of those diagnosed with HIV were linked to care.
64% of those linked to care were in care this year.
91% of those in care this year were on ART.
71% of those on ART have a suppressed VL.
(1) Number of cases known to be alive and living in Florida through 2013, regardless where diagnosed, as of 06/30/2014 (used for unmet need calculations). (2) Ever in Care = 86% of those cases were linked to care, based on persons living with HIV disease in Florida (regardless of where diagnosed) who ever had a CD4 or Viral load (VL) test in the electronic HIV/AIDS Reporting System (eHARS). (2010 National estimates are 79%*). (3) 55% of cases were in care this year, based on HRSA unmet need definition, for persons living with HIV in Florida (regardless of where diagnosed) and having at least 1 HIV-related care service involving either a VL or CD4 test or a refill of HIV-related RX. (2010 National estimates for in care are 56%*). (4) Estimated 90.6% of In care and on ART this year in Florida per 2011 MMP data (2010 National estimates are 80%*).(5) Estimated 78.0% on ART & the viral load is <200 this year in Florida per 2011 MMP data (2010 National estimates are 70%*). *Continuum of HIV care among Ryan White HIV/AIDS Program clients, U.S., 2010 (http://hab.hrsa.gov/data/reports/continuumofcare/index.html) For additional information please refer to the Florida Continuum of Care slide set accessible at http://www.floridahealth.gov/diseases-and-conditions/aids/surveillance/index.html
Number and Percentage of HIV-Infected bySelected Demographic and Transmission Groups
Engaged in Selected Stages of The Continuum of HIV Care
Florida, 2013 (part 1 of 2)
• By Geographical Area/Population Density• By Sex–Male, Female
• By Race–White, Black, Hispanic
• By Current Age Group–13-24, 25-49, 50+
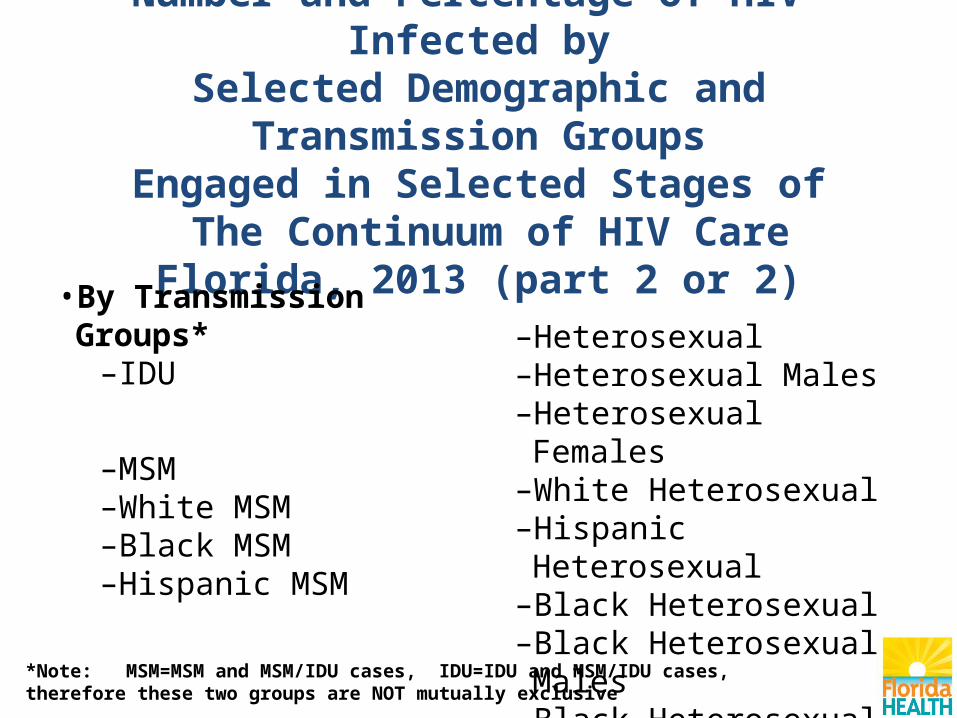
Number and Percentage of HIV-Infected bySelected Demographic and Transmission Groups
Engaged in Selected Stages of The Continuum of HIV Care
Florida, 2013 (part 2 or 2)• By Transmission Groups*–IDU
–MSM–White MSM–Black MSM–Hispanic MSM
–Heterosexual–Heterosexual Males–Heterosexual Females–White Heterosexual–Hispanic Heterosexual–Black Heterosexual–Black Heterosexual Males–Black Heterosexual Females
*Note: MSM=MSM and MSM/IDU cases, IDU=IDU and MSM/IDU cases, therefore these two groups are NOT mutually exclusive
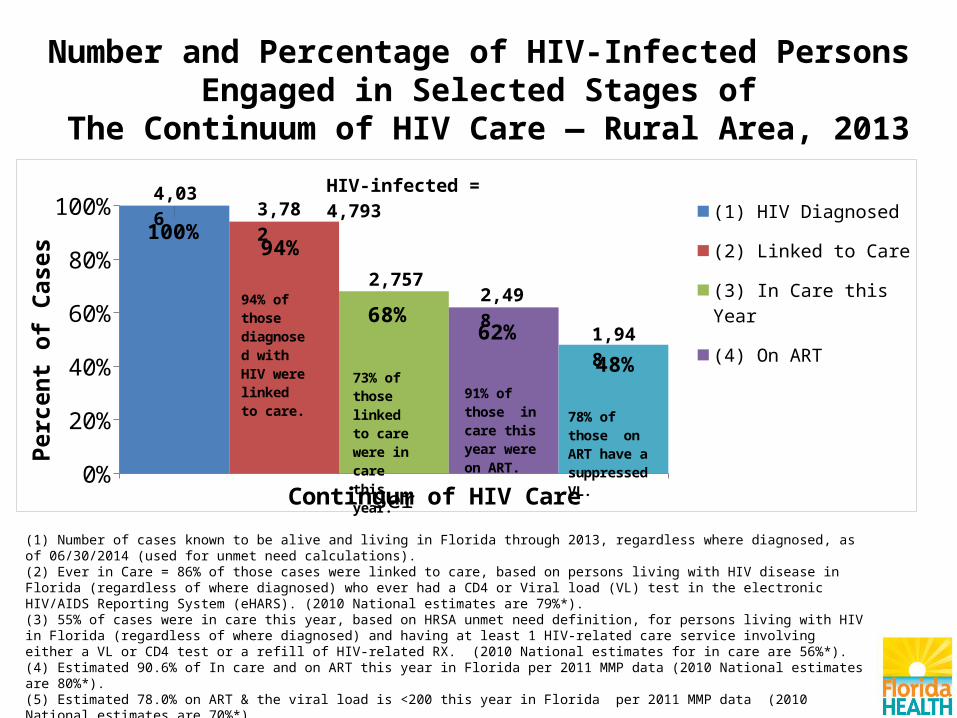
Number and Percentage of HIV-Infected PersonsEngaged in Selected Stages of
The Continuum of HIV Care — Rural Area, 2013
(1) Number of cases known to be alive and living in Florida through 2013, regardless where diagnosed, as of 06/30/2014 (used for unmet need calculations). (2) Ever in Care = 86% of those cases were linked to care, based on persons living with HIV disease in Florida (regardless of where diagnosed) who ever had a CD4 or Viral load (VL) test in the electronic HIV/AIDS Reporting System (eHARS). (2010 National estimates are 79%*). (3) 55% of cases were in care this year, based on HRSA unmet need definition, for persons living with HIV in Florida (regardless of where diagnosed) and having at least 1 HIV-related care service involving either a VL or CD4 test or a refill of HIV-related RX. (2010 National estimates for in care are 56%*). (4) Estimated 90.6% of In care and on ART this year in Florida per 2011 MMP data (2010 National estimates are 80%*).(5) Estimated 78.0% on ART & the viral load is <200 this year in Florida per 2011 MMP data (2010 National estimates are 70%*). *Continuum of HIV care among Ryan White HIV/AIDS Program clients, U.S., 2010 (http://hab.hrsa.gov/data/reports/continuumofcare/index.html) For additional information please refer to the Florida Continuum of Care slide set accessible at http://www.floridahealth.gov/diseases-and-conditions/aids/surveillance/index.html
Series10%
10%20%30%40%50%60%70%80%90%
100%100%
94%
68%62%
48%
(1) HIV Diagnosed
(2) Linked to Care
(3) In Care this Year
(4) On ART
(5) Suppressed Viral Load (<200 copies/mL on ART)
Continuum of HIV Care
Perc
ent o
f Cas
es
HIV-infected = 4,7934,0363,782
2,7572,498
1,948
94% of those di-agnosed with HIV were linked to care.
73% of those linked to care were in care this year.
91% of those in care this year were on ART.
78% of those on ART have a suppressed VL.
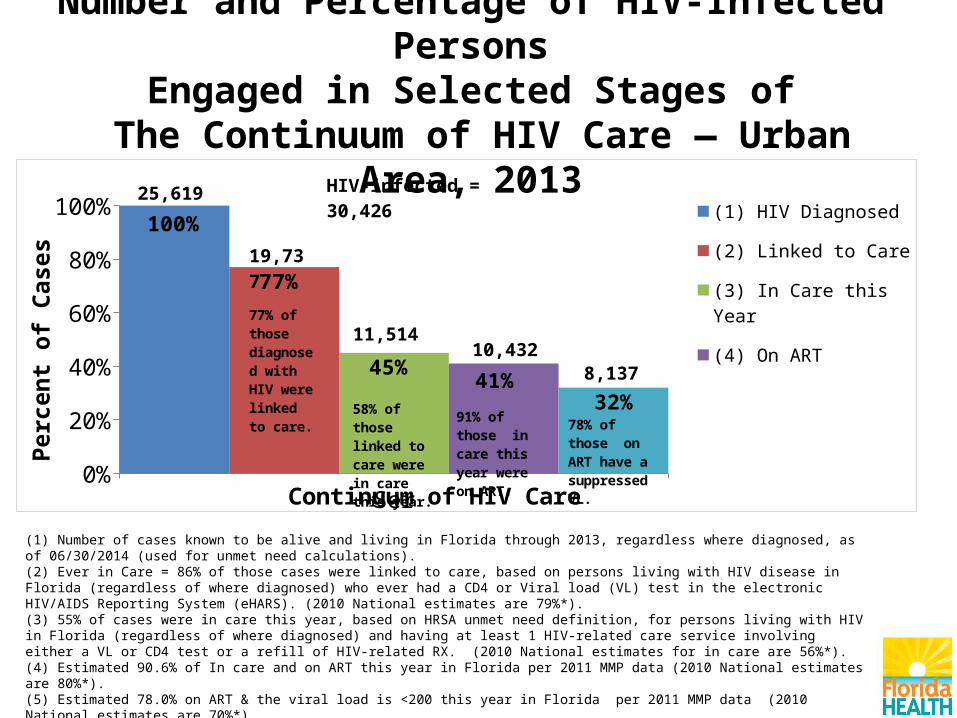
Number and Percentage of HIV-Infected PersonsEngaged in Selected Stages of
The Continuum of HIV Care — Urban Area, 2013
Series10%
10%20%30%40%50%60%70%80%90%
100%100%
77%
45%41%
32%
(1) HIV Diagnosed
(2) Linked to Care
(3) In Care this Year
(4) On ART
(5) Suppressed Viral Load (<200 copies/mL on ART)
Continuum of HIV Care
Perc
ent o
f Cas
es
HIV-infected = 30,42625,619
19,737
11,51410,432
8,137
77% of those di-agnosed with HIV were linked to care. 58% of those
linked to care were in care this year.
91% of those in care this year were on ART.
78% of those on ART have a suppressed VL.
(1) Number of cases known to be alive and living in Florida through 2013, regardless where diagnosed, as of 06/30/2014 (used for unmet need calculations). (2) Ever in Care = 86% of those cases were linked to care, based on persons living with HIV disease in Florida (regardless of where diagnosed) who ever had a CD4 or Viral load (VL) test in the electronic HIV/AIDS Reporting System (eHARS). (2010 National estimates are 79%*). (3) 55% of cases were in care this year, based on HRSA unmet need definition, for persons living with HIV in Florida (regardless of where diagnosed) and having at least 1 HIV-related care service involving either a VL or CD4 test or a refill of HIV-related RX. (2010 National estimates for in care are 56%*). (4) Estimated 90.6% of In care and on ART this year in Florida per 2011 MMP data (2010 National estimates are 80%*).(5) Estimated 78.0% on ART & the viral load is <200 this year in Florida per 2011 MMP data (2010 National estimates are 70%*). *Continuum of HIV care among Ryan White HIV/AIDS Program clients, U.S., 2010 (http://hab.hrsa.gov/data/reports/continuumofcare/index.html) For additional information please refer to the Florida Continuum of Care slide set accessible at http://www.floridahealth.gov/diseases-and-conditions/aids/surveillance/index.html

Number and Percentage of HIV-Infected Among MALES Engaged in Selected Stages of The Continuum of HIV Care — Florida, 2013
Series10%
10%20%30%40%50%60%70%80%90%
100%100%
86%
54%42%
34%
(1) HIV Diagnosed
(2) Linked to Care
(3) In Care this Year
(4) On ART
(5) Suppressed Viral Load (<200 copies/mL on ART)
Continuum of HIV Care
Perc
ent o
f Cas
es
HIV-infected = 85,18971,729
61,400
38,536
30,25124,322
86% of those diagnosed with HIV were linked to care.
63% of those linked to care were in care this year.
79% of those in care this year were on ART.
80% of those on ART have a suppressed VL.
(1) Number of cases known to be alive and living in Florida through 2013, regardless where diagnosed, as of 06/30/2014 (used for unmet need calculations). (2) Ever in Care = 86% of those cases were linked to care, based on persons living with HIV disease in Florida (regardless of where diagnosed) who ever had a CD4 or Viral load (VL) test in the electronic HIV/AIDS Reporting System (eHARS). (2010 National estimates are 79%*). (3) 55% of cases were in care this year, based on HRSA unmet need definition, for persons living with HIV in Florida (regardless of where diagnosed) and having at least 1 HIV-related care service involving either a VL or CD4 test or a refill of HIV-related RX. (2010 National estimates for in care are 56%*). (4) Estimated 90.6% of In care and on ART this year in Florida per 2011 MMP data (2010 National estimates are 80%*).(5) Estimated 78.0% on ART & the viral load is <200 this year in Florida per 2011 MMP data (2010 National estimates are 70%*). *Continuum of HIV care among Ryan White HIV/AIDS Program clients, U.S., 2010 (http://hab.hrsa.gov/data/reports/continuumofcare/index.html) For additional information please refer to the Florida Continuum of Care slide set accessible at http://www.floridahealth.gov/diseases-and-conditions/aids/surveillance/index.html
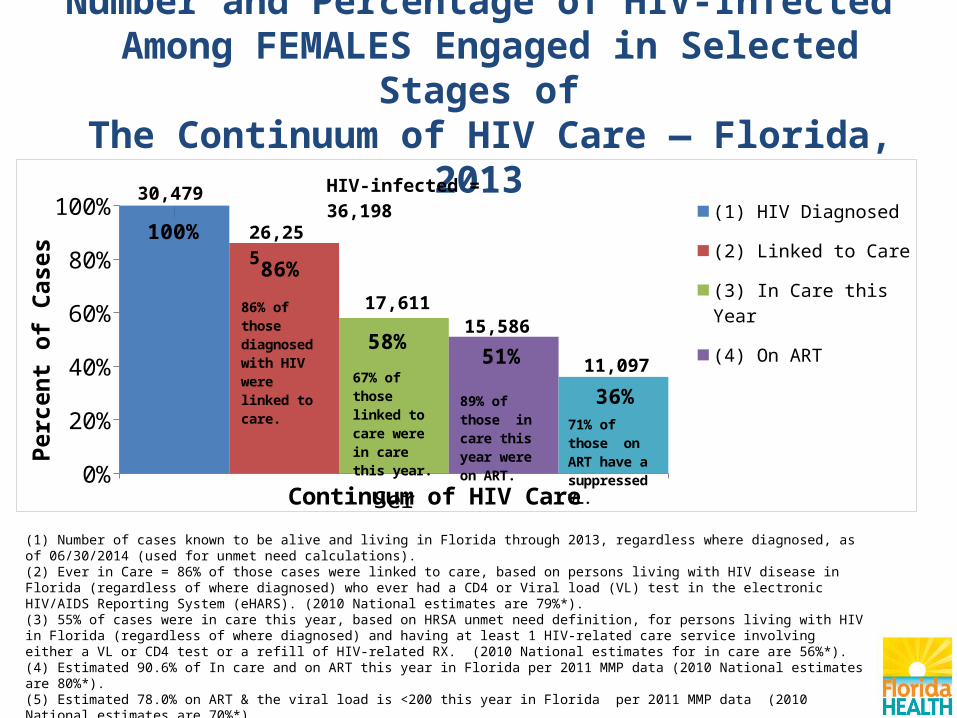
Number and Percentage of HIV-Infected Among FEMALES Engaged in Selected Stages of
The Continuum of HIV Care — Florida, 2013
Series10%
10%20%30%40%50%60%70%80%90%
100%100%
86%
58%51%
36%
(1) HIV Diagnosed
(2) Linked to Care
(3) In Care this Year
(4) On ART
(5) Suppressed Viral Load (<200 copies/mL on ART)
Continuum of HIV Care
Perc
ent o
f Cas
es
HIV-infected = 36,19830,479
26,255
17,61115,586
11,097
86% of those diagnosed with HIV were linked to care.
67% of those linked to care were in care this year.
89% of those in care this year were on ART.
71% of those on ART have a suppressed VL.
(1) Number of cases known to be alive and living in Florida through 2013, regardless where diagnosed, as of 06/30/2014 (used for unmet need calculations). (2) Ever in Care = 86% of those cases were linked to care, based on persons living with HIV disease in Florida (regardless of where diagnosed) who ever had a CD4 or Viral load (VL) test in the electronic HIV/AIDS Reporting System (eHARS). (2010 National estimates are 79%*). (3) 55% of cases were in care this year, based on HRSA unmet need definition, for persons living with HIV in Florida (regardless of where diagnosed) and having at least 1 HIV-related care service involving either a VL or CD4 test or a refill of HIV-related RX. (2010 National estimates for in care are 56%*). (4) Estimated 90.6% of In care and on ART this year in Florida per 2011 MMP data (2010 National estimates are 80%*).(5) Estimated 78.0% on ART & the viral load is <200 this year in Florida per 2011 MMP data (2010 National estimates are 70%*). *Continuum of HIV care among Ryan White HIV/AIDS Program clients, U.S., 2010 (http://hab.hrsa.gov/data/reports/continuumofcare/index.html) For additional information please refer to the Florida Continuum of Care slide set accessible at http://www.floridahealth.gov/diseases-and-conditions/aids/surveillance/index.html
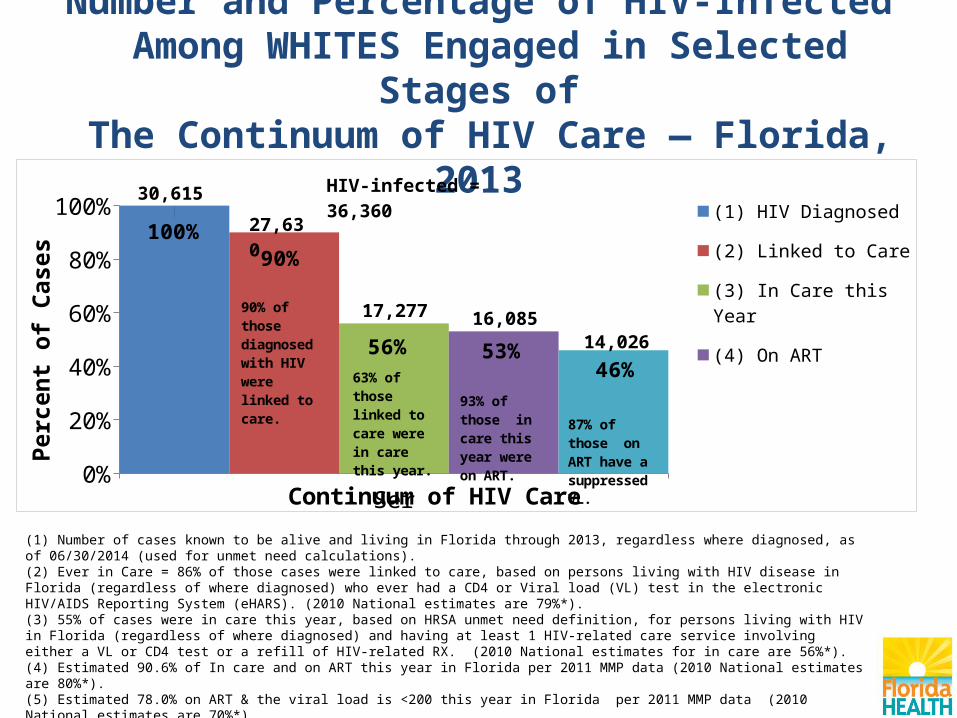
Number and Percentage of HIV-Infected Among WHITES Engaged in Selected Stages of The Continuum of HIV Care — Florida, 2013
(1) Number of cases known to be alive and living in Florida through 2013, regardless where diagnosed, as of 06/30/2014 (used for unmet need calculations). (2) Ever in Care = 86% of those cases were linked to care, based on persons living with HIV disease in Florida (regardless of where diagnosed) who ever had a CD4 or Viral load (VL) test in the electronic HIV/AIDS Reporting System (eHARS). (2010 National estimates are 79%*). (3) 55% of cases were in care this year, based on HRSA unmet need definition, for persons living with HIV in Florida (regardless of where diagnosed) and having at least 1 HIV-related care service involving either a VL or CD4 test or a refill of HIV-related RX. (2010 National estimates for in care are 56%*). (4) Estimated 90.6% of In care and on ART this year in Florida per 2011 MMP data (2010 National estimates are 80%*).(5) Estimated 78.0% on ART & the viral load is <200 this year in Florida per 2011 MMP data (2010 National estimates are 70%*). *Continuum of HIV care among Ryan White HIV/AIDS Program clients, U.S., 2010 (http://hab.hrsa.gov/data/reports/continuumofcare/index.html) For additional information please refer to the Florida Continuum of Care slide set accessible at http://www.floridahealth.gov/diseases-and-conditions/aids/surveillance/index.html
Series10%
10%20%30%40%50%60%70%80%90%
100%100%
90%
56% 53%46%
(1) HIV Diagnosed
(2) Linked to Care
(3) In Care this Year
(4) On ART
(5) Suppressed Viral Load (<200 copies/mL on ART)
Continuum of HIV Care
Perc
ent o
f Cas
es
HIV-infected = 36,36030,615
27,630
17,277 16,08514,026
90% of those diagnosed with HIV were linked to care.
63% of those linked to care were in care this year.
93% of those in care this year were on ART.
87% of those on ART have a suppressed VL.

Number and Percentage of HIV-Infected Among BLACKS Engaged in Selected Stages of The Continuum of HIV Care — Florida, 2013
Series10%
10%20%30%40%50%60%70%80%90%
100%100%
84%
56% 51%
36%
(1) HIV Diagnosed
(2) Linked to Care
(3) In Care this Year
(4) On ART
(5) Suppressed Viral Load (<200 copies/mL on ART)
Continuum of HIV Care
Perc
ent o
f Cas
es
HIV-infected = 56,70247,743
40,061
26,49824,378
17,284
84% of those diagnosed with HIV were linked to care.
66% of those linked to care were in care this year.
92% of those in care this year were on ART.
71% of those on ART have a suppressed VL.
(1) Number of cases known to be alive and living in Florida through 2013, regardless where diagnosed, as of 06/30/2014 (used for unmet need calculations). (2) Ever in Care = 86% of those cases were linked to care, based on persons living with HIV disease in Florida (regardless of where diagnosed) who ever had a CD4 or Viral load (VL) test in the electronic HIV/AIDS Reporting System (eHARS). (2010 National estimates are 79%*). (3) 55% of cases were in care this year, based on HRSA unmet need definition, for persons living with HIV in Florida (regardless of where diagnosed) and having at least 1 HIV-related care service involving either a VL or CD4 test or a refill of HIV-related RX. (2010 National estimates for in care are 56%*). (4) Estimated 90.6% of In care and on ART this year in Florida per 2011 MMP data (2010 National estimates are 80%*).(5) Estimated 78.0% on ART & the viral load is <200 this year in Florida per 2011 MMP data (2010 National estimates are 70%*). *Continuum of HIV care among Ryan White HIV/AIDS Program clients, U.S., 2010 (http://hab.hrsa.gov/data/reports/continuumofcare/index.html) For additional information please refer to the Florida Continuum of Care slide set accessible at http://www.floridahealth.gov/diseases-and-conditions/aids/surveillance/index.html
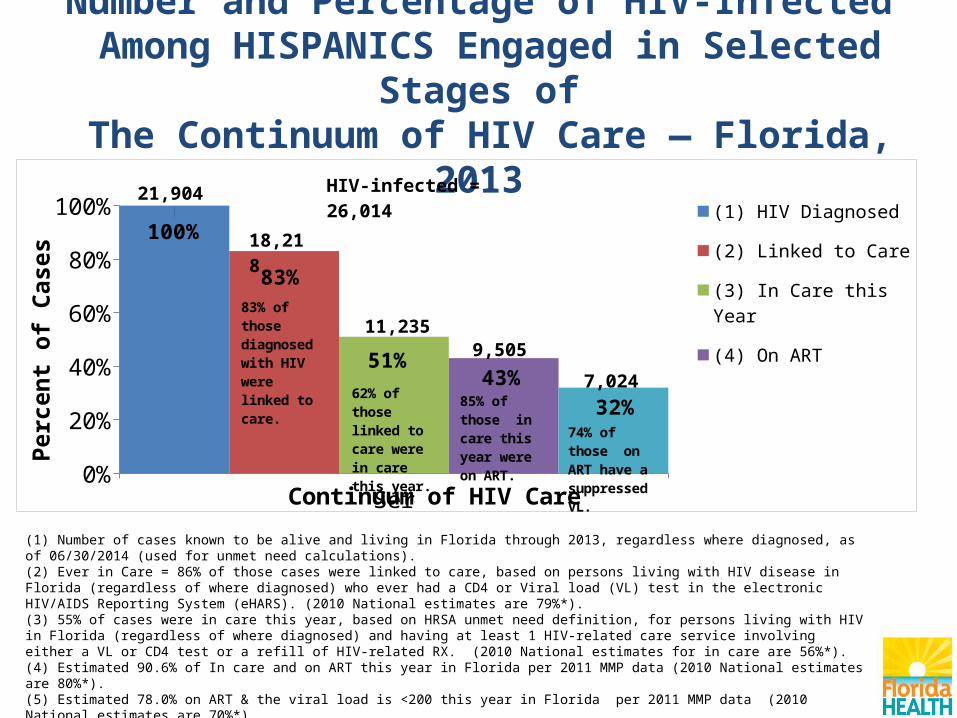
Number and Percentage of HIV-Infected Among HISPANICS Engaged in Selected Stages of
The Continuum of HIV Care — Florida, 2013
Series10%
10%20%30%40%50%60%70%80%90%
100%100%
83%
51%43%
32%
(1) HIV Diagnosed
(2) Linked to Care
(3) In Care this Year
(4) On ART
(5) Suppressed Viral Load (<200 copies/mL on ART)
Continuum of HIV Care
Perc
ent o
f Cas
es
HIV-infected = 26,01421,904
18,218
11,2359,505
7,024
83% of those diagnosed with HIV were linked to care.
62% of those linked to care were in care this year.
85% of those in care this year were on ART.
74% of those on ART have a suppressed VL.
(1) Number of cases known to be alive and living in Florida through 2013, regardless where diagnosed, as of 06/30/2014 (used for unmet need calculations). (2) Ever in Care = 86% of those cases were linked to care, based on persons living with HIV disease in Florida (regardless of where diagnosed) who ever had a CD4 or Viral load (VL) test in the electronic HIV/AIDS Reporting System (eHARS). (2010 National estimates are 79%*). (3) 55% of cases were in care this year, based on HRSA unmet need definition, for persons living with HIV in Florida (regardless of where diagnosed) and having at least 1 HIV-related care service involving either a VL or CD4 test or a refill of HIV-related RX. (2010 National estimates for in care are 56%*). (4) Estimated 90.6% of In care and on ART this year in Florida per 2011 MMP data (2010 National estimates are 80%*).(5) Estimated 78.0% on ART & the viral load is <200 this year in Florida per 2011 MMP data (2010 National estimates are 70%*). *Continuum of HIV care among Ryan White HIV/AIDS Program clients, U.S., 2010 (http://hab.hrsa.gov/data/reports/continuumofcare/index.html) For additional information please refer to the Florida Continuum of Care slide set accessible at http://www.floridahealth.gov/diseases-and-conditions/aids/surveillance/index.html
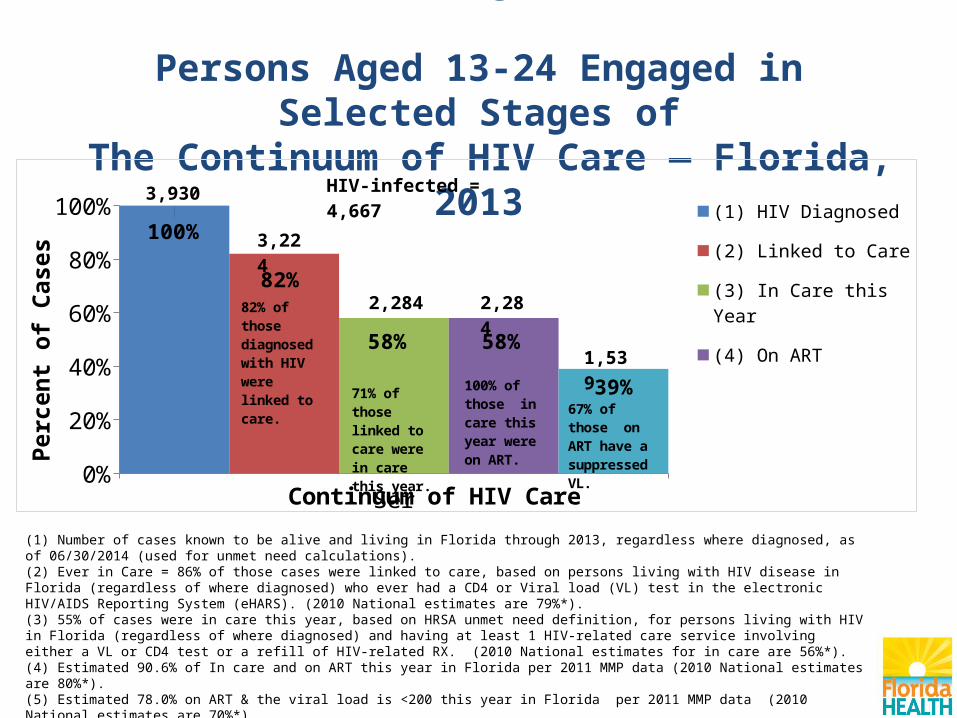
Number and Percentage of HIV-Infected Persons Aged 13-24 Engaged in Selected Stages of
The Continuum of HIV Care — Florida, 2013
Series10%
10%20%30%40%50%60%70%80%90%
100%100%
82%
58% 58%
39%
(1) HIV Diagnosed
(2) Linked to Care
(3) In Care this Year
(4) On ART
(5) Suppressed Viral Load (<200 copies/mL on ART)
Continuum of HIV Care
Perc
ent o
f Cas
es
HIV-infected = 4,6673,930
3,224
2,284 2,284
1,539
82% of those diagnosed with HIV were linked to care.
71% of those linked to care were in care this year.
100% of those in care this year were on ART.
67% of those on ART have a suppressed VL.
(1) Number of cases known to be alive and living in Florida through 2013, regardless where diagnosed, as of 06/30/2014 (used for unmet need calculations). (2) Ever in Care = 86% of those cases were linked to care, based on persons living with HIV disease in Florida (regardless of where diagnosed) who ever had a CD4 or Viral load (VL) test in the electronic HIV/AIDS Reporting System (eHARS). (2010 National estimates are 79%*). (3) 55% of cases were in care this year, based on HRSA unmet need definition, for persons living with HIV in Florida (regardless of where diagnosed) and having at least 1 HIV-related care service involving either a VL or CD4 test or a refill of HIV-related RX. (2010 National estimates for in care are 56%*). (4) Estimated 90.6% of In care and on ART this year in Florida per 2011 MMP data (2010 National estimates are 80%*).(5) Estimated 78.0% on ART & the viral load is <200 this year in Florida per 2011 MMP data (2010 National estimates are 70%*). *Continuum of HIV care among Ryan White HIV/AIDS Program clients, U.S., 2010 (http://hab.hrsa.gov/data/reports/continuumofcare/index.html) For additional information please refer to the Florida Continuum of Care slide set accessible at http://www.floridahealth.gov/diseases-and-conditions/aids/surveillance/index.html
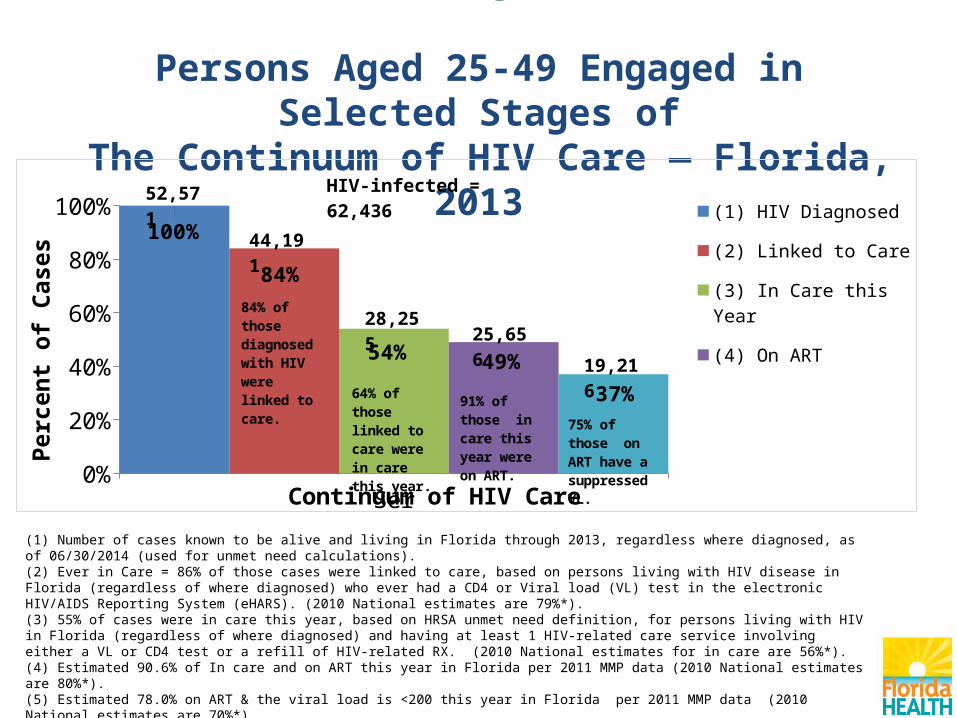
Number and Percentage of HIV-Infected Persons Aged 25-49 Engaged in Selected Stages of
The Continuum of HIV Care — Florida, 2013
Series10%
10%20%30%40%50%60%70%80%90%
100%100%
84%
54% 49%
37%
(1) HIV Diagnosed
(2) Linked to Care
(3) In Care this Year
(4) On ART
(5) Suppressed Viral Load (<200 copies/mL on ART)
Continuum of HIV Care
Perc
ent o
f Cas
es
HIV-infected = 62,43652,571
44,191
28,25525,656
19,216
84% of those diagnosed with HIV were linked to care.
64% of those linked to care were in care this year.
91% of those in care this year were on ART.
75% of those on ART have a suppressed VL.
(1) Number of cases known to be alive and living in Florida through 2013, regardless where diagnosed, as of 06/30/2014 (used for unmet need calculations). (2) Ever in Care = 86% of those cases were linked to care, based on persons living with HIV disease in Florida (regardless of where diagnosed) who ever had a CD4 or Viral load (VL) test in the electronic HIV/AIDS Reporting System (eHARS). (2010 National estimates are 79%*). (3) 55% of cases were in care this year, based on HRSA unmet need definition, for persons living with HIV in Florida (regardless of where diagnosed) and having at least 1 HIV-related care service involving either a VL or CD4 test or a refill of HIV-related RX. (2010 National estimates for in care are 56%*). (4) Estimated 90.6% of In care and on ART this year in Florida per 2011 MMP data (2010 National estimates are 80%*).(5) Estimated 78.0% on ART & the viral load is <200 this year in Florida per 2011 MMP data (2010 National estimates are 70%*). *Continuum of HIV care among Ryan White HIV/AIDS Program clients, U.S., 2010 (http://hab.hrsa.gov/data/reports/continuumofcare/index.html) For additional information please refer to the Florida Continuum of Care slide set accessible at http://www.floridahealth.gov/diseases-and-conditions/aids/surveillance/index.html
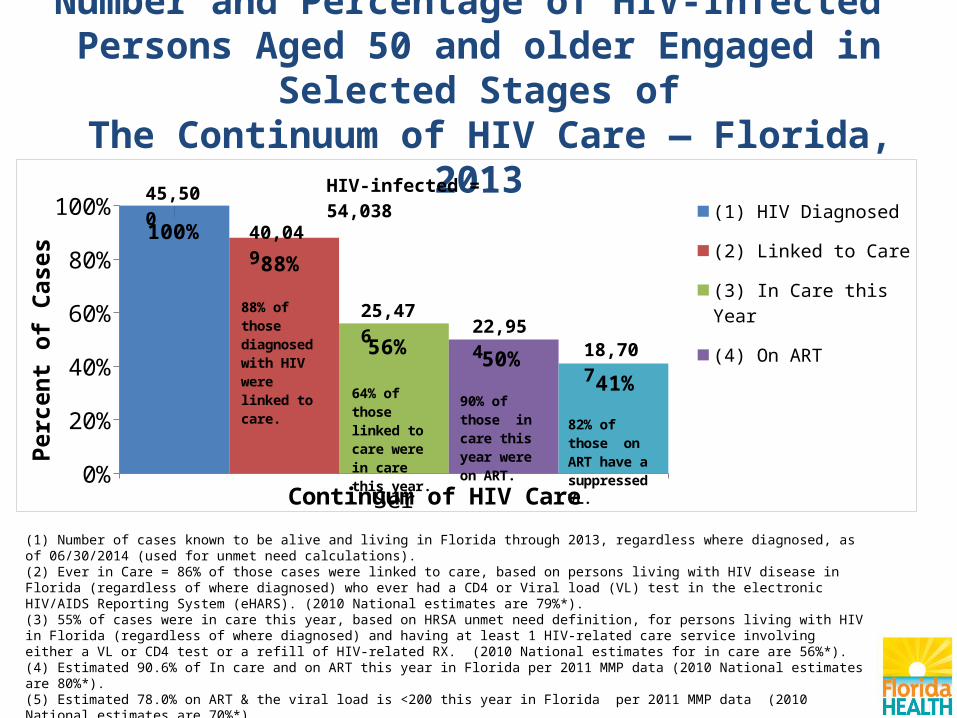
Number and Percentage of HIV-Infected Persons Aged 50 and older Engaged in Selected Stages of
The Continuum of HIV Care — Florida, 2013
Series10%
10%20%30%40%50%60%70%80%90%
100%100%
88%
56% 50%41%
(1) HIV Diagnosed
(2) Linked to Care
(3) In Care this Year
(4) On ART
(5) Suppressed Viral Load (<200 copies/mL on ART)
Continuum of HIV Care
Perc
ent o
f Cas
es
HIV-infected = 54,03845,500
40,049
25,47622,954
18,707
88% of those diagnosed with HIV were linked to care.
64% of those linked to care were in care this year.
90% of those in care this year were on ART.
82% of those on ART have a suppressed VL.
(1) Number of cases known to be alive and living in Florida through 2013, regardless where diagnosed, as of 06/30/2014 (used for unmet need calculations). (2) Ever in Care = 86% of those cases were linked to care, based on persons living with HIV disease in Florida (regardless of where diagnosed) who ever had a CD4 or Viral load (VL) test in the electronic HIV/AIDS Reporting System (eHARS). (2010 National estimates are 79%*). (3) 55% of cases were in care this year, based on HRSA unmet need definition, for persons living with HIV in Florida (regardless of where diagnosed) and having at least 1 HIV-related care service involving either a VL or CD4 test or a refill of HIV-related RX. (2010 National estimates for in care are 56%*). (4) Estimated 90.6% of In care and on ART this year in Florida per 2011 MMP data (2010 National estimates are 80%*).(5) Estimated 78.0% on ART & the viral load is <200 this year in Florida per 2011 MMP data (2010 National estimates are 70%*). *Continuum of HIV care among Ryan White HIV/AIDS Program clients, U.S., 2010 (http://hab.hrsa.gov/data/reports/continuumofcare/index.html) For additional information please refer to the Florida Continuum of Care slide set accessible at http://www.floridahealth.gov/diseases-and-conditions/aids/surveillance/index.html
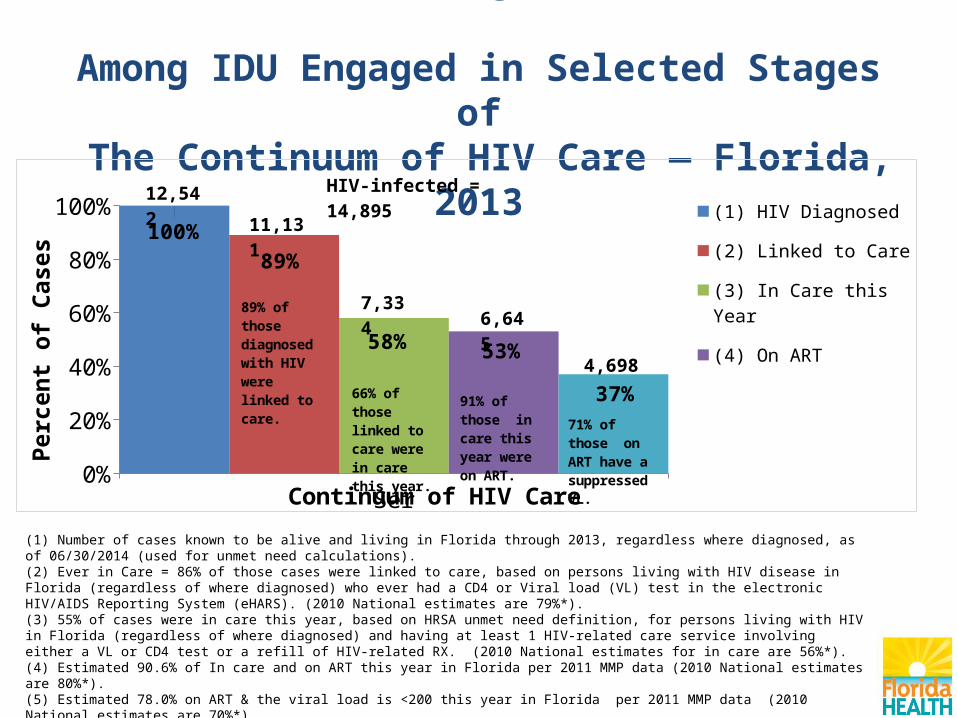
Number and Percentage of HIV-Infected Among IDU Engaged in Selected Stages of
The Continuum of HIV Care — Florida, 2013
Series10%
10%20%30%40%50%60%70%80%90%
100%100%
89%
58% 53%
37%
(1) HIV Diagnosed
(2) Linked to Care
(3) In Care this Year
(4) On ART
(5) Suppressed Viral Load (<200 copies/mL on ART)
Continuum of HIV Care
Perc
ent o
f Cas
es
HIV-infected = 14,89512,542
11,131
7,3346,645
4,698
89% of those diagnosed with HIV were linked to care.
66% of those linked to care were in care this year.
91% of those in care this year were on ART.
71% of those on ART have a suppressed VL.
(1) Number of cases known to be alive and living in Florida through 2013, regardless where diagnosed, as of 06/30/2014 (used for unmet need calculations). (2) Ever in Care = 86% of those cases were linked to care, based on persons living with HIV disease in Florida (regardless of where diagnosed) who ever had a CD4 or Viral load (VL) test in the electronic HIV/AIDS Reporting System (eHARS). (2010 National estimates are 79%*). (3) 55% of cases were in care this year, based on HRSA unmet need definition, for persons living with HIV in Florida (regardless of where diagnosed) and having at least 1 HIV-related care service involving either a VL or CD4 test or a refill of HIV-related RX. (2010 National estimates for in care are 56%*). (4) Estimated 90.6% of In care and on ART this year in Florida per 2011 MMP data (2010 National estimates are 80%*).(5) Estimated 78.0% on ART & the viral load is <200 this year in Florida per 2011 MMP data (2010 National estimates are 70%*). *Continuum of HIV care among Ryan White HIV/AIDS Program clients, U.S., 2010 (http://hab.hrsa.gov/data/reports/continuumofcare/index.html) For additional information please refer to the Florida Continuum of Care slide set accessible at http://www.floridahealth.gov/diseases-and-conditions/aids/surveillance/index.html
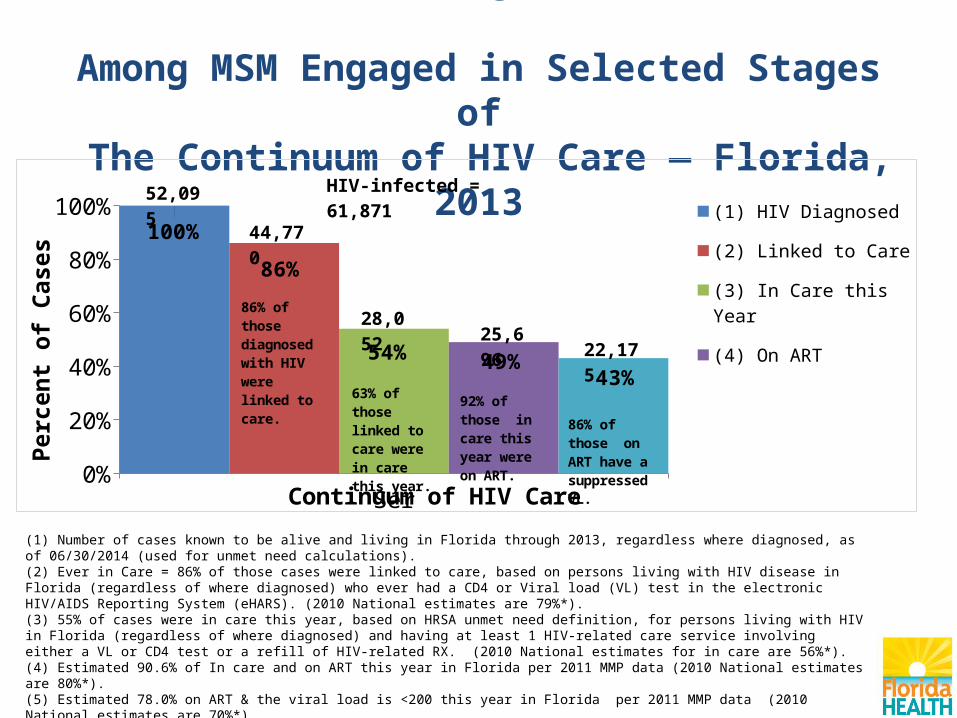
Number and Percentage of HIV-Infected Among MSM Engaged in Selected Stages of The Continuum of HIV Care — Florida, 2013
Series10%
10%20%30%40%50%60%70%80%90%
100%100%
86%
54% 49%43%
(1) HIV Diagnosed
(2) Linked to Care
(3) In Care this Year
(4) On ART
(5) Suppressed Viral Load (<200 copies/mL on ART)
Continuum of HIV Care
Perc
ent o
f Cas
es
HIV-infected = 61,87152,095
44,770
28,052 25,69
6 22,175
86% of those diagnosed with HIV were linked to care.
63% of those linked to care were in care this year.
92% of those in care this year were on ART.
86% of those on ART have a suppressed VL.
(1) Number of cases known to be alive and living in Florida through 2013, regardless where diagnosed, as of 06/30/2014 (used for unmet need calculations). (2) Ever in Care = 86% of those cases were linked to care, based on persons living with HIV disease in Florida (regardless of where diagnosed) who ever had a CD4 or Viral load (VL) test in the electronic HIV/AIDS Reporting System (eHARS). (2010 National estimates are 79%*). (3) 55% of cases were in care this year, based on HRSA unmet need definition, for persons living with HIV in Florida (regardless of where diagnosed) and having at least 1 HIV-related care service involving either a VL or CD4 test or a refill of HIV-related RX. (2010 National estimates for in care are 56%*). (4) Estimated 90.6% of In care and on ART this year in Florida per 2011 MMP data (2010 National estimates are 80%*).(5) Estimated 78.0% on ART & the viral load is <200 this year in Florida per 2011 MMP data (2010 National estimates are 70%*). *Continuum of HIV care among Ryan White HIV/AIDS Program clients, U.S., 2010 (http://hab.hrsa.gov/data/reports/continuumofcare/index.html) For additional information please refer to the Florida Continuum of Care slide set accessible at http://www.floridahealth.gov/diseases-and-conditions/aids/surveillance/index.html
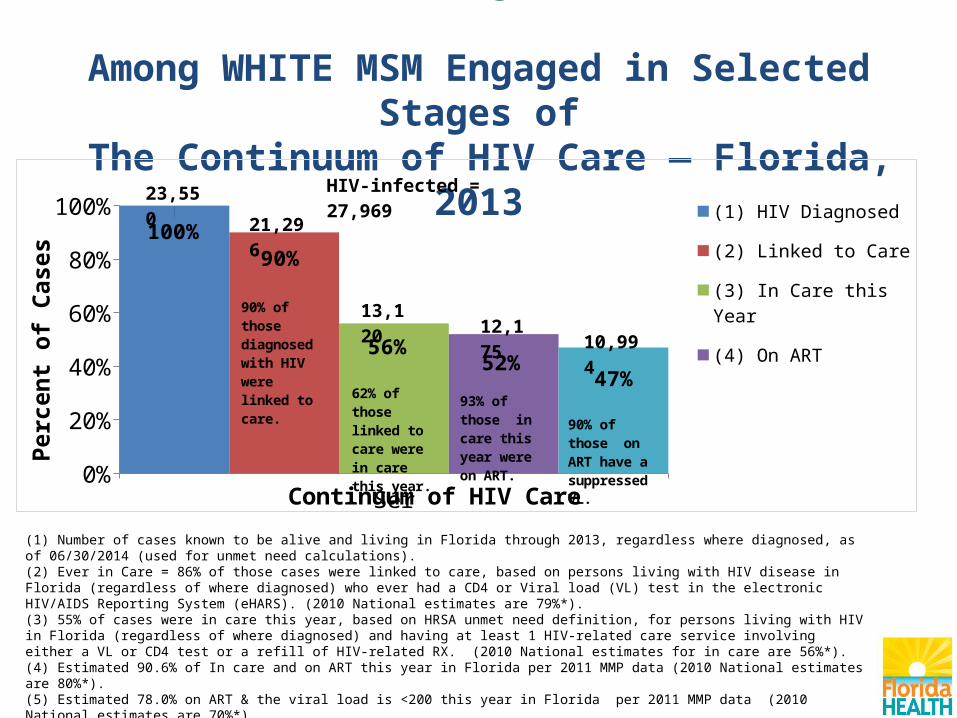
Number and Percentage of HIV-Infected Among WHITE MSM Engaged in Selected Stages of
The Continuum of HIV Care — Florida, 2013
Series10%
10%20%30%40%50%60%70%80%90%
100%100%
90%
56%52%
47%
(1) HIV Diagnosed
(2) Linked to Care
(3) In Care this Year
(4) On ART
(5) Suppressed Viral Load (<200 copies/mL on ART)
Continuum of HIV Care
Perc
ent o
f Cas
es
HIV-infected = 27,96923,550
21,296
13,120 12,17
5 10,994
90% of those diagnosed with HIV were linked to care.
62% of those linked to care were in care this year.
93% of those in care this year were on ART.
90% of those on ART have a suppressed VL.
(1) Number of cases known to be alive and living in Florida through 2013, regardless where diagnosed, as of 06/30/2014 (used for unmet need calculations). (2) Ever in Care = 86% of those cases were linked to care, based on persons living with HIV disease in Florida (regardless of where diagnosed) who ever had a CD4 or Viral load (VL) test in the electronic HIV/AIDS Reporting System (eHARS). (2010 National estimates are 79%*). (3) 55% of cases were in care this year, based on HRSA unmet need definition, for persons living with HIV in Florida (regardless of where diagnosed) and having at least 1 HIV-related care service involving either a VL or CD4 test or a refill of HIV-related RX. (2010 National estimates for in care are 56%*). (4) Estimated 90.6% of In care and on ART this year in Florida per 2011 MMP data (2010 National estimates are 80%*).(5) Estimated 78.0% on ART & the viral load is <200 this year in Florida per 2011 MMP data (2010 National estimates are 70%*). *Continuum of HIV care among Ryan White HIV/AIDS Program clients, U.S., 2010 (http://hab.hrsa.gov/data/reports/continuumofcare/index.html) For additional information please refer to the Florida Continuum of Care slide set accessible at http://www.floridahealth.gov/diseases-and-conditions/aids/surveillance/index.html
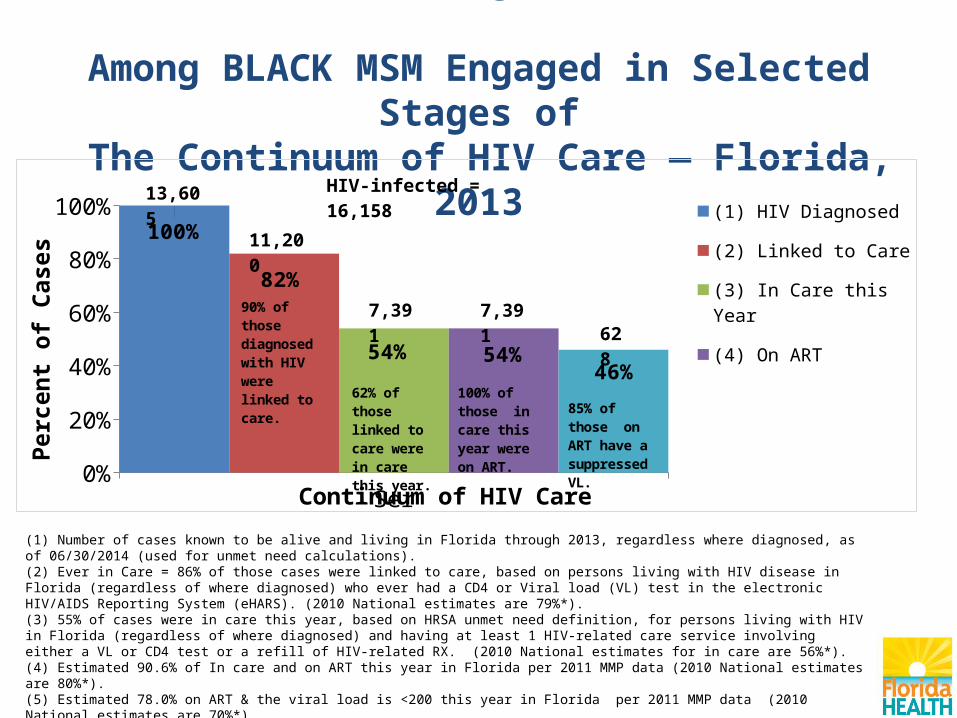
Number and Percentage of HIV-Infected Among BLACK MSM Engaged in Selected Stages of
The Continuum of HIV Care — Florida, 2013
Series10%
10%20%30%40%50%60%70%80%90%
100%100%
82%
54% 54%46%
(1) HIV Diagnosed
(2) Linked to Care
(3) In Care this Year
(4) On ART
(5) Suppressed Viral Load (<200 copies/mL on ART)
Continuum of HIV Care
Perc
ent o
f Cas
es
HIV-infected = 16,15813,605
11,200
7,391 7,391628
90% of those diagnosed with HIV were linked to care.
62% of those linked to care were in care this year.
100% of those in care this year were on ART.
85% of those on ART have a suppressed VL.
(1) Number of cases known to be alive and living in Florida through 2013, regardless where diagnosed, as of 06/30/2014 (used for unmet need calculations). (2) Ever in Care = 86% of those cases were linked to care, based on persons living with HIV disease in Florida (regardless of where diagnosed) who ever had a CD4 or Viral load (VL) test in the electronic HIV/AIDS Reporting System (eHARS). (2010 National estimates are 79%*). (3) 55% of cases were in care this year, based on HRSA unmet need definition, for persons living with HIV in Florida (regardless of where diagnosed) and having at least 1 HIV-related care service involving either a VL or CD4 test or a refill of HIV-related RX. (2010 National estimates for in care are 56%*). (4) Estimated 90.6% of In care and on ART this year in Florida per 2011 MMP data (2010 National estimates are 80%*).(5) Estimated 78.0% on ART & the viral load is <200 this year in Florida per 2011 MMP data (2010 National estimates are 70%*). *Continuum of HIV care among Ryan White HIV/AIDS Program clients, U.S., 2010 (http://hab.hrsa.gov/data/reports/continuumofcare/index.html) For additional information please refer to the Florida Continuum of Care slide set accessible at http://www.floridahealth.gov/diseases-and-conditions/aids/surveillance/index.html
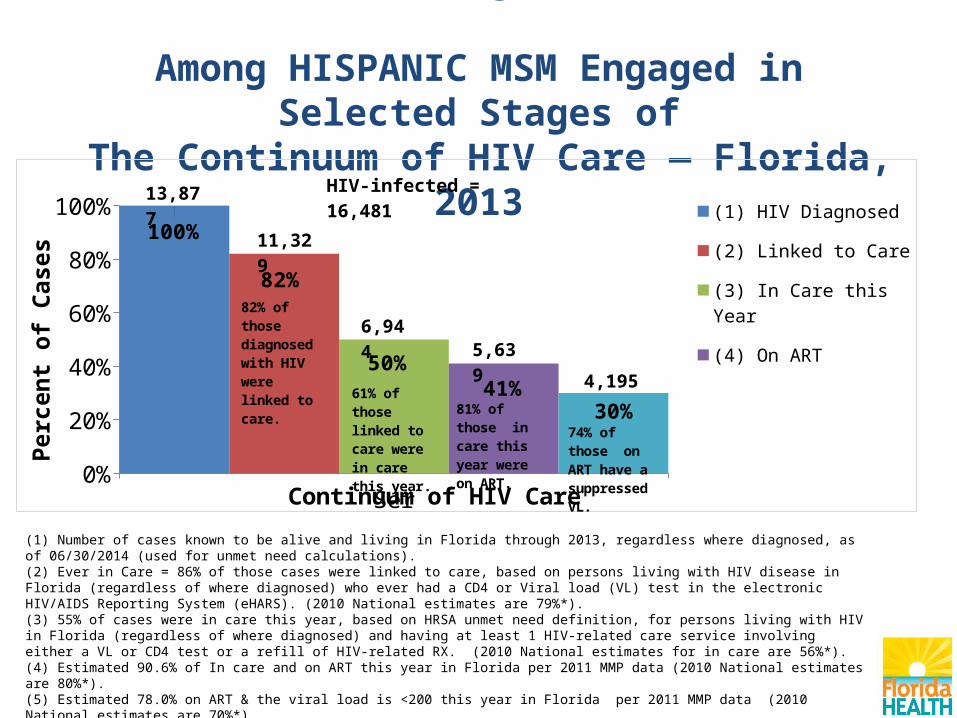
Number and Percentage of HIV-Infected Among HISPANIC MSM Engaged in Selected Stages of
The Continuum of HIV Care — Florida, 2013
Series10%
10%20%30%40%50%60%70%80%90%
100%100%
82%
50%41%
30%
(1) HIV Diagnosed
(2) Linked to Care
(3) In Care this Year
(4) On ART
(5) Suppressed Viral Load (<200 copies/mL on ART)
Continuum of HIV Care
Perc
ent o
f Cas
es
HIV-infected = 16,48113,877
11,329
6,9445,639
4,195
82% of those diagnosed with HIV were linked to care.
61% of those linked to care were in care this year.
81% of those in care this year were on ART.
74% of those on ART have a suppressed VL.
(1) Number of cases known to be alive and living in Florida through 2013, regardless where diagnosed, as of 06/30/2014 (used for unmet need calculations). (2) Ever in Care = 86% of those cases were linked to care, based on persons living with HIV disease in Florida (regardless of where diagnosed) who ever had a CD4 or Viral load (VL) test in the electronic HIV/AIDS Reporting System (eHARS). (2010 National estimates are 79%*). (3) 55% of cases were in care this year, based on HRSA unmet need definition, for persons living with HIV in Florida (regardless of where diagnosed) and having at least 1 HIV-related care service involving either a VL or CD4 test or a refill of HIV-related RX. (2010 National estimates for in care are 56%*). (4) Estimated 90.6% of In care and on ART this year in Florida per 2011 MMP data (2010 National estimates are 80%*).(5) Estimated 78.0% on ART & the viral load is <200 this year in Florida per 2011 MMP data (2010 National estimates are 70%*). *Continuum of HIV care among Ryan White HIV/AIDS Program clients, U.S., 2010 (http://hab.hrsa.gov/data/reports/continuumofcare/index.html) For additional information please refer to the Florida Continuum of Care slide set accessible at http://www.floridahealth.gov/diseases-and-conditions/aids/surveillance/index.html

Number and Percentage of HIV-Infected Among HETEROSEXUAL Engaged in Selected Stages of
The Continuum of HIV Care — Florida, 2013
Series10%
10%20%30%40%50%60%70%80%90%
100%100%
85%
55%50%
35%
(1) HIV Diagnosed
(2) Linked to Care
(3) In Care this Year
(4) On ART
(5) Suppressed Viral Load (<200 copies/mL on ART)
Continuum of HIV Care
Perc
ent o
f Cas
es
HIV-infected = 46,85539,452
33,404
21,891 19,70
213,969
85% of those diagnosed with HIV were linked to care.
66% of those linked to care were in care this year.
90% of those in care this year were on ART.
71% of those on ART have a suppressed VL.
(1) Number of cases known to be alive and living in Florida through 2013, regardless where diagnosed, as of 06/30/2014 (used for unmet need calculations). (2) Ever in Care = 86% of those cases were linked to care, based on persons living with HIV disease in Florida (regardless of where diagnosed) who ever had a CD4 or Viral load (VL) test in the electronic HIV/AIDS Reporting System (eHARS). (2010 National estimates are 79%*). (3) 55% of cases were in care this year, based on HRSA unmet need definition, for persons living with HIV in Florida (regardless of where diagnosed) and having at least 1 HIV-related care service involving either a VL or CD4 test or a refill of HIV-related RX. (2010 National estimates for in care are 56%*). (4) Estimated 90.6% of In care and on ART this year in Florida per 2011 MMP data (2010 National estimates are 80%*).(5) Estimated 78.0% on ART & the viral load is <200 this year in Florida per 2011 MMP data (2010 National estimates are 70%*). *Continuum of HIV care among Ryan White HIV/AIDS Program clients, U.S., 2010 (http://hab.hrsa.gov/data/reports/continuumofcare/index.html) For additional information please refer to the Florida Continuum of Care slide set accessible at http://www.floridahealth.gov/diseases-and-conditions/aids/surveillance/index.html

Number and Percentage of HIV-Infected Among HETEROSEXUAL MALES Engaged in Selected Stages of
The Continuum of HIV Care — Florida, 2013
Series10%
10%20%30%40%50%60%70%80%90%
100%100%
83%
53%48%
34%
(1) HIV Diagnosed
(2) Linked to Care
(3) In Care this Year
(4) On ART
(5) Suppressed Viral Load (<200 copies/mL on ART)
Continuum of HIV Care
Perc
ent o
f Cas
es
HIV-infected = 16,50013,893
11,580
7,3246,621
4,654
83% of those diagnosed with HIV were linked to care.
63% of those linked to care were in care this year.
90% of those in care this year were on ART.
70% of those on ART have a suppressed VL.
(1) Number of cases known to be alive and living in Florida through 2013, regardless where diagnosed, as of 06/30/2014 (used for unmet need calculations). (2) Ever in Care = 86% of those cases were linked to care, based on persons living with HIV disease in Florida (regardless of where diagnosed) who ever had a CD4 or Viral load (VL) test in the electronic HIV/AIDS Reporting System (eHARS). (2010 National estimates are 79%*). (3) 55% of cases were in care this year, based on HRSA unmet need definition, for persons living with HIV in Florida (regardless of where diagnosed) and having at least 1 HIV-related care service involving either a VL or CD4 test or a refill of HIV-related RX. (2010 National estimates for in care are 56%*). (4) Estimated 90.6% of In care and on ART this year in Florida per 2011 MMP data (2010 National estimates are 80%*).(5) Estimated 78.0% on ART & the viral load is <200 this year in Florida per 2011 MMP data (2010 National estimates are 70%*). *Continuum of HIV care among Ryan White HIV/AIDS Program clients, U.S., 2010 (http://hab.hrsa.gov/data/reports/continuumofcare/index.html) For additional information please refer to the Florida Continuum of Care slide set accessible at http://www.floridahealth.gov/diseases-and-conditions/aids/surveillance/index.html

Number and Percentage of HIV-Infected Among HETEROSEXUAL FEMALES
Engaged in Selected Stages of The Continuum of HIV Care — Florida, 2013
Series10%
10%20%30%40%50%60%70%80%90%
100%100%
85%
57%51%
36%
(1) HIV Diagnosed
(2) Linked to Care
(3) In Care this Year
(4) On ART
(5) Suppressed Viral Load (<200 copies/mL on ART)
Continuum of HIV Care
Perc
ent o
f Cas
es
HIV-infected = 30,35525,559
21,827
14,567 13,05
29,319
85% of those diagnosed with HIV were linked to care.
67% of those linked to care were in care this year.
90% of those in care this year were on ART.
71% of those on ART have a suppressed VL.
(1) Number of cases known to be alive and living in Florida through 2013, regardless where diagnosed, as of 06/30/2014 (used for unmet need calculations). (2) Ever in Care = 86% of those cases were linked to care, based on persons living with HIV disease in Florida (regardless of where diagnosed) who ever had a CD4 or Viral load (VL) test in the electronic HIV/AIDS Reporting System (eHARS). (2010 National estimates are 79%*). (3) 55% of cases were in care this year, based on HRSA unmet need definition, for persons living with HIV in Florida (regardless of where diagnosed) and having at least 1 HIV-related care service involving either a VL or CD4 test or a refill of HIV-related RX. (2010 National estimates for in care are 56%*). (4) Estimated 90.6% of In care and on ART this year in Florida per 2011 MMP data (2010 National estimates are 80%*).(5) Estimated 78.0% on ART & the viral load is <200 this year in Florida per 2011 MMP data (2010 National estimates are 70%*). *Continuum of HIV care among Ryan White HIV/AIDS Program clients, U.S., 2010 (http://hab.hrsa.gov/data/reports/continuumofcare/index.html) For additional information please refer to the Florida Continuum of Care slide set accessible at http://www.floridahealth.gov/diseases-and-conditions/aids/surveillance/index.html
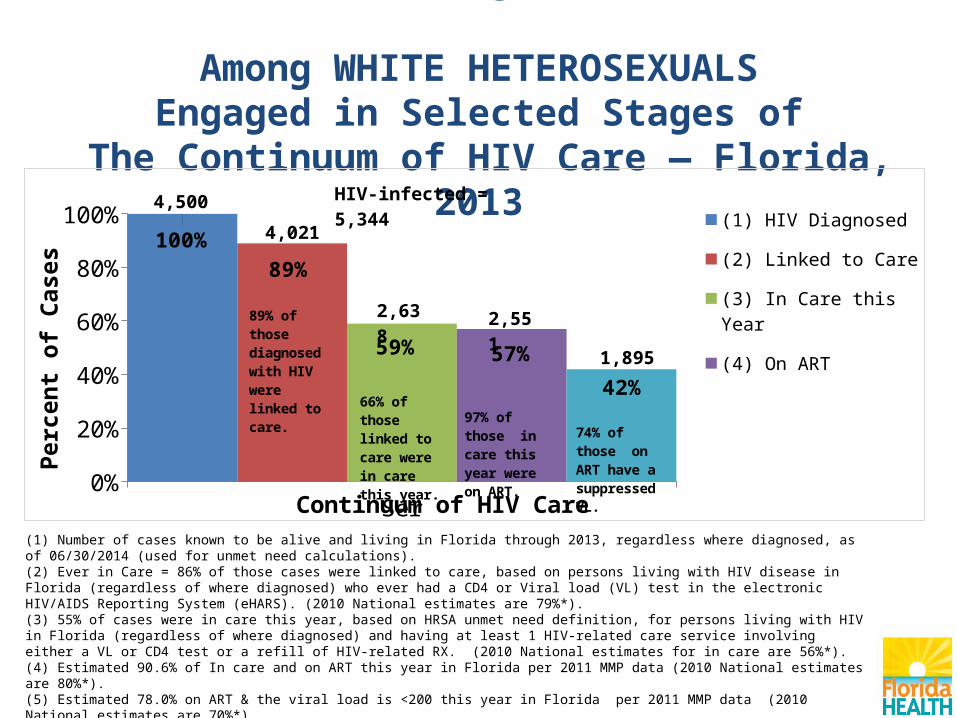
Number and Percentage of HIV-Infected Among WHITE HETEROSEXUALS
Engaged in Selected Stages of The Continuum of HIV Care — Florida, 2013
Series10%
10%20%30%40%50%60%70%80%90%
100%100%
89%
59% 57%
42%
(1) HIV Diagnosed
(2) Linked to Care
(3) In Care this Year
(4) On ART
(5) Suppressed Viral Load (<200 copies/mL on ART)
Continuum of HIV Care
Perc
ent o
f Cas
es
HIV-infected = 5,3444,500
4,021
2,638 2,551
1,895
89% of those diagnosed with HIV were linked to care.
66% of those linked to care were in care this year.
97% of those in care this year were on ART.
74% of those on ART have a suppressed VL.
(1) Number of cases known to be alive and living in Florida through 2013, regardless where diagnosed, as of 06/30/2014 (used for unmet need calculations). (2) Ever in Care = 86% of those cases were linked to care, based on persons living with HIV disease in Florida (regardless of where diagnosed) who ever had a CD4 or Viral load (VL) test in the electronic HIV/AIDS Reporting System (eHARS). (2010 National estimates are 79%*). (3) 55% of cases were in care this year, based on HRSA unmet need definition, for persons living with HIV in Florida (regardless of where diagnosed) and having at least 1 HIV-related care service involving either a VL or CD4 test or a refill of HIV-related RX. (2010 National estimates for in care are 56%*). (4) Estimated 90.6% of In care and on ART this year in Florida per 2011 MMP data (2010 National estimates are 80%*).(5) Estimated 78.0% on ART & the viral load is <200 this year in Florida per 2011 MMP data (2010 National estimates are 70%*). *Continuum of HIV care among Ryan White HIV/AIDS Program clients, U.S., 2010 (http://hab.hrsa.gov/data/reports/continuumofcare/index.html) For additional information please refer to the Florida Continuum of Care slide set accessible at http://www.floridahealth.gov/diseases-and-conditions/aids/surveillance/index.html
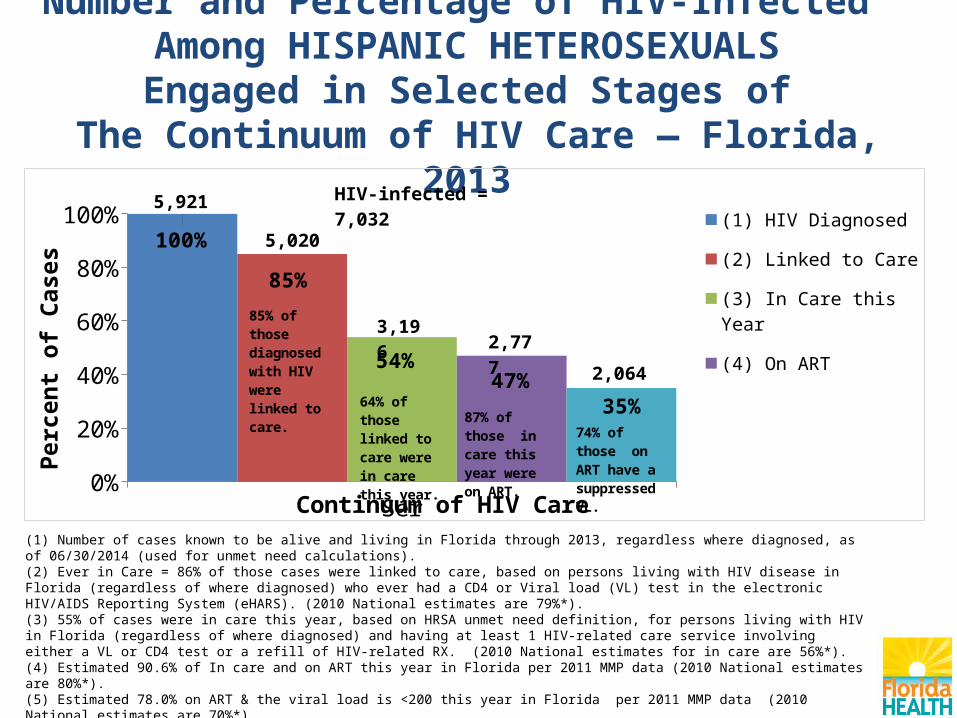
Number and Percentage of HIV-Infected Among HISPANIC HETEROSEXUALS
Engaged in Selected Stages of The Continuum of HIV Care — Florida, 2013
Series10%
10%20%30%40%50%60%70%80%90%
100%100%
85%
54%47%
35%
(1) HIV Diagnosed
(2) Linked to Care
(3) In Care this Year
(4) On ART
(5) Suppressed Viral Load (<200 copies/mL on ART)
Continuum of HIV Care
Perc
ent o
f Cas
es
HIV-infected = 7,0325,921
5,020
3,1962,777
2,064
85% of those diagnosed with HIV were linked to care.
64% of those linked to care were in care this year.
87% of those in care this year were on ART.
74% of those on ART have a suppressed VL.
(1) Number of cases known to be alive and living in Florida through 2013, regardless where diagnosed, as of 06/30/2014 (used for unmet need calculations). (2) Ever in Care = 86% of those cases were linked to care, based on persons living with HIV disease in Florida (regardless of where diagnosed) who ever had a CD4 or Viral load (VL) test in the electronic HIV/AIDS Reporting System (eHARS). (2010 National estimates are 79%*). (3) 55% of cases were in care this year, based on HRSA unmet need definition, for persons living with HIV in Florida (regardless of where diagnosed) and having at least 1 HIV-related care service involving either a VL or CD4 test or a refill of HIV-related RX. (2010 National estimates for in care are 56%*). (4) Estimated 90.6% of In care and on ART this year in Florida per 2011 MMP data (2010 National estimates are 80%*).(5) Estimated 78.0% on ART & the viral load is <200 this year in Florida per 2011 MMP data (2010 National estimates are 70%*). *Continuum of HIV care among Ryan White HIV/AIDS Program clients, U.S., 2010 (http://hab.hrsa.gov/data/reports/continuumofcare/index.html) For additional information please refer to the Florida Continuum of Care slide set accessible at http://www.floridahealth.gov/diseases-and-conditions/aids/surveillance/index.html
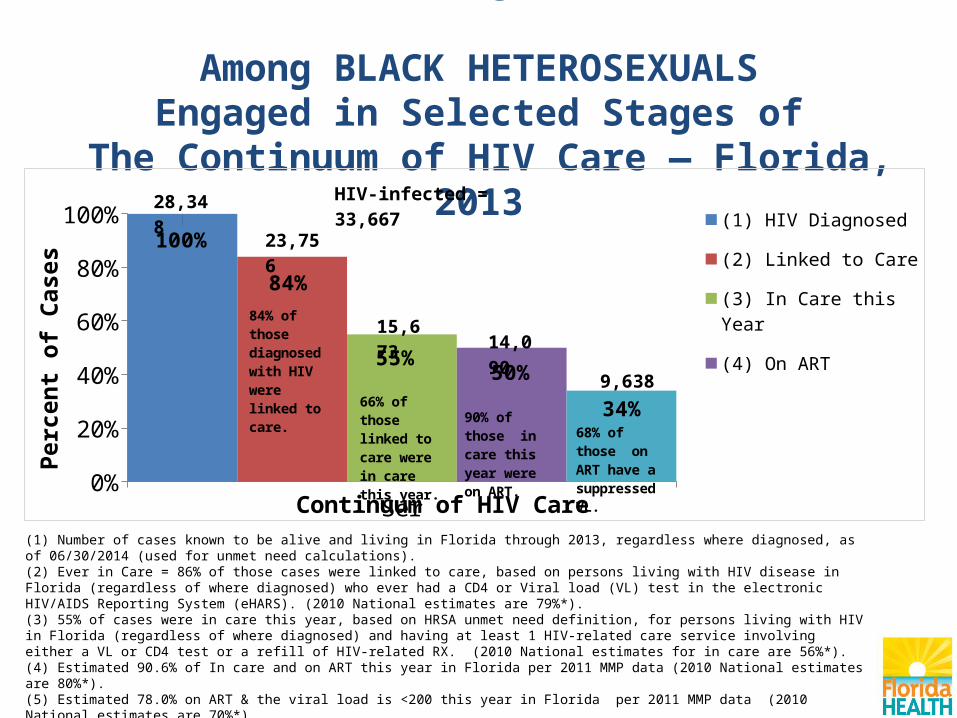
Number and Percentage of HIV-Infected Among BLACK HETEROSEXUALSEngaged in Selected Stages of
The Continuum of HIV Care — Florida, 2013
Series10%
10%20%30%40%50%60%70%80%90%
100%100%
84%
55%50%
34%
(1) HIV Diagnosed
(2) Linked to Care
(3) In Care this Year
(4) On ART
(5) Suppressed Viral Load (<200 copies/mL on ART)
Continuum of HIV Care
Perc
ent o
f Cas
es
HIV-infected = 33,66728,348
23,756
15,673 14,09
09,638
84% of those diagnosed with HIV were linked to care.
66% of those linked to care were in care this year.
90% of those in care this year were on ART.
68% of those on ART have a suppressed VL.
(1) Number of cases known to be alive and living in Florida through 2013, regardless where diagnosed, as of 06/30/2014 (used for unmet need calculations). (2) Ever in Care = 86% of those cases were linked to care, based on persons living with HIV disease in Florida (regardless of where diagnosed) who ever had a CD4 or Viral load (VL) test in the electronic HIV/AIDS Reporting System (eHARS). (2010 National estimates are 79%*). (3) 55% of cases were in care this year, based on HRSA unmet need definition, for persons living with HIV in Florida (regardless of where diagnosed) and having at least 1 HIV-related care service involving either a VL or CD4 test or a refill of HIV-related RX. (2010 National estimates for in care are 56%*). (4) Estimated 90.6% of In care and on ART this year in Florida per 2011 MMP data (2010 National estimates are 80%*).(5) Estimated 78.0% on ART & the viral load is <200 this year in Florida per 2011 MMP data (2010 National estimates are 70%*). *Continuum of HIV care among Ryan White HIV/AIDS Program clients, U.S., 2010 (http://hab.hrsa.gov/data/reports/continuumofcare/index.html) For additional information please refer to the Florida Continuum of Care slide set accessible at http://www.floridahealth.gov/diseases-and-conditions/aids/surveillance/index.html
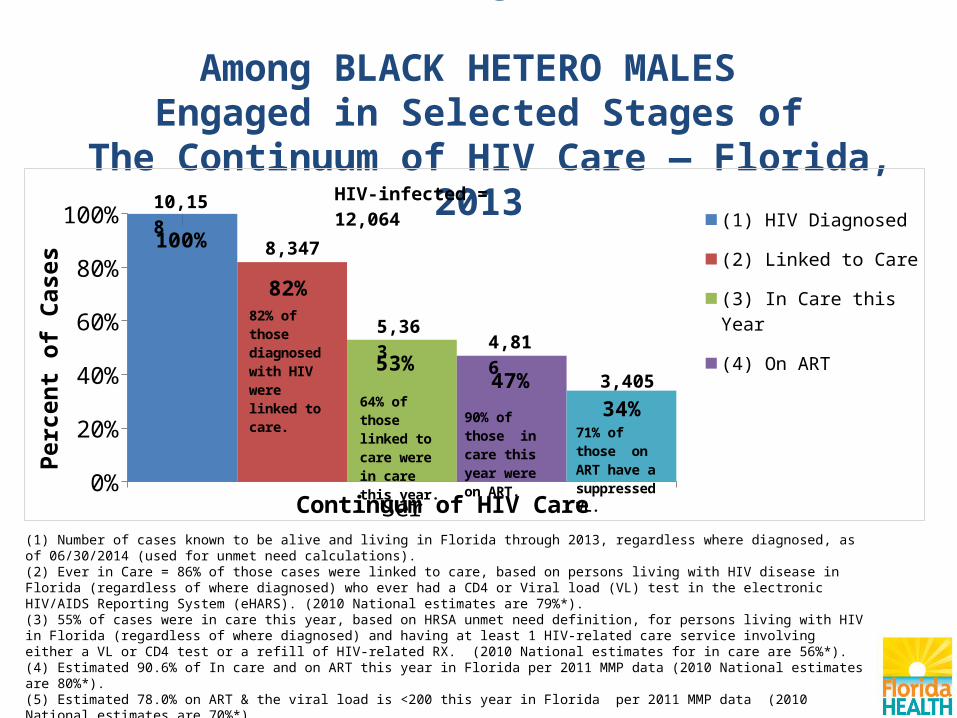
Number and Percentage of HIV-Infected Among BLACK HETERO MALES Engaged in Selected Stages of
The Continuum of HIV Care — Florida, 2013
Series10%
10%20%30%40%50%60%70%80%90%
100%100%
82%
53%47%
34%
(1) HIV Diagnosed
(2) Linked to Care
(3) In Care this Year
(4) On ART
(5) Suppressed Viral Load (<200 copies/mL on ART)
Continuum of HIV Care
Perc
ent o
f Cas
es
HIV-infected = 12,06410,158
8,347
5,3634,816
3,405
82% of those diagnosed with HIV were linked to care.
64% of those linked to care were in care this year.
90% of those in care this year were on ART.
71% of those on ART have a suppressed VL.
(1) Number of cases known to be alive and living in Florida through 2013, regardless where diagnosed, as of 06/30/2014 (used for unmet need calculations). (2) Ever in Care = 86% of those cases were linked to care, based on persons living with HIV disease in Florida (regardless of where diagnosed) who ever had a CD4 or Viral load (VL) test in the electronic HIV/AIDS Reporting System (eHARS). (2010 National estimates are 79%*). (3) 55% of cases were in care this year, based on HRSA unmet need definition, for persons living with HIV in Florida (regardless of where diagnosed) and having at least 1 HIV-related care service involving either a VL or CD4 test or a refill of HIV-related RX. (2010 National estimates for in care are 56%*). (4) Estimated 90.6% of In care and on ART this year in Florida per 2011 MMP data (2010 National estimates are 80%*).(5) Estimated 78.0% on ART & the viral load is <200 this year in Florida per 2011 MMP data (2010 National estimates are 70%*). *Continuum of HIV care among Ryan White HIV/AIDS Program clients, U.S., 2010 (http://hab.hrsa.gov/data/reports/continuumofcare/index.html) For additional information please refer to the Florida Continuum of Care slide set accessible at http://www.floridahealth.gov/diseases-and-conditions/aids/surveillance/index.html

Number and Percentage of HIV-Infected Among BLACK HETERO FEMALES
Engaged in Selected Stages of The Continuum of HIV Care — Florida, 2013
Series10%
10%20%30%40%50%60%70%80%90%
100%100%
85%
57%51%
34%
(1) HIV Diagnosed
(2) Linked to Care
(3) In Care this Year
(4) On ART
(5) Suppressed Viral Load (<200 copies/mL on ART)
Continuum of HIV Care
Perc
ent o
f Cas
es
HIV-infected = 21,60318,190
15,409
10,309 9,278
6,170
85% of those diagnosed with HIV were linked to care.
67% of those linked to care were in care this year.
90% of those in care this year were on ART.
67% of those on ART have a suppressed VL.
(1) Number of cases known to be alive and living in Florida through 2013, regardless where diagnosed, as of 06/30/2014 (used for unmet need calculations). (2) Ever in Care = 86% of those cases were linked to care, based on persons living with HIV disease in Florida (regardless of where diagnosed) who ever had a CD4 or Viral load (VL) test in the electronic HIV/AIDS Reporting System (eHARS). (2010 National estimates are 79%*). (3) 55% of cases were in care this year, based on HRSA unmet need definition, for persons living with HIV in Florida (regardless of where diagnosed) and having at least 1 HIV-related care service involving either a VL or CD4 test or a refill of HIV-related RX. (2010 National estimates for in care are 56%*). (4) Estimated 90.6% of In care and on ART this year in Florida per 2011 MMP data (2010 National estimates are 80%*).(5) Estimated 78.0% on ART & the viral load is <200 this year in Florida per 2011 MMP data (2010 National estimates are 70%*). *Continuum of HIV care among Ryan White HIV/AIDS Program clients, U.S., 2010 (http://hab.hrsa.gov/data/reports/continuumofcare/index.html) For additional information please refer to the Florida Continuum of Care slide set accessible at http://www.floridahealth.gov/diseases-and-conditions/aids/surveillance/index.html

Number and Percentage of HIV-Infected PersonsEngaged in Selected Stages of
The Continuum of HIV Care — Partnership 1, 2013
Series10%
10%20%30%40%50%60%70%80%90%
100%100%
93%
65%59%
46%
(1) HIV Diagnosed
(2) Linked to Care
(3) In Care this Year
(4) On ART
(5) Suppressed Viral Load (<200 copies/mL on ART)
Continuum of HIV Care
Perc
ent o
f Cas
es
HIV-infected = 2,2001,8521,730
1,1981,085
847
93% of those di-agnosed with HIV were linked to care.
69% of those linked to care were in care this year.
91% of those in care this year were on ART.
78% of those on ART have a suppressed VL.
(1) Number of cases known to be alive and living in Florida through 2013, regardless where diagnosed, as of 06/30/2014 (used for unmet need calculations). (2) Ever in Care = 86% of those cases were linked to care, based on persons living with HIV disease in Florida (regardless of where diagnosed) who ever had a CD4 or Viral load (VL) test in the electronic HIV/AIDS Reporting System (eHARS). (2010 National estimates are 79%*). (3) 55% of cases were in care this year, based on HRSA unmet need definition, for persons living with HIV in Florida (regardless of where diagnosed) and having at least 1 HIV-related care service involving either a VL or CD4 test or a refill of HIV-related RX. (2010 National estimates for in care are 56%*). (4) Estimated 90.6% of In care and on ART this year in Florida per 2011 MMP data (2010 National estimates are 80%*).(5) Estimated 78.0% on ART & the viral load is <200 this year in Florida per 2011 MMP data (2010 National estimates are 70%*). *Continuum of HIV care among Ryan White HIV/AIDS Program clients, U.S., 2010 (http://hab.hrsa.gov/data/reports/continuumofcare/index.html) For additional information please refer to the Florida Continuum of Care slide set accessible at http://www.floridahealth.gov/diseases-and-conditions/aids/surveillance/index.html
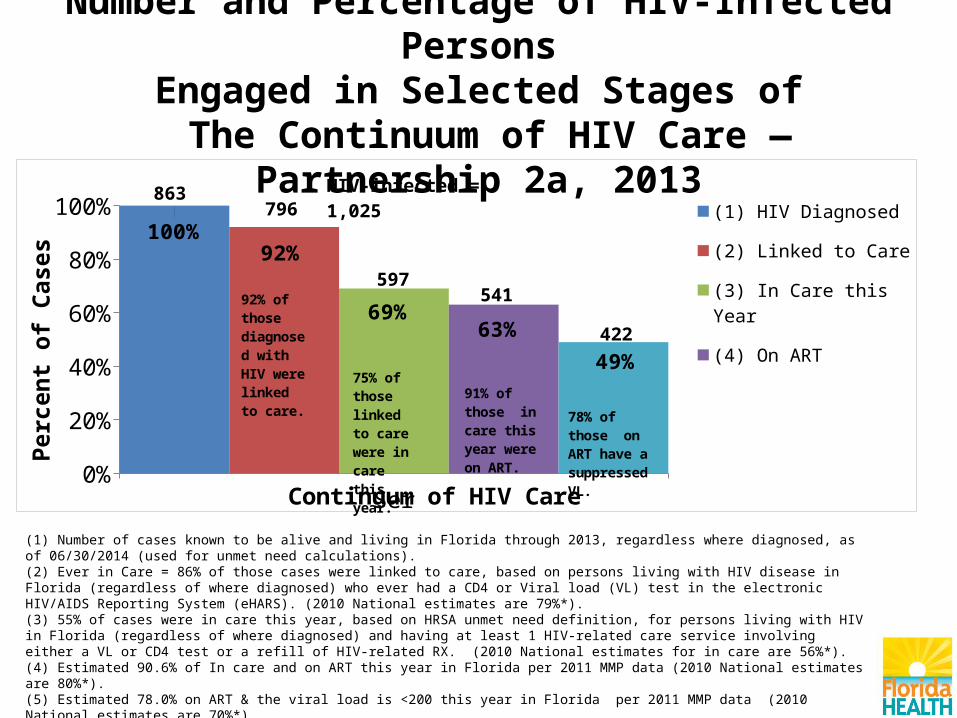
Number and Percentage of HIV-Infected PersonsEngaged in Selected Stages of
The Continuum of HIV Care — Partnership 2a, 2013
Series10%
10%20%30%40%50%60%70%80%90%
100%100%
92%
69%63%
49%
(1) HIV Diagnosed
(2) Linked to Care
(3) In Care this Year
(4) On ART
(5) Suppressed Viral Load (<200 copies/mL on ART)
Continuum of HIV Care
Perc
ent o
f Cas
es
HIV-infected = 1,025863796
597541
422
92% of those di-agnosed with HIV were linked to care.
75% of those linked to care were in care this year.
91% of those in care this year were on ART.
78% of those on ART have a suppressed VL.
(1) Number of cases known to be alive and living in Florida through 2013, regardless where diagnosed, as of 06/30/2014 (used for unmet need calculations). (2) Ever in Care = 86% of those cases were linked to care, based on persons living with HIV disease in Florida (regardless of where diagnosed) who ever had a CD4 or Viral load (VL) test in the electronic HIV/AIDS Reporting System (eHARS). (2010 National estimates are 79%*). (3) 55% of cases were in care this year, based on HRSA unmet need definition, for persons living with HIV in Florida (regardless of where diagnosed) and having at least 1 HIV-related care service involving either a VL or CD4 test or a refill of HIV-related RX. (2010 National estimates for in care are 56%*). (4) Estimated 90.6% of In care and on ART this year in Florida per 2011 MMP data (2010 National estimates are 80%*).(5) Estimated 78.0% on ART & the viral load is <200 this year in Florida per 2011 MMP data (2010 National estimates are 70%*). *Continuum of HIV care among Ryan White HIV/AIDS Program clients, U.S., 2010 (http://hab.hrsa.gov/data/reports/continuumofcare/index.html) For additional information please refer to the Florida Continuum of Care slide set accessible at http://www.floridahealth.gov/diseases-and-conditions/aids/surveillance/index.html
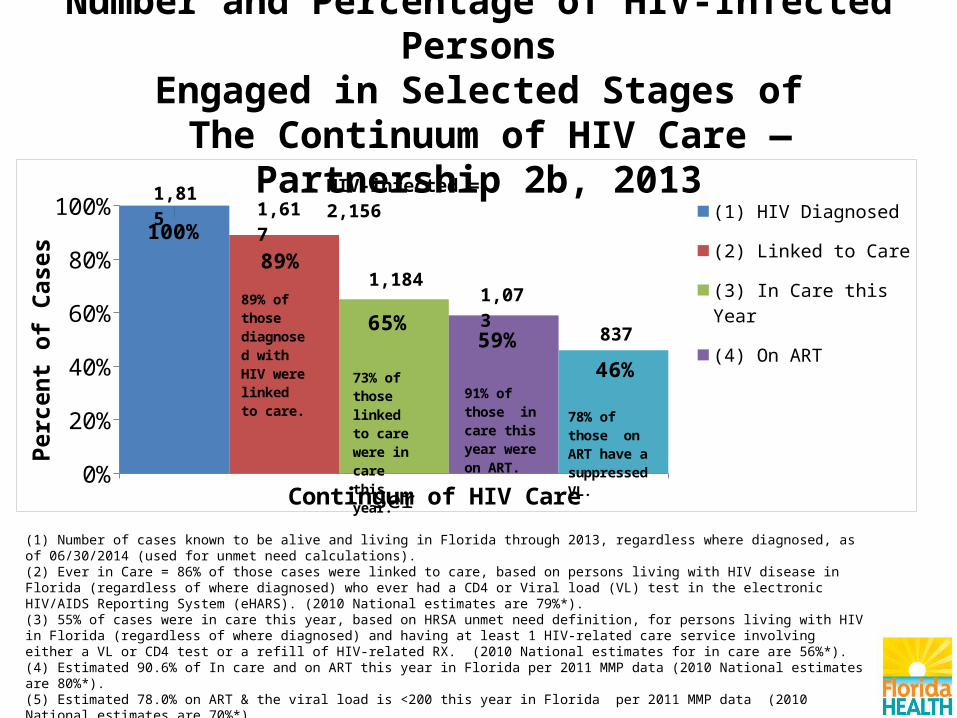
Number and Percentage of HIV-Infected PersonsEngaged in Selected Stages of
The Continuum of HIV Care — Partnership 2b, 2013
Series10%
10%20%30%40%50%60%70%80%90%
100%100%
89%
65%59%
46%
(1) HIV Diagnosed
(2) Linked to Care
(3) In Care this Year
(4) On ART
(5) Suppressed Viral Load (<200 copies/mL on ART)
Continuum of HIV Care
Perc
ent o
f Cas
es
HIV-infected = 2,1561,8151,617
1,1841,073
837
89% of those di-agnosed with HIV were linked to care.
73% of those linked to care were in care this year.
91% of those in care this year were on ART.
78% of those on ART have a suppressed VL.
(1) Number of cases known to be alive and living in Florida through 2013, regardless where diagnosed, as of 06/30/2014 (used for unmet need calculations). (2) Ever in Care = 86% of those cases were linked to care, based on persons living with HIV disease in Florida (regardless of where diagnosed) who ever had a CD4 or Viral load (VL) test in the electronic HIV/AIDS Reporting System (eHARS). (2010 National estimates are 79%*). (3) 55% of cases were in care this year, based on HRSA unmet need definition, for persons living with HIV in Florida (regardless of where diagnosed) and having at least 1 HIV-related care service involving either a VL or CD4 test or a refill of HIV-related RX. (2010 National estimates for in care are 56%*). (4) Estimated 90.6% of In care and on ART this year in Florida per 2011 MMP data (2010 National estimates are 80%*).(5) Estimated 78.0% on ART & the viral load is <200 this year in Florida per 2011 MMP data (2010 National estimates are 70%*). *Continuum of HIV care among Ryan White HIV/AIDS Program clients, U.S., 2010 (http://hab.hrsa.gov/data/reports/continuumofcare/index.html) For additional information please refer to the Florida Continuum of Care slide set accessible at http://www.floridahealth.gov/diseases-and-conditions/aids/surveillance/index.html

Number and Percentage of HIV-Infected PersonsEngaged in Selected Stages of
The Continuum of HIV Care — Partnership 3, 2013
(1) Number of cases known to be alive and living in Florida through 2013, regardless where diagnosed, as of 06/30/2014 (used for unmet need calculations). (2) Ever in Care = 86% of those cases were linked to care, based on persons living with HIV disease in Florida (regardless of where diagnosed) who ever had a CD4 or Viral load (VL) test in the electronic HIV/AIDS Reporting System (eHARS). (2010 National estimates are 79%*). (3) 55% of cases were in care this year, based on HRSA unmet need definition, for persons living with HIV in Florida (regardless of where diagnosed) and having at least 1 HIV-related care service involving either a VL or CD4 test or a refill of HIV-related RX. (2010 National estimates for in care are 56%*). (4) Estimated 90.6% of In care and on ART this year in Florida per 2011 MMP data (2010 National estimates are 80%*).(5) Estimated 78.0% on ART & the viral load is <200 this year in Florida per 2011 MMP data (2010 National estimates are 70%*). *Continuum of HIV care among Ryan White HIV/AIDS Program clients, U.S., 2010 (http://hab.hrsa.gov/data/reports/continuumofcare/index.html) For additional information please refer to the Florida Continuum of Care slide set accessible at http://www.floridahealth.gov/diseases-and-conditions/aids/surveillance/index.html
Series10%
10%20%30%40%50%60%70%80%90%
100%100%
93%
68%62%
48%
(1) HIV Diagnosed
(2) Linked to Care
(3) In Care this Year
(4) On ART
(5) Suppressed Viral Load (<200 copies/mL on ART)
Continuum of HIV Care
Perc
ent o
f Cas
es
HIV-infected = 2,3341,9651,825
1,3421,216
948
93% of those di-agnosed with HIV were linked to care.
74% of those linked to care were in care this year.
91% of those in care this year were on ART.
78% of those on ART have a suppressed VL.

Number and Percentage of HIV-Infected PersonsEngaged in Selected Stages of
The Continuum of HIV Care — Partnership 13, 2013
Series10%
10%20%30%40%50%60%70%80%90%
100%100%
94%
68%62%
48%
(1) HIV Diagnosed
(2) Linked to Care
(3) In Care this Year
(4) On ART
(5) Suppressed Viral Load (<200 copies/mL on ART)
Continuum of HIV Care
Perc
ent o
f Cas
es
HIV-infected = 2,4602,0711,956
1,4151,282
1,000
94% of those di-agnosed with HIV were linked to care.
72% of those linked to care were in care this year.
91% of those in care this year were on ART.
78% of those on ART have a suppressed VL.
(1) Number of cases known to be alive and living in Florida through 2013, regardless where diagnosed, as of 06/30/2014 (used for unmet need calculations). (2) Ever in Care = 86% of those cases were linked to care, based on persons living with HIV disease in Florida (regardless of where diagnosed) who ever had a CD4 or Viral load (VL) test in the electronic HIV/AIDS Reporting System (eHARS). (2010 National estimates are 79%*). (3) 55% of cases were in care this year, based on HRSA unmet need definition, for persons living with HIV in Florida (regardless of where diagnosed) and having at least 1 HIV-related care service involving either a VL or CD4 test or a refill of HIV-related RX. (2010 National estimates for in care are 56%*). (4) Estimated 90.6% of In care and on ART this year in Florida per 2011 MMP data (2010 National estimates are 80%*).(5) Estimated 78.0% on ART & the viral load is <200 this year in Florida per 2011 MMP data (2010 National estimates are 70%*). *Continuum of HIV care among Ryan White HIV/AIDS Program clients, U.S., 2010 (http://hab.hrsa.gov/data/reports/continuumofcare/index.html) For additional information please refer to the Florida Continuum of Care slide set accessible at http://www.floridahealth.gov/diseases-and-conditions/aids/surveillance/index.html
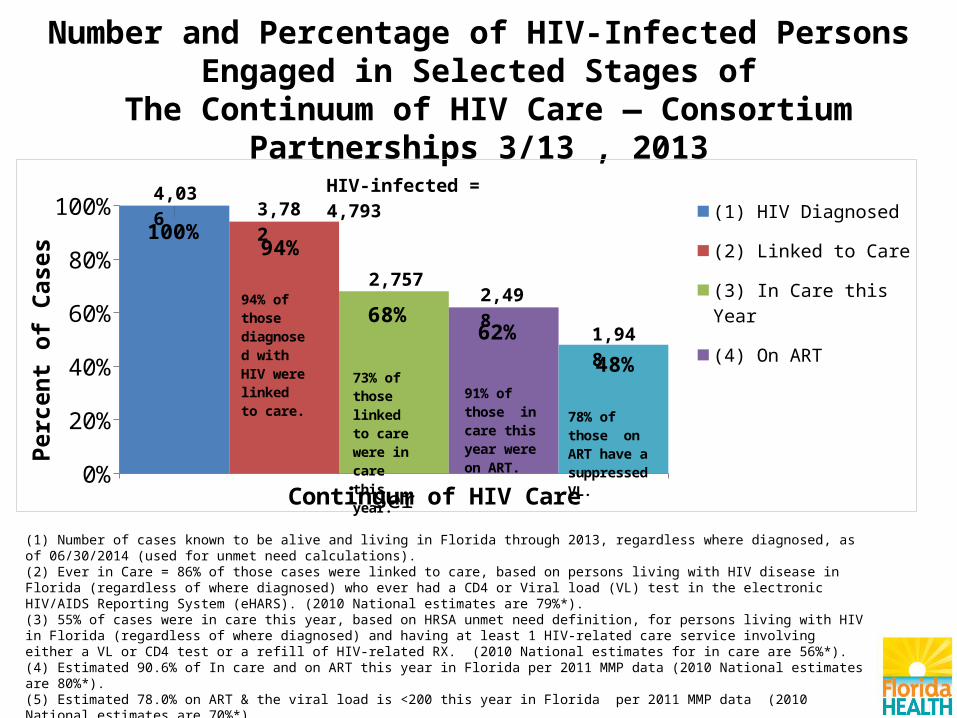
Number and Percentage of HIV-Infected PersonsEngaged in Selected Stages of
The Continuum of HIV Care — Consortium Partnerships 3/13 , 2013
(1) Number of cases known to be alive and living in Florida through 2013, regardless where diagnosed, as of 06/30/2014 (used for unmet need calculations). (2) Ever in Care = 86% of those cases were linked to care, based on persons living with HIV disease in Florida (regardless of where diagnosed) who ever had a CD4 or Viral load (VL) test in the electronic HIV/AIDS Reporting System (eHARS). (2010 National estimates are 79%*). (3) 55% of cases were in care this year, based on HRSA unmet need definition, for persons living with HIV in Florida (regardless of where diagnosed) and having at least 1 HIV-related care service involving either a VL or CD4 test or a refill of HIV-related RX. (2010 National estimates for in care are 56%*). (4) Estimated 90.6% of In care and on ART this year in Florida per 2011 MMP data (2010 National estimates are 80%*).(5) Estimated 78.0% on ART & the viral load is <200 this year in Florida per 2011 MMP data (2010 National estimates are 70%*). *Continuum of HIV care among Ryan White HIV/AIDS Program clients, U.S., 2010 (http://hab.hrsa.gov/data/reports/continuumofcare/index.html) For additional information please refer to the Florida Continuum of Care slide set accessible at http://www.floridahealth.gov/diseases-and-conditions/aids/surveillance/index.html
Series10%
10%20%30%40%50%60%70%80%90%
100%100%
94%
68%62%
48%
(1) HIV Diagnosed
(2) Linked to Care
(3) In Care this Year
(4) On ART
(5) Suppressed Viral Load (<200 copies/mL on ART)
Continuum of HIV Care
Perc
ent o
f Cas
es
HIV-infected = 4,7934,0363,782
2,7572,498
1,948
94% of those di-agnosed with HIV were linked to care.
73% of those linked to care were in care this year.
91% of those in care this year were on ART.
78% of those on ART have a suppressed VL.

Number and Percentage of HIV-Infected PersonsEngaged in Selected Stages of
The Continuum of HIV Care — Partnership 4, 2013
Series10%
10%20%30%40%50%60%70%80%90%
100%100%
91%
65%59%
46%
(1) HIV Diagnosed
(2) Linked to Care
(3) In Care this Year
(4) On ART
(5) Suppressed Viral Load (<200 copies/mL on ART)
Continuum of HIV Care
Perc
ent o
f Cas
es
HIV-infected = 7,7406,5175,917
4,2103,814
2,975
91% of those di-agnosed with HIV were linked to care.
71% of those linked to care were in care this year.
91% of those in care this year were on ART.
78% of those on ART have a suppressed VL.
(1) Number of cases known to be alive and living in Florida through 2013, regardless where diagnosed, as of 06/30/2014 (used for unmet need calculations). (2) Ever in Care = 86% of those cases were linked to care, based on persons living with HIV disease in Florida (regardless of where diagnosed) who ever had a CD4 or Viral load (VL) test in the electronic HIV/AIDS Reporting System (eHARS). (2010 National estimates are 79%*). (3) 55% of cases were in care this year, based on HRSA unmet need definition, for persons living with HIV in Florida (regardless of where diagnosed) and having at least 1 HIV-related care service involving either a VL or CD4 test or a refill of HIV-related RX. (2010 National estimates for in care are 56%*). (4) Estimated 90.6% of In care and on ART this year in Florida per 2011 MMP data (2010 National estimates are 80%*).(5) Estimated 78.0% on ART & the viral load is <200 this year in Florida per 2011 MMP data (2010 National estimates are 70%*). *Continuum of HIV care among Ryan White HIV/AIDS Program clients, U.S., 2010 (http://hab.hrsa.gov/data/reports/continuumofcare/index.html) For additional information please refer to the Florida Continuum of Care slide set accessible at http://www.floridahealth.gov/diseases-and-conditions/aids/surveillance/index.html
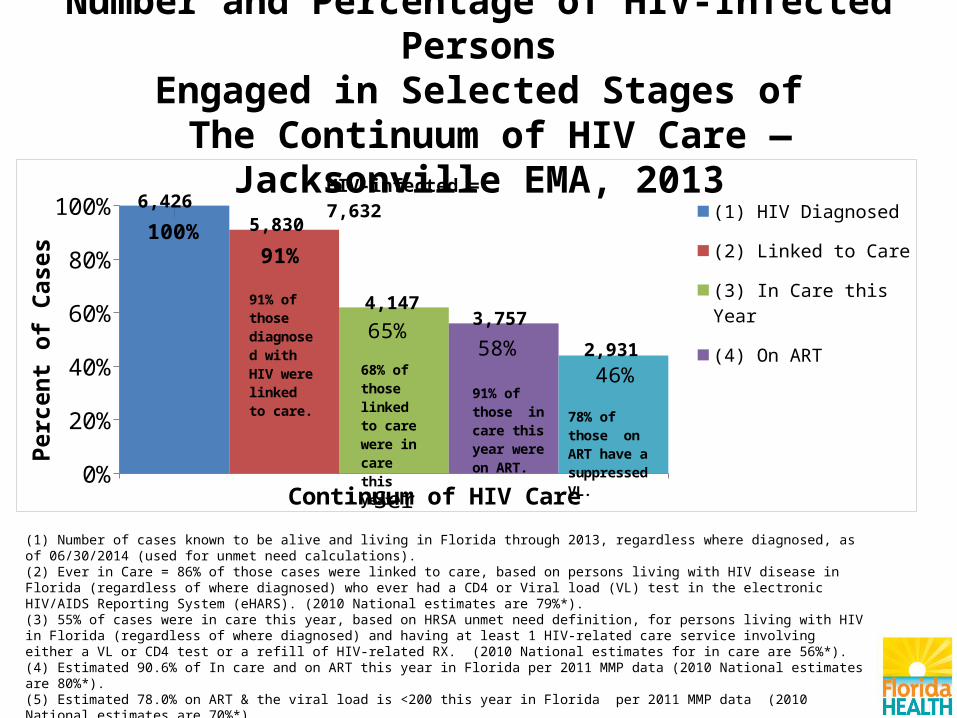
Number and Percentage of HIV-Infected PersonsEngaged in Selected Stages of
The Continuum of HIV Care — Jacksonville EMA, 2013
Series10%
10%20%30%40%50%60%70%80%90%
100%100%
91%
65%58%
46%
(1) HIV Diagnosed
(2) Linked to Care
(3) In Care this Year
(4) On ART
(5) Suppressed Viral Load (<200 copies/mL on ART)
Continuum of HIV Care
Perc
ent o
f Cas
es
HIV-infected = 7,6326,426
5,830
4,1473,757
2,931
91% of those di-agnosed with HIV were linked to care.
68% of those linked to care were in care this year.
91% of those in care this year were on ART.
78% of those on ART have a suppressed VL.
(1) Number of cases known to be alive and living in Florida through 2013, regardless where diagnosed, as of 06/30/2014 (used for unmet need calculations). (2) Ever in Care = 86% of those cases were linked to care, based on persons living with HIV disease in Florida (regardless of where diagnosed) who ever had a CD4 or Viral load (VL) test in the electronic HIV/AIDS Reporting System (eHARS). (2010 National estimates are 79%*). (3) 55% of cases were in care this year, based on HRSA unmet need definition, for persons living with HIV in Florida (regardless of where diagnosed) and having at least 1 HIV-related care service involving either a VL or CD4 test or a refill of HIV-related RX. (2010 National estimates for in care are 56%*). (4) Estimated 90.6% of In care and on ART this year in Florida per 2011 MMP data (2010 National estimates are 80%*).(5) Estimated 78.0% on ART & the viral load is <200 this year in Florida per 2011 MMP data (2010 National estimates are 70%*). *Continuum of HIV care among Ryan White HIV/AIDS Program clients, U.S., 2010 (http://hab.hrsa.gov/data/reports/continuumofcare/index.html) For additional information please refer to the Florida Continuum of Care slide set accessible at http://www.floridahealth.gov/diseases-and-conditions/aids/surveillance/index.html

Number and Percentage of HIV-Infected PersonsEngaged in Selected Stages of
The Continuum of HIV Care — Partnership 5, 2013
(1) Number of cases known to be alive and living in Florida through 2013, regardless where diagnosed, as of 06/30/2014 (used for unmet need calculations). (2) Ever in Care = 86% of those cases were linked to care, based on persons living with HIV disease in Florida (regardless of where diagnosed) who ever had a CD4 or Viral load (VL) test in the electronic HIV/AIDS Reporting System (eHARS). (2010 National estimates are 79%*). (3) 55% of cases were in care this year, based on HRSA unmet need definition, for persons living with HIV in Florida (regardless of where diagnosed) and having at least 1 HIV-related care service involving either a VL or CD4 test or a refill of HIV-related RX. (2010 National estimates for in care are 56%*). (4) Estimated 90.6% of In care and on ART this year in Florida per 2011 MMP data (2010 National estimates are 80%*).(5) Estimated 78.0% on ART & the viral load is <200 this year in Florida per 2011 MMP data (2010 National estimates are 70%*). *Continuum of HIV care among Ryan White HIV/AIDS Program clients, U.S., 2010 (http://hab.hrsa.gov/data/reports/continuumofcare/index.html) For additional information please refer to the Florida Continuum of Care slide set accessible at http://www.floridahealth.gov/diseases-and-conditions/aids/surveillance/index.html
Series10%
10%20%30%40%50%60%70%80%90%
100%100%
94%
68%61%
48%
(1) HIV Diagnosed
(2) Linked to Care
(3) In Care this Year
(4) On ART
(5) Suppressed Viral Load (<200 copies/mL on ART)
Continuum of HIV Care
Perc
ent o
f Cas
es
HIV-infected = 5,9054,9724,652
3,3573,041
2,372
94% of those di-agnosed with HIV were linked to care.
72% of those linked to care were in care this year.
91% of those in care this year were on ART.
78% of those on ART have a suppressed VL.

Number and Percentage of HIV-Infected PersonsEngaged in Selected Stages of
The Continuum of HIV Care — Partnership 6, 2013
(1) Number of cases known to be alive and living in Florida through 2013, regardless where diagnosed, as of 06/30/2014 (used for unmet need calculations). (2) Ever in Care = 86% of those cases were linked to care, based on persons living with HIV disease in Florida (regardless of where diagnosed) who ever had a CD4 or Viral load (VL) test in the electronic HIV/AIDS Reporting System (eHARS). (2010 National estimates are 79%*). (3) 55% of cases were in care this year, based on HRSA unmet need definition, for persons living with HIV in Florida (regardless of where diagnosed) and having at least 1 HIV-related care service involving either a VL or CD4 test or a refill of HIV-related RX. (2010 National estimates for in care are 56%*). (4) Estimated 90.6% of In care and on ART this year in Florida per 2011 MMP data (2010 National estimates are 80%*).(5) Estimated 78.0% on ART & the viral load is <200 this year in Florida per 2011 MMP data (2010 National estimates are 70%*). *Continuum of HIV care among Ryan White HIV/AIDS Program clients, U.S., 2010 (http://hab.hrsa.gov/data/reports/continuumofcare/index.html) For additional information please refer to the Florida Continuum of Care slide set accessible at http://www.floridahealth.gov/diseases-and-conditions/aids/surveillance/index.html
Series10%
10%20%30%40%50%60%70%80%90%
100%100%
91%
63%57%
44%
(1) HIV Diagnosed
(2) Linked to Care
(3) In Care this Year
(4) On ART
(5) Suppressed Viral Load (<200 copies/mL on ART)
Continuum of HIV Care
Perc
ent o
f Cas
es
HIV-infected = 9,0557,6246,974
4,7934,342
3,387
91% of those di-agnosed with HIV were linked to care.
69% of those linked to care were in care this year.
91% of those in care this year were on ART.
78% of those on ART have a suppressed VL.
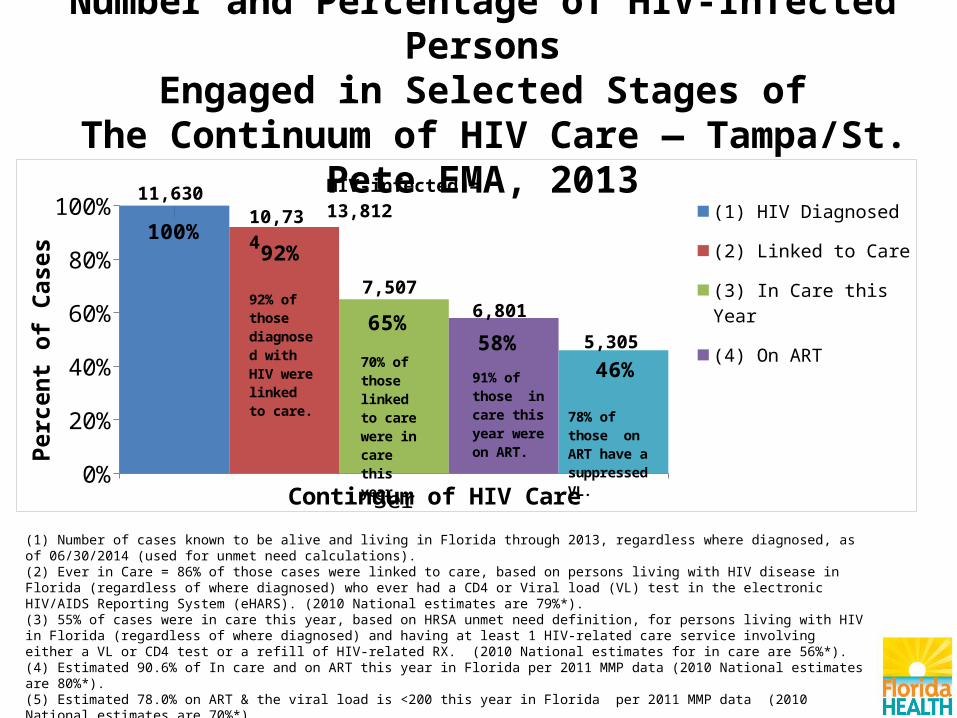
Number and Percentage of HIV-Infected PersonsEngaged in Selected Stages of
The Continuum of HIV Care — Tampa/St. Pete EMA, 2013
Series10%
10%20%30%40%50%60%70%80%90%
100%100%
92%
65%58%
46%
(1) HIV Diagnosed
(2) Linked to Care
(3) In Care this Year
(4) On ART
(5) Suppressed Viral Load (<200 copies/mL on ART)
Continuum of HIV Care
Perc
ent o
f Cas
es
HIV-infected = 13,81211,63010,734
7,5076,801
5,305
92% of those di-agnosed with HIV were linked to care.
70% of those linked to care were in care this year.
91% of those in care this year were on ART.
78% of those on ART have a suppressed VL.
(1) Number of cases known to be alive and living in Florida through 2013, regardless where diagnosed, as of 06/30/2014 (used for unmet need calculations). (2) Ever in Care = 86% of those cases were linked to care, based on persons living with HIV disease in Florida (regardless of where diagnosed) who ever had a CD4 or Viral load (VL) test in the electronic HIV/AIDS Reporting System (eHARS). (2010 National estimates are 79%*). (3) 55% of cases were in care this year, based on HRSA unmet need definition, for persons living with HIV in Florida (regardless of where diagnosed) and having at least 1 HIV-related care service involving either a VL or CD4 test or a refill of HIV-related RX. (2010 National estimates for in care are 56%*). (4) Estimated 90.6% of In care and on ART this year in Florida per 2011 MMP data (2010 National estimates are 80%*).(5) Estimated 78.0% on ART & the viral load is <200 this year in Florida per 2011 MMP data (2010 National estimates are 70%*). *Continuum of HIV care among Ryan White HIV/AIDS Program clients, U.S., 2010 (http://hab.hrsa.gov/data/reports/continuumofcare/index.html) For additional information please refer to the Florida Continuum of Care slide set accessible at http://www.floridahealth.gov/diseases-and-conditions/aids/surveillance/index.html

Number and Percentage of HIV-Infected PersonsEngaged in Selected Stages of
The Continuum of HIV Care — Partnership 14, 2013
(1) Number of cases known to be alive and living in Florida through 2013, regardless where diagnosed, as of 06/30/2014 (used for unmet need calculations). (2) Ever in Care = 86% of those cases were linked to care, based on persons living with HIV disease in Florida (regardless of where diagnosed) who ever had a CD4 or Viral load (VL) test in the electronic HIV/AIDS Reporting System (eHARS). (2010 National estimates are 79%*). (3) 55% of cases were in care this year, based on HRSA unmet need definition, for persons living with HIV in Florida (regardless of where diagnosed) and having at least 1 HIV-related care service involving either a VL or CD4 test or a refill of HIV-related RX. (2010 National estimates for in care are 56%*). (4) Estimated 90.6% of In care and on ART this year in Florida per 2011 MMP data (2010 National estimates are 80%*).(5) Estimated 78.0% on ART & the viral load is <200 this year in Florida per 2011 MMP data (2010 National estimates are 70%*). *Continuum of HIV care among Ryan White HIV/AIDS Program clients, U.S., 2010 (http://hab.hrsa.gov/data/reports/continuumofcare/index.html) For additional information please refer to the Florida Continuum of Care slide set accessible at http://www.floridahealth.gov/diseases-and-conditions/aids/surveillance/index.html
Series10%
10%20%30%40%50%60%70%80%90%
100%100%
91%
66%60%
47%
(1) HIV Diagnosed
(2) Linked to Care
(3) In Care this Year
(4) On ART
(5) Suppressed Viral Load (<200 copies/mL on ART)
Continuum of HIV Care
Perc
ent o
f Cas
es
HIV-infected = 2,6852,2612,066
1,4891,349
1,052
91% of those di-agnosed with HIV were linked to care.
72% of those linked to care were in care this year.
91% of those in care this year were on ART.
78% of those on ART have a suppressed VL.
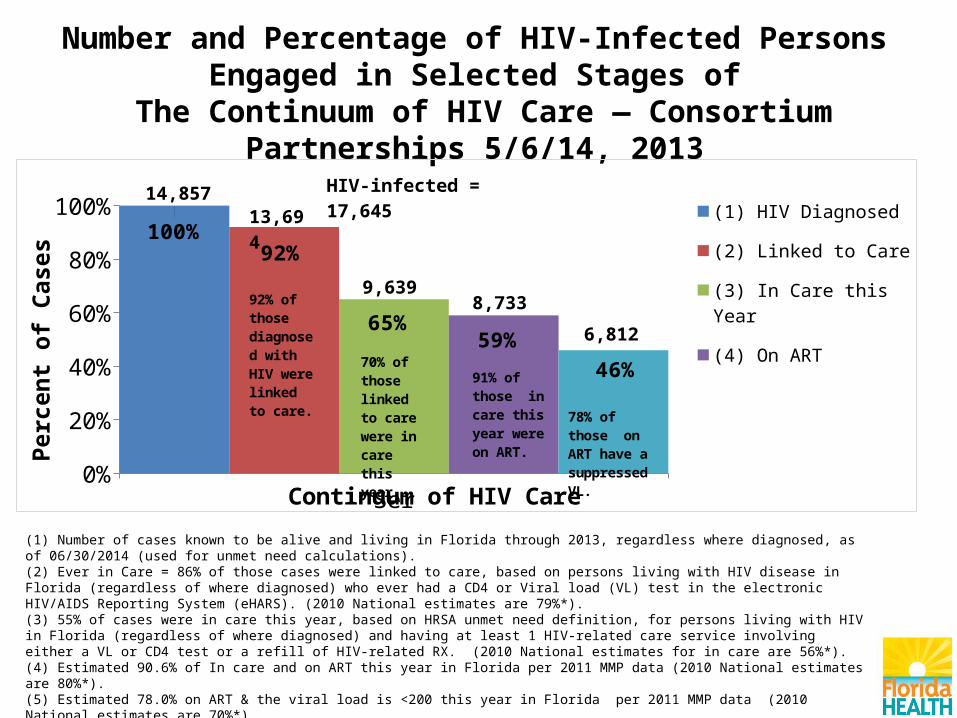
Number and Percentage of HIV-Infected PersonsEngaged in Selected Stages of
The Continuum of HIV Care — Consortium Partnerships 5/6/14, 2013
(1) Number of cases known to be alive and living in Florida through 2013, regardless where diagnosed, as of 06/30/2014 (used for unmet need calculations). (2) Ever in Care = 86% of those cases were linked to care, based on persons living with HIV disease in Florida (regardless of where diagnosed) who ever had a CD4 or Viral load (VL) test in the electronic HIV/AIDS Reporting System (eHARS). (2010 National estimates are 79%*). (3) 55% of cases were in care this year, based on HRSA unmet need definition, for persons living with HIV in Florida (regardless of where diagnosed) and having at least 1 HIV-related care service involving either a VL or CD4 test or a refill of HIV-related RX. (2010 National estimates for in care are 56%*). (4) Estimated 90.6% of In care and on ART this year in Florida per 2011 MMP data (2010 National estimates are 80%*).(5) Estimated 78.0% on ART & the viral load is <200 this year in Florida per 2011 MMP data (2010 National estimates are 70%*). *Continuum of HIV care among Ryan White HIV/AIDS Program clients, U.S., 2010 (http://hab.hrsa.gov/data/reports/continuumofcare/index.html) For additional information please refer to the Florida Continuum of Care slide set accessible at http://www.floridahealth.gov/diseases-and-conditions/aids/surveillance/index.html
Series10%
10%20%30%40%50%60%70%80%90%
100%100%
92%
65%59%
46%
(1) HIV Diagnosed
(2) Linked to Care
(3) In Care this Year
(4) On ART
(5) Suppressed Viral Load (<200 copies/mL on ART)
Continuum of HIV Care
Perc
ent o
f Cas
es
HIV-infected = 17,64514,85713,694
9,6398,733
6,812
92% of those di-agnosed with HIV were linked to care.
70% of those linked to care were in care this year.
91% of those in care this year were on ART.
78% of those on ART have a suppressed VL.
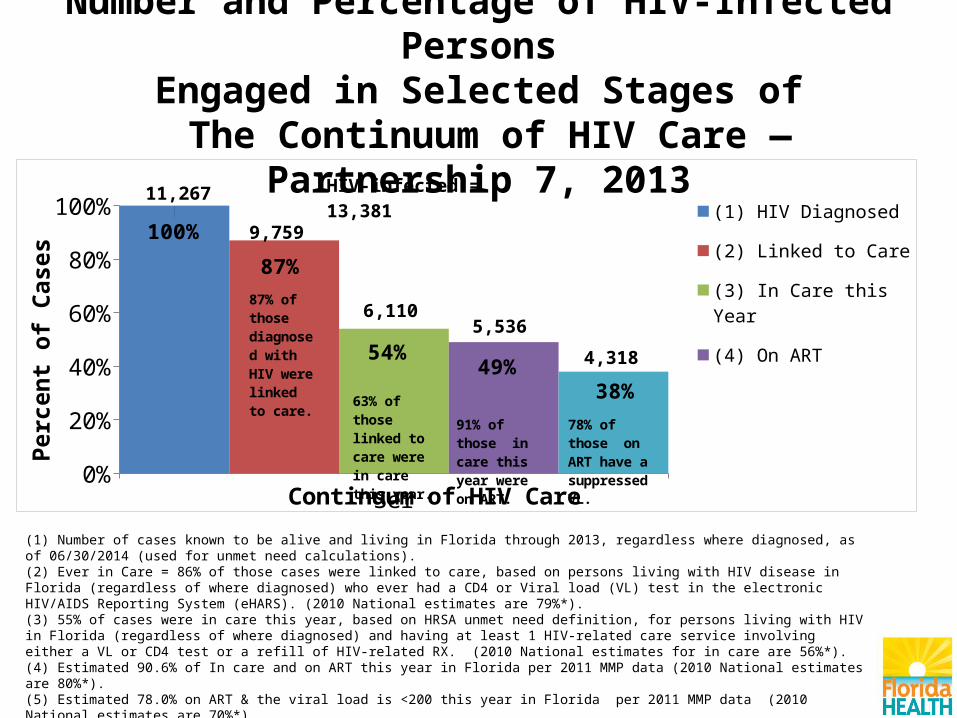
Number and Percentage of HIV-Infected PersonsEngaged in Selected Stages of
The Continuum of HIV Care — Partnership 7, 2013
(1) Number of cases known to be alive and living in Florida through 2013, regardless where diagnosed, as of 06/30/2014 (used for unmet need calculations). (2) Ever in Care = 86% of those cases were linked to care, based on persons living with HIV disease in Florida (regardless of where diagnosed) who ever had a CD4 or Viral load (VL) test in the electronic HIV/AIDS Reporting System (eHARS). (2010 National estimates are 79%*). (3) 55% of cases were in care this year, based on HRSA unmet need definition, for persons living with HIV in Florida (regardless of where diagnosed) and having at least 1 HIV-related care service involving either a VL or CD4 test or a refill of HIV-related RX. (2010 National estimates for in care are 56%*). (4) Estimated 90.6% of In care and on ART this year in Florida per 2011 MMP data (2010 National estimates are 80%*).(5) Estimated 78.0% on ART & the viral load is <200 this year in Florida per 2011 MMP data (2010 National estimates are 70%*). *Continuum of HIV care among Ryan White HIV/AIDS Program clients, U.S., 2010 (http://hab.hrsa.gov/data/reports/continuumofcare/index.html) For additional information please refer to the Florida Continuum of Care slide set accessible at http://www.floridahealth.gov/diseases-and-conditions/aids/surveillance/index.html
Series10%
10%20%30%40%50%60%70%80%90%
100%100%
87%
54%49%
38%
(1) HIV Diagnosed
(2) Linked to Care
(3) In Care this Year
(4) On ART
(5) Suppressed Viral Load (<200 copies/mL on ART)
Continuum of HIV Care
Perc
ent o
f Cas
es
HIV-infected = 13,38111,267
9,759
6,1105,536
4,318
87% of those di-agnosed with HIV were linked to care.
63% of those linked to care were in care this year.
91% of those in care this year were on ART.
78% of those on ART have a suppressed VL.
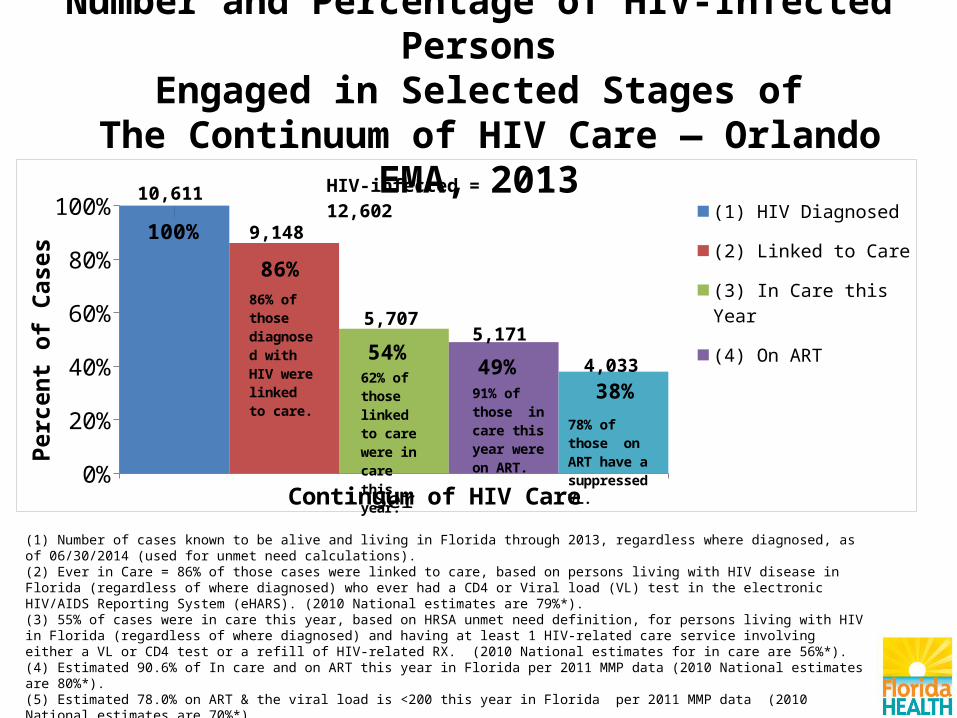
Number and Percentage of HIV-Infected PersonsEngaged in Selected Stages of
The Continuum of HIV Care — Orlando EMA, 2013
Series10%
10%20%30%40%50%60%70%80%90%
100%100%
86%
54%49%
38%
(1) HIV Diagnosed
(2) Linked to Care
(3) In Care this Year
(4) On ART
(5) Suppressed Viral Load (<200 copies/mL on ART)
Continuum of HIV Care
Perc
ent o
f Cas
es
HIV-infected = 12,60210,611
9,148
5,7075,171
4,033
86% of those di-agnosed with HIV were linked to care.
62% of those linked to care were in care this year.
91% of those in care this year were on ART.
78% of those on ART have a suppressed VL.
(1) Number of cases known to be alive and living in Florida through 2013, regardless where diagnosed, as of 06/30/2014 (used for unmet need calculations). (2) Ever in Care = 86% of those cases were linked to care, based on persons living with HIV disease in Florida (regardless of where diagnosed) who ever had a CD4 or Viral load (VL) test in the electronic HIV/AIDS Reporting System (eHARS). (2010 National estimates are 79%*). (3) 55% of cases were in care this year, based on HRSA unmet need definition, for persons living with HIV in Florida (regardless of where diagnosed) and having at least 1 HIV-related care service involving either a VL or CD4 test or a refill of HIV-related RX. (2010 National estimates for in care are 56%*). (4) Estimated 90.6% of In care and on ART this year in Florida per 2011 MMP data (2010 National estimates are 80%*).(5) Estimated 78.0% on ART & the viral load is <200 this year in Florida per 2011 MMP data (2010 National estimates are 70%*). *Continuum of HIV care among Ryan White HIV/AIDS Program clients, U.S., 2010 (http://hab.hrsa.gov/data/reports/continuumofcare/index.html) For additional information please refer to the Florida Continuum of Care slide set accessible at http://www.floridahealth.gov/diseases-and-conditions/aids/surveillance/index.html
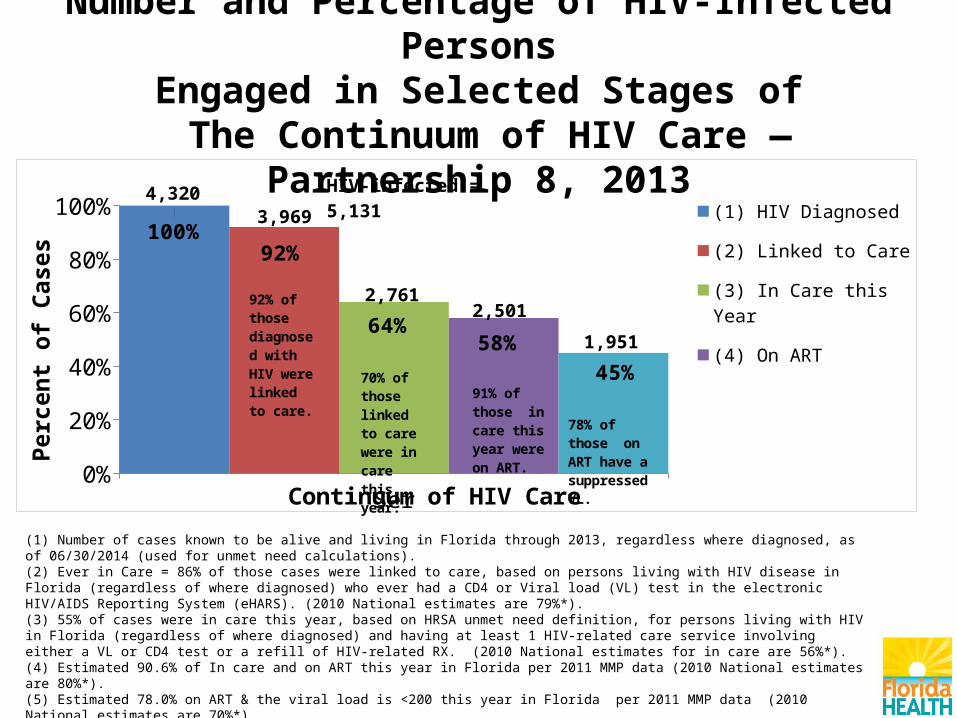
Number and Percentage of HIV-Infected PersonsEngaged in Selected Stages of
The Continuum of HIV Care — Partnership 8, 2013
(1) Number of cases known to be alive and living in Florida through 2013, regardless where diagnosed, as of 06/30/2014 (used for unmet need calculations). (2) Ever in Care = 86% of those cases were linked to care, based on persons living with HIV disease in Florida (regardless of where diagnosed) who ever had a CD4 or Viral load (VL) test in the electronic HIV/AIDS Reporting System (eHARS). (2010 National estimates are 79%*). (3) 55% of cases were in care this year, based on HRSA unmet need definition, for persons living with HIV in Florida (regardless of where diagnosed) and having at least 1 HIV-related care service involving either a VL or CD4 test or a refill of HIV-related RX. (2010 National estimates for in care are 56%*). (4) Estimated 90.6% of In care and on ART this year in Florida per 2011 MMP data (2010 National estimates are 80%*).(5) Estimated 78.0% on ART & the viral load is <200 this year in Florida per 2011 MMP data (2010 National estimates are 70%*). *Continuum of HIV care among Ryan White HIV/AIDS Program clients, U.S., 2010 (http://hab.hrsa.gov/data/reports/continuumofcare/index.html) For additional information please refer to the Florida Continuum of Care slide set accessible at http://www.floridahealth.gov/diseases-and-conditions/aids/surveillance/index.html
Series10%
10%20%30%40%50%60%70%80%90%
100%100%
92%
64%58%
45%
(1) HIV Diagnosed
(2) Linked to Care
(3) In Care this Year
(4) On ART
(5) Suppressed Viral Load (<200 copies/mL on ART)
Continuum of HIV Care
Perc
ent o
f Cas
es
HIV-infected = 5,1314,3203,969
2,7612,501
1,951
92% of those di-agnosed with HIV were linked to care.
70% of those linked to care were in care this year.
91% of those in care this year were on ART.
78% of those on ART have a suppressed VL.
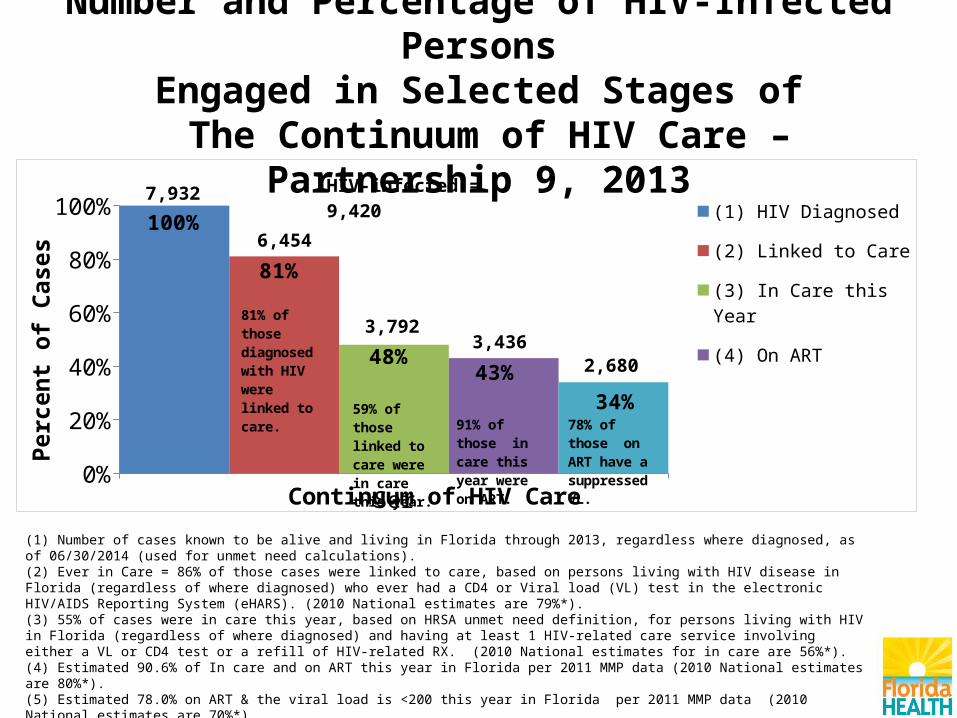
Number and Percentage of HIV-Infected PersonsEngaged in Selected Stages of
The Continuum of HIV Care – Partnership 9, 2013
Series10%
10%20%30%40%50%60%70%80%90%
100%100%
81%
48%43%
34%
(1) HIV Diagnosed
(2) Linked to Care
(3) In Care this Year
(4) On ART
(5) Suppressed Viral Load (<200 copies/mL on ART)
Continuum of HIV Care
Perc
ent o
f Cas
es
HIV-infected = 9,4207,932
6,454
3,7923,436
2,680
81% of those diagnosed with HIV were linked to care.
59% of those linked to care were in care this year.
91% of those in care this year were on ART.
78% of those on ART have a suppressed VL.
(1) Number of cases known to be alive and living in Florida through 2013, regardless where diagnosed, as of 06/30/2014 (used for unmet need calculations). (2) Ever in Care = 86% of those cases were linked to care, based on persons living with HIV disease in Florida (regardless of where diagnosed) who ever had a CD4 or Viral load (VL) test in the electronic HIV/AIDS Reporting System (eHARS). (2010 National estimates are 79%*). (3) 55% of cases were in care this year, based on HRSA unmet need definition, for persons living with HIV in Florida (regardless of where diagnosed) and having at least 1 HIV-related care service involving either a VL or CD4 test or a refill of HIV-related RX. (2010 National estimates for in care are 56%*). (4) Estimated 90.6% of In care and on ART this year in Florida per 2011 MMP data (2010 National estimates are 80%*).(5) Estimated 78.0% on ART & the viral load is <200 this year in Florida per 2011 MMP data (2010 National estimates are 70%*). *Continuum of HIV care among Ryan White HIV/AIDS Program clients, U.S., 2010 (http://hab.hrsa.gov/data/reports/continuumofcare/index.html) For additional information please refer to the Florida Continuum of Care slide set accessible at http://www.floridahealth.gov/diseases-and-conditions/aids/surveillance/index.html
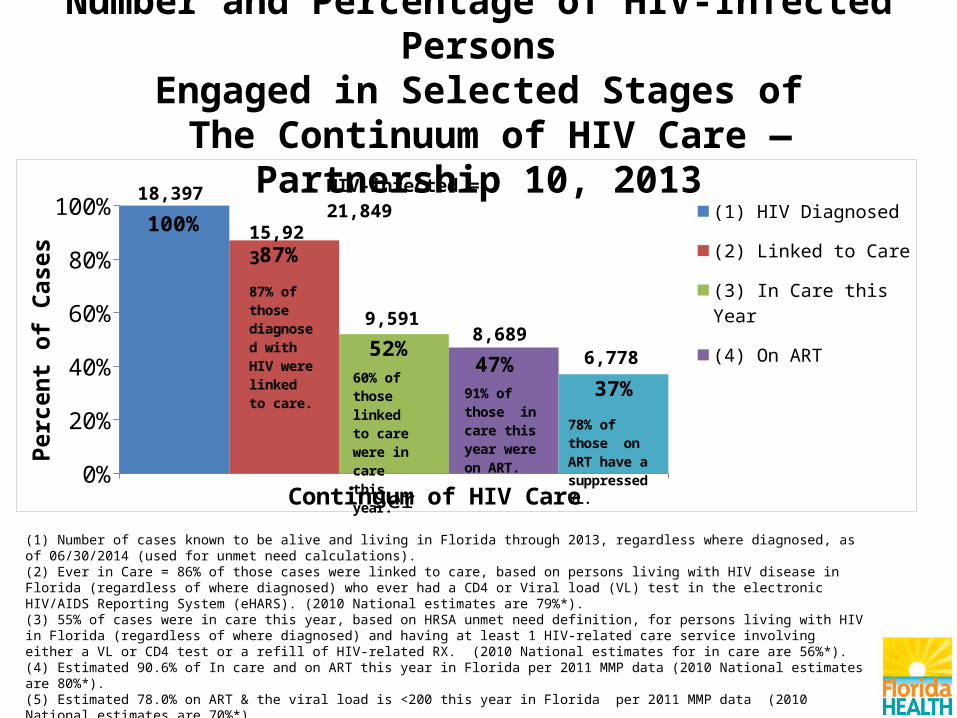
Number and Percentage of HIV-Infected PersonsEngaged in Selected Stages of
The Continuum of HIV Care — Partnership 10, 2013
Series10%
10%20%30%40%50%60%70%80%90%
100%100%
87%
52%47%
37%
(1) HIV Diagnosed
(2) Linked to Care
(3) In Care this Year
(4) On ART
(5) Suppressed Viral Load (<200 copies/mL on ART)
Continuum of HIV Care
Perc
ent o
f Cas
es
HIV-infected = 21,84918,397
15,923
9,5918,689
6,778
87% of those di-agnosed with HIV were linked to care. 60% of
those linked to care were in care this year.
91% of those in care this year were on ART.
78% of those on ART have a suppressed VL.
(1) Number of cases known to be alive and living in Florida through 2013, regardless where diagnosed, as of 06/30/2014 (used for unmet need calculations). (2) Ever in Care = 86% of those cases were linked to care, based on persons living with HIV disease in Florida (regardless of where diagnosed) who ever had a CD4 or Viral load (VL) test in the electronic HIV/AIDS Reporting System (eHARS). (2010 National estimates are 79%*). (3) 55% of cases were in care this year, based on HRSA unmet need definition, for persons living with HIV in Florida (regardless of where diagnosed) and having at least 1 HIV-related care service involving either a VL or CD4 test or a refill of HIV-related RX. (2010 National estimates for in care are 56%*). (4) Estimated 90.6% of In care and on ART this year in Florida per 2011 MMP data (2010 National estimates are 80%*).(5) Estimated 78.0% on ART & the viral load is <200 this year in Florida per 2011 MMP data (2010 National estimates are 70%*). *Continuum of HIV care among Ryan White HIV/AIDS Program clients, U.S., 2010 (http://hab.hrsa.gov/data/reports/continuumofcare/index.html) For additional information please refer to the Florida Continuum of Care slide set accessible at http://www.floridahealth.gov/diseases-and-conditions/aids/surveillance/index.html
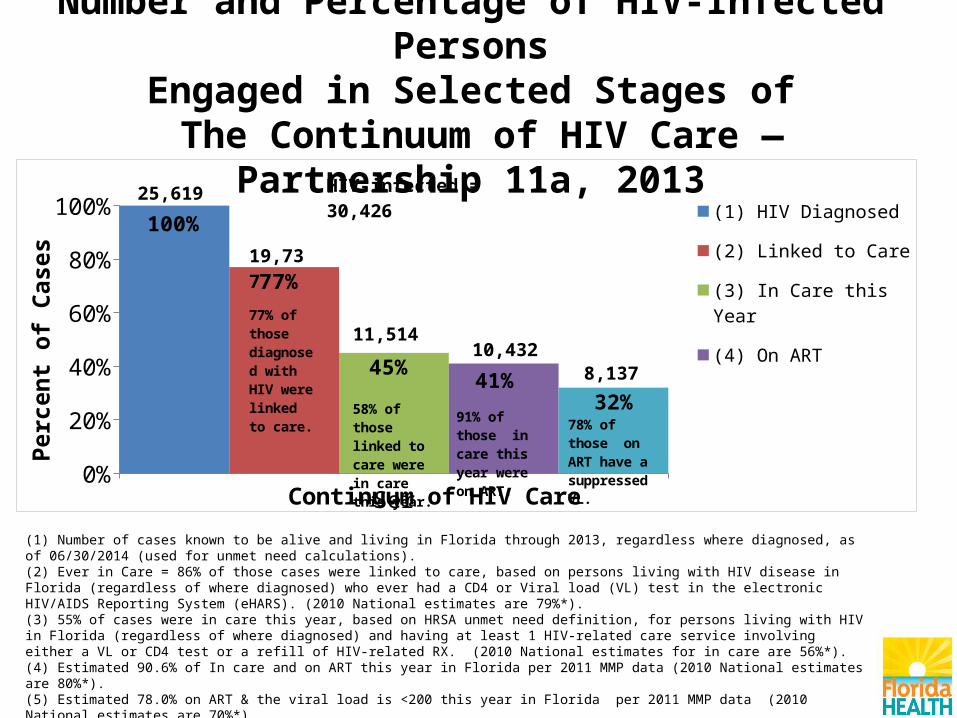
Number and Percentage of HIV-Infected PersonsEngaged in Selected Stages of
The Continuum of HIV Care — Partnership 11a, 2013
Series10%
10%20%30%40%50%60%70%80%90%
100%100%
77%
45%41%
32%
(1) HIV Diagnosed
(2) Linked to Care
(3) In Care this Year
(4) On ART
(5) Suppressed Viral Load (<200 copies/mL on ART)
Continuum of HIV Care
Perc
ent o
f Cas
es
HIV-infected = 30,42625,619
19,737
11,51410,432
8,137
77% of those di-agnosed with HIV were linked to care. 58% of those
linked to care were in care this year.
91% of those in care this year were on ART.
78% of those on ART have a suppressed VL.
(1) Number of cases known to be alive and living in Florida through 2013, regardless where diagnosed, as of 06/30/2014 (used for unmet need calculations). (2) Ever in Care = 86% of those cases were linked to care, based on persons living with HIV disease in Florida (regardless of where diagnosed) who ever had a CD4 or Viral load (VL) test in the electronic HIV/AIDS Reporting System (eHARS). (2010 National estimates are 79%*). (3) 55% of cases were in care this year, based on HRSA unmet need definition, for persons living with HIV in Florida (regardless of where diagnosed) and having at least 1 HIV-related care service involving either a VL or CD4 test or a refill of HIV-related RX. (2010 National estimates for in care are 56%*). (4) Estimated 90.6% of In care and on ART this year in Florida per 2011 MMP data (2010 National estimates are 80%*).(5) Estimated 78.0% on ART & the viral load is <200 this year in Florida per 2011 MMP data (2010 National estimates are 70%*). *Continuum of HIV care among Ryan White HIV/AIDS Program clients, U.S., 2010 (http://hab.hrsa.gov/data/reports/continuumofcare/index.html) For additional information please refer to the Florida Continuum of Care slide set accessible at http://www.floridahealth.gov/diseases-and-conditions/aids/surveillance/index.html
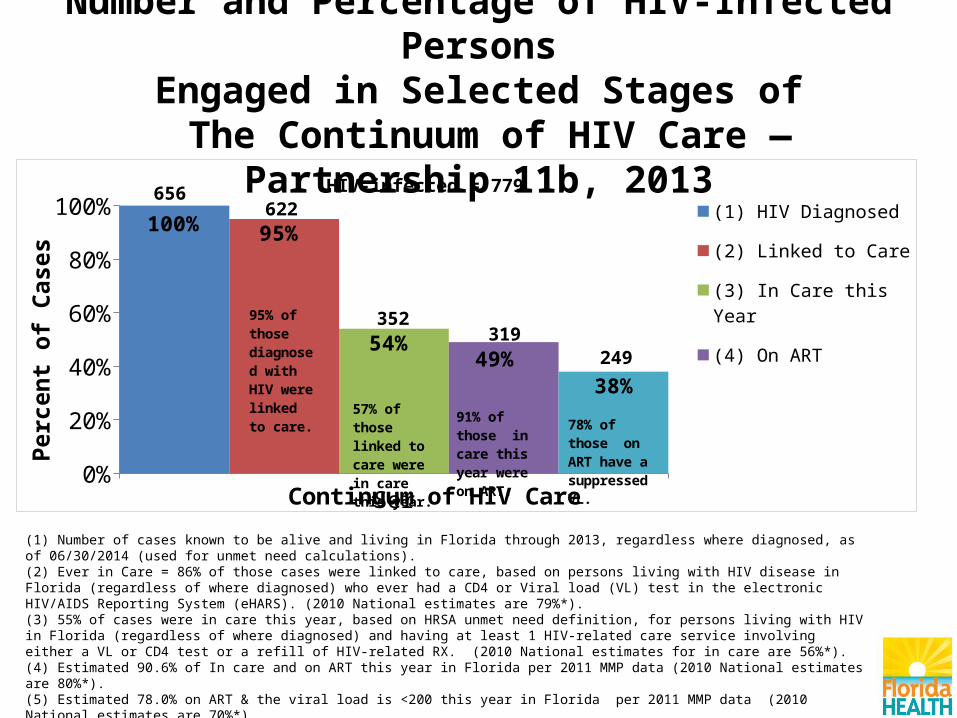
Number and Percentage of HIV-Infected PersonsEngaged in Selected Stages of
The Continuum of HIV Care — Partnership 11b, 2013
(1) Number of cases known to be alive and living in Florida through 2013, regardless where diagnosed, as of 06/30/2014 (used for unmet need calculations). (2) Ever in Care = 86% of those cases were linked to care, based on persons living with HIV disease in Florida (regardless of where diagnosed) who ever had a CD4 or Viral load (VL) test in the electronic HIV/AIDS Reporting System (eHARS). (2010 National estimates are 79%*). (3) 55% of cases were in care this year, based on HRSA unmet need definition, for persons living with HIV in Florida (regardless of where diagnosed) and having at least 1 HIV-related care service involving either a VL or CD4 test or a refill of HIV-related RX. (2010 National estimates for in care are 56%*). (4) Estimated 90.6% of In care and on ART this year in Florida per 2011 MMP data (2010 National estimates are 80%*).(5) Estimated 78.0% on ART & the viral load is <200 this year in Florida per 2011 MMP data (2010 National estimates are 70%*). *Continuum of HIV care among Ryan White HIV/AIDS Program clients, U.S., 2010 (http://hab.hrsa.gov/data/reports/continuumofcare/index.html) For additional information please refer to the Florida Continuum of Care slide set accessible at http://www.floridahealth.gov/diseases-and-conditions/aids/surveillance/index.html
Series10%
10%20%30%40%50%60%70%80%90%
100%100% 95%
54%49%
38%
(1) HIV Diagnosed
(2) Linked to Care
(3) In Care this Year
(4) On ART
(5) Suppressed Viral Load (<200 copies/mL on ART)
Continuum of HIV Care
Perc
ent o
f Cas
es
HIV-infected = 779656622
352319
249
95% of those di-agnosed with HIV were linked to care. 57% of those
linked to care were in care this year.
91% of those in care this year were on ART.
78% of those on ART have a suppressed VL.

Number and Percentage of HIV-Infected PersonsEngaged in Selected Stages of
The Continuum of HIV Care — Partnership 12, 2013
(1) Number of cases known to be alive and living in Florida through 2013, regardless where diagnosed, as of 06/30/2014 (used for unmet need calculations). (2) Ever in Care = 86% of those cases were linked to care, based on persons living with HIV disease in Florida (regardless of where diagnosed) who ever had a CD4 or Viral load (VL) test in the electronic HIV/AIDS Reporting System (eHARS). (2010 National estimates are 79%*). (3) 55% of cases were in care this year, based on HRSA unmet need definition, for persons living with HIV in Florida (regardless of where diagnosed) and having at least 1 HIV-related care service involving either a VL or CD4 test or a refill of HIV-related RX. (2010 National estimates for in care are 56%*). (4) Estimated 90.6% of In care and on ART this year in Florida per 2011 MMP data (2010 National estimates are 80%*).(5) Estimated 78.0% on ART & the viral load is <200 this year in Florida per 2011 MMP data (2010 National estimates are 70%*). *Continuum of HIV care among Ryan White HIV/AIDS Program clients, U.S., 2010 (http://hab.hrsa.gov/data/reports/continuumofcare/index.html) For additional information please refer to the Florida Continuum of Care slide set accessible at http://www.floridahealth.gov/diseases-and-conditions/aids/surveillance/index.html
Series10%
10%20%30%40%50%60%70%80%90%
100%100%
88%
63%57%
44%
(1) HIV Diagnosed
(2) Linked to Care
(3) In Care this Year
(4) On ART
(5) Suppressed Viral Load (<200 copies/mL on ART)
Continuum of HIV Care
Perc
ent o
f Cas
es
HIV-infected = 2,0421,719
1,512
1,079978
76388% of those di-agnosed with HIV were linked to care. 71% of those
linked to care were in care this year.
91% of those in care this year were on ART.
78% of those on ART have a suppressed VL.

Number and Percentage of HIV-Infected PersonsEngaged in Selected Stages of
The Continuum of HIV Care — Partnership 15, 2013
(1) Number of cases known to be alive and living in Florida through 2013, regardless where diagnosed, as of 06/30/2014 (used for unmet need calculations). (2) Ever in Care = 86% of those cases were linked to care, based on persons living with HIV disease in Florida (regardless of where diagnosed) who ever had a CD4 or Viral load (VL) test in the electronic HIV/AIDS Reporting System (eHARS). (2010 National estimates are 79%*). (3) 55% of cases were in care this year, based on HRSA unmet need definition, for persons living with HIV in Florida (regardless of where diagnosed) and having at least 1 HIV-related care service involving either a VL or CD4 test or a refill of HIV-related RX. (2010 National estimates for in care are 56%*). (4) Estimated 90.6% of In care and on ART this year in Florida per 2011 MMP data (2010 National estimates are 80%*).(5) Estimated 78.0% on ART & the viral load is <200 this year in Florida per 2011 MMP data (2010 National estimates are 70%*). *Continuum of HIV care among Ryan White HIV/AIDS Program clients, U.S., 2010 (http://hab.hrsa.gov/data/reports/continuumofcare/index.html) For additional information please refer to the Florida Continuum of Care slide set accessible at http://www.floridahealth.gov/diseases-and-conditions/aids/surveillance/index.html
Series10%
10%20%30%40%50%60%70%80%90%
100%100%
91%
58%52%
41%
(1) HIV Diagnosed
(2) Linked to Care
(3) In Care this Year
(4) On ART
(5) Suppressed Viral Load (<200 copies/mL on ART)
Continuum of HIV Care
Perc
ent o
f Cas
es
HIV-infected = 2,8002,3582,155
1,3641,236
964
91% of those di-agnosed with HIV were linked to care. 63% of those
linked to care were in care this year.
91% of those in care this year were on ART.
78% of those on ART have a suppressed VL.
For Florida HIV/AIDS Surveillance DataContact: (850) 245-4444
Lorene Maddox, MPH Ext. 2613 Tracina Bush, BSW Ext. 2612 Madgene Moise, MPH Ext. 2373
Visit Florida’s internet site for:Monthly Surveillance Reports
Slide Sets and Fact SheetsAnnual Reports and Epi Profiles
http://www.doh.state.fl.us/disease_ctrl/aids/trends/trends.html
Visit CDC’s HIV/AIDS internet site for:Surveillance Reports, fact sheets and slide sets
http://www.cdc.gov/hiv/topics/surveillance/resources/reports/index.htm