cartographic presentations of borders on old …geobalcanica.org › wp-content › uploads › agb...
TRANSCRIPT

Acta Geobalcanica 4-2, 2018, 67-76
67
CARTOGRAPHIC PRESENTATIONS OF BORDERS
ON OLD MAPS OF SLOVENIA
DOI: https://doi.org/10.18509/AGB.2018.08
UDC: 528.93:94(497.4-04)”15/18”
Primož Gašperič, Drago Perko, Matija Zorn
Research Center of the Slovenian Academy of Sciences and Arts,
Anton Melik Geographical Institute, Slovenia
Corresponding author: [email protected]
Submitted: 27.02.2018, Accepted: 10.03.2018, Published: 30.09.2018
Abstract Using a uniform methodology, we explored cartographic elements on almost sixty medium-scale maps
showing Slovenian territory from the sixteenth to nineteenth centuries. One of the elements examined was
also borders, which are very fragmented due to the great landscape diversity of Slovenia. We were
interested in how borders in different periods follow the natural boundaries of the landscape and how they
are cartographically represented. Lines and shapes were mostly used to display the borders. Shaded areas
are more common. They are usually colored or patterned. Lines are more effective. Typically, there are
different types, varying in shape, thickness, and color. Only a dozen of the maps examined lack borders.
Two-thirds of the maps highlight the borders with a color.
Keywords: geography, history of cartography, maps, borders, Slovenia
INTRODUCTION
Various methods have been used to represent
the borders of political, administrative, and
similar units. The most common are lines and
areas. Areas are most often marked in color,
various shades, or with a pattern. Using lines is
considered more efficient, and it offers more
variation:
– Lines made of various dots;
– Lines made of short horizontal or vertical
dashes;
– Solid lines of different weights;
– Lines made of a series of different
symbols (e.g., crosses);
– Colored lines.
Combinations of these depiction methods are
common.
BORDERS ON OLD MAPS
In the past, state borders were not precisely
defined in terms of territory, and this made
drawing borders on maps difficult. It was often
not known who controlled places that were
remote, subject to frequent warfare, or on the
border between two powerful entities. “During
the Middle Ages, there is some evidence that
the feudal system was more concerned with the
control of cities and territories, which, rather
than having clear boundaries, had somewhat
vague borderlands” [1]. “Thanks to
geographers, however, mapping technology
allowed rulers to have a spatial view of their
possessions; thus, what were originally
borderland or border regions progressively
became boundaries” [1]. Thus, when maps
became a reference for international
agreements, especially with the Treaty of Paris
after the First World War [1], static lines were
put on maps as borders.
The main categories of morphological
classification of political borders are: 1)
anthropogeographic or geometric borders,
usually following straight lines (e.g., a parallel
or meridian); and 2) physiographic borders,
following some notable natural geographic
element in the area, such as orographic lines,
ridges, or watercourses [2]. The last are often
Primož Gašperič, Drago Perko, Matija Zorn, Cartographic presentations of borders on old maps of Slovenia
68
called natural boundaries, even though
virtually all political borders, including those
based on natural features, are the result of
human activity and as such purely artificial.
Today’s border of Slovenia is mostly adapted
to natural conditions. For example, the 654 km
Slovenian-Croatian border is mostly adapted
to natural conditions. Natural borders are the
most favorable from the perspective of defense
strategy, and partly also from the economic
point of view [3]. The historical and
geographical development of the Slovenian-
Croatian border area shows that the borders
between the historical provinces and other
political units were already based on natural
boundaries in the past, such as the border
between Austria and Hungary within the
Habsburg Monarchy. In sections that rely on
natural elements, the border between today’s
independent countries of Slovenia and Croatia
has generally remained unchanged since the
late Middle Ages [3]. In total, almost exactly
four-fifths of the boundary passes along rivers
and streams (a hydrographic border) and
follows hill ridges (an orographic border).
Similar is true for the borders of today’s
Slovenia with its three other neighboring
countries and for historical borders in the
territory of today’s Slovenia.
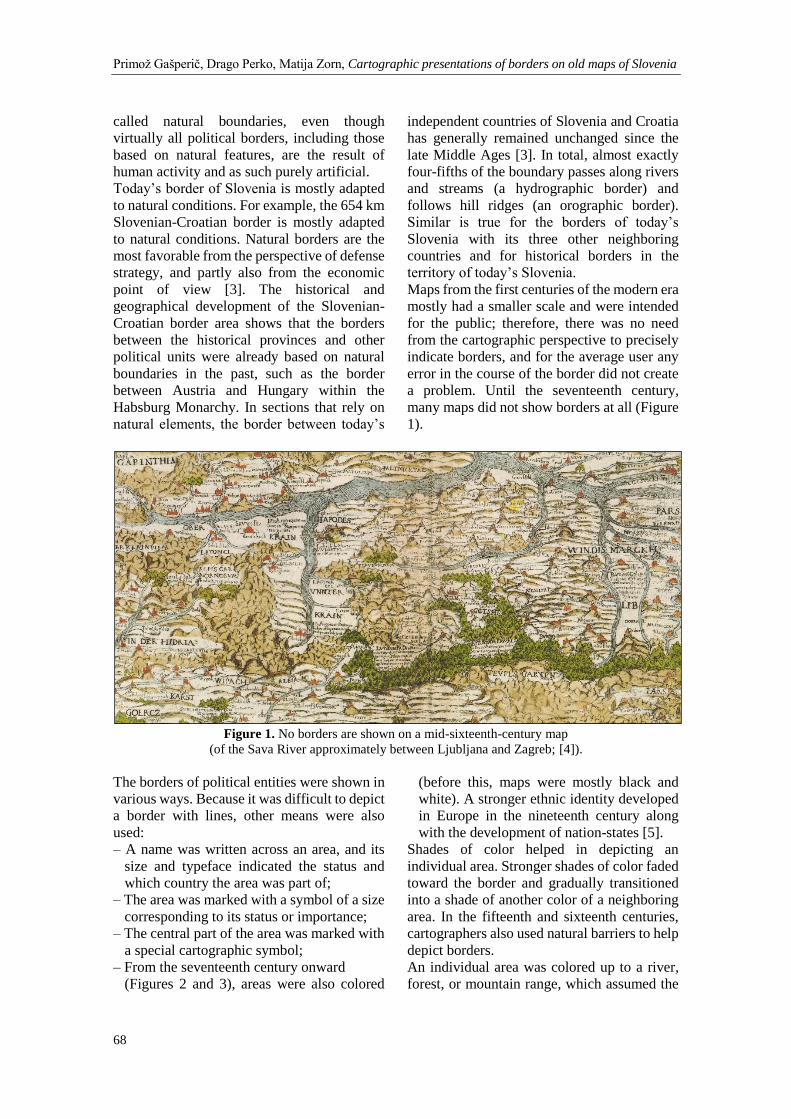
Maps from the first centuries of the modern era
mostly had a smaller scale and were intended
for the public; therefore, there was no need
from the cartographic perspective to precisely
indicate borders, and for the average user any
error in the course of the border did not create
a problem. Until the seventeenth century,
many maps did not show borders at all (Figure
1).
Figure 1. No borders are shown on a mid-sixteenth-century map
(of the Sava River approximately between Ljubljana and Zagreb; [4]).
The borders of political entities were shown in
various ways. Because it was difficult to depict
a border with lines, other means were also
used:
– A name was written across an area, and its
size and typeface indicated the status and
which country the area was part of;
– The area was marked with a symbol of a size
corresponding to its status or importance;
– The central part of the area was marked with
a special cartographic symbol;
– From the seventeenth century onward
(Figures 2 and 3), areas were also colored
(before this, maps were mostly black and
white). A stronger ethnic identity developed
in Europe in the nineteenth century along
with the development of nation-states [5].
Shades of color helped in depicting an
individual area. Stronger shades of color faded
toward the border and gradually transitioned
into a shade of another color of a neighboring
area. In the fifteenth and sixteenth centuries,
cartographers also used natural barriers to help
depict borders.
An individual area was colored up to a river,
forest, or mountain range, which assumed the

Acta Geobalcanica 4-2, 2018, 67-76
69
role of a border on the map. From the
seventeenth century onward, due to new
discoveries and therefore greater familiarity
with territories, borders became increasingly
precise and marked. The Treaty of Karlowitz,
concluded in 1699 in Sremski Karlovci (now
Serbia), which ended the Great Turkish War
between the Habsburg Monarchy and the
Ottoman Empire, changed the importance and
character of political borders in southeast
Europe. For the first time, the state border was
physically demarcated on the ground in this
part of Europe, and so it was also more
precisely demarcated on maps. Lines became
the established method for depicting borders
and continue to be the most frequently used
method even today. In addition to lines of
varying weights showing various types of
borders, from the seventeenth century onward
a combination of line methods was used.
Individual areas were colored with the same
color as the border, but in a lighter shade [8, p
47-49].
Figure 2. On a mid-seventeenth-century map (of the territory north of the Gulf of Trieste)
borders are depicted with colored margins [6].
Figure 3. Borders are shown in color on a map from the end of the eighteenth century
(of territory north of the Gulf of Trieste and Kvarner Gulf; [7]).

Primož Gašperič, Drago Perko, Matija Zorn, Cartographic presentations of borders on old maps of Slovenia
70
THE METHODOLOGY OF STUDYING
BORDERS ON OLD MAPS
This research is based on a special data form
that makes it possible to analyze changes in
cartographic elements through time using a
uniform methodology. The preparation of a
uniform methodological basis for maps during
the period from the mid-sixteenth century to
the end of the nineteenth century was a special
challenge because such maps differ greatly in
technique and form, and their cartographic
elements are also presented in very different
ways.
We compiled the data form based on five
groups of cartographic elements [9]. These are:
natural features, built features, geographical
names, mathematical elements; and
explanatory elements. Cartographic depictions
of borders are classified as built features.
The selection of certain groups of elements and
their more precise hierarchical arrangement is
not new. Several researchers have divided
cartographic elements on large-scale
topographic maps into two groups:
geographical and mathematical elements [10],
or natural and built features [11, p 19].
Some have distinguished between three
groups: natural features, manmade (built)
features, and geographical names [12]. Other
use four groups: mathematical, natural
geographical, social geographical, and other
elements [13, p 221], or a mathematical basis,
geographical features, editing information, and
additional elements [10, p 12].
Some authors have used an arbitrary division
of groups and individual elements; for
example, based on their emphasis on the map
or the tendency to highlight them [14; 15]. All
of these divisions share the goal of clearly
categorizing map content.
This study included fifty-eight maps from the
mid-sixteenth century to the end of the
nineteenth century showing the territory of
today’s Slovenia in full or in large part (e.g.,
the province of Carniola). Maps were excluded
if they were the same or similar depictions by
the same cartographer, had the same scale, and
had the same cartographic representation, or
were reprints that differed only in colors or
additions that do not affect the cartographic
representation (these are frequent in the maps
by Homann, Mannert, Kindermann, and
Mercator). Maps were included with a scale
between 1:200,000 and 1:900,000; that is,
medium-scale maps [13, p 219] or large-scale
topographic maps [12, p 9]. The majority of
maps did not have a scale printed on them, and
so this was calculated on the basis of five
selected distances on each map.
The borders were mostly marked with simple
single lines, and in places with color or a
transition between two different colored areas.
The following were entered in the data form:
depiction method (point: geometric or stylized
symbol; line: single or parallel line; area:
geometric symbol, stylized group of symbols,
colored area), and graphic variables (shape,
size, color, brightness, pattern, direction). It
was separately marked whether the border was
emphasized with a colored margin or band
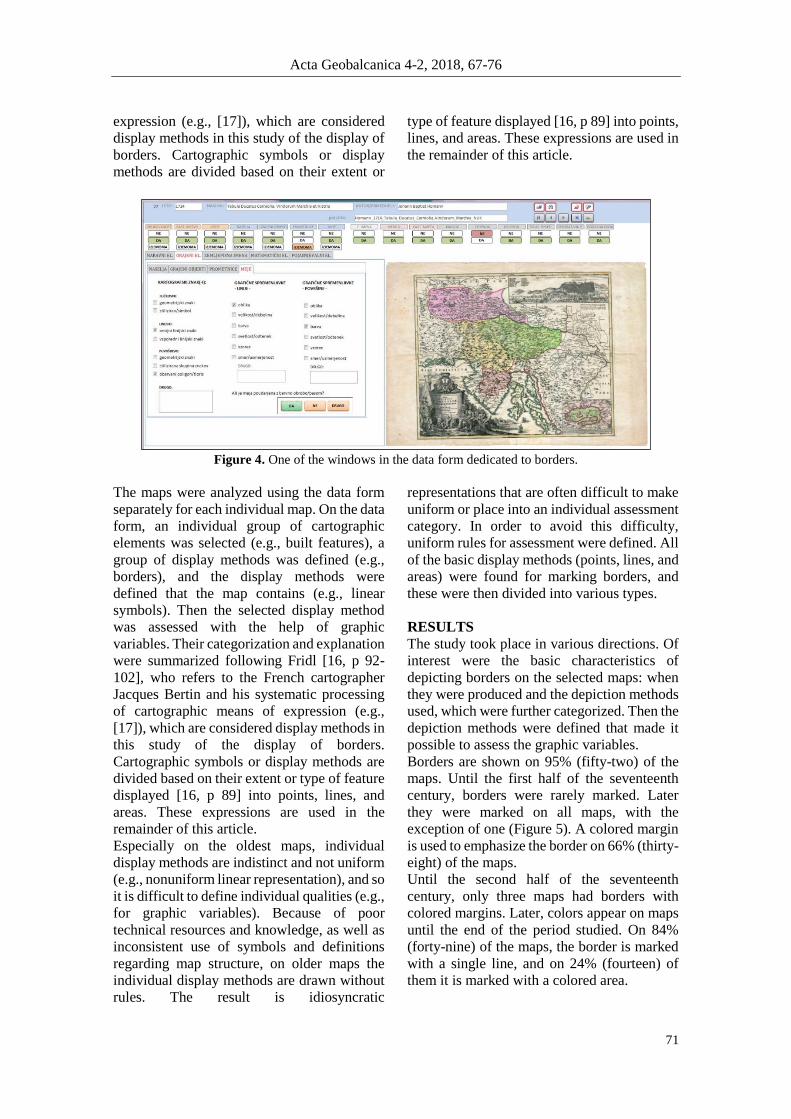
(Figure 4). The maps were analyzed using the
data form separately for each individual map.
On the data form, an individual group of
cartographic elements was selected (e.g., built
features), a group of display methods was
defined (e.g., borders), and the display
methods were defined that the map contains
(e.g., linear symbols). Then the selected
display method was assessed with the help of
graphic variables. Their categorization and
explanation were summarized following Fridl
[16, p 92-102], who refers to the French
cartographer Jacques Bertin and his systematic
processing of cartographic means of
expression (e.g., [17]), which are considered
display methods in this study of the display of
borders. Cartographic symbols or display
methods are divided based on their extent or
type of feature displayed [16, p 89] into points,
lines, and areas. These expressions are used in
the remainder of this article. The maps were
analyzed using the data form separately for
each individual map. On the data form, an
individual group of cartographic elements was
selected (e.g., built features), a group of
display methods was defined (e.g., borders),
and the display methods were defined that the
map contains (e.g., linear symbols). Then the
selected display method was assessed with the
help of graphic variables. Their categorization
and explanation were summarized following
Fridl [16, p 92-102], who refers to the French
cartographer Jacques Bertin and his systematic
processing of cartographic means of
Acta Geobalcanica 4-2, 2018, 67-76
71
expression (e.g., [17]), which are considered
display methods in this study of the display of
borders. Cartographic symbols or display
methods are divided based on their extent or
type of feature displayed [16, p 89] into points,
lines, and areas. These expressions are used in
the remainder of this article.
Figure 4. One of the windows in the data form dedicated to borders.
The maps were analyzed using the data form
separately for each individual map. On the data
form, an individual group of cartographic
elements was selected (e.g., built features), a
group of display methods was defined (e.g.,
borders), and the display methods were
defined that the map contains (e.g., linear
symbols). Then the selected display method
was assessed with the help of graphic
variables. Their categorization and explanation
were summarized following Fridl [16, p 92-
102], who refers to the French cartographer
Jacques Bertin and his systematic processing
of cartographic means of expression (e.g.,
[17]), which are considered display methods in
this study of the display of borders.
Cartographic symbols or display methods are
divided based on their extent or type of feature
displayed [16, p 89] into points, lines, and
areas. These expressions are used in the
remainder of this article.
Especially on the oldest maps, individual
display methods are indistinct and not uniform
(e.g., nonuniform linear representation), and so
it is difficult to define individual qualities (e.g.,
for graphic variables). Because of poor
technical resources and knowledge, as well as
inconsistent use of symbols and definitions
regarding map structure, on older maps the
individual display methods are drawn without
rules. The result is idiosyncratic
representations that are often difficult to make
uniform or place into an individual assessment
category. In order to avoid this difficulty,
uniform rules for assessment were defined. All
of the basic display methods (points, lines, and
areas) were found for marking borders, and
these were then divided into various types.
RESULTS
The study took place in various directions. Of
interest were the basic characteristics of
depicting borders on the selected maps: when
they were produced and the depiction methods
used, which were further categorized. Then the
depiction methods were defined that made it
possible to assess the graphic variables.
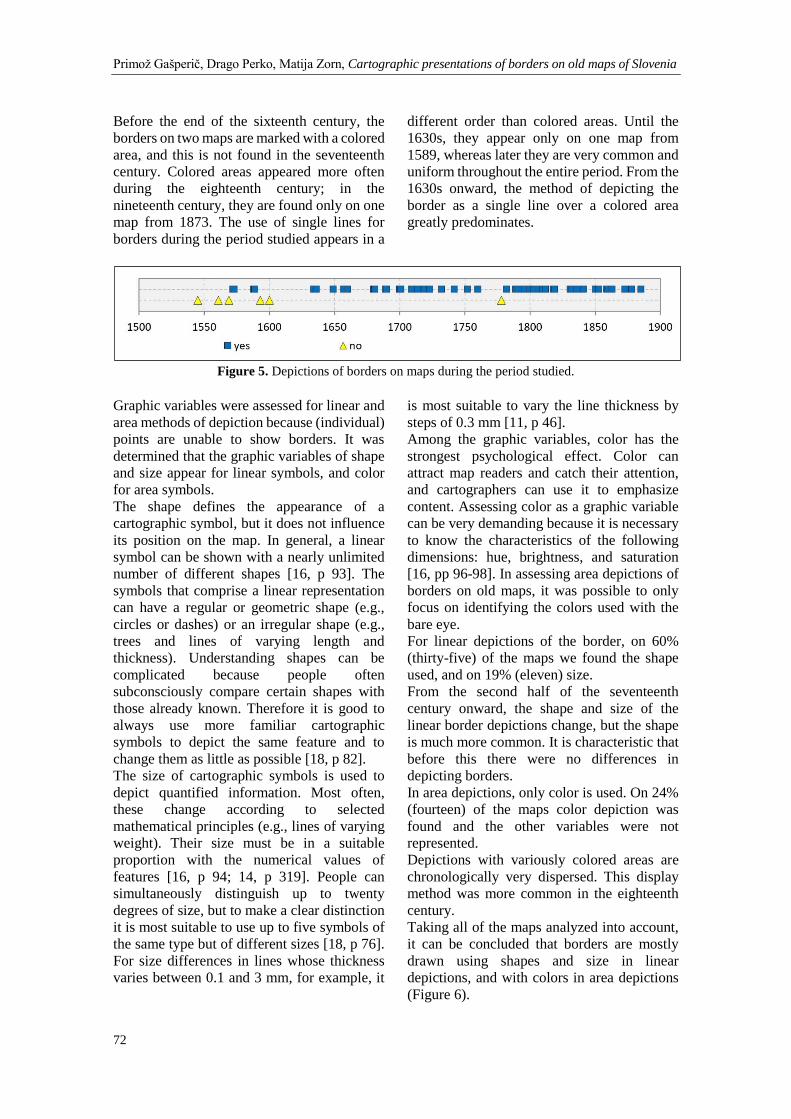
Borders are shown on 95% (fifty-two) of the
maps. Until the first half of the seventeenth
century, borders were rarely marked. Later
they were marked on all maps, with the
exception of one (Figure 5). A colored margin
is used to emphasize the border on 66% (thirty-
eight) of the maps.
Until the second half of the seventeenth
century, only three maps had borders with
colored margins. Later, colors appear on maps
until the end of the period studied. On 84%
(forty-nine) of the maps, the border is marked
with a single line, and on 24% (fourteen) of
them it is marked with a colored area.
Primož Gašperič, Drago Perko, Matija Zorn, Cartographic presentations of borders on old maps of Slovenia
72
Before the end of the sixteenth century, the
borders on two maps are marked with a colored
area, and this is not found in the seventeenth
century. Colored areas appeared more often
during the eighteenth century; in the
nineteenth century, they are found only on one
map from 1873. The use of single lines for
borders during the period studied appears in a
different order than colored areas. Until the
1630s, they appear only on one map from
1589, whereas later they are very common and
uniform throughout the entire period. From the
1630s onward, the method of depicting the
border as a single line over a colored area
greatly predominates.
Figure 5. Depictions of borders on maps during the period studied.
Graphic variables were assessed for linear and
area methods of depiction because (individual)
points are unable to show borders. It was
determined that the graphic variables of shape
and size appear for linear symbols, and color
for area symbols.
The shape defines the appearance of a
cartographic symbol, but it does not influence
its position on the map. In general, a linear
symbol can be shown with a nearly unlimited
number of different shapes [16, p 93]. The
symbols that comprise a linear representation
can have a regular or geometric shape (e.g.,
circles or dashes) or an irregular shape (e.g.,
trees and lines of varying length and
thickness). Understanding shapes can be
complicated because people often
subconsciously compare certain shapes with
those already known. Therefore it is good to
always use more familiar cartographic
symbols to depict the same feature and to
change them as little as possible [18, p 82].
The size of cartographic symbols is used to
depict quantified information. Most often,
these change according to selected
mathematical principles (e.g., lines of varying
weight). Their size must be in a suitable
proportion with the numerical values of
features [16, p 94; 14, p 319]. People can
simultaneously distinguish up to twenty
degrees of size, but to make a clear distinction
it is most suitable to use up to five symbols of
the same type but of different sizes [18, p 76].
For size differences in lines whose thickness
varies between 0.1 and 3 mm, for example, it
is most suitable to vary the line thickness by
steps of 0.3 mm [11, p 46].
Among the graphic variables, color has the
strongest psychological effect. Color can
attract map readers and catch their attention,
and cartographers can use it to emphasize
content. Assessing color as a graphic variable
can be very demanding because it is necessary
to know the characteristics of the following
dimensions: hue, brightness, and saturation
[16, pp 96-98]. In assessing area depictions of
borders on old maps, it was possible to only
focus on identifying the colors used with the
bare eye.
For linear depictions of the border, on 60%
(thirty-five) of the maps we found the shape
used, and on 19% (eleven) size.
From the second half of the seventeenth
century onward, the shape and size of the
linear border depictions change, but the shape
is much more common. It is characteristic that
before this there were no differences in
depicting borders.
In area depictions, only color is used. On 24%
(fourteen) of the maps color depiction was
found and the other variables were not
represented.
Depictions with variously colored areas are
chronologically very dispersed. This display
method was more common in the eighteenth
century.
Taking all of the maps analyzed into account,
it can be concluded that borders are mostly
drawn using shapes and size in linear
depictions, and with colors in area depictions
(Figure 6).

Acta Geobalcanica 4-2, 2018, 67-76
73
Figure 6. Use of graphic variables in all methods of depicting the border.
Taking into account the graphic variables, until
the second half of the seventeenth century the
borders of areas were shown with colors, and
later also with the size and shape of lines
(Figure 7).
Figure 7. Use of graphic variables in methods of depicting borders during the period studied.
Taking into account the method of
representation, single lines predominate over
colored areas. Such lines appear throughout
the entire period studied, and colored areas are
most common on eighteenth-century maps
(Figure 8).
Figure 8. Frequency of showing borders with lines and areas during the period studied.
CONCLUSION AND DISCUSSION
The main finding of this study is that maps
showing the territory of today’s Slovenia did
not mark borders until the sixteenth century
(Figure 1), and from the seventeenth century
onward they almost always marked them. This
was most often done using lines, which appear
on maps during the entire period studied,
followed by colored areas, which was most
common on eighteenth-century maps (Figure
8).
Studying old maps is important not only for
cartography or historical geography because

Primož Gašperič, Drago Perko, Matija Zorn, Cartographic presentations of borders on old maps of Slovenia
74
the findings of such research can also influence
the everyday lives of people today. Such is also
the character of this research, parts of which
were included in material for the arbitration
procedure to define the border between
Slovenia and Croatia.
After the independence of Slovenia and
Croatia in 1991, the former internal Yugoslav
border became an international border (today a
Schengen border), which was never precisely
mapped and marked with border stones during
Yugoslav times. Following a series of
unsuccessful bilateral attempts to resolve the
dispute over their land and maritime boundary,
Slovenia and Croatia, with the facilitation of
the European Commission, agreed on an
arbitration process by the Permanent Court of
Arbitration in The Hague (in the Netherlands).
An arbitration agreement was signed on
November 4th, 2009 [19].
In 2012, the Slovenian Ministry of Foreign
Affairs ordered preparation of geographical
material for the arbitration procedure to
determine the Slovenian-Croatian border. In
2013, extensive material was prepared entitled
“Geography of the Slovenian-Croatian
Border.” The old maps and other cartographic
sources played an important role in the
preparation of this material.
In total, almost exactly four-fifths of the
boundary passes along rivers and streams (a
hydrographic border) and follows hill ridges
(an orographic border). Therefore in
examining old maps and borders, special
focus was placed on the changing courses of
rivers through history.
The most important among the historical maps
were three Habsburg military land surveys.
The first survey was carried out between 1784
and 1787 [20; 21], the second one between
1806 and 1869 [22], and the third one between
1869 and 1887 [23]. Due to their scale
(1:28,880 for the first two and 1:25,000 for the
third), the military surveys are suitable for
studying changes in the courses of larger
rivers.
In addition to military purposes, cartographic
data in the Habsburg Monarchy were also
gathered for the land cadaster to catalogue
properties for tax purposes [24; 25]. The
Franciscan cadaster was used for all of
Slovenian territory between 1818 and 1828
[25; 26], and its updated (revised) version
between 1869 and 1887 [27], both at a scale of
1:2,880.
Figure 9 shows an example of the changing
course of the Mura River from the mid-
eighteenth century onward.
Figure 9. The changing course of the Mura River at Hotiza
in the last two hundred years based on cartographic sources.

Acta Geobalcanica 4-2, 2018, 67-76
75
Of course, modern geospatial technologies,
especially geographic information systems,
with data from various digital cartographic
sources (historical and recent aerial images,
precise digital elevation models (LiDAR), and
satellite images) also played an important role
in the preparation of geographical bases for the
arbitration procedure.
This confirms the applied value of modern
geography, as well as historical geography and
cartography.
ACKNOWLEDGEMENT: The authors acknowledge financial support from the Slovenian
Research Agency (program no. P6-0101: Geography of Slovenia, and project no. J6-6830:
Phenomenon of Border Rivers).
REFERENCES
[1] Brunet-Jailly E. The state of borders and borderlands studies 2009: A historical view and a view from
the Journal of Borderlands Studies, Eurasia Border Review, Hokkaido, vol. 1(1), pp 1-15, 2010.
[2] Boundary Classification Systems. Accessible at:
http://eurekaencyclopedia.com/index.php/Category:Boundary_Classification_Systems. Accessed 20
Fen 2018
[3] Bognar A. Utjecaj prirodno-geografske osnove na razvoj hrvatsko-slovenske granice, Dela, Slovenia,
vol. 16, pp 61-72, 2001.
[4] Lazius W. Ducatus Carniolae et His triae una cum Marcha Windorum, Cartographic material, Scale
proximately 1:500.000, 1561.
[5] Delano-Smith C. Signs on Printed Topographical Maps, ca. 1470–ca. 1640, The history of cartography,
Cartography in the European Renaissance, United States of America, United Kingdom, vol. 3, pp 528-
590, 2007.
[6] de Witt Ducatus Carintiae et Carniolae Cilleiae Comitatus, Cartographic material, Scale proximately
1:500.000, c1680.
[7] Delisle G. Kaartje van t Hertogdom Crain, Cartographic material, Scale proximately 1:320.000, 1791.
[8] Slukan Altić M. Povijesna kartografija – kartografski izvori u povijesnim znanostima, Yugoslavia,
2003.
[9] Gašperič P. Razvoj metod prikaza kartografskih elementov na starih zemljevidih ozemlja Slovenije,
Unpublished PhD Thesis Department of Geography, Faculty of Humanities, University of Primorska,
Slovenia, 2016.
[10] Peterca M. & Radošević N. & Milisavljević S. & Racetin F. Kartografija, Yugoslavia, 1974.
[11] Lovrić, P. Opća kartografija, Croatia, 1988.
[12] Petrovič D. Topografija in kartografija, Inženirska zbornica Slovenije, Examination program,
Slovenia, 2010. Accessible at:
http://www.izs.si/fileadmin/dokumenti/strokovni_izpiti/msgeo/2010_topografija_in_kartografija.pdf.
[13] Vrišer I. Uvod v geografijo, Yugoslavia, 1992.
[14] Robinson A. H. & Morrison J. L. & Muehrcke P. C. & Kimerling A. J. & Guptill S. C. Elements of
Cartography, United States of America, 1995.
[15] Maps and Cartography. GIS Research & Map Collection. Maps Tuturial: The Elements of a Map.
United States of America, 2015. Accessible at:
https://www.bsu.edu/libraries/collections/gcmc/tutorials/pdfs/mapscartographymapelements.pdf
[16] Fridl J. Metodologija tematske kartografije nacionalnega atlas Slovenije, Geografija Slovenije,
Slovenia, vol. 2, 1999.
[17] Bertin J. Graphics and Graphic Information-Processing, Germany, United States of America, 1981.
[18] Rojc B. Barve v tematski kartografiji, Yugoslavia, 1979.
[19] Arbitration Agreement between Government the Republic of Croatia and the Government Republic of
Slovenia. The Permanent Court of Arbitration, The Hague, 4 November 2009. Accessible at:
https://pcacases.com/web/sendAttach/2165. Accessed 20 Fen 2018
[20] Rajšp V. Slovenija na vojaškem zemljevidu 1763–1787 (Josephinische Landesaufnahme), Geodetski
vestnik, Slovenia, vol. 40, pp 68-71, 1996.
[21] Zorn M. Jožefinski vojaški zemljevid kot geografski vir. Geografski vestnik, Slovenia, vol. 79(2), pp
129-140, 2007.
Primož Gašperič, Drago Perko, Matija Zorn, Cartographic presentations of borders on old maps of Slovenia
76
[22] Timár G. System of the 1:28,800 scale sheets of the Second military survey in Tyrol and Salzburg,
Acta geodaetica et geophysica Hungarica, Hungary, vol. 44(1), pp 95-104, 2009.
DOI:10.1556/AGeod.44.2009.1.9
[23] Molnár G. & Podobnikar T. & Timár G. Mozaičenje listov kart merila 1 : 75.000 tretje vojaške izmere
Avstro-Ogrske, Geodetski vestnik, Slovenia, vol. 53(3), pp 459-468, 2009.
[24] Ribnikar P. Zemljiški kataster kot vir za zgodovino, Zgodovinski časopis, Yugoslavia, vol. 36(4), pp
321-337, 1982.
[25] Golec B. Zemljiški katastri 18. in 19. stoletja kot vir za stavbno, gradbeno in urbanistično zgodovino
slovenskega ozemlja, 2. del, Arhivi, Slovenia, vol. 33(2), pp 339-396, 2010.
[26] Drobnik M. Reproduciranje franciscejskega katastra, Arhivi, Slovenia, vol. 25(2), pp 65-76, 2001.
[27] Seručnik M. Reambulančni kataster za Kranjsko, Kronika, Slovenia, vol. 57(3), pp 491-504, 2009.