cartographic material on the evolution of forest cover ... · ... sources of climatic data algeria...
TRANSCRIPT

GCP/GLO/440/FRA - Component 1
Cartographic material on the evolution of forest cover, land uses and climatic conditions of the
pilot sites.
Show case of the Maarmora site, Morocco
October 2013

Signatures Author(s) : Pieter Kempeneers, Antoine Royer Issuing authority : VITO
Change Record Release Date Description of Change Editor(s)/Reviewers(s)
V1.0 28 October 2013

Contents
1 Executive summary 3
2 Introducing the Mamora forest site 4
3 Climatic cata 4
4 Vegetation cover 114.1 Ten day NDVI and anomalies maps . . . . . . . . . . . . . . . . . 114.2 Ten day NDVI evolution graphs . . . . . . . . . . . . . . . . . . . 13
4.2.1 Overall view of the time serie profil comparing the valueof the year with ten day min/max/average . . . . . . . . 13
4.2.2 Specific year (here 2012) compared with long term MIN/-MAX/AVERAGE . . . . . . . . . . . . . . . . . . . . . . 13
4.2.3 Yearly NDVI from 1998 to 2012 with the yearly MIN/-MAX/AVERAGE . . . . . . . . . . . . . . . . . . . . . . 13
5 National forest inventory data base 155.1 Input data . . . . . . . . . . . . . . . . . . . . . . . . . . . . . . . 155.2 Re-processed data . . . . . . . . . . . . . . . . . . . . . . . . . . 16
6 Remote sensing data 186.1 Image data . . . . . . . . . . . . . . . . . . . . . . . . . . . . . . 18
7 Forest mapping 217.1 Current situation (reference year 2010) . . . . . . . . . . . . . . . 217.2 Mapping forest dynamics through historical data . . . . . . . . . 25
A Dashboard rainfall 31
B Dashboard Heat Wave 32
C Dashboard Temperature 33
D Listings 34D.1 Processing the NFI data base (bash script) . . . . . . . . . . . . 34D.2 Automated classification process (bash script) . . . . . . . . . . . 58
2
Cartographic material on the evolution of forest cover, land uses and climatic conditions of the pilot sites. Show case of the Maamora site, Morocco.
GCP/GLO/440/FRA - Component 1, October 2013

1 Executive summary
This report summarises the the main results of a study performed by VITO, sub-contracted by the food and agriculture organisation (FAO) of the united nations.The study is part of the project GCP/GLO/440/FRA, entitled “optimising theproduction of goods and services from Mediterranean forest ecosystems withina context of global change”. The objective of the study was to intensify andimprove these goods and services in a sustainable way. The work has been splitin two parts: climatic conditions and forest cover mapping. Whereas the firstalso uses data collected by ground stations in the field, the second is mainlybased on remote sensing data. Nevertheless, ground reference data are an in-dispensable source of of information for calibrating (training) the methods andvalidating the results.
To support the vulnerability study FAO needed to investigate what are theclimatic and vegetation information available, for which period and how todisplay these various sources of information to facilitate further analysis. Forthis component three conditions have driven the investigation:
• Data should be freely available,
• The preliminary data preparation should be reproduced by the nationalexperts without software investment,
• The show case of Maarmonara could be extended to the other Mediter-ranean forest sites.
The main activities of this study were:
• Review of available data for the production of climatic conditions (tem-perature and rain fall)
• Production of forest land cover maps for the periods 1990, 2000 and 2010.Following a special request from FAO, the reference year 2005 was alsoadded.
• Production of additional maps that could be useful for the analysis of thevulnerability of the Mamora forest site due to climate change (e.g., changemaps of the normalised difference vegetation index)
On top of these activities, VITO participated to a workshop in Solsona,where preliminary results were presented. Prior to that, VITO visited the HautCommissariat aux Eaux et Forets et a la Lutte Contre la Desertification in Rabat(Morocco) as preparatory mission to the workshop. This one week missionincluded a field trip to the Mamora forest, the site under study for this project.VITO received full support of the Moroccan authorities and was provided withthe latest field data information available.
Although the data and results presented here are focused on the Mamoraforest, the followed approach can be extrapolated to other sites. This was also
3
Cartographic material on the evolution of forest cover, land uses and climatic conditions of the pilot sites. Show case of the Maamora site, Morocco.
GCP/GLO/440/FRA - Component 1, October 2013

confirmed by the positive comments expressed by the delegates of other coun-tries such as Lebanon, Tunisia, Turkey who are also involved in the GCP/-GLO/440/FRA project. However, the success of such an extrapolation willheavily depend on their respective support and the quality of the availableground reference data. In the case of the Mamora forest, detailed informationwas available on the current forest status (types). Unfortunately, no historicaldata for the reference years 1990, 2000 and 2005 were available, which hamperedthe assessment of the forest dynamics in the site. It can be foreseen that forsome other regions, field reference data is of poor quality or entirely missing.Although some alternative approaches are given in this report, this will have aserious impact on the quality of the final products.
This study has been performed with sustainability and capacity buildingin mind. All tools used in this project are open source and available for free.The goal is that countries will be capable to monitor their own forests andmanage in a sustainable way using the same techniques that are presented here.Nevertheless, training and capacity building are essential in this respect.
2 Introducing the Mamora forest site
The Mamora site has been divided in administrative units. There are five can-tons, labeled from A to E (see Fig. 1). The cantons are sub-divided in groups,labeled with roman numbers (I, II, III,...), counting from North to South andEast to West. Each group is again divided in parcels, labeled with Arabic num-bers (not shown in Fig. 1). Each parcel was finally divided in forest stands. Thereference data from the Moroccan authorities of the national forest inventory(NFI) service provided information at forest stand level. The local projection towhich the images have been projected is Merchich, valid for North of Morocco(epsg:26191).
3 Climatic cata
One of the thematic to analyse within the project concerns the evolution of theclimatic conditions (rainfall and temperature) over the Mamora forest. A pre-liminary research of the available sources of information was made and variousfree data set were identified (see Table 3)
To identify possible climatic variation the longest available time series setwas finally selected. This data set is based on the interpolated grid fom meteostations and produced by JRC/MARS with a spatial resolution of 25 km. OverMamora forest the data set covers all the other sites of the project as shown inthe following tables and maps
The specific reference grid 34048/34049/34050/33048/33049/33050 coveringthe Mamora forest were identified (see Fig. 3) and various available climaticindicators were extracted.
More than 20 indicators were calculated for each of the six 25km grids :
4
Cartographic material on the evolution of forest cover, land uses and climatic conditions of the pilot sites. Show case of the Maamora site, Morocco.
GCP/GLO/440/FRA - Component 1, October 2013

B
C
D
E
A
III
IIIIV
VVI
VII
VIII
III
III
IV
V
VIVII
III
IIIIV
VVI
VIIVIII
III
IIIIV
V
VI
I
IIIII
IV
Figure 1: Cantons and groups of Mamora site
Indicators Source Time series Timestep
Extension Resolution
Rainfall estimateRFE v2.0 fromMSG
NOAA CPC From 1995 10 daily Africa 8 km
http://earlywarning.usgs.gov/fews/africa/index.php
Rainfall estimateTARCAT v2.0from MSG
READINGTAMSAT
From 1983 10 daily Africa 0.0375◦
http://www.met.reading.ac.uk/~tamsat/about/
Rainfall/Temperaturefrom meteo station
JRC MARS From 1975 daily and10 daily
Europe andNorth Africa
25 km
Site:http://mars.jrc.ec.europa.eu/mars/
About-us/AGRI4CAST/Data-distribution/
AGRI4CAST-Interpolated-Meteorological-Data
Rainfall/Temperaturefrom meteo models
ECMWFJRC
From 1989 10 daily Global 0.25◦
Site:http://marswiki.jrc.ec.europa.eu/datadownload/
index.php
Table 1: sources of climatic data
Algeria Lebanon Morocco Tunesia TurkeyChrea Jabal Moussa Ifrane Barbara CiglikaraDjelfa/Senalba Kamouaa Mamora Siliana
Taznakht
Table 2: JRC / MARS climatic data coverage
5
Cartographic material on the evolution of forest cover, land uses and climatic conditions of the pilot sites. Show case of the Maamora site, Morocco.
GCP/GLO/440/FRA - Component 1, October 2013

Figure 2: JRC/MARS climatic data coverage (in blue) with the FFEM sites(yellow stars)
Figure 3: Grid reference of the Mamora forest site (yellow) in Morocco
6
Cartographic material on the evolution of forest cover, land uses and climatic conditions of the pilot sites. Show case of the Maamora site, Morocco.
GCP/GLO/440/FRA - Component 1, October 2013

• Temperatures (min, max, average)
• Number of days above various thresholds(25/30/35/40C) to identify se-quences of extreme temperature levels
• Longest heat stress consecutive periods and how many heat stress eventsof at least 3 consecutive days
• Yearly precipitations and to identify any potential drought spell or extremeprecipitation period the number of days for different rain thresholds (>5 mm and > 30 mm)
• Radiation
The overall idea is to possibly identify changes in the yearly magnitude ofthe indicators and in theirs frequency/distribution over time.
A database containing the original daily indicators were consolidated in “Ac-cess” software. The graphs were mainly generated with the online MARS viewerand can be reproduced for any FFME site.
In Fig. 4-6, the different graphs are shown for one of the six grids coveringthe Mamora site.
To facilitate the analysis the different indicators were grouped in 3 thematicdashboards :
RAINFALL panel (see Annex A)
• Yearly rainfall
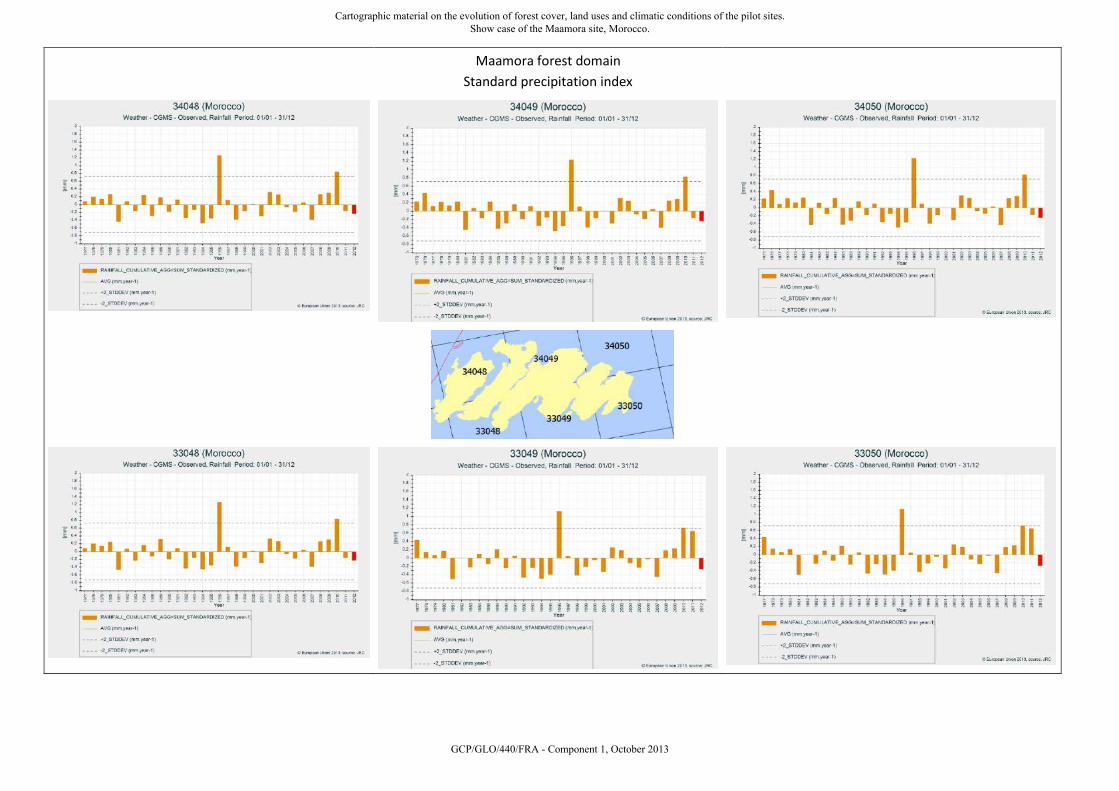
• Standard Precipitation Index
• Number of days > 5 mm
• Number of days > 30 mm
From 1975 only 2006 and 2010 appear as a significant outliers with a standardprecipitation index over +0.8 to +1.3. However there is no specific trend forthe yearly cumul. In terms of occurence of heavy daily rainfall (> 30 mm) themain significant year is 1996 that recorded more than 12 days of important dailycumul. A part from this specific event no obvious trend can be seen.
HEAT WAVE panel (see Annex B)
• Number of days > 35◦
• Number of days > 40◦
• Number of heat waves
• Longest heat wave period
TEMPERATURE panel (see Annex C)
• Maximum temperature (daily average)
7
Cartographic material on the evolution of forest cover, land uses and climatic conditions of the pilot sites. Show case of the Maamora site, Morocco.
GCP/GLO/440/FRA - Component 1, October 2013
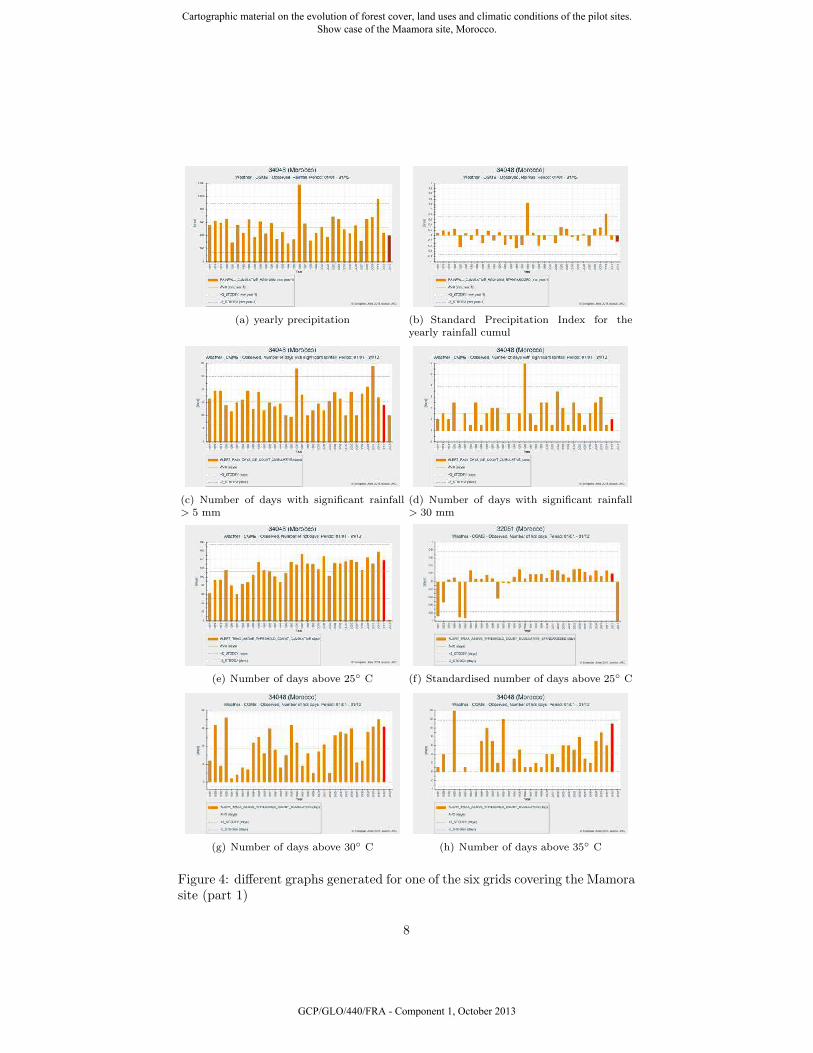
(a) yearly precipitation (b) Standard Precipitation Index for theyearly rainfall cumul
(c) Number of days with significant rainfall> 5 mm
(d) Number of days with significant rainfall> 30 mm
(e) Number of days above 25◦ C (f) Standardised number of days above 25◦ C
(g) Number of days above 30◦ C (h) Number of days above 35◦ C
Figure 4: different graphs generated for one of the six grids covering the Mamorasite (part 1)
8
Cartographic material on the evolution of forest cover, land uses and climatic conditions of the pilot sites. Show case of the Maamora site, Morocco.
GCP/GLO/440/FRA - Component 1, October 2013
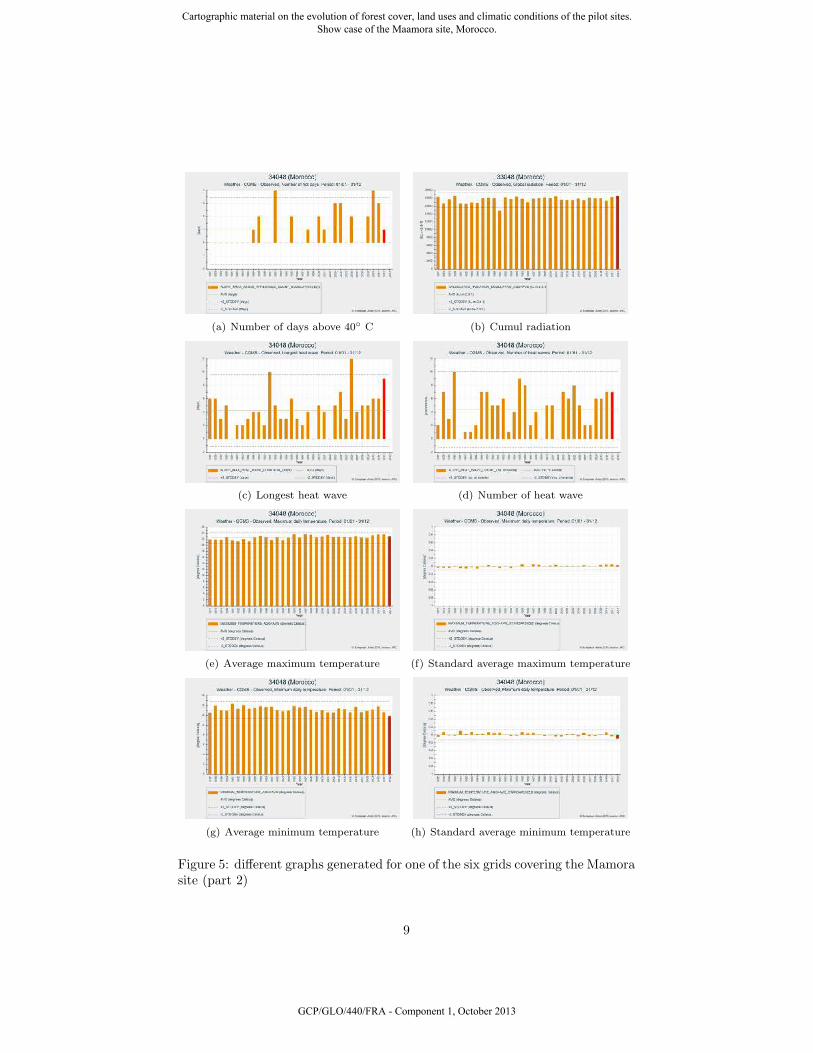
(a) Number of days above 40◦ C (b) Cumul radiation
(c) Longest heat wave (d) Number of heat wave
(e) Average maximum temperature (f) Standard average maximum temperature
(g) Average minimum temperature (h) Standard average minimum temperature
Figure 5: different graphs generated for one of the six grids covering the Mamorasite (part 2)
9
Cartographic material on the evolution of forest cover, land uses and climatic conditions of the pilot sites. Show case of the Maamora site, Morocco.
GCP/GLO/440/FRA - Component 1, October 2013

(a) Average mean temperature (b) Standard average mean temperature
(c) Absolute maximum temperature (d) Absolute minimum temperature
Figure 6: different graphs generated for one of the six grids covering the Mamorasite (part 3)
10
Cartographic material on the evolution of forest cover, land uses and climatic conditions of the pilot sites. Show case of the Maamora site, Morocco.
GCP/GLO/440/FRA - Component 1, October 2013
• Standard maximum temperature
• Minimum temperature (daily average)
• Standard minimum temperature
• Average temperature (daily average)
• Standard average temperature
No significant outlier appears for temperatures and the standard temper-ature index remains below 0.15 and for 2012 around 0.10. From the overallanalysis no significant time series reduction or increase can be seen however a5-6 years cycles is visible in the standardized temperature graphs.
These different indicators can be considered as a basic data set for pre-liminary analysis that should be completed by local data and national expertinterpretation. The proposed approach can be reproduced for the other Mediter-ranean sites by the local experts without any specific software a part from Ac-cess. Due do the spatial and historical indicators consistency it can also be usedfor sites comparison.
4 Vegetation cover
In order to look for potential changes in the vegetation cover we used the SPOTVGT satellite that have consistant time series from 1998 and being global cancover the different Mediterranean sites. The well known Normalized DifferenceVegetation Index that is linked to aerial phytomass was analysed through dif-ferent maps and graphs that can be used to detect changes in the land cover.Two types of maps were generated each ten day over Mamora forest:
• ten day NDVI
• ten day NDVI anomaly ( [2012-Mean ]/2012)
For the graphs the NDVI aggregation was made at canton and group levelsover different time periods. Three types of profils were produced:
• ten day NDVI from 1998 to 2012 with the long term MIN/MAX/AVER-AGE
• yearly NDVI from 1998 to 2012 with the yearly MIN/MAX/AVERAGE
4.1 Ten day NDVI and anomalies maps
The first ten day set can be used to analyse a specific ten day anomaly orsequences of anomalies when the yearly data set can be used for any specificseason analysis with comparison with long term average.
11
Cartographic material on the evolution of forest cover, land uses and climatic conditions of the pilot sites. Show case of the Maamora site, Morocco.
GCP/GLO/440/FRA - Component 1, October 2013

(a) Example of ten day NDVI in 2012
(b) Ten day NDVI anomaly(2012-mean)/mean
Figure 7: Ten day NDVI and anomalies maps
12
Cartographic material on the evolution of forest cover, land uses and climatic conditions of the pilot sites. Show case of the Maamora site, Morocco.
GCP/GLO/440/FRA - Component 1, October 2013

Figure 8: Ten day NDVI evolution from 1999 to 2012 (Profils per canton)
4.2 Ten day NDVI evolution graphs
To get a temporal overview of the NDVI evolution three graphs products weregenerated at canton or group levels.
4.2.1 Overall view of the time serie profil comparing the value ofthe year with ten day min/max/average
It gives an overview of the historical time series and allow a quick identificationof the extreme years. For example in the Canton A the vegetation index in 2002is the lowest profil of the time series probably as a results of very dry condition.(see the 2002 portion of the above graph much below than average).
4.2.2 Specific year (here 2012) compared with long term MIN/-MAX/AVERAGE
Such profils are used to focus on a specific season and analyse
• when the vegetation condition start to be below or above the normalcondition
• how important are the anomalies compared with the MIN/MAX/MEAN
• and the duration of such anomalies to analyse the potential impact on thevegetation growth and as an element of the vulnerability analysis.
4.2.3 Yearly NDVI from 1998 to 2012 with the yearly MIN/MAX/AV-ERAGE
It is based on a synthetic indicator like mean/max/min NDVI which is calculatedfor each year. Display on a graph at group or canton level it shows the time
13
Cartographic material on the evolution of forest cover, land uses and climatic conditions of the pilot sites. Show case of the Maamora site, Morocco.
GCP/GLO/440/FRA - Component 1, October 2013

(a) 2012 NDVI compared with MIN/-MAX/AVERAGE Profils per canton
(b) 2012 NDVI compared with MIN/-MAX/AVERAGE. Profils per group (ex. ofhigher NDVI in 2012)
(c) 2012 NDVI compared with MIN/-MAX/AVERAGE. Profils per group (ex. oflower NDVI in 2012)
Figure 9: Specific year (here 2012) compared with long term MIN/MAX/AV-ERAGE
14
Cartographic material on the evolution of forest cover, land uses and climatic conditions of the pilot sites. Show case of the Maamora site, Morocco.
GCP/GLO/440/FRA - Component 1, October 2013

(a) canton A (b) canton E
Figure 10: NDVI yearly MAX/MIN/AVERAGE evolution from 1999(01) to2012(14)
series evolution and give a synthetic view of the overall evolution of vegetationfor the last 13 years. For example the graphs of Canton E shows that 2003 and2004 experienced good vegetation development and after lower indices there isa progressive vegetation increase from 2009.
Once again as for the climatic indicators these SPOT VGT NDVI can bedownloaded freely for any Mediterranean site of the FFEM. The different mapsand graphs can be produced by the national experts by using the free SPIRITSsoftware. Due to the spatial and historical consistency these indicators can alsobe used to make inter comparisons of the differents sites. Analysis from thelocal experts are required to interpret the possible anomalies and changes andlink them with the specific local conditions within the frame of the vulnerabilitystudy.
5 National forest inventory data base
5.1 Input data
National forest inventory (NFI) data were provided as polygons in vector shapefiles. Spaces in all filenames were replaced with underscores due to compatibilityissues with a Linux file system. The following convention of the file names wasfollowed: canton<C><G>_strate.shp, with <C> the canton [A-E] and <G> thegroup (I, II, III, ...). Each polygon contained three attributes (fields of typeString) from which ESSENCES was the most informative for this study.
The ESSENCES field contained the main vegetation types within the foreststand. In case of a mixture of species, up to four species were listed. In additionto the vegetation type, the ESSENCE string contained: two characters [Rg, Rb]for planning, one integer [1-4] for forest cover, one character [f,t] for trunk typeand one character [j,a,v] for the tree age (see Table 4). For example, “Rg Qs3fjQs2fa “ indicated a mixed forest stand that was regenerated (Rg). The standcontained a mixture of both young (j) and adult (a) Quercus suber L. with a
15
Cartographic material on the evolution of forest cover, land uses and climatic conditions of the pilot sites. Show case of the Maamora site, Morocco.
GCP/GLO/440/FRA - Component 1, October 2013

Type commentQs Quercus suber L.Vs vide sylvatiqueEu.ca Eucalyptys Camalendulensis (dominant Eucalyptus species in Mamora)ac AcaciaPcm Poirier de la MamoraA.mo Acacia Mollissima (dominant acacia species)A.cy Acacia cyanophyllaC.cuEu.si Eucalyptus Sideraux XylonEu.gr Eucalyptus graindisEu.cla Eucalyptus CladocalyxEu.go Eucalyptus GonphocephalaP.h (Ph) Pins HalepinsisP.pa Pins pinasterP.r (=P.rad) Pins radiata
Table 3: Type information in the existing field ESSENCE
respective tree cover of 5 − 25% (3) and 25 − 45% (2). All plants were seeded(f).
5.2 Re-processed data
To facilitate queries of specific data within the data base, the information con-tained in the provided vector shape file was re-organised. In particular thestring in the ESSENCE field was parsed and classified into a number of newfields: type, density, plan, trunk and stage. The new structure of the data baseis shown in Tables 5-9.
Within the forest, the forest types were reduced to four main types: Acacia,Eucalyptus, Pine and Quercus suber L.. Together with a no forest class, theforest type map consisted of five classes (see Table 5).
The processing of the provided vector shape files was hampered by someirregularities in the ESSENCE field. Extra effort was needed in an attempt toregularize them. As an example, there was no consistent use of age values. Newmixed values were introduced, e.g., Rg Qs1fj/a. The use of spaces within thestring was not used consistently either:
• Both “RgQs2fj” and “Rg Qs2fj” were used
• Both “RgQs3fjQs2fa” and “Rg Qs3fj Qs2fa” were used.
The result was stored in a new vector shape file, nfi mamora.shp containinga triplet for each of the new fields, e.g., type1, type2 and type3. The reasonfor the triplets is because of the mixed forest stands. Up to three differentspecies were reported for each stand. In case of homogeneous stands, only thefirst entry was used. In addition, the original ESSENCE field was retained for
16
Cartographic material on the evolution of forest cover, land uses and climatic conditions of the pilot sites. Show case of the Maamora site, Morocco.
GCP/GLO/440/FRA - Component 1, October 2013

value descriptionRg Forest re-generation (Quercus suber L.)Rb Re-forestation (Pins, Acacia, Eucalyptus)1 cover > 45%2 25% < cover < 45%3 5% < cover < 25%4 cover < 5%f futaie (seed-tree or coppice with standards)t taillis (coppice)j jeunea adultev vieux
Table 4: Additional information in the existing field ESSENCE
String name of tree species value in GeoTiff mapa Acacia 12eu Eucalyptus 13p Pine 14qs Quercus suber L. 11NF No forest 20
Table 5: new field for type in new structure of data base
value (Integer) description1 cover > 45%2 25% < cover < 45%3 5% < cover < 25%4 cover < 5%
Table 6: new field for density in new structure of data base
value (Integer) description0 0 not specified1 forest re-generation2 re-forestation
Table 7: new field for plan in new structure of data base
value (Char) descriptiont tailli (Fr)=coppice (En)f futaie (Fr)=seed-tree or coppice with standards (En)
Table 8: new field for trunk in new structure of data base
17
Cartographic material on the evolution of forest cover, land uses and climatic conditions of the pilot sites. Show case of the Maamora site, Morocco.
GCP/GLO/440/FRA - Component 1, October 2013

value (Char) descriptionj jeune (Fr)=young (En)a adult (Fr=En)v viex (Fr) = old (En)e no tree cover due to failed regeneration or reforestation
Table 9: new field for stage in new structure of data base
Figure 11: Processed vector shape loaded in a geographic information system
verification purposes. The advantage of the new processed vector shape file isit can easilty be queried for the different new fields. An overview is given inFig. 11, showing the processed vector shape file loaded in a free and open sourcegeographic information system (QGIS).
6 Remote sensing data
6.1 Image data
Fine spatial resolution remote sensing data (30 m) were downloaded from theUSGS Landsat data archive http://landsat.usgs.gov. In total, 42 scenesof 170 × 185 km were obtained, covering a period from 1984 until 2010. Anoverview of available data and acquisition times is given in Table 10. Based onTable 10, the scenes of Table 11 were used. Quicklook images for each of thereference dates (1990, 2000, 2005 and 2010) are shown in Fig. 12.
The spectral and spatial characteristics of the Landsat sensor are shown inTable 12. Even though the sensor characteristics of Landsat TM and ETM+are similar, important differences in the digital numbers acquired by the sensorsexist. Data sets from the Landsat 5 TM are not routinely corrected for a num-
18
Cartographic material on the evolution of forest cover, land uses and climatic conditions of the pilot sites. Show case of the Maamora site, Morocco.
GCP/GLO/440/FRA - Component 1, October 2013

year Jan Feb Mar Apr May Jun Jul Aug Sep Oct Nov Dec1985 151987 5 24 10 27 121988 261999 20 82000 15 2 21 22 122001 92002 1 21 22 16 17,25 292003 25 27 6 7 242007 11 30 12009 23 24 102010 20 7
Table 10: Acquisition dates for available Landsat data over Mamora site (suit-able dates in bold)
reference year month filename
19901987 07 LT52010361987191XXX02.tif1987 08 LT52010361987239XXX03.tif1987 09 LT52010361987255XXX03.tif
2000
1999 08 LE72010361999232EDC00.tif2000 07 LE72010362000203EDC00.tif2000 08 LE72010362000235EDC00.tif2001 08 LE72010362001221EDC00.tif2002 09 LE72010362002272EDC00.tif
2005
2003 07 LT52010362003187MTI01.tif2003 08 LT52010362003219MTI01.tif2003 09 LT52010362003267MTI01.tif2007 07 LT52010362007182MPS00.tif
20102009 08 LT52010362009235MPS00.tif2009 09 LT52010362009267MPS00.tif
Table 11: list of Landsat scenes used for forest mapping
19
Cartographic material on the evolution of forest cover, land uses and climatic conditions of the pilot sites. Show case of the Maamora site, Morocco.
GCP/GLO/440/FRA - Component 1, October 2013

(a) 1990 (b) 2000
(c) 2005 (d) 2010
Figure 12: Quicklooks of Landsat scenes representing the reference years
Sensor code Landsat number(s) band spectral range spatial resolution
TM 4,5
1 0.45− 0.52 µm 30 m2 0.52− 0.60 µm 30 m3 0.63− 0.69 µm 30 m4 0.76− 0.90 µm 30 m5 1.55− 1.75 µm 30 m6 10.40− 12.50 µm 60 m7 2.08− 2.35 µm 30 m
ETM+ 7
1 0.45− 0.52 µm 30 m2 0.52− 0.60 µm 30 m3 0.63− 0.69 µm 30 m4 0.77− 0.90 µm 30 m5 1.55− 1.75 µm 30 m6a 10.40− 12.50 µm (Low Gain) 60 m6b 10.40− 12.50 µm (High Gain) 60 m7 2.08− 2.35 µm 30 m8 0.52− 0.90 µm 15 m
Table 12: characteristics of Landsat sensors
20
Cartographic material on the evolution of forest cover, land uses and climatic conditions of the pilot sites. Show case of the Maamora site, Morocco.
GCP/GLO/440/FRA - Component 1, October 2013

ber of radiometric and geometric artifacts, including memory effect, gain/bias,and inter-focal plane misalignment. Unfortunately, the images for the four ref-erence years were not acquired with the same sensor, which is problematic formonitoring purposes. Ideally, a radiometric normalization should be performed.However, this was not done for this study.
The available input Landsat scenes for each reference year 1990, 2000, 2005and 2010 are shown in Table 11. A composit scene was created for each referenceyear by selecting the median pixel value over all available scenes covered by thatreference year.
7 Forest mapping
7.1 Current situation (reference year 2010)
For the classification of forest types, a pixel based support vector machine wasselected, which is a state of the art supervised classifier. The training datawere derived from the processed NFI reference data. The implementation wasbased on pktools, an open source software toolbox for remote sensing imageprocessing in a Linux environment1. The classification process was automatedusing a script written in bash (see appendix D.2). Five classes were defined:non-forest, Quercus suber L, Acacia, Eucalyptus and Pine.
A training set was selected from the available reference data by extractingthe centroid pixel in each forest stand. There was no reference data availablefor non-forest areas. To train the classifier for non-forest, forest stands with adensity less than 25% were selected. For the forest classes the following rulesfor the forest stands applied:
1. density should be at least 45% (attribute density1 is 1)
2. no mixtures (both attributes density2 and density3 are 0)
3. regeneration or reforestation should be successful (attribute stage notequal to ’e’)
The result of the pixel based classification is shown in Fig. 13(a). Referencedata was available only at forest stand level. Therefore, the classification mapcould only be assessed on a forest stand level. Moreover, no information wasavailable for the non-forest class. Though a real validation was beyond thescope of this study, a preliminary accuracy assessment was conducted using theforest stands in the processed vector shape file. The forest stands were overlayedon the classified forest type map. Then, the majority forest class for the pixelswithin each forest stand was extracted. Non-forest pixels were disregarded as noreference data was available for this class. The majority class was then assignedto the forest stand as the classified forest type. Doing this for each forest standin the Mamora forest, a classified forest type vector map was obtained (shown
1http://pktools.nongnu.org
21
Cartographic material on the evolution of forest cover, land uses and climatic conditions of the pilot sites. Show case of the Maamora site, Morocco.
GCP/GLO/440/FRA - Component 1, October 2013


0 Quercus suber L. Acacia Eucalyptus PineQuercus suber L. 612170 6850 136019 15766Acacia 3367 25822 2545 180Eucalyptus 20590 3259 441092 12577Pine 6810 680 24382 80511User Acc. (%) 95 71 73 74Prod. Acc. (%) 79 81 92 72
Table 13: Accuracy assessment for Mamora forest type map 2010: overallaccuracy=83% (Kappa=0.72)
in Fig. 13(b). This vector map was then compared to the labeled vector filefrom the Moroccan NFI authorities (the processed vector shape file). The areasof the forest stands were taken into account when calculating the classificationaccuracies.
The accuracy assessment was performed using the 2403 forest stands avail-able in the processed vector shape file. A confusion matrix showing the ac-curacies is shown in Table 13. To obtain the confusion matrix in table 13, theforest stands were weighted by their area (approximated by the number of pixelscovered).
Because the classification concentrated on forest types only, it can be ex-pected that the classification accuracy decreases with forest density level. Thiswas confirmed by conducting the accuracy assessment at different forest densitylevels. An overall accuracy of 90% was obtained for level 1 (forest density above45%). At level 2 and 3 (forest densities of [25− 45%] and [5− 25%]), the overallaccuracy decreased to 72% and 70% respectively. At the lowest level, the testsample was not sufficiently large and not all classes were represented.
The results of the accuracy assessment confirmed the similarity of the clas-sified map to the original map as provided by the Moroccan NFI authorities, asshown in Fig. 14.
The availability of reliable ground reference data is a well known problem.The Mamora forest has been well studied over the last decade. It can be foreseenthat for other regions in the Mediterranean area reference data are even moresparse. Though no ideal solution exists, there are a number of approaches thatcan be followed in that case. Image data of superior quality can be visuallyinterpreted. Typically this is done by local experts on image data covering aselected area at a fine spatial resolution (typically 1-5 m). The idea of superiorquality is that the reference product, the result of the visual interpretation,is more accurate than the product to be validated. Image data from Google-earth R© is one source of information that is free, provided fine spatial resolutiondata from the year of interest is available. This approach can be used fortraining and validation purposes. As an illustration a forest/non-forest map ofMamora has been generated for the reference year 2010, using a small trainingsample based on Google-earth R© imagery (Fig. 15). Another approach is to useunsupervised classification. This method clusters the image data in a number of
23
Cartographic material on the evolution of forest cover, land uses and climatic conditions of the pilot sites. Show case of the Maamora site, Morocco.
GCP/GLO/440/FRA - Component 1, October 2013


0 10 20 km
Figure 15: forest cover map based on a small training set based on Google-earth R© imagery (reference year 2010)
unlabeled classes. Nevertheless, at some stage, these clusters need to be labeledby, e.g., local experts.
7.2 Mapping forest dynamics through historical data
Unfortunately, no reference data were available in digital format for the ref-erence years previous to 2010. As a result, we were not able to calibrate orvalidate forest dynamics in a quantitative way. Nevertheless, as illustration,some approaches to derive forest change maps are presented here.
One approach is to conduct a relative analysis using a time series of someindex. The normalized difference vegetation index (NDVI) is an example of aquantitative measure of vegetation greenness. For images acquired from July toSeptember, the dry season in the Mamora forest area, the calculated NDVI canbe linked to forest cover. For an absolute measure, reference data is still neededfor calibration. However, monitoring the NDVI over time provides insight inthe forest cover dynamics. The potential forest loss and gain for the periods1990-2005 and 2005-2010 are shown in Fig. 16. Expert knowledge from thefield is needed to interpret these results. Forest change detection is challengingand prone to errors. False detections (errors of commission) are particularlyproblematic due to changing conditions in acquiring the images (sun and viewangles, atmosphere, ...). The advantage of a normalized index such as the NDVIis that some of these factors can dependencies can be reduced. Nevertheless, it
25
Cartographic material on the evolution of forest cover, land uses and climatic conditions of the pilot sites. Show case of the Maamora site, Morocco.
GCP/GLO/440/FRA - Component 1, October 2013
remains difficult to compare indices derived from different sensors and propercalibration is needed. As a result, due to the different sensor characteristics ofTM and ETM+ (explained in section 6.1), the dynamics for the year 2000 wereexcluded.
Another approach is to use 2010 reference data as training to classify imagedata from previous years. It can be expected that parts of the forest areahave been changed. As a result, using the 2010 reference data as training forprevious years will introduce some errors. Assuming that an important partof the Mamora forest has remained unchanged and the selected classifier wasrobust to some errors in the training data, this approach was tested for thereference years prior to 2010. The results after aggregation to forest stand levelare shown in Fig. 17.
It can be expected that the majority forest type per forest stand remainsrelatively stable. This is confirmed by the results in Fig. 17. From the pixelbased forest type maps, the proportion of an individual forest type can also becalculated for each forest stand. This was done for Quercus suber L., which isan important forest type for the Mamora forest due to its high economic value.There has been an effort over the last decades to increase the proportion ofQuercus suber L.. This was confirmed by the calculated forest proportion mapsfor Quercus suber L., as illustrated for canton A in Fig. 18.
Forest type monitoring based on remote sensing methods is not limited toadministrative regions that have been defined, sometimes due to historical rea-sons. It can be interesting to monitor the forest dynamics in new areas thathave not been covered by traditional forest surveys. Some examples are greenzones (parks) in urban areas and military domains. In the Mamora forest thelocal population has settled in a limited number of areas. The forest types forthe largest of these settlements are shown in Fig. 19. Whereas in the managedforest areas the forest density seems to have increased over the last decades, thisis not the case for the settlement. Although no data were available to verify this,it is an interesting result and could be subject of further study in collaborationwith the Moroccan NFI authorities.
26
Cartographic material on the evolution of forest cover, land uses and climatic conditions of the pilot sites. Show case of the Maamora site, Morocco.
GCP/GLO/440/FRA - Component 1, October 2013


0 10 20 km
proportion (%)0.000 - 20.00020.000 - 40.00040.000 - 60.00060.000 - 80.00080.000 - 100.000
(a) 1990
0 10 20 km
proportion (%)0.000 - 20.00020.000 - 40.00040.000 - 60.00060.000 - 80.00080.000 - 100.000
(b) 2000
0 10 20 km
proportion (%)0.000 - 20.00020.000 - 40.00040.000 - 60.00060.000 - 80.00080.000 - 100.000
(c) 2005
0 10 20 km
proportion (%)0.000 - 20.00020.000 - 40.00040.000 - 60.00060.000 - 80.00080.000 - 100.000
(d) 2010
Figure 18: Proportion of Quercus suber L. in forest stands
29
Cartographic material on the evolution of forest cover, land uses and climatic conditions of the pilot sites. Show case of the Maamora site, Morocco.
GCP/GLO/440/FRA - Component 1, October 2013


A Dashboard rainfall
31
Cartographic material on the evolution of forest cover, land uses and climatic conditions of the pilot sites. Show case of the Maamora site, Morocco.
GCP/GLO/440/FRA - Component 1, October 2013

Rainfall panel:
- Yearly rainfall
- Standard Precipitation Index
- Number of days > 5mm
- Number of days > 30mm
Cartographic material on the evolution of forest cover, land uses and climatic conditions of the pilot sites. Show case of the Maamora site, Morocco.
GCP/GLO/440/FRA - Component 1, October 2013

Maamora forest domain
Yearly rainfall
Cartographic material on the evolution of forest cover, land uses and climatic conditions of the pilot sites. Show case of the Maamora site, Morocco.
GCP/GLO/440/FRA - Component 1, October 2013
Maamora forest domain
Standard precipitation index
Cartographic material on the evolution of forest cover, land uses and climatic conditions of the pilot sites. Show case of the Maamora site, Morocco.
GCP/GLO/440/FRA - Component 1, October 2013

Maamora forest domain
Number of daily rainfall >5mm
Cartographic material on the evolution of forest cover, land uses and climatic conditions of the pilot sites. Show case of the Maamora site, Morocco.
GCP/GLO/440/FRA - Component 1, October 2013

Maamora forest domain
Number of daily rainfall >30mm
Cartographic material on the evolution of forest cover, land uses and climatic conditions of the pilot sites. Show case of the Maamora site, Morocco.
GCP/GLO/440/FRA - Component 1, October 2013

B Dashboard Heat Wave
32
Cartographic material on the evolution of forest cover, land uses and climatic conditions of the pilot sites. Show case of the Maamora site, Morocco.
GCP/GLO/440/FRA - Component 1, October 2013

Dash board on the heat wave indicators
- Number of days >35°C
- Number of days >40°C
- Number of heat waves
- Longest heat wave period
Cartographic material on the evolution of forest cover, land uses and climatic conditions of the pilot sites. Show case of the Maamora site, Morocco.
GCP/GLO/440/FRA - Component 1, October 2013
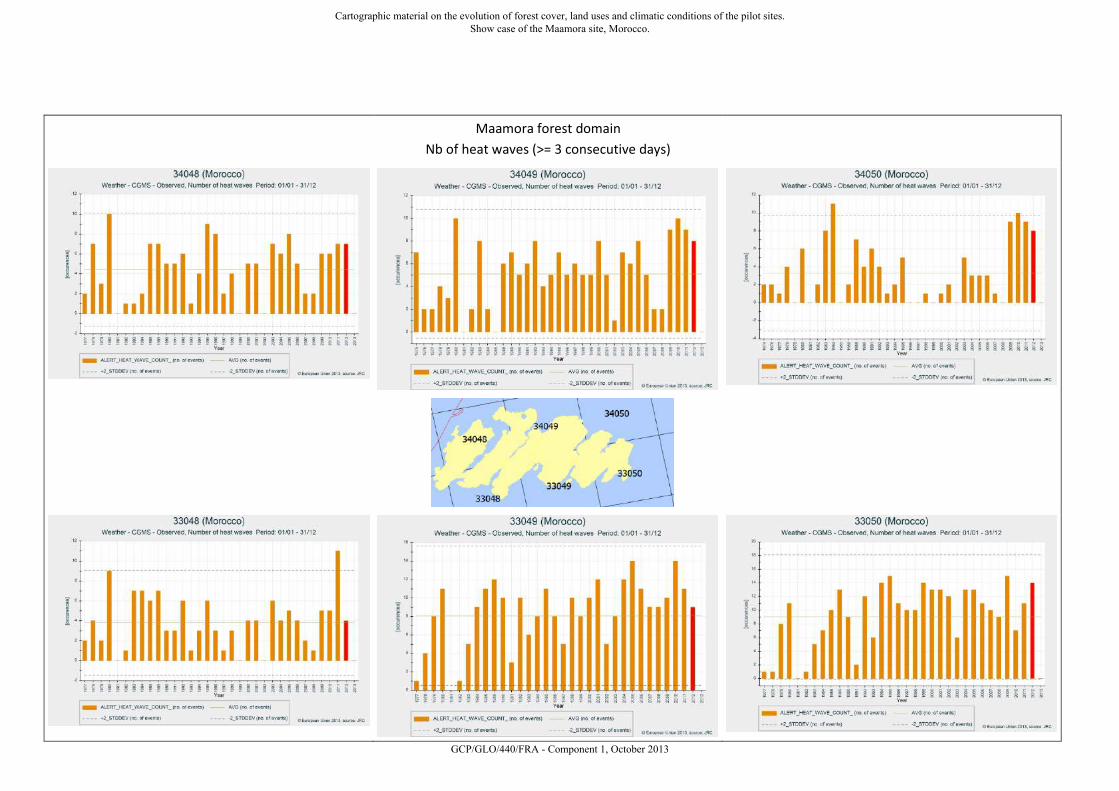
Maamora forest domain
Nb of heat waves (>= 3 consecutive days)
Cartographic material on the evolution of forest cover, land uses and climatic conditions of the pilot sites. Show case of the Maamora site, Morocco.
GCP/GLO/440/FRA - Component 1, October 2013

Maamora forest domain
Longest heat wave (consecutive number of heat days)
Cartographic material on the evolution of forest cover, land uses and climatic conditions of the pilot sites. Show case of the Maamora site, Morocco.
GCP/GLO/440/FRA - Component 1, October 2013

Maamora forest domain
Number of days > 35°C
Cartographic material on the evolution of forest cover, land uses and climatic conditions of the pilot sites. Show case of the Maamora site, Morocco.
GCP/GLO/440/FRA - Component 1, October 2013

Maamora forest domain
Number of days > 40°C
Cartographic material on the evolution of forest cover, land uses and climatic conditions of the pilot sites. Show case of the Maamora site, Morocco.
GCP/GLO/440/FRA - Component 1, October 2013

C Dashboard Temperature
33
Cartographic material on the evolution of forest cover, land uses and climatic conditions of the pilot sites. Show case of the Maamora site, Morocco.
GCP/GLO/440/FRA - Component 1, October 2013

TEMPERATURE panel
- Maximum temperature (daily average)
- Standard maximum temperature
- Minimum temperature (daily average)
- Standard minimum temperature
- Average temperature (daily average)
- Standard average temperature
Cartographic material on the evolution of forest cover, land uses and climatic conditions of the pilot sites. Show case of the Maamora site, Morocco.
GCP/GLO/440/FRA - Component 1, October 2013

Maamora forest domain
MAXIMUM temperature (daily average)
Cartographic material on the evolution of forest cover, land uses and climatic conditions of the pilot sites. Show case of the Maamora site, Morocco.
GCP/GLO/440/FRA - Component 1, October 2013

Maamora forest domain
Standard T. MAX index
Cartographic material on the evolution of forest cover, land uses and climatic conditions of the pilot sites. Show case of the Maamora site, Morocco.
GCP/GLO/440/FRA - Component 1, October 2013

Maamora forest domain
MINIMUM temperature (daily average)
Cartographic material on the evolution of forest cover, land uses and climatic conditions of the pilot sites. Show case of the Maamora site, Morocco.
GCP/GLO/440/FRA - Component 1, October 2013

Maamora forest domain
Standard T. MIN index
Cartographic material on the evolution of forest cover, land uses and climatic conditions of the pilot sites. Show case of the Maamora site, Morocco.
GCP/GLO/440/FRA - Component 1, October 2013

Maamora forest domain
MEAN temperature (daily average)
Cartographic material on the evolution of forest cover, land uses and climatic conditions of the pilot sites. Show case of the Maamora site, Morocco.
GCP/GLO/440/FRA - Component 1, October 2013
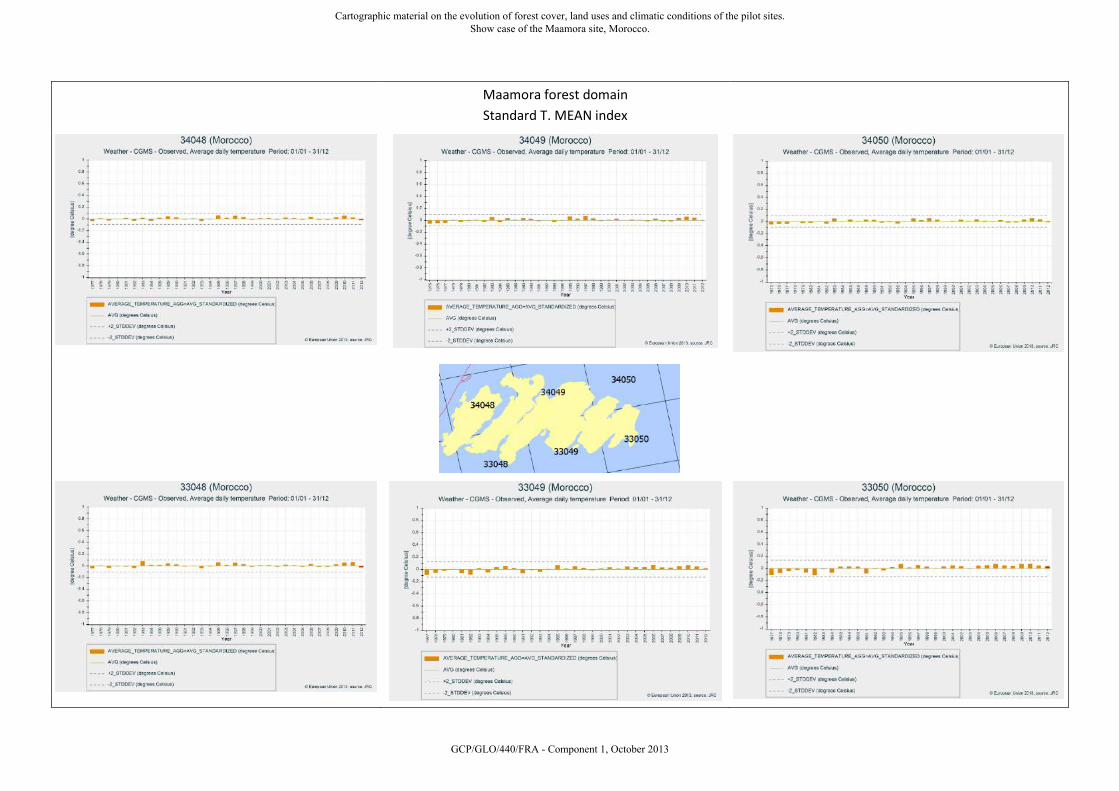
Maamora forest domain
Standard T. MEAN index
Cartographic material on the evolution of forest cover, land uses and climatic conditions of the pilot sites. Show case of the Maamora site, Morocco.
GCP/GLO/440/FRA - Component 1, October 2013

D Listings
D.1 Processing the NFI data base (bash script)
1 #!/bin/bash
ROOTDIR =/ storage/hyper2/_Projects/NI079_FFEM/nfi/STRATES
3
for file in $(find . -name ’canton *.shp’);do ogrinfo
→ $file $(basename $file .shp)|grep ESSENCE|awk -v
→ FS=’=’ ’{print $2}’;done|sort -u >
→ ${ROOTDIR }/ essence.txt
5
echo "Found some inconsistencies in ESSENCE fields:
→ manually corrected using qgis: edit attribute
→ table "
7 echo "Todo: species mixtures should be resolved
→ (Eu.gr/ca1tj , Eu.gr/ca1tj/a, Eu.gr/ca2ta , ..."
9 echo "RgQs2fj should be Rg Qs2fj (missing space)"
echo "in file":
11 for file in $(find . -name ’canton *.shp’);do
→ COUNT=$(ogrinfo $file $(basename $file .shp)
→ -where ESSENCE=’RgQs2fj ’|grep Count|awk -v
→ FS=’:’ ’{print $2}’); if [ "${COUNT}" -gt 0
→ ];then echo "$file $COUNT";fi;done
#echo ${ROOTDIR }/ cantonBII_strate.shp
13
echo "Qs 2fv should be Qs2fv (space should be
→ deleted)"
15 echo "in file":
for file in $(find . -name ’canton *.shp’);do
→ FOUND=$(ogrinfo $file $(basename $file
→ .shp)|grep ESSENCE|grep "Qs 2fv");if [ -n
→ "${FOUND}" ];then echo $file;fi;done
17 #echo ${ROOTDIR }/ cantonBIV_strate.shp
19 echo "P.p should be P.pa"
echo "in file":
21 for file in $(find . -name ’canton *.shp’);do
→ FOUND=$(ogrinfo $file $(basename $file
→ .shp)|grep ESSENCE|grep "P.p[0-9]");if [ -n
→ "${FOUND}" ];then echo $file;fi;done
#echo ${ROOTDIR }/ cantonAIV_strate.shp
23 #echo ${ROOTDIR }/ cantonAII_strate.shp
#echo ${ROOTDIR }/ cantonBV_strate.shp
25 #echo ${ROOTDIR }/ cantonAVI_strate.shp
34
Cartographic material on the evolution of forest cover, land uses and climatic conditions of the pilot sites. Show case of the Maamora site, Morocco.
GCP/GLO/440/FRA - Component 1, October 2013

27 echo "Pc should be P.c"
echo "in file":
29 for file in $(find . -name ’canton *.shp’);do
→ FOUND=$(ogrinfo $file $(basename $file
→ .shp)|grep ESSENCE|grep "Pc[0-9]");if [ -n
→ "${FOUND}" ];then echo $file;fi;done
#echo ${ROOTDIR }/ cantonBV_strate.shp
31
echo "Eu.cla should be Eu.cl"
33 echo "in file":
for file in $(find . -name ’canton *.shp’);do
→ FOUND=$(ogrinfo $file $(basename $file
→ .shp)|grep ESSENCE|grep "Eu.cla");if [ -n
→ "${FOUND}" ];then echo $file;fi;done
35 #echo ${ROOTDIR }/ cantonDIV_strate.shp
37 echo "Rb Eu.cl/si1tj should be Rb Eu.cl1tj Eu.si1tj"
echo "in file":
39 for file in $(find . -name ’canton*_strate.shp’);do
→ FOUND=$(ogrinfo $file $(basename $file
→ .shp)|grep ESSENCE|grep "Eu.cl/si1tj");if [ -n
→ "${FOUND}" ];then echo $file;fi;done
#echo ${ROOTDIR }/ cantonEV_strate.shp
41
for file in $(find . -name ’canton*_strate.shp’);do
→ FOUND=$(ogrinfo $file $(basename $file
→ .shp)|grep ESSENCE|grep "Rb Eu.go/ca1ta");if [
→ -n "${FOUND}" ];then echo $file;fi;done
43 #echo ${ROOTDIR }/ cantonCII_strate.shp
45 echo "Echec should be echec"
echo "in file":
47 for file in $(find . -name ’canton *.shp’);do
→ FOUND=$(ogrinfo $file $(basename $file
→ .shp)|grep ESSENCE|grep "Echec");if [ -n
→ "${FOUND}" ];then echo $file;fi;done
#echo ${ROOTDIR }/ cantonAIV_strate.shp
49
echo "P.rad should be P.r"
51 echo "in file":
for file in $(find . -name ’canton *.shp’);do
→ FOUND=$(ogrinfo $file $(basename $file
→ .shp)|grep ESSENCE|grep "P.rad");if [ -n
→ "${FOUND}" ];then echo $file;fi;done
53 #echo ${ROOTDIR }/ cantonEI_strate.shp
35
Cartographic material on the evolution of forest cover, land uses and climatic conditions of the pilot sites. Show case of the Maamora site, Morocco.
GCP/GLO/440/FRA - Component 1, October 2013

55 echo "Qs3j/a should be Qs3fj/a ?"
echo "in file":
57 for file in $(find . -name ’canton *.shp’);do
→ FOUND=$(ogrinfo $file $(basename $file
→ .shp)|grep ESSENCE|grep "Qs3j");if [ -n
→ "${FOUND}" ];then echo $file;fi;done
#echo ${ROOTDIR }/
59
echo "Now corrected in new version of
→ /storage/hyper2/_Projects/NI079_FFEM/nfi/STRATES"
61
for file in $(find . -name ’canton *.shp’);do ogrinfo
→ $file $(basename $file .shp)|grep ESSENCE|awk -v
→ FS=’=’ ’{print $2}’;done|sort -u >
→ ${ROOTDIR }/ essence_corrected.txt
63
#different cases:
65 echo "process one essence"
awk ’{ if (NF==1) print }’
→ ${ROOTDIR }/ essence_corrected.txt
67 #examples:
#Qs1fa
69 #Qs1fa/v
TMPDIR=${ROOTDIR }/tmp
71 mkdir -p ${TMPDIR}
OUTPUTDIR=${ROOTDIR }/vito
73 mkdir -p ${OUTPUTDIR}
awk ’{ if (NF==1) print $1 }’
→ ${ROOTDIR }/ essence_corrected.txt|while read
→ ORIGSTRING1;do
75 STRING1=$(echo $ORIGSTRING1|sed -e
→ ’s/[jav ]\/./m/g’ -e ’s/\/.// ’)
echo "${STRING1}"|sed
→ ’s/\(.*\) \([1234]\) \([ft]\) \([ javm ]\) /\1 \2 \3
→ \4/’|while read TYPE1 DENSITY1 TRUNK1 STAGE1;do
77 if [ -n "${TYPE1}" -a -n "${DENSITY1}" -a -n
→ "${TRUNK1}" -a -n "${STAGE1}" ];then
for file in $(find ${ROOTDIR} -name
→ ’canton[ABCDE]* _strate.shp’);do
79 output=${TMPDIR }/$(basename $file
→ .shp)_${STRING1 }.shp
pkeditogr -i $file -o $output -an type1 -at
→ String -av ${TYPE1} -an type2 -at String -av NA
→ -an type3 -at String -av NA -an density1 -at
→ Integer -av ${DENSITY1} -an density2 -at Integer
36
Cartographic material on the evolution of forest cover, land uses and climatic conditions of the pilot sites. Show case of the Maamora site, Morocco.
GCP/GLO/440/FRA - Component 1, October 2013

→ -av 0 -an density3 -at Integer -av 0 -an plan1
→ -at Integer -av 0 -an plan2 -at Integer -av 0
→ -an plan3 -at Integer -av 0 -an trunk1 -at
→ String -av ${TRUNK1} -an trunk2 -at String -av
→ NA -an trunk3 -at String -av NA -an stage1 -at
→ String -av ${STAGE1} -an stage2 -at String -av
→ NA -an stage3 -at String -av NA -select ESSENCE
→ -like "$ORIGSTRING1" -st
81 COUNT=$(ogrinfo -so $output $(basename $output
→ .shp) |grep Count|awk -v FS=’:’ ’{print $2}’)
if [ -f ${OUTPUTDIR }/ nfi_mamora.shp ];then
83 ogr2ogr -update -append
→ ${OUTPUTDIR }/ nfi_mamora.shp ${output} -nln
→ nfi_mamora
else
85 ogr2ogr ${OUTPUTDIR }/ nfi_mamora.shp ${output}
fi
87 rm ${TMPDIR }/$(basename $output .shp).*
done
89 echo "processed $ORIGSTRING1"
else
91 echo "Warning: $ORIGSTRING1 not processed due
→ to missing information"
fi
93 done
done
95
echo "process one essence in Regeneration (plan1 =1)"
97 awk ’{ if (NF ==2&&$1=="Rg") print }’
→ ${ROOTDIR }/ essence_corrected.txt
#examples:
99 #Rg A.mo1fj
TMPDIR=${ROOTDIR }/tmp
101 mkdir -p ${TMPDIR}
OUTPUTDIR=${ROOTDIR }/vito
103 mkdir -p ${OUTPUTDIR}
ORIGSTRING=
105 awk ’{ if (NF ==2&&$1=="Rg") print $2 }’
→ ${ROOTDIR }/ essence_corrected.txt|while read
→ ORIGSTRING1;do
STRING1=$(echo $ORIGSTRING1|sed -e
→ ’s/[jav ]\/./m/g’ -e ’s/\/.// ’)
107
echo "${STRING1}"|sed
→ ’s/\(.*\) \([1234]\) \([ft]\) \([ javm ]\) /\1 \2 \3
→ \4/’|while read TYPE1 DENSITY1 TRUNK1 STAGE1;do
37
Cartographic material on the evolution of forest cover, land uses and climatic conditions of the pilot sites. Show case of the Maamora site, Morocco.
GCP/GLO/440/FRA - Component 1, October 2013

109 if [ -n "${TYPE1}" -a -n "${DENSITY1}" -a -n
→ "${TRUNK1}" -a -n "${STAGE1}" ];then
for file in $(find ${ROOTDIR} -name
→ ’canton[ABCDE]* _strate.shp’);do
111 output=${TMPDIR }/$(basename $file
→ .shp)_${STRING1 }.shp
pkeditogr -i $file -o $output -an type1 -at
→ String -av ${TYPE1} -an type2 -at String -av NA
→ -an type3 -at String -av NA -an density1 -at
→ Integer -av ${DENSITY1} -an density2 -at Integer
→ -av 0 -an density3 -at Integer -av 0 -an plan1
→ -at Integer -av 1 -an plan2 -at Integer -av 0
→ -an plan3 -at Integer -av 0 -an trunk1 -at
→ String -av ${TRUNK1} -an trunk2 -at String -av
→ NA -an trunk3 -at String -av NA -an stage1 -at
→ String -av ${STAGE1} -an stage2 -at String -av
→ NA -an stage3 -at String -av NA -select ESSENCE
→ -like "Rg ${ORIGSTRING1}" -st
113 COUNT=$(ogrinfo -so $output $(basename $output
→ .shp) |grep Count|awk -v FS=’:’ ’{print $2}’)
if [ -f ${OUTPUTDIR }/ nfi_mamora.shp ];then
115 ogr2ogr -update -append
→ ${OUTPUTDIR }/ nfi_mamora.shp ${output} -nln
→ nfi_mamora
else
117 ogr2ogr ${OUTPUTDIR }/ nfi_mamora.shp ${output}
fi
119 rm ${TMPDIR }/$(basename $output .shp).*
done
121 echo "processed $ORIGSTRING1"
else
123 echo "Warning: $ORIGSTRING1 not processed due
→ to missing information"
fi
125 done
done
127
echo "process one essence in Regeneration echec
→ (plan=1, stage=e)"
129 awk ’{ if (NF ==3&&$1=="Rg"&&$3==" echec") print }’
→ ${ROOTDIR }/ essence_corrected.txt
#examples:
131 #Rg Qs1fj echec
#Rg Qs echec
133 TMPDIR=${ROOTDIR }/tmp
mkdir -p ${TMPDIR}
38
Cartographic material on the evolution of forest cover, land uses and climatic conditions of the pilot sites. Show case of the Maamora site, Morocco.
GCP/GLO/440/FRA - Component 1, October 2013

135 OUTPUTDIR=${ROOTDIR }/vito
mkdir -p ${OUTPUTDIR}
137 awk ’{ if (NF ==3&&$1=="Rg"&&$3==" echec") print $2 }’
→ ${ROOTDIR }/ essence_corrected.txt|while read
→ ORIGSTRING1;do
STRING1=$(echo $ORIGSTRING1|sed -e
→ ’s/[jav ]\/./m/g’ -e ’s/\/.// ’)
139 echo "${STRING1}"|sed
→ ’s/\(.*\) \([1234]\) \([ft]\) \([ javm ]\) /\1 \2 \3
→ \4/’|while read TYPE1 DENSITY1 TRUNK1 STAGE1;do
if [ -n "${TYPE1}" ];then
141 for file in $(find ${ROOTDIR} -name
→ ’canton[ABCDE]* _strate.shp’);do
output=${TMPDIR }/$(basename $file
→ .shp)_${STRING1 }.shp
143 pkeditogr -i $file -o $output -an type1 -at
→ String -av ${TYPE1} -an type2 -at String -av NA
→ -an type3 -at String -av NA -an density1 -at
→ Integer -av 0 -an density2 -at Integer -av 0 -an
→ density3 -at Integer -av 0 -an plan1 -at Integer
→ -av 1 -an plan2 -at Integer -av 0 -an plan3 -at
→ Integer -av 0 -an trunk1 -at String -av NA -an
→ trunk2 -at String -av NA -an trunk3 -at String
→ -av NA -an stage1 -at String -av e -an stage2
→ -at String -av NA -an stage3 -at String -av NA
→ -select ESSENCE -like "Rg ${ORIGSTRING1} echec"
→ -st
COUNT=$(ogrinfo -so $output $(basename $output
→ .shp) |grep Count|awk -v FS=’:’ ’{print $2}’)
145 if [ -f ${OUTPUTDIR }/ nfi_mamora.shp ];then
ogr2ogr -update -append
→ ${OUTPUTDIR }/ nfi_mamora.shp ${output} -nln
→ nfi_mamora
147 else
ogr2ogr ${OUTPUTDIR }/ nfi_mamora.shp ${output}
149 fi
rm ${TMPDIR }/$(basename $output .shp).*
151 done
echo "processed $ORIGSTRING1"
153 else
echo "Warning: $ORIGSTRING1 not processed due
→ to missing information"
155 fi
done
157 done
39
Cartographic material on the evolution of forest cover, land uses and climatic conditions of the pilot sites. Show case of the Maamora site, Morocco.
GCP/GLO/440/FRA - Component 1, October 2013

159 echo "process one essence in Reboisement (plan1 =2)"
awk ’{ if (NF ==2&&$1=="Rb") print }’
→ ${ROOTDIR }/ essence_corrected.txt
161 #examples:
#Rb Eu.go3tj
163 #Rb Eu.go/ca2ta
#Rb Eu.gr/ca1tj/a
165 #Rb Eu.gr/ca2ta
TMPDIR=${ROOTDIR }/tmp
167 mkdir -p ${TMPDIR}
OUTPUTDIR=${ROOTDIR }/vito
169 mkdir -p ${OUTPUTDIR}
awk ’{ if (NF ==2&&$1=="Rb") print $2 }’
→ ${ROOTDIR }/ essence_corrected.txt|while read
→ ORIGSTRING1;do
171 STRING1=$(echo $ORIGSTRING1|sed -e
→ ’s/[jav ]\/./m/g’ -e ’s/\/.// ’)
173 echo "${STRING1}"|sed
→ ’s/\(.*\) \([1234]\) \([ft]\) \([ javm ]\) /\1 \2 \3
→ \4/’|while read TYPE1 DENSITY1 TRUNK1 STAGE1;do
if [ -n "${TYPE1}" -a -n "${DENSITY1}" -a -n
→ "${TRUNK1}" -a -n "${STAGE1}" ];then
175 for file in $(find ${ROOTDIR} -name
→ ’canton[ABCDE]* _strate.shp’);do
output=${TMPDIR }/$(basename $file
→ .shp)_${STRING1 }.shp
177 pkeditogr -i $file -o $output -an type1 -at
→ String -av ${TYPE1} -an type2 -at String -av NA
→ -an type3 -at String -av NA -an density1 -at
→ Integer -av ${DENSITY1} -an density2 -at Integer
→ -av 0 -an density3 -at Integer -av 0 -an plan1
→ -at Integer -av 2 -an plan2 -at Integer -av 0
→ -an plan3 -at Integer -av 0 -an trunk1 -at
→ String -av ${TRUNK1} -an trunk2 -at String -av
→ NA -an trunk3 -at String -av NA -an stage1 -at
→ String -av ${STAGE1} -an stage2 -at String -av
→ NA -an stage3 -at String -av NA -select ESSENCE
→ -like "Rb ${ORIGSTRING1}" -st
COUNT=$(ogrinfo -so $output $(basename $output
→ .shp) |grep Count|awk -v FS=’:’ ’{print $2}’)
179 if [ -f ${OUTPUTDIR }/ nfi_mamora.shp ];then
ogr2ogr -update -append
→ ${OUTPUTDIR }/ nfi_mamora.shp ${output} -nln
→ nfi_mamora
181 else
40
Cartographic material on the evolution of forest cover, land uses and climatic conditions of the pilot sites. Show case of the Maamora site, Morocco.
GCP/GLO/440/FRA - Component 1, October 2013

ogr2ogr ${OUTPUTDIR }/ nfi_mamora.shp ${output}
183 fi
rm ${TMPDIR }/$(basename $output .shp).*
185 done
echo "processed $ORIGSTRING1"
187 else
echo "Warning: $ORIGSTRING1 not processed due
→ to missing information"
189 fi
done
191 done
193 echo "process one essence in Reboisement echec
→ (plan1=2,stage=e)"
awk ’{ if (NF ==3&&$1=="Rb"&&$3==" echec") print }’
→ ${ROOTDIR }/ essence_corrected.txt
195 #examples:
#Rb P.pa echec
197 TMPDIR=${ROOTDIR }/tmp
mkdir -p ${TMPDIR}
199 OUTPUTDIR=${ROOTDIR }/vito
mkdir -p ${OUTPUTDIR}
201 awk ’{ if (NF ==3&&$1=="Rb"&&$3==" echec") print $2 }’
→ ${ROOTDIR }/ essence_corrected.txt|while read
→ ORIGSTRING1;do
STRING1=$(echo $ORIGSTRING1|sed -e
→ ’s/[jav ]\/./m/g’ -e ’s/\/.// ’)
203
echo "${STRING1}"|sed
→ ’s/\(.*\) \([1234]\) \([ft]\) \([ javm ]\) /\1 \2 \3
→ \4/’|while read TYPE1 DENSITY1 TRUNK1 STAGE1;do
205 if [ -n "${TYPE1}" ];then
for file in $(find ${ROOTDIR} -name
→ ’canton[ABCDE]* _strate.shp’);do
207 output=${TMPDIR }/$(basename $file
→ .shp)_${STRING1 }.shp
pkeditogr -i $file -o $output -an type1 -at
→ String -av ${TYPE1} -an type2 -at String -av NA
→ -an type3 -at String -av NA -an density1 -at
→ Integer -av 0 -an density2 -at Integer -av 0 -an
→ density3 -at Integer -av 0 -an plan1 -at Integer
→ -av 2 -an plan2 -at Integer -av 0 -an plan3 -at
→ Integer -av 0 -an trunk1 -at String -av NA -an
→ trunk2 -at String -av NA -an trunk3 -at String
→ -av NA -an stage1 -at String -av e -an stage2
→ -at String -av NA -an stage3 -at String -av NA
41
Cartographic material on the evolution of forest cover, land uses and climatic conditions of the pilot sites. Show case of the Maamora site, Morocco.
GCP/GLO/440/FRA - Component 1, October 2013

→ -select ESSENCE -like "Rb ${ORIGSTRING1} echec"
→ -st
209 COUNT=$(ogrinfo -so $output $(basename $output
→ .shp) |grep Count|awk -v FS=’:’ ’{print $2}’)
if [ -f ${OUTPUTDIR }/ nfi_mamora.shp ];then
211 ogr2ogr -update -append
→ ${OUTPUTDIR }/ nfi_mamora.shp ${output} -nln
→ nfi_mamora
else
213 ogr2ogr ${OUTPUTDIR }/ nfi_mamora.shp ${output}
fi
215 rm ${TMPDIR }/$(basename $output .shp).*
done
217 echo "processed $ORIGSTRING1"
else
219 echo "Warning: $ORIGSTRING1 not processed due
→ to missing information"
fi
221 done
done
223
echo "process two essences"
225 awk ’{ if (NF ==2&&$1!="Rg"&&$1!="Rb") print }’
→ ${ROOTDIR }/ essence_corrected.txt
#examples:
227 #Qs1fa/v Pcm4fa
#Qs2fa Qs3fv
229 TMPDIR=${ROOTDIR }/tmp
mkdir -p ${TMPDIR}
231 OUTPUTDIR=${ROOTDIR }/vito
mkdir -p ${OUTPUTDIR}
233 awk ’{ if (NF ==2&&$1!="Rg"&&$1!="Rb") print $1 ,$2}’
→ ${ROOTDIR }/ essence_corrected.txt|while read
→ ORIGSTRING1 ORIGSTRING2;do
STRING1=$(echo $ORIGSTRING1|sed -e
→ ’s/[jav ]\/./m/g’ -e ’s/\/.// ’)
235 STRING2=$(echo $ORIGSTRING2|sed -e
→ ’s/[jav ]\/./m/g’ -e ’s/\/.// ’)
237 echo "${STRING1} ${STRING2}"|sed
→ ’s/\(.*\) \([1234]\) \([ft]\) \([ javm ]\)
→ \(.*\) \([1234]\) \([ft]\) \([ javm ]\) /\1 \2 \3 \4
→ \5 \6 \7 \8/’|while read TYPE1 DENSITY1 TRUNK1
→ STAGE1 TYPE2 DENSITY2 TRUNK2 STAGE2;do
if [ -n "${TYPE1}" -a -n "${DENSITY1}" -a -n
→ "${TRUNK1}" -a -n "${STAGE1}" -a -n "${TYPE2}"
42
Cartographic material on the evolution of forest cover, land uses and climatic conditions of the pilot sites. Show case of the Maamora site, Morocco.
GCP/GLO/440/FRA - Component 1, October 2013

→ -a -n "${DENSITY2}" -a -n "${TRUNK2}" -a -n
→ "${STAGE2}" ];then
239 for file in $(find ${ROOTDIR} -name
→ ’canton[ABCDE]* _strate.shp’);do
output=${TMPDIR }/$(basename $file
→ .shp)_${STRING1}_${STRING2 }.shp
241 pkeditogr -i $file -o $output -an type1 -at
→ String -av ${TYPE1} -an type2 -at String -av
→ ${TYPE2} -an type3 -at String -av NA -an
→ density1 -at Integer -av ${DENSITY1} -an
→ density2 -at Integer -av ${DENSITY2} -an
→ density3 -at Integer -av 0 -an plan1 -at Integer
→ -av 0 -an plan2 -at Integer -av 0 -an plan3 -at
→ Integer -av 0 -an trunk1 -at String -av
→ ${TRUNK1} -an trunk2 -at String -av ${TRUNK2}
→ -an trunk3 -at String -av NA -an stage1 -at
→ String -av ${STAGE1} -an stage2 -at String -av
→ ${STAGE2} -an stage3 -at String -av NA -select
→ ESSENCE -like "${ORIGSTRING1} ${ORIGSTRING2}" -st
COUNT=$(ogrinfo -so $output $(basename $output
→ .shp) |grep Count|awk -v FS=’:’ ’{print $2}’)
243 if [ -f ${OUTPUTDIR }/ nfi_mamora.shp ];then
ogr2ogr -update -append
→ ${OUTPUTDIR }/ nfi_mamora.shp ${output} -nln
→ nfi_mamora
245 else
ogr2ogr ${OUTPUTDIR }/ nfi_mamora.shp ${output}
247 fi
rm ${TMPDIR }/$(basename $output .shp).*
249 done
echo "processed $ORIGSTRING1 $ORIGSTRING2"
251 else
echo "Warning: $ORIGSTRING1 $ORIGSTRING2 not
→ processed due to missing information"
253 fi
done
255 done
257 echo "process two essence in Regeneration (plan1 =1)"
awk ’{ if (NF ==3&&$1=="Rg"&&$3!=" echec") print }’
→ ${ROOTDIR }/ essence_corrected.txt
259 #examples:
#Rg Qs1fj/a Qs3fv
261 #Rg Qs1fj Qs3fv/a
TMPDIR=${ROOTDIR }/tmp
263 mkdir -p ${TMPDIR}
43
Cartographic material on the evolution of forest cover, land uses and climatic conditions of the pilot sites. Show case of the Maamora site, Morocco.
GCP/GLO/440/FRA - Component 1, October 2013

OUTPUTDIR=${ROOTDIR }/vito
265 mkdir -p ${OUTPUTDIR}
awk ’{ if (NF ==3&&$1=="Rg"&&$3!=" echec") print $2 ,$3
→ }’ ${ROOTDIR }/ essence_corrected.txt|while read
→ ORIGSTRING1 ORIGSTRING2;do
267 STRING1=$(echo $ORIGSTRING1|sed -e
→ ’s/[jav ]\/./m/g’ -e ’s/\/.// ’)
STRING2=$(echo $ORIGSTRING2|sed -e
→ ’s/[jav ]\/./m/g’ -e ’s/\/.// ’)
269
echo "${STRING1} ${STRING2}"|sed
→ ’s/\(.*\) \([1234]\) \([ft]\) \([ javm ]\)
→ \(.*\) \([1234]\) \([ft]\) \([ javm ]\) /\1 \2 \3 \4
→ \5 \6 \7 \8/’|while read TYPE1 DENSITY1 TRUNK1
→ STAGE1 TYPE2 DENSITY2 TRUNK2 STAGE2;do
271 if [ -n "${TYPE1}" -a -n "${DENSITY1}" -a -n
→ "${TRUNK1}" -a -n "${STAGE1}" -a -n "${TYPE2}"
→ -a -n "${DENSITY2}" -a -n "${TRUNK2}" -a -n
→ "${STAGE2}" ];then
for file in $(find ${ROOTDIR} -name
→ ’canton[ABCDE]* _strate.shp’);do
273 output=${TMPDIR }/$(basename $file
→ .shp)_${STRING1}_${STRING2 }.shp
pkeditogr -i $file -o $output -an type1 -at
→ String -av ${TYPE1} -an type2 -at String -av
→ ${TYPE2} -an type3 -at String -av NA -an
→ density1 -at Integer -av ${DENSITY1} -an
→ density2 -at Integer -av ${DENSITY2} -an
→ density3 -at Integer -av 0 -an plan1 -at Integer
→ -av 1 -an plan2 -at Integer -av 0 -an plan3 -at
→ Integer -av 0 -an trunk1 -at String -av
→ ${TRUNK1} -an trunk2 -at String -av ${TRUNK2}
→ -an trunk3 -at String -av NA -an stage1 -at
→ String -av ${STAGE1} -an stage2 -at String -av
→ ${STAGE2} -an stage3 -at String -av NA -select
→ ESSENCE -like "Rg ${ORIGSTRING1} ${ORIGSTRING2}"
→ -st
275 COUNT=$(ogrinfo -so $output $(basename $output
→ .shp) |grep Count|awk -v FS=’:’ ’{print $2}’)
if [ -f ${OUTPUTDIR }/ nfi_mamora.shp ];then
277 ogr2ogr -update -append
→ ${OUTPUTDIR }/ nfi_mamora.shp ${output} -nln
→ nfi_mamora
else
279 ogr2ogr ${OUTPUTDIR }/ nfi_mamora.shp ${output}
fi
44
Cartographic material on the evolution of forest cover, land uses and climatic conditions of the pilot sites. Show case of the Maamora site, Morocco.
GCP/GLO/440/FRA - Component 1, October 2013
281 rm ${TMPDIR }/$(basename $output .shp).*
done
283 echo "processed $ORIGSTRING1 $ORIGSTRING2"
else
285 echo "Warning: $ORIGSTRING1 $ORIGSTRING2 not
→ processed due to missing information"
fi
287 done
done
289
echo "process two essence in Regeneration (plan2 =1)"
291 awk ’{ if (NF ==3&&$2=="Rg") print }’
→ ${ROOTDIR }/ essence_corrected.txt
#examples:
293 #Qs3fv Rg Qs1fj
TMPDIR=${ROOTDIR }/tmp
295 mkdir -p ${TMPDIR}
OUTPUTDIR=${ROOTDIR }/vito
297 mkdir -p ${OUTPUTDIR}
awk ’{ if (NF ==3&&$2=="Rg") print $1 ,$3 }’
→ ${ROOTDIR }/ essence_corrected.txt|while read
→ ORIGSTRING1 ORIGSTRING2;do
299 STRING1=$(echo $ORIGSTRING1|sed -e
→ ’s/[jav ]\/./m/g’ -e ’s/\/.// ’)
STRING2=$(echo $ORIGSTRING2|sed -e
→ ’s/[jav ]\/./m/g’ -e ’s/\/.// ’)
301
echo "${STRING1} ${STRING2}"|sed
→ ’s/\(.*\) \([1234]\) \([ft]\) \([ javm ]\)
→ \(.*\) \([1234]\) \([ft]\) \([ javm ]\) /\1 \2 \3 \4
→ \5 \6 \7 \8/’|while read TYPE1 DENSITY1 TRUNK1
→ STAGE1 TYPE2 DENSITY2 TRUNK2 STAGE2;do
303 if [ -n "${TYPE1}" -a -n "${DENSITY1}" -a -n
→ "${TRUNK1}" -a -n "${STAGE1}" -a -n "${TYPE2}"
→ -a -n "${DENSITY2}" -a -n "${TRUNK2}" -a -n
→ "${STAGE2}" ];then
for file in $(find ${ROOTDIR} -name
→ ’canton[ABCDE]* _strate.shp’);do
305 output=${TMPDIR }/$(basename $file
→ .shp)_${STRING1}_${STRING2 }.shp
pkeditogr -i $file -o $output -an type1 -at
→ String -av ${TYPE1} -an type2 -at String -av
→ ${TYPE2} -an type3 -at String -av NA -an
→ density1 -at Integer -av ${DENSITY1} -an
→ density2 -at Integer -av ${DENSITY2} -an
→ density3 -at Integer -av 0 -an plan1 -at Integer
45
Cartographic material on the evolution of forest cover, land uses and climatic conditions of the pilot sites. Show case of the Maamora site, Morocco.
GCP/GLO/440/FRA - Component 1, October 2013

→ -av 0 -an plan2 -at Integer -av 1 -an plan3 -at
→ Integer -av 0 -an trunk1 -at String -av
→ ${TRUNK1} -an trunk2 -at String -av ${TRUNK2}
→ -an trunk3 -at String -av NA -an stage1 -at
→ String -av ${STAGE1} -an stage2 -at String -av
→ ${STAGE2} -an stage3 -at String -av NA -select
→ ESSENCE -like "${ORIGSTRING1} Rg ${ORIGSTRING2}"
→ -st
307 COUNT=$(ogrinfo -so $output $(basename $output
→ .shp) |grep Count|awk -v FS=’:’ ’{print $2}’)
if [ -f ${OUTPUTDIR }/ nfi_mamora.shp ];then
309 ogr2ogr -update -append
→ ${OUTPUTDIR }/ nfi_mamora.shp ${output} -nln
→ nfi_mamora
else
311 ogr2ogr ${OUTPUTDIR }/ nfi_mamora.shp ${output}
fi
313 rm ${TMPDIR }/$(basename $output .shp).*
done
315 echo "processed $ORIGSTRING1 $ORIGSTRING2"
else
317 echo "Warning: $ORIGSTRING1 $ORIGSTRING2 not
→ processed due to missing information"
fi
319 done
done
321
echo "process two essence in Reboisement (plan1 =2)"
323 awk ’{ if (NF ==3&&$1=="Rb"&&$3!=" echec") print }’
→ ${ROOTDIR }/ essence_corrected.txt
#examples:
325 #Rb Eu.ca1fa Eu.si1fa
#Rb P.pa1fj/a Qs3fv
327 #Rb P.pa3fj Es
TMPDIR=${ROOTDIR }/tmp
329 mkdir -p ${TMPDIR}
OUTPUTDIR=${ROOTDIR }/vito
331 mkdir -p ${OUTPUTDIR}
awk ’{ if (NF ==3&&$1=="Rb"&&$3!=" echec") print $2 ,$3
→ }’ ${ROOTDIR }/ essence_corrected.txt|while read
→ ORIGSTRING1 ORIGSTRING2;do
333 STRING1=$(echo $ORIGSTRING1|sed -e
→ ’s/[jav ]\/./m/g’ -e ’s/\/.// ’)
STRING2=$(echo $ORIGSTRING2|sed -e
→ ’s/[jav ]\/./m/g’ -e ’s/\/.// ’)
335
46
Cartographic material on the evolution of forest cover, land uses and climatic conditions of the pilot sites. Show case of the Maamora site, Morocco.
GCP/GLO/440/FRA - Component 1, October 2013

echo "${STRING1} ${STRING2}"|sed
→ ’s/\(.*\) \([1234]\) \([ft]\) \([ javm ]\)
→ \(.*\) \([1234]\) \([ft]\) \([ javm ]\) /\1 \2 \3 \4
→ \5 \6 \7 \8/’|while read TYPE1 DENSITY1 TRUNK1
→ STAGE1 TYPE2 DENSITY2 TRUNK2 STAGE2;do
337 if [ -n "${TYPE1}" -a -n "${DENSITY1}" -a -n
→ "${TRUNK1}" -a -n "${STAGE1}" -a -n "${TYPE2}"
→ -a -n "${DENSITY2}" -a -n "${TRUNK2}" -a -n
→ "${STAGE2}" ];then
for file in $(find ${ROOTDIR} -name
→ ’canton[ABCDE]* _strate.shp’);do
339 output=${TMPDIR }/$(basename $file
→ .shp)_${STRING1}_${STRING2 }.shp
pkeditogr -i $file -o $output -an type1 -at
→ String -av ${TYPE1} -an type2 -at String -av
→ ${TYPE2} -an type3 -at String -av NA -an
→ density1 -at Integer -av ${DENSITY1} -an
→ density2 -at Integer -av ${DENSITY2} -an
→ density3 -at Integer -av 0 -an plan1 -at Integer
→ -av 2 -an plan2 -at Integer -av 0 -an plan3 -at
→ Integer -av 0 -an trunk1 -at String -av
→ ${TRUNK1} -an trunk2 -at String -av ${TRUNK2}
→ -an trunk3 -at String -av NA -an stage1 -at
→ String -av ${STAGE1} -an stage2 -at String -av
→ ${STAGE2} -an stage3 -at String -av NA -select
→ ESSENCE -like "Rb ${ORIGSTRING1} ${ORIGSTRING2}"
→ -st
341 COUNT=$(ogrinfo -so $output $(basename $output
→ .shp) |grep Count|awk -v FS=’:’ ’{print $2}’)
if [ -f ${OUTPUTDIR }/ nfi_mamora.shp ];then
343 ogr2ogr -update -append
→ ${OUTPUTDIR }/ nfi_mamora.shp ${output} -nln
→ nfi_mamora
else
345 ogr2ogr ${OUTPUTDIR }/ nfi_mamora.shp ${output}
fi
347 rm ${TMPDIR }/$(basename $output .shp).*
done
349 echo "processed $ORIGSTRING1 $ORIGSTRING2"
else
351 echo "Warning: $ORIGSTRING1 $ORIGSTRING2 not
→ processed due to missing information"
fi
353 done
done
355
47
Cartographic material on the evolution of forest cover, land uses and climatic conditions of the pilot sites. Show case of the Maamora site, Morocco.
GCP/GLO/440/FRA - Component 1, October 2013

echo "process two essence in Reboisement (plan2 =2)"
357 awk ’{ if (NF ==3&&$2=="Rb") print }’
→ ${ROOTDIR }/ essence_corrected.txt
#examples:
359 #Qs2fv Rb A.mo2fj
TMPDIR=${ROOTDIR }/tmp
361 mkdir -p ${TMPDIR}
OUTPUTDIR=${ROOTDIR }/vito
363 mkdir -p ${OUTPUTDIR}
awk ’{ if (NF ==3&&$2=="Rb") print $1 ,$3 }’
→ ${ROOTDIR }/ essence_corrected.txt|while read
→ ORIGSTRING1 ORIGSTRING2;do
365 STRING1=$(echo $ORIGSTRING1|sed -e
→ ’s/[jav ]\/./m/g’ -e ’s/\/.// ’)
STRING2=$(echo $ORIGSTRING2|sed -e
→ ’s/[jav ]\/./m/g’ -e ’s/\/.// ’)
367
echo "${STRING1} ${STRING2}"|sed
→ ’s/\(.*\) \([1234]\) \([ft]\) \([ javm ]\)
→ \(.*\) \([1234]\) \([ft]\) \([ javm ]\) /\1 \2 \3 \4
→ \5 \6 \7 \8/’|while read TYPE1 DENSITY1 TRUNK1
→ STAGE1 TYPE2 DENSITY2 TRUNK2 STAGE2;do
369 if [ -n "${TYPE1}" -a -n "${DENSITY1}" -a -n
→ "${TRUNK1}" -a -n "${STAGE1}" -a -n "${TYPE2}"
→ -a -n "${DENSITY2}" -a -n "${TRUNK2}" -a -n
→ "${STAGE2}" ];then
for file in $(find ${ROOTDIR} -name
→ ’canton[ABCDE]* _strate.shp’);do
371 output=${TMPDIR }/$(basename $file
→ .shp)_${STRING1}_${STRING2 }.shp
pkeditogr -i $file -o $output -an type1 -at
→ String -av ${TYPE1} -an type2 -at String -av
→ ${TYPE2} -an type3 -at String -av NA -an
→ density1 -at Integer -av ${DENSITY1} -an
→ density2 -at Integer -av ${DENSITY2} -an
→ density3 -at Integer -av 0 -an plan1 -at Integer
→ -av 0 -an plan2 -at Integer -av 2 -an plan3 -at
→ Integer -av 0 -an trunk1 -at String -av
→ ${TRUNK1} -an trunk2 -at String -av ${TRUNK2}
→ -an trunk3 -at String -av NA -an stage1 -at
→ String -av ${STAGE1} -an stage2 -at String -av
→ ${STAGE2} -an stage3 -at String -av NA -select
→ ESSENCE -like "${ORIGSTRING1} Rb ${ORIGSTRING2}"
→ -st
373 COUNT=$(ogrinfo -so $output $(basename $output
→ .shp) |grep Count|awk -v FS=’:’ ’{print $2}’)
48
Cartographic material on the evolution of forest cover, land uses and climatic conditions of the pilot sites. Show case of the Maamora site, Morocco.
GCP/GLO/440/FRA - Component 1, October 2013

if [ -f ${OUTPUTDIR }/ nfi_mamora.shp ];then
375 ogr2ogr -update -append
→ ${OUTPUTDIR }/ nfi_mamora.shp ${output} -nln
→ nfi_mamora
else
377 ogr2ogr ${OUTPUTDIR }/ nfi_mamora.shp ${output}
fi
379 rm ${TMPDIR }/$(basename $output .shp).*
done
381 echo "processed $ORIGSTRING1 $ORIGSTRING2"
else
383 echo "Warning: $ORIGSTRING1 $ORIGSTRING2 not
→ processed due to missing information"
fi
385 done
done
387
echo "process two essence in Regeneration"
389 awk ’{ if (NF ==4&&$1=="Rg"&&$3=="Rg") print }’
→ ${ROOTDIR }/ essence_corrected.txt
#examples:
391 #(empty)
393 echo "process two essence in Reboisement
→ (plan1=2,plan2 =2)"
awk ’{ if (NF ==4&&$1=="Rb"&&$3=="Rb") print }’
→ ${ROOTDIR }/ essence_corrected.txt
395 OUTPUTDIR=${ROOTDIR }/vito
mkdir -p ${OUTPUTDIR}
397 TMPDIR=${ROOTDIR }/tmp
mkdir -p ${TMPDIR}
399 #examples:
#Rb A.cy2fa Rb Eu.ca3fa
401 awk ’{ if (NF ==4&&$1=="Rb"&&$3=="Rb") print $2 ,$4 }’
→ ${ROOTDIR }/ essence_corrected.txt|while read
→ ORIGSTRING1 ORIGSTRING2;do
STRING1=$(echo $ORIGSTRING1|sed -e
→ ’s/[jav ]\/./m/g’ -e ’s/\/.// ’)
403 STRING2=$(echo $ORIGSTRING2|sed -e
→ ’s/[jav ]\/./m/g’ -e ’s/\/.// ’)
405 echo "${STRING1} ${STRING2}"|sed
→ ’s/\(.*\) \([1234]\) \([ft]\) \([ javm ]\)
→ \(.*\) \([1234]\) \([ft]\) \([ javm ]\) /\1 \2 \3 \4
→ \5 \6 \7 \8/’|while read TYPE1 DENSITY1 TRUNK1
→ STAGE1 TYPE2 DENSITY2 TRUNK2 STAGE2;do
49
Cartographic material on the evolution of forest cover, land uses and climatic conditions of the pilot sites. Show case of the Maamora site, Morocco.
GCP/GLO/440/FRA - Component 1, October 2013

if [ -n "${TYPE1}" -a -n "${DENSITY1}" -a -n
→ "${TRUNK1}" -a -n "${STAGE1}" -a -n "${TYPE2}"
→ -a -n "${DENSITY2}" -a -n "${TRUNK2}" -a -n
→ "${STAGE2}" ];then
407 for file in $(find ${ROOTDIR} -name
→ ’canton[ABCDE]* _strate.shp’);do
output=${TMPDIR }/$(basename $file
→ .shp)_${STRING1}_${STRING2 }.shp
409 pkeditogr -i $file -o $output -an type1 -at
→ String -av ${TYPE1} -an type2 -at String -av
→ ${TYPE2} -an type3 -at String -av NA -an
→ density1 -at Integer -av ${DENSITY1} -an
→ density2 -at Integer -av ${DENSITY2} -an
→ density3 -at Integer -av 0 -an plan1 -at Integer
→ -av 2 -an plan2 -at Integer -av 2 -an plan3 -at
→ Integer -av 0 -an trunk1 -at String -av
→ ${TRUNK1} -an trunk2 -at String -av ${TRUNK2}
→ -an trunk3 -at String -av NA -an stage1 -at
→ String -av ${STAGE1} -an stage2 -at String -av
→ ${STAGE2} -an stage3 -at String -av NA -select
→ ESSENCE -like "Rb ${ORIGSTRING1} Rb
→ ${ORIGSTRING2}" -st
COUNT=$(ogrinfo -so $output $(basename $output
→ .shp) |grep Count|awk -v FS=’:’ ’{print $2}’)
411 if [ -f ${OUTPUTDIR }/ nfi_mamora.shp ];then
ogr2ogr -update -append
→ ${OUTPUTDIR }/ nfi_mamora.shp ${output} -nln
→ nfi_mamora
413 else
ogr2ogr ${OUTPUTDIR }/ nfi_mamora.shp ${output}
415 fi
rm ${TMPDIR }/$(basename $output .shp).*
417 done
echo "processed $ORIGSTRING1 $ORIGSTRING2"
419 else
echo "Warning: $ORIGSTRING1 $ORIGSTRING2 not
→ processed due to missing information"
421 fi
done
423 done
425 echo "process two essences in Regeneration and
→ Reboisement (plan1=1,plan2 =2)"
awk ’{ if (NF ==4&&$1=="Rg"&&$3=="Rb") print }’
→ ${ROOTDIR }/ essence_corrected.txt
427 TMPDIR=${ROOTDIR }/tmp
50
Cartographic material on the evolution of forest cover, land uses and climatic conditions of the pilot sites. Show case of the Maamora site, Morocco.
GCP/GLO/440/FRA - Component 1, October 2013

mkdir -p ${TMPDIR}
429 OUTPUTDIR=${ROOTDIR }/vito
mkdir -p ${OUTPUTDIR}
431 echo "process two essences in Regeneration and
→ Reboisement (plan1=1,plan2 =2)"
awk ’{ if (NF ==4&&$1=="Rg"&&$3=="Rb") print }’
→ ${ROOTDIR }/ essence_corrected.txt
433 #examples:
#Rg Qs2fj Rb P.pa3fj
435 awk ’{ if (NF ==4&&$1=="Rg"&&$3=="Rb") print $2 ,$4 }’
→ ${ROOTDIR }/ essence_corrected.txt|while read
→ ORIGSTRING1 ORIGSTRING2;do
STRING1=$(echo $ORIGSTRING1|sed -e
→ ’s/[jav ]\/./m/g’ -e ’s/\/.// ’)
437 STRING2=$(echo $ORIGSTRING2|sed -e
→ ’s/[jav ]\/./m/g’ -e ’s/\/.// ’)
439 echo "${STRING1} ${STRING2}"|sed
→ ’s/\(.*\) \([1234]\) \([ft]\) \([ javm ]\)
→ \(.*\) \([1234]\) \([ft]\) \([ javm ]\) /\1 \2 \3 \4
→ \5 \6 \7 \8/’|while read TYPE1 DENSITY1 TRUNK1
→ STAGE1 TYPE2 DENSITY2 TRUNK2 STAGE2;do
if [ -n "${TYPE1}" -a -n "${DENSITY1}" -a -n
→ "${TRUNK1}" -a -n "${STAGE1}" -a -n "${TYPE2}"
→ -a -n "${DENSITY2}" -a -n "${TRUNK2}" -a -n
→ "${STAGE2}" ];then
441 for file in $(find ${ROOTDIR} -name
→ ’canton[ABCDE]* _strate.shp’);do
output=${TMPDIR }/$(basename $file
→ .shp)_${STRING1}_${STRING2 }.shp
443 pkeditogr -i $file -o $output -an type1 -at
→ String -av ${TYPE1} -an type2 -at String -av
→ ${TYPE2} -an type3 -at String -av NA -an
→ density1 -at Integer -av ${DENSITY1} -an
→ density2 -at Integer -av ${DENSITY2} -an
→ density3 -at Integer -av 0 -an plan1 -at Integer
→ -av 1 -an plan2 -at Integer -av 2 -an plan3 -at
→ Integer -av 0 -an trunk1 -at String -av
→ ${TRUNK1} -an trunk2 -at String -av ${TRUNK2}
→ -an trunk3 -at String -av NA -an stage1 -at
→ String -av ${STAGE1} -an stage2 -at String -av
→ ${STAGE2} -an stage3 -at String -av NA -select
→ ESSENCE -like "Rg ${ORIGSTRING1} Rb
→ ${ORIGSTRING2}" -st
COUNT=$(ogrinfo -so $output $(basename $output
→ .shp) |grep Count|awk -v FS=’:’ ’{print $2}’)
51
Cartographic material on the evolution of forest cover, land uses and climatic conditions of the pilot sites. Show case of the Maamora site, Morocco.
GCP/GLO/440/FRA - Component 1, October 2013

445 if [ -f ${OUTPUTDIR }/ nfi_mamora.shp ];then
ogr2ogr -update -append
→ ${OUTPUTDIR }/ nfi_mamora.shp ${output} -nln
→ nfi_mamora
447 else
ogr2ogr ${OUTPUTDIR }/ nfi_mamora.shp ${output}
449 fi
rm ${TMPDIR }/$(basename $output .shp).*
451 done
echo "processed $ORIGSTRING1 $ORIGSTRING2"
453 else
echo "Warning: $ORIGSTRING1 $ORIGSTRING2 not
→ processed due to missing information"
455 fi
done
457 done
459 echo "process two essence in Regeneration echec
→ (plan2=1, stage2=e)"
awk ’{ if (NF ==4&&$2=="Rg"&&$4==" echec") print }’
→ ${ROOTDIR }/ essence_corrected.txt
461 #examples:
#Qs3fa/v Rg Qs echec
463 TMPDIR=${ROOTDIR }/tmp
mkdir -p ${TMPDIR}
465 OUTPUTDIR=${ROOTDIR }/vito
mkdir -p ${OUTPUTDIR}
467 awk ’{ if (NF ==4&&$2=="Rg"&&$4==" echec") print $1 ,$3
→ }’ ${ROOTDIR }/ essence_corrected.txt|while read
→ ORIGSTRING1 ORIGSTRING2;do
STRING1=$(echo $ORIGSTRING1|sed -e
→ ’s/[jav ]\/./m/g’ -e ’s/\/.// ’)
469 STRING2=$(echo $ORIGSTRING2|sed -e
→ ’s/[jav ]\/./m/g’ -e ’s/\/.// ’)
471 echo "${STRING1} ${STRING2}"|sed
→ ’s/\(.*\) \([1234]\) \([ft]\) \([ javm ]\) \(.*\) /\1
→ \2 \3 \4 \5/’|while read TYPE1 DENSITY1 TRUNK1
→ STAGE1 TYPE2;do
if [ -n "${TYPE1}" -a -n "${DENSITY1}" -a -n
→ "${TRUNK1}" -a -n "${STAGE1}" -a -n "${TYPE2}"
→ ];then
473 for file in $(find ${ROOTDIR} -name
→ ’canton[ABCDE]* _strate.shp’);do
output=${TMPDIR }/$(basename $file
→ .shp)_${STRING1}_${STRING2 }.shp
52
Cartographic material on the evolution of forest cover, land uses and climatic conditions of the pilot sites. Show case of the Maamora site, Morocco.
GCP/GLO/440/FRA - Component 1, October 2013

475 pkeditogr -i $file -o $output -an type1 -at
→ String -av ${TYPE1} -an type2 -at String -av
→ ${TYPE2} -an type3 -at String -av NA -an
→ density1 -at Integer -av ${DENSITY1} -an
→ density2 -at Integer -av 0 -an density3 -at
→ Integer -av 0 -an plan1 -at Integer -av 0 -an
→ plan2 -at Integer -av 1 -an plan3 -at Integer
→ -av 0 -an trunk1 -at String -av ${TRUNK1} -an
→ trunk2 -at String -av NA -an trunk3 -at String
→ -av NA -an stage1 -at String -av ${STAGE1} -an
→ stage2 -at String -av e -an stage3 -at String
→ -av NA -select ESSENCE -like "${ORIGSTRING1} Rg
→ $ORIGSTRING2 echec" -st
COUNT=$(ogrinfo -so $output $(basename $output
→ .shp) |grep Count|awk -v FS=’:’ ’{print $2}’)
477 if [ -f ${OUTPUTDIR }/ nfi_mamora.shp ];then
ogr2ogr -update -append
→ ${OUTPUTDIR }/ nfi_mamora.shp ${output} -nln
→ nfi_mamora
479 else
ogr2ogr ${OUTPUTDIR }/ nfi_mamora.shp ${output}
481 fi
rm ${TMPDIR }/$(basename $output .shp).*
483 done
echo "processed $ORIGSTRING1 $ORIGSTRING2"
485 else
echo "Warning: $ORIGSTRING1 $ORIGSTRING2 not
→ processed due to missing information"
487 echo "Type1: ${TYPE1}, Density1: ${DENSITY1},
→ Trunk1: ${TRUNK1}, Stage1: ${STAGE1}, Type2:
→ ${TYPE2}" ];
fi
489 done
done
491
echo "process two essence in Reboisement echec
→ (plan2=2, stage2=e)"
493 awk ’{ if (NF ==4&&$2=="Rb"&&$4==" echec") print }’
→ ${ROOTDIR }/ essence_corrected.txt
#examples:
495 #Qs2fv Rb A.mo echec
TMPDIR=${ROOTDIR }/tmp
497 mkdir -p ${TMPDIR}
OUTPUTDIR=${ROOTDIR }/vito
499 mkdir -p ${OUTPUTDIR}
awk ’{ if (NF ==4&&$2=="Rb"&&$4==" echec") print $1 ,$3
53
Cartographic material on the evolution of forest cover, land uses and climatic conditions of the pilot sites. Show case of the Maamora site, Morocco.
GCP/GLO/440/FRA - Component 1, October 2013

→ }’ ${ROOTDIR }/ essence_corrected.txt|while read
→ ORIGSTRING1 ORIGSTRING2;do
501 STRING1=$(echo $ORIGSTRING1|sed -e
→ ’s/[jav ]\/./m/g’ -e ’s/\/.// ’)
STRING2=$(echo $ORIGSTRING2|sed -e
→ ’s/[jav ]\/./m/g’ -e ’s/\/.// ’)
503
echo "${STRING1} ${STRING2}"|sed
→ ’s/\(.*\) \([1234]\) \([ft]\) \([ javm ]\) \(.*\) /\1
→ \2 \3 \4 \5/’|while read TYPE1 DENSITY1 TRUNK1
→ STAGE1 TYPE2;do
505 if [ -n "${TYPE1}" -a -n "${DENSITY1}" -a -n
→ "${TRUNK1}" -a -n "${STAGE1}" -a -n "${TYPE2}"
→ ];then
for file in $(find ${ROOTDIR} -name
→ ’canton[ABCDE]* _strate.shp’);do
507 output=${TMPDIR }/$(basename $file
→ .shp)_${STRING1}_${STRING2 }.shp
pkeditogr -i $file -o $output -an type1 -at
→ String -av ${TYPE1} -an type2 -at String -av
→ ${TYPE2} -an type3 -at String -av NA -an
→ density1 -at Integer -av ${DENSITY1} -an
→ density2 -at Integer -av 0 -an density3 -at
→ Integer -av 0 -an plan1 -at Integer -av 0 -an
→ plan2 -at Integer -av 2 -an plan3 -at Integer
→ -av 0 -an trunk1 -at String -av ${TRUNK1} -an
→ trunk2 -at String -av NA -an trunk3 -at String
→ -av NA -an stage1 -at String -av ${STAGE1} -an
→ stage2 -at String -av e -an stage3 -at String
→ -av NA -select ESSENCE -like "${ORIGSTRING1} Rb
→ ${ORIGSTRING2} echec" -st
509 COUNT=$(ogrinfo -so $output $(basename $output
→ .shp) |grep Count|awk -v FS=’:’ ’{print $2}’)
if [ -f ${OUTPUTDIR }/ nfi_mamora.shp ];then
511 ogr2ogr -update -append
→ ${OUTPUTDIR }/ nfi_mamora.shp ${output} -nln
→ nfi_mamora
else
513 ogr2ogr ${OUTPUTDIR }/ nfi_mamora.shp ${output}
fi
515 rm ${TMPDIR }/$(basename $output .shp).*
done
517 echo "processed $ORIGSTRING1 $ORIGSTRING2"
else
519 echo "Warning: $ORIGSTRING1 $ORIGSTRING2 not
→ processed due to missing information"
54
Cartographic material on the evolution of forest cover, land uses and climatic conditions of the pilot sites. Show case of the Maamora site, Morocco.
GCP/GLO/440/FRA - Component 1, October 2013

echo "Type1: ${TYPE1}, Density1: ${DENSITY1},
→ Trunk1: ${TRUNK1}, Stage1: ${STAGE1}, Type2:
→ ${TYPE2}" ];
521 fi
done
523 done
525 echo "process three essences (always with
→ Regeneration or Reboisement)"
527 echo "process three essences in Regeneration"
awk ’{ if (NF ==4&&$3=="Rg") print }’
→ ${ROOTDIR }/ essence_corrected.txt
529 #examples:
#Qs2fv Pcm3fv Rg Qs4fj
531 TMPDIR=${ROOTDIR }/tmp
mkdir -p ${TMPDIR}
533 OUTPUTDIR=${ROOTDIR }/vito
mkdir -p ${OUTPUTDIR}
535 awk ’{ if (NF ==4&&$3=="Rg") print $1 ,$2 ,$4 }’
→ ${ROOTDIR }/ essence_corrected.txt|while read
→ ORIGSTRING1 ORIGSTRING2 ORIGSTRING3;do
STRING1=$(echo $ORIGSTRING1|sed -e
→ ’s/[jav ]\/./m/g’ -e ’s/\/.// ’)
537 STRING2=$(echo $ORIGSTRING2|sed -e
→ ’s/[jav ]\/./m/g’ -e ’s/\/.// ’)
STRING3=$(echo $ORIGSTRING3|sed -e
→ ’s/[jav ]\/./m/g’ -e ’s/\/.// ’)
539
TYPE1=$(echo "${STRING1}"|sed
→ ’s/\(.*\) \([1234]\) \([ft]\) \([ javm ]\) /\1/’)
541 DENSITY1=$(echo "${STRING1}"|sed
→ ’s/\(.*\) \([1234]\) \([ft]\) \([ javm ]\) /\2/’)
TRUNK1=$(echo "${STRING1}"|sed
→ ’s/\(.*\) \([1234]\) \([ft]\) \([ javm ]\) /\3/’)
543 STAGE1=$(echo "${STRING1}"|sed
→ ’s/\(.*\) \([1234]\) \([ft]\) \([ javm ]\) /\4/’)
TYPE2=$(echo "${STRING2}"|sed
→ ’s/\(.*\) \([1234]\) \([ft]\) \([ javm ]\) /\1/’)
545 DENSITY2=$(echo "${STRING2}"|sed
→ ’s/\(.*\) \([1234]\) \([ft]\) \([ javm ]\) /\2/’)
TRUNK2=$(echo "${STRING2}"|sed
→ ’s/\(.*\) \([1234]\) \([ft]\) \([ javm ]\) /\3/’)
547 STAGE2=$(echo "${STRING2}"|sed
→ ’s/\(.*\) \([1234]\) \([ft]\) \([ javm ]\) /\4/’)
TYPE3=$(echo "${STRING3}"|sed
55
Cartographic material on the evolution of forest cover, land uses and climatic conditions of the pilot sites. Show case of the Maamora site, Morocco.
GCP/GLO/440/FRA - Component 1, October 2013

→ ’s/\(.*\) \([1234]\) \([ft]\) \([ javm ]\) /\1/’)
549 DENSITY3=$(echo "${STRING3}"|sed
→ ’s/\(.*\) \([1234]\) \([ft]\) \([ javm ]\) /\2/’)
TRUNK3=$(echo "${STRING3}"|sed
→ ’s/\(.*\) \([1234]\) \([ft]\) \([ javm ]\) /\3/’)
551 STAGE3=$(echo "${STRING3}"|sed
→ ’s/\(.*\) \([1234]\) \([ft]\) \([ javm ]\) /\4/’)
if [ -n "${TYPE1}" -a -n "${DENSITY1}" -a -n
→ "${TRUNK1}" -a -n "${STAGE1}" -a -n "${TYPE2}"
→ -a -n "${DENSITY2}" -a -n "${TRUNK2}" -a -n
→ "${STAGE2}" -a -n "${TYPE3}" -a -n
→ "${DENSITY3}" -a -n "${TRUNK3}" -a -n
→ "${STAGE3}" ];then
553 echo "Type1: ${TYPE1}, Density1: ${DENSITY1},
→ Trunk1: ${TRUNK1}, Stage1: ${STAGE1} Type2:
→ ${TYPE2}, Density2: ${DENSITY2}, Trunk2:
→ ${TRUNK2}, Stage2: ${STAGE2} Type3: ${TYPE3},
→ Density3: ${DENSITY3}, Trunk3: ${TRUNK3},
→ Stage3: ${STAGE3}"
for file in $(find ${ROOTDIR} -name
→ ’canton[ABCDE]* _strate.shp’);do
555 output=${TMPDIR }/$(basename $file
→ .shp)_${STRING1}_${STRING2}_${STRING3 }.shp
pkeditogr -i $file -o $output -an type1 -at
→ String -av ${TYPE1} -an type2 -at String -av
→ ${TYPE2} -an type3 -at String -av ${TYPE3} -an
→ density1 -at Integer -av ${DENSITY1} -an
→ density2 -at Integer -av ${DENSITY2} -an
→ density3 -at Integer -av ${DENSITY3} -an plan1
→ -at Integer -av 0 -an plan2 -at Integer -av 0
→ -an plan3 -at Integer -av 1 -an trunk1 -at
→ String -av ${TRUNK1} -an trunk2 -at String -av
→ ${TRUNK2} -an trunk3 -at String -av ${TRUNK3}
→ -an stage1 -at String -av ${STAGE1} -an stage2
→ -at String -av ${STAGE2} -an stage3 -at String
→ -av ${STAGE3} -select ESSENCE -like
→ "${ORIGSTRING1} ${ORIGSTRING2} Rg
→ ${ORIGSTRING3}" -st
557 COUNT=$(ogrinfo -so $output $(basename $output
→ .shp) |grep Count|awk -v FS=’:’ ’{print $2}’)
if [ -f ${OUTPUTDIR }/ nfi_mamora.shp ];then
559 ogr2ogr -update -append
→ ${OUTPUTDIR }/ nfi_mamora.shp ${output} -nln
→ nfi_mamora
else
561 ogr2ogr ${OUTPUTDIR }/ nfi_mamora.shp ${output}
56
Cartographic material on the evolution of forest cover, land uses and climatic conditions of the pilot sites. Show case of the Maamora site, Morocco.
GCP/GLO/440/FRA - Component 1, October 2013

fi
563 rm ${TMPDIR }/$(basename $output .shp).*
done
565 echo "processed $ORIGSTRING1 $ORIGSTRING2
→ $ORIGSTRING3"
else
567 echo "Warning: $ORIGSTRING1 $ORIGSTRING2 not
→ processed due to missing information"
echo "Type1: ${TYPE1}, Density1: ${DENSITY1},
→ Trunk1: ${TRUNK1}, Stage1: ${STAGE1} Type2:
→ ${TYPE2}, Density2: ${DENSITY2}, Trunk2:
→ ${TRUNK2}, Stage2: ${STAGE2} Type3: ${TYPE3},
→ Density3: ${DENSITY3}, Trunk3: ${TRUNK3},
→ Stage3: ${STAGE3}" ];
569 fi
done
571
echo "process three essences in Reboisement"
573 awk ’{ if (NF ==4&&$2=="Rb"&&$4!=" echec") print }’
→ ${ROOTDIR }/ essence_corrected.txt
#examples:
575 #(empty)
577 rmdir ${TMPDIR}
579 for DENSITY in 1 2 3 4;do
ogr2ogr -where "(type1="Qs" AND type2="NA" and
→ type3="NA" and density1=$DENSITY and density2 =0
→ and density3 =0)" ${OUTPUTDIR }/qs_${DENSITY }.shp
→ ${OUTPUTDIR }/ nfi_mamora.shp
581 ogr2ogr -where "(( type1="Eu.ca" or type1="Eu.cl"
→ or type1="Eu.go" or type1="Eu.gr") AND
→ type2="NA" and type3="NA" and density1=$DENSITY
→ and density2 =0 and density3 =0)"
→ eu_${DENSITY }.shp nfi_mamora.shp
ogr2ogr -where "(( type1="A.cy" or type1="A.mo")
→ AND type2="NA" and type3="NA" and
→ density1=$DENSITY and density2 =0 and
→ density3 =0)" a_${DENSITY }.shp nfi_mamora.shp
583 ogr2ogr -where "(( type1="Ph" or type1="P.pa" or
→ type1="P.r") AND type2="NA" and type3="NA" and
→ density1=$DENSITY and density2 =0 and
→ density3 =0)" p_${DENSITY }.shp nfi_mamora.shp
done
/storage/hyper2/ Projects/NI079 FFEM/nfi/process.sh
57
Cartographic material on the evolution of forest cover, land uses and climatic conditions of the pilot sites. Show case of the Maamora site, Morocco.
GCP/GLO/440/FRA - Component 1, October 2013

D.2 Automated classification process (bash script)
#!/bin/bash
2
MINCOVER =25
4 BALANCE =200
#KMLDIR =/media /1MAR/0 LANDSAT/REF/TRAINING/KML
6 REFDIR =/ storage/hyper2/_Projects/NI079_FFEM/ref
KMLDIR =/ storage/hyper2/_Projects/NI079_FFEM/training/kml
8 #SHPDIR =/media /1MAR/0 LANDSAT/REF/TRAINING/SHP
SHPDIR =/ storage/hyper2/_Projects/NI079_FFEM/training/shp
10 NFIDIR =/ storage/hyper2/_Projects/NI079_FFEM/nfi/STRATES/vito
#INPUTDIR =/media /1MAR/0 LANDSAT/TM
12 ORIGINPUTDIR =/ storage/hyper2/_Projects/NI079_FFEM/landsat/orig
INPUTDIR =/ storage/hyper2/_Projects/NI079_FFEM/landsat/input
14 #MAPDIR =/media /1MAR/0 LANDSAT/MAP
MAPDIR =/ storage/hyper2/_Projects/NI079_FFEM/landsat/output
16 FRACTIONDIR =/ storage/hyper2/_Projects/NI079_FFEM/landsat/output
18 CREATE_INPUT =0
INIT_TRAINING =0
20 CREATE_TRAINING =0
KML=0
22 NFI=1
SDVI=0
24 CLASSIFY =0
MASKMAP =1
26 CLASSIFIER=SVM
28 function usage
{
30 echo "usage: $0 --stack --init --mincover
→ --training --classify --classifier [svm|ann]
→ --input <input > --output <output > [-h]"
echo
32 echo "--init : create training sample from
→ KML"
echo "--stack : create input images (stack
→ bands)"
34 echo "--mincover : minimum forest cover in
→ percentage , use one of (5 10 15 25 30 35 40 45
→ 50 55 60 65 70 75 80 85 90 95)"
echo "--training : create training sample for
→ selected input image"
36 echo "--classify : classfiy selected input image"
echo "--input : input image (e.g., landsat
58
Cartographic material on the evolution of forest cover, land uses and climatic conditions of the pilot sites. Show case of the Maamora site, Morocco.
GCP/GLO/440/FRA - Component 1, October 2013

→ image) with all bands stacked"
38 echo "--output : output map"
}
40
while [ "$1" != "" ]; do
42 case $1 in
-s | --stack ) CREATE_INPUT =1
44 echo "create input images (stack bands)"
;;
46 -init | --init ) INIT_TRAINING =1
echo "create training sample"
48 ;;
-kml | --kml ) KML=1
50 echo "use KML vectors"
;;
52 -nfi | --nfi ) NFI=1
echo "use NFI vectors"
54 ;;
-sdvi | --sdvi ) SDVI=1
56 echo "calculate SDVI as a forest cover proxy"
;;
58 -min | --mincover ) shift
MINCOVER=$1
60 echo "minimum forest cover in percentage:
→ ${MINCOVER }%"
;;
62 -i | --input ) shift
INPUT=$1
64 echo "input is $INPUT"
;;
66 -o | --output ) shift
OUTPUT=$1
68 echo "output is $OUTPUT"
;;
70 -t | --training ) CREATE_TRAINING =1
echo "create training for input image"
72 ;;
-c | --classify ) CLASSIFY =1
74 echo "classify image"
;;
76 -ct | --classifier ) shift
CLASSIFIER=$1
78 echo "classifier=$CLASSIFIER"
;;
80 -h | --help ) usage
exit
59
Cartographic material on the evolution of forest cover, land uses and climatic conditions of the pilot sites. Show case of the Maamora site, Morocco.
GCP/GLO/440/FRA - Component 1, October 2013

82 ;;
* ) usage
84 exit 1
esac
86 shift
done
88
if [ "${CREATE_INPUT}" -eq 1 ];then
90 echo "stack bands 1 2 3 4 for LM data"
for file in ${ORIGINPUTDIR }/LM*_B1.TIF;do
92 pkcrop $(for B in 1 2 3 4;do echo -i
→ ${ORIGINPUTDIR }/$(basename $file .TIF|sed
→ "s/B1/B$B/").TIF;done) -e
→ ${REFDIR }/ Maamora_limite_32630.shp -o
→ ${ORIGINPUTDIR }/$(basename $file .TIF|sed
→ "s/_B1//").tif -co COMPRESS=LZW -co
→ INTERLEAVE=BAND -co TILED=YES
gdalwarp -t_srs epsg :26191
→ ${ORIGINPUTDIR }/$(basename $file .TIF|sed
→ "s/_B1//").tif ${INPUTDIR }/$(basename $file
→ .TIF|sed "s/_B1//").tif
94 done
echo "stack bands 1 2 3 4 5 7 for LT and LE data"
96 for file in ${ORIGINPUTDIR }/L[ET]*_B1.TIF;do
pkcrop $(for B in 1 2 3 4 5 7;do echo -i
→ ${ORIGINPUTDIR }/$(basename $file .TIF|sed
→ "s/B1/B$B/").TIF;done) -e
→ ${REFDIR }/ Maamora_limite_32630.shp -o
→ ${ORIGINPUTDIR }/$(basename $file .TIF|sed
→ "s/_B1//").tif -co COMPRESS=LZW -co
→ INTERLEAVE=BAND -co TILED=YES
98 gdalwarp -t_srs epsg :26191
→ ${ORIGINPUTDIR }/$(basename $file .TIF|sed
→ "s/_B1//").tif ${INPUTDIR }/$(basename $file
→ .TIF|sed "s/_B1//").tif
done
100 fi
102 if [ "${INIT_TRAINING}" -eq 1 ];then
if [ "${KML}" -eq 1 ];then
104 rm -f ${SHPDIR }/* _kml.shp;
echo "convert KML to ESRI Shapefile and reproject
→ to UTM (epsg :26191)"
106 for file in ${KMLDIR }/*. kml; do
rm -f ${SHPDIR }/$(basename $file .kml).shp
108 ogr2ogr -t_srs epsg :26191 -f "ESRI Shapefile"
60
Cartographic material on the evolution of forest cover, land uses and climatic conditions of the pilot sites. Show case of the Maamora site, Morocco.
GCP/GLO/440/FRA - Component 1, October 2013

→ ${SHPDIR }/$(basename $file .kml).shp $file
done
110 echo "create non forest training set"
for file in ${SHPDIR }/ noforest_ *[0 -9]. shp;do
112 rm -f ${SHPDIR }/$(basename $file .shp)_kml.shp
pkeditogr -i $file -o ${SHPDIR }/$(basename
→ $file .shp)_kml.shp -an label -at Integer -av 2
114 done
echo "create forest training set"
116 for ((T=$MINCOVER;T <=100;T+=5));do
for file in ${SHPDIR }/ forest_${T}_*[0 -9]. shp;do
118 if [ -f $file ];then
rm -f ${SHPDIR }/$(basename $file .shp)_kml.shp
120 pkeditogr -i $file -o ${SHPDIR }/$(basename
→ $file .shp)_kml.shp -an label -at Integer -av 1
fi
122 done
done
124 echo "merge all shape files to single training set"
rm -f ${SHPDIR }/ training_kml.shp
126 FILENR =1
for file in ${SHPDIR }/* _kml.shp;do
128 if [ "${FILENR}" -eq 1 ];then
ogr2ogr ${SHPDIR }/ training_kml.shp $file
130 else
ogr2ogr -append -update
→ ${SHPDIR }/ training_kml.shp $file -nln
→ training_kml
132 fi
FILENR=$(( $FILENR +1))
134 done
fi
136 if [ "${NFI}" -eq 1 ];then
rm -f ${SHPDIR }/* _nfi.shp;
138 TMPDIRSHP=${SHPDIR }/tmp$$
mkdir $TMPDIRSHP;
140 echo "init training for Pine forest"
ogr2ogr -where "type1 like ’P%’ AND density1 =1 AND
→ density2 =0 AND density3 =0" $TMPDIRSHP/p.shp
→ $NFIDIR/nfi_mamora.shp
142 pkeditogr -i $TMPDIRSHP/p.shp -o
→ ${TMPDIRSHP }/ p_label.shp -an label -at String
→ -av p
echo "init training for Acacia forest"
144 ogr2ogr -where "type1 like ’A%’ AND density1 =1 AND
→ density2 =0 AND density3 =0" $TMPDIRSHP/a.shp
61
Cartographic material on the evolution of forest cover, land uses and climatic conditions of the pilot sites. Show case of the Maamora site, Morocco.
GCP/GLO/440/FRA - Component 1, October 2013

→ $NFIDIR/nfi_mamora.shp
pkeditogr -i $TMPDIRSHP/a.shp -o
→ ${TMPDIRSHP }/ a_label.shp -an label -at String
→ -av a
146 echo "init training for Eucalyptus forest"
ogr2ogr -where "type1 like ’Eu%’ AND density1 =1 AND
→ density2 =0 AND density3 =0" $TMPDIRSHP/eu.shp
→ $NFIDIR/nfi_mamora.shp
148 pkeditogr -i $TMPDIRSHP/eu.shp -o
→ ${TMPDIRSHP }/ eu_label.shp -an label -at String
→ -av eu
echo "init training for Quercus forest"
150 ogr2ogr -where "type1=’qs ’ AND stage1!=’e’ AND
→ stage2!=’e’ and stage3!=’3’ AND density1 =1 AND
→ density2 =0 AND density3 =0" $TMPDIRSHP/qs.shp
→ $NFIDIR/nfi_mamora.shp
pkeditogr -i $TMPDIRSHP/qs.shp -o
→ ${TMPDIRSHP }/ qs_label.shp -an label -at String
→ -av qs
152 echo "init training for Non forest"
ogr2ogr -where "density1 =3 OR density1 =4"
→ $TMPDIRSHP/nf.shp $NFIDIR/nfi_mamora.shp
154 pkeditogr -i $TMPDIRSHP/nf.shp -o
→ ${TMPDIRSHP }/ nf_label.shp -an label -at String
→ -av NF
echo "merge training"
156 rm -f ${SHPDIR }/ training_nfi.shp
FILENR =1
158 for file in ${TMPDIRSHP }/* _label.shp;do
if [ "${FILENR}" -eq 1 ];then
160 ogr2ogr ${SHPDIR }/ training_nfi.shp $file
else
162 ogr2ogr -append -update
→ ${SHPDIR }/ training_nfi.shp $file -nln
→ training_nfi
fi
164 FILENR=$(( $FILENR +1))
done
166 rm $TMPDIRSHP /*. dbf $TMPDIRSHP /*. prj
→ $TMPDIRSHP /*.shp $TMPDIRSHP /*.shx
rmdir $TMPDIRSHP
168 fi
# for TYPE in a eu p qs;do
170 # echo "init training for forest based on
→ $TYPE"
# for DENSITY in 1;do
62
Cartographic material on the evolution of forest cover, land uses and climatic conditions of the pilot sites. Show case of the Maamora site, Morocco.
GCP/GLO/440/FRA - Component 1, October 2013

172 # file=${NFIDIR }/${TYPE}_${DENSITY }.shp;
# if [ -f $file ];then
174 # rm -f ${SHPDIR }/$(basename $file
→ .shp)_nfi.shp
# pkeditogr -i $file -o
→ ${SHPDIR }/$(basename $file .shp)_nfi.shp -an
→ label -at String -av $TYPE
176 # fi
# done
178 # echo "init training for non forest based
→ on $TYPE"
# for DENSITY in 3 4;do
180 # file=${NFIDIR }/${TYPE}_${DENSITY }.shp;
# if [ -f $file ];then
182 # rm -f ${SHPDIR }/$(basename $file
→ .shp)_nfi.shp
# pkeditogr -i $file -o
→ ${SHPDIR }/$(basename $file .shp)_nfi.shp -an
→ label -at String -av NF
184 # fi
# done
186 # done
# echo "merge training"
188 # rm -f ${SHPDIR }/ training_nfi.shp
# FILENR =1
190 # for file in ${SHPDIR }/* _nfi.shp;do
# if [ "${FILENR }" -eq 1 ];then
192 # ogr2ogr ${SHPDIR }/ training_nfi.shp $file
# else
194 # ogr2ogr -append -update
→ ${SHPDIR }/ training_nfi.shp $file -nln
→ training_nfi
# fi
196 # FILENR=$(( $FILENR +1))
# done
198 # fi
fi
200
if [ "${SDVI}" -eq 1 ];then
202 for TYPE in a eu p qs;do
for DENSITY in 1 2 3 4;do
204 file=${NFIDIR }/${TYPE}_${DENSITY }.shp;
if [ -f $file ];then
206 echo "extract reflectance information"
COUNT=$(ogrinfo $file $(basename $file .shp)
→ |grep Count|awk -v FS=’:’ ’{print $2}’)
63
Cartographic material on the evolution of forest cover, land uses and climatic conditions of the pilot sites. Show case of the Maamora site, Morocco.
GCP/GLO/440/FRA - Component 1, October 2013
208 if [ "${COUNT}" -gt 0 ];then
rm -f ${FRACTIONDIR }/$(basename ${INPUT}
→ .tif)_${TYPE}_${DENSITY }.*
210 pkextract -i ${INPUT} -s ${file} -o
→ ${FRACTIONDIR }/$(basename ${INPUT}
→ .tif)_${TYPE}_${DENSITY }.shp -l -r point
pkdumpogr -i ${FRACTIONDIR }/$(basename
→ ${INPUT} .tif)_${TYPE}_${DENSITY }.shp -n B1 -n
→ B2 -n B3 -n B4 -n B5 -n B6 -o
→ ${FRACTIONDIR }/$(basename ${INPUT}
→ .tif)_${TYPE}_${DENSITY }.txt
212 fi
fi
214 done
echo "calculate red and nir for soil and dense
→ vegetation"
216 echo "calculate SDVI"
for DENSITY in 1 2 3 4;do
218 file=${NFIDIR }/${TYPE}_${DENSITY }.shp;
COUNT=$(ogrinfo $file $(basename $file .shp)
→ |grep Count|awk -v FS=’:’ ’{print $2}’)
220 if [ "${COUNT}" -gt 0 ];then
RED_V=$(pkstatogr -i $file_v -n B1 -min|awk -v
→ FS="--mean" ’{print $2}’)
222 RED_S=$(pkstatogr -i $file_s -n B1 -max|awk -v
→ FS="--mean" ’{print $2}’)
NIR_V=$(pkstatogr -i $file_v -n B2 -max|awk -v
→ FS="--mean" ’{print $2}’)
224 NIR_S=$(pkstatogr -i $file_s -n B2 -mean|awk -v
→ FS="--mean" ’{print $2}’)
echo "process
→ ${FRACTIONDIR }/${TYPE}_${DENSITY}_sdvi.txt"
226 awk -v RED_V="${RED_V}" -v RED_S="${RED_S}" -v
→ NIR_V="${NIR_V}" -v NIR_S="${NIR_S}" ’BEGIN
→ {DVI_V=NIR_V -RED_V;DVI_S=NIR_S -RED_S };{RED=$3;NIR=$4;
→ DVI=NIR -RED;
→ SDVI =100.0*(DVI -DVI_S)/(DVI_V -DVI_S); print
→ SDVI}’ ${FRACTIONDIR }/$(basename ${INPUT}
→ .tif)_${TYPE}_${DENSITY }.txt >
→ ${FRACTIONDIR }/$(basename ${INPUT}
→ .tif)_${TYPE}_${DENSITY}_sdvi.txt
fi
228 done
done
230 fi
64
Cartographic material on the evolution of forest cover, land uses and climatic conditions of the pilot sites. Show case of the Maamora site, Morocco.
GCP/GLO/440/FRA - Component 1, October 2013

232 if [ "${CLASSIFY}" -eq 1 ];then
#0 0 0 0 255
234 #1 51 153 85 255
#2 252 251 212 255
236 #3 207 235 252 255
if [ ! -f ${INPUT} ];then
238 echo "Error: input image $INPUT not found!"
exit
240 fi
echo "extract image data for training"
242 if [ "${KML}" -eq 1 ];then
TRAINING=${SHPDIR }/ training_kml_$(basename ${INPUT}
→ .tif).shp
244 if [ -z "$OUTPUT" ];then
OUTPUT=${MAPDIR }/$(basename ${INPUT}
→ .tif)_kml_map.tif
246 fi
if [ "${CREATE_TRAINING}" -eq 1 ] ||
→ "${INIT_TRAINING}" -eq 1 ];then
248 rm -f ${TRAINING}
fi
250 if [ ! -f ${TRAINING} ];then
pkextract -i ${INPUT} -s
→ ${SHPDIR }/ training_kml.shp -o ${TRAINING} -r mean
252 fi
rm -f ${OUTPUT}
254 echo "classify input image $INPUT"
if [ "${CLASSIFIER}" == "SVM" ];then
256 pkclassify_svm -t ${TRAINING} -cc 1000 -g 1
→ -bal ${BALANCE} -i ${INPUT} -o ${OUTPUT} -ct
→ ${MAPDIR }/ colortable_type.txt -cv 2
elif [ "${CLASSIFIER}" == "ANN" ];then
258 pkclassify_nn -t ${TRAINING} -bal ${BALANCE} -i
→ ${INPUT} -o ${OUTPUT} -ct
→ ${MAPDIR }/ colortable_type.txt -cv 2
else
260 echo "Error: classifier ${CLASSIFIER} not
→ supported , please us SVM or ANN"
exit
262 fi
elif [ "${NFI}" -eq 1 ];then
264 TRAINING=${SHPDIR }/ training_nfi_$(basename ${INPUT}
→ .tif).shp
if [ -z "$OUTPUT" ];then
266 OUTPUT=${MAPDIR }/$(basename ${INPUT}
→ .tif)_nfi_map.tif
65
Cartographic material on the evolution of forest cover, land uses and climatic conditions of the pilot sites. Show case of the Maamora site, Morocco.
GCP/GLO/440/FRA - Component 1, October 2013

fi
268 if [ ${CREATE_TRAINING} -eq 1 ] || ${INIT_TRAINING}
→ -eq 1 ];then
rm -f ${TRAINING}
270 fi
if [ ! -f ${TRAINING} ];then
272 pkextract -i ${INPUT} -s
→ ${SHPDIR }/ training_nfi.shp -o ${TRAINING} -r
→ point -l
# pkextract -i ${INPUT} -s
→ ${SHPDIR }/ training_nfi.shp -o ${TRAINING} -r mean
274 fi
rm -f ${OUTPUT}
276 echo "classify input image $INPUT"
if [ "${CLASSIFIER}" == "SVM" ];then
278 pkclassify_svm -t ${TRAINING} -cc 1000 -g 1
→ -bal ${BALANCE} -i ${INPUT} -o ${OUTPUT} -c qs
→ -r 11 -c a -r 12 -c eu -r 13 -c p -r 14 -c NF -r
→ 20 -ct ${MAPDIR }/ colortable_type.txt -cv 2
elif [ "${CLASSIFIER}" == "ANN" ];then
280 pkclassify_nn -t ${TRAINING} -bal ${BALANCE} -i
→ ${INPUT} -o ${OUTPUT} -c qs -r 11 -c a -r 12 -c
→ eu -r 13 -c p -r 14 -c NF -r 20 -ct
→ ${MAPDIR }/ colortable_type.txt -cv 2
else
282 echo "Error: classifier ${CLASSIFIER} not
→ supported , please us SVM or ANN"
exit
284 fi
fi
286 if [ "${MASKMAP}" ];then
EXTENT=${REFDIR }/ Maamora_limite_26191.shp
288 pkcrop -i ${OUTPUT} -e ${EXTENT} -o ${OUTPUT}
gdal_rasterize -i -burn 0 -l $(basename ${EXTENT}
→ .shp) ${EXTENT} ${OUTPUT}
290 fi
fi
292
#kml:
294 #for file in landsat/input/LT52010361987239XXX03.tif
→ landsat/input/LT52010361987255XXX03.tif ; do
→ ./ classify.sh -kml --init --training --classify
→ -i $file;done
#pkmosaic -m 6 $(for file in
→ LT52010361987*_kml_map.tif;do echo -i
66
Cartographic material on the evolution of forest cover, land uses and climatic conditions of the pilot sites. Show case of the Maamora site, Morocco.
GCP/GLO/440/FRA - Component 1, October 2013

→ $file;done) -o 1990 _reference_kml_map_type.tif
/storage/hyper2/ Projects/NI079 FFEM/classify.sh
67
Cartographic material on the evolution of forest cover, land uses and climatic conditions of the pilot sites. Show case of the Maamora site, Morocco.
GCP/GLO/440/FRA - Component 1, October 2013

Rainfall panel:
- Yearly rainfall
- Standard Precipitation Index
- Number of days > 5mm
- Number of days > 30mm
Cartographic material on the evolution of forest cover, land uses and climatic conditions of the pilot sites. Show case of the Maamora site, Morocco.
GCP/GLO/440/FRA - Component 1, October 2013

Maamora forest domain
Yearly rainfall
Cartographic material on the evolution of forest cover, land uses and climatic conditions of the pilot sites. Show case of the Maamora site, Morocco.
GCP/GLO/440/FRA - Component 1, October 2013

Maamora forest domain
Standard precipitation index
Cartographic material on the evolution of forest cover, land uses and climatic conditions of the pilot sites. Show case of the Maamora site, Morocco.
GCP/GLO/440/FRA - Component 1, October 2013

Maamora forest domain
Number of daily rainfall >5mm
Cartographic material on the evolution of forest cover, land uses and climatic conditions of the pilot sites. Show case of the Maamora site, Morocco.
GCP/GLO/440/FRA - Component 1, October 2013

Maamora forest domain
Number of daily rainfall >30mm
Cartographic material on the evolution of forest cover, land uses and climatic conditions of the pilot sites. Show case of the Maamora site, Morocco.
GCP/GLO/440/FRA - Component 1, October 2013

Dash board on the heat wave indicators
- Number of days >35°C
- Number of days >40°C
- Number of heat waves
- Longest heat wave period
Cartographic material on the evolution of forest cover, land uses and climatic conditions of the pilot sites. Show case of the Maamora site, Morocco.
GCP/GLO/440/FRA - Component 1, October 2013

Maamora forest domain
Nb of heat waves (>= 3 consecutive days)
Cartographic material on the evolution of forest cover, land uses and climatic conditions of the pilot sites. Show case of the Maamora site, Morocco.
GCP/GLO/440/FRA - Component 1, October 2013

Maamora forest domain
Longest heat wave (consecutive number of heat days)
Cartographic material on the evolution of forest cover, land uses and climatic conditions of the pilot sites. Show case of the Maamora site, Morocco.
GCP/GLO/440/FRA - Component 1, October 2013

Maamora forest domain
Number of days > 35°C
Cartographic material on the evolution of forest cover, land uses and climatic conditions of the pilot sites. Show case of the Maamora site, Morocco.
GCP/GLO/440/FRA - Component 1, October 2013

Maamora forest domain
Number of days > 40°C
Cartographic material on the evolution of forest cover, land uses and climatic conditions of the pilot sites. Show case of the Maamora site, Morocco.
GCP/GLO/440/FRA - Component 1, October 2013

TEMPERATURE panel
- Maximum temperature (daily average)
- Standard maximum temperature
- Minimum temperature (daily average)
- Standard minimum temperature
- Average temperature (daily average)
- Standard average temperature
Cartographic material on the evolution of forest cover, land uses and climatic conditions of the pilot sites. Show case of the Maamora site, Morocco.
GCP/GLO/440/FRA - Component 1, October 2013

Maamora forest domain
MAXIMUM temperature (daily average)
Cartographic material on the evolution of forest cover, land uses and climatic conditions of the pilot sites. Show case of the Maamora site, Morocco.
GCP/GLO/440/FRA - Component 1, October 2013
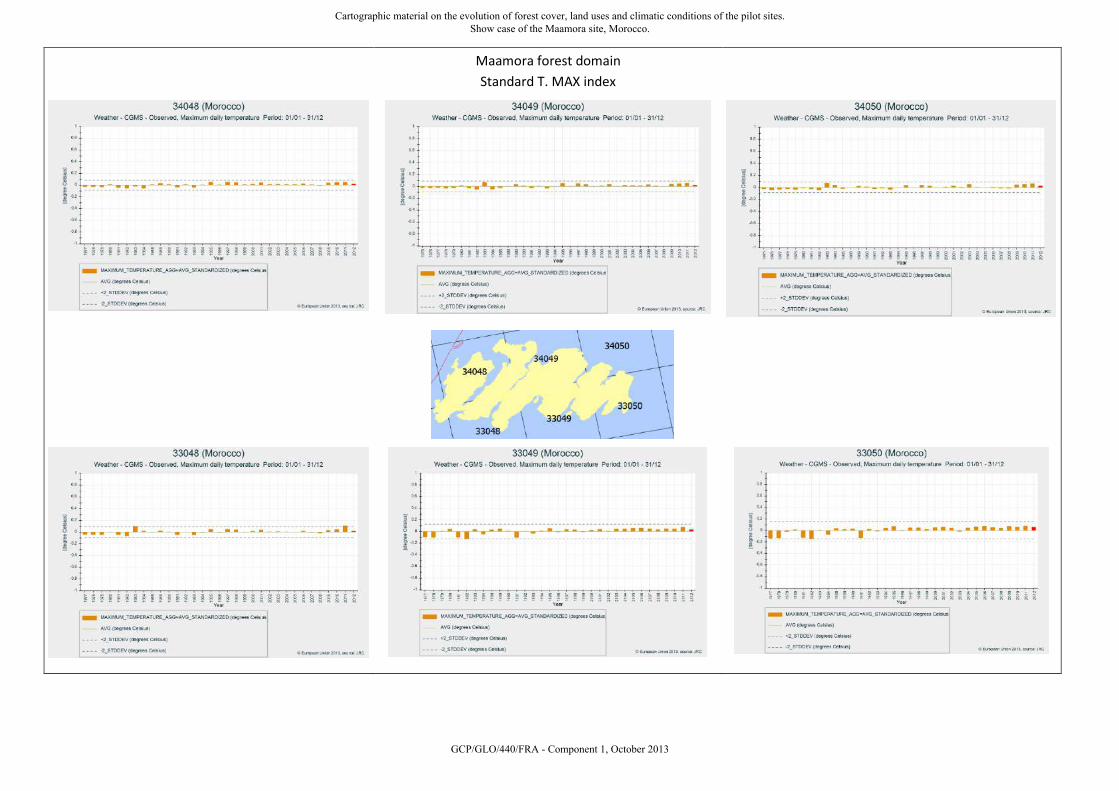
Maamora forest domain
Standard T. MAX index
Cartographic material on the evolution of forest cover, land uses and climatic conditions of the pilot sites. Show case of the Maamora site, Morocco.
GCP/GLO/440/FRA - Component 1, October 2013

Maamora forest domain
MINIMUM temperature (daily average)
Cartographic material on the evolution of forest cover, land uses and climatic conditions of the pilot sites. Show case of the Maamora site, Morocco.
GCP/GLO/440/FRA - Component 1, October 2013

Maamora forest domain
Standard T. MIN index
Cartographic material on the evolution of forest cover, land uses and climatic conditions of the pilot sites. Show case of the Maamora site, Morocco.
GCP/GLO/440/FRA - Component 1, October 2013

Maamora forest domain
MEAN temperature (daily average)
Cartographic material on the evolution of forest cover, land uses and climatic conditions of the pilot sites. Show case of the Maamora site, Morocco.
GCP/GLO/440/FRA - Component 1, October 2013

Maamora forest domain
Standard T. MEAN index
Cartographic material on the evolution of forest cover, land uses and climatic conditions of the pilot sites. Show case of the Maamora site, Morocco.
GCP/GLO/440/FRA - Component 1, October 2013