cars, trucks, planes: what will drive them in the future?
DESCRIPTION
BTRE Transport Colloquium Canberra 13-14 June 2007. Cars, Trucks, Planes: What will drive them in the future?. David Lamb. Headlines: (1). Biggest increase in Australia’s emissions since 1990 is private transport Increased 29% since 1990. Headlines: (2). Public transport in crisis - PowerPoint PPT PresentationTRANSCRIPT
Cars, Trucks, Planes:What will drive them in the future?
David Lamb
BTRE Transport Colloquium Canberra 13-14 June 2007

• Biggest increase in Australia’s emissions since 1990 is private transport– Increased 29% since 1990
Headlines: (1)

• Public transport in crisis– “Transport congestion choking Melbourne” -- The Age
– “Fuel price drives commuters onto buses and trains” -- SMH
• What do these problems have in common?
Headlines: (2)

Source http://www.tycoflowcontrol.com.au/industries/oil_&_gas__chemical


Government Report :Is the World Running Out of Oil
(2005)

Source: Abare: Australian energy: national & state projections to 2029-30
ABARE Projection to 2030 – (2005)
45%
Energy Trade Deficit
>$5 Bn last year

Katrina:
1836 deaths
$100 billion damage
30 oil platforms
9 oil refineries

Oil consumptionCountry Consumption Consumption
Litres
Barrels/day Per person
Per day
India 2,100,000 0.24
China 6,700,000 0.8
Australia 800,000 6.3
USA 20,000,000 11.3
World 77,000,000 1.8

Contribution to total net CO2e emissions by sector (Kyoto accounting), 2003
0
10
20
30
40
50
60
StationaryEnergy
Transport FugitiveEmissions
IndustrialProcesses
Agriculture Land Use, LandUse Change and
Forestry
Waste
pe
r ce
nt
(%)
Sources of emissions - Australia
Note: USA transport emissions are 28% of total USA emissions. California 58%
14.5%
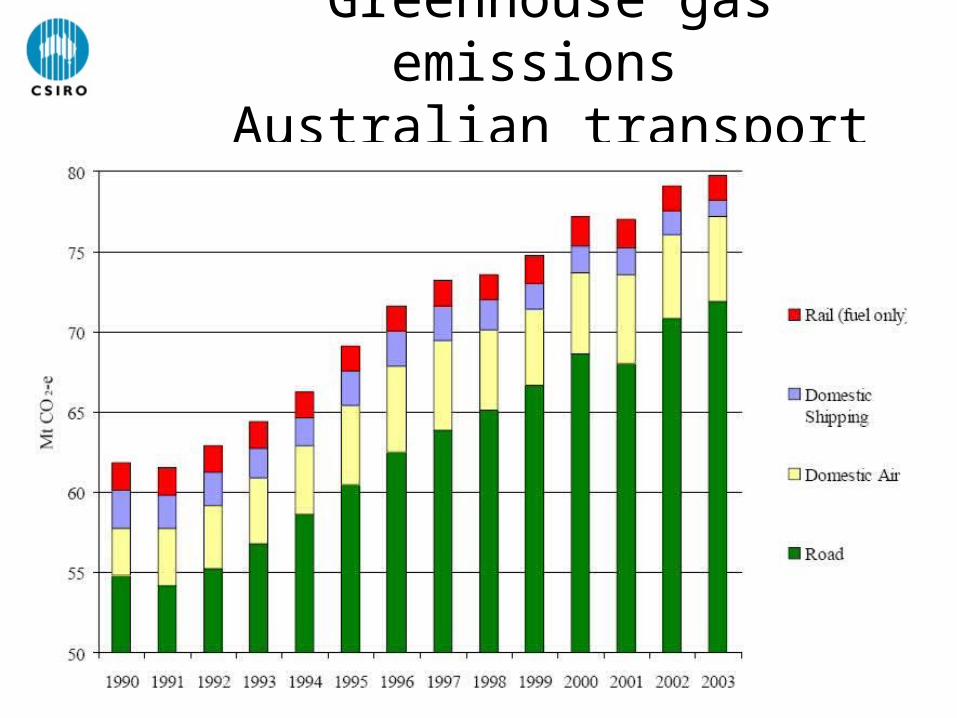
Greenhouse gas emissions Australian transport

Methane (CH4) and nitrous oxide (N2O) also need to be considered.
GHG must not be confused with Air Quality!Air quality is an issue in urban areas
(particulate carbon, mostly from diesel)
GHG emissions are a national/global issue

Change in emissions profile

Why the increase in GHG for cars?
2NO 2NO2
N2 + O2 N2 + 2O2
N2O
Nitrous oxide (N2O)is 310 times as potentas carbon dioxide
And there’s a second reason!
Engines have improved in fuel efficiency 20% over the past 20years, However this has been offset by growth in vehicle size


Road Vehicles Australia
Transport Fuel Mix
19962
14461
4253
0
5000
10000
15000
20000
25000
Petrol ADO LPG
52%
11%
37%
2003/04
Passenger Vehicle Fuel type
8853925
198615 152912 7840
1000000
2000000
3000000
4000000
5000000
6000000
7000000
8000000
9000000
10000000
Petrol Diesel LPG Other
2002

The Technology Progression for
Australia?
30 ye
ars o
r eve
n m
ore!
Oil based transport system
Hydrogen based transport system
Altern
ative
Fue
ls
Hydrogen
Electricity
Methanol ?
Oil from coal ?
Oil from gas ?
Biofuels – ethanol, biodiesel
Natural gas
LPG
But must be ‘clean’
}

Biofuels from current agriculture
Ethanol
If we used all the crops (sugar, molasses, wheat, coarse grain) suitable for making ethanol and converted them to fuel it would only replace 75% of our petrol.(If we stopped exporting grain we could replace 25% of our petrol)
Biodiesel
If we used all the crops (canola, cottonseed and others) suitable for making diesel and converted them to fuel we could replace only 10% of our diesel usage.
Conclusions:
Ethanol could support E10 for most of Australia
Urgent research is needed into next-generation biofuel technologies.

Side effects of biofuels
The Tortilla Protest – Mexico City, February 21 2007

comparison of ethanol vs ULP-

Sustainability - GHG emissions across fuel typesin a typical ‘family sedan’
0
0.05
0.1
0.15
0.2
0.25
0.3
0.35
ULP (E
uro
3 en
gine
)
PULP (E
uro
4 en
gine)
FT Dies
el
LPG P
ropa
neCNG
LNG
ULS D
iese
l
LS D
iesel
LS d
iesoh
ol
Biodies
el (c
anol
a)
Ethan
ol (m
olas
ses)
Ethan
ol (w
oodw
aste
)
Biodies
el (w
aste
oil)kg
car
bon
diox
ide
equi
vale
nts
per
km in
ligh
t ve
hilc
e .
Tailpipe
Upstream
Source: Tim Grant


Room for improvement
13% Motion(aero, braking & rolling)
Braking 6%
Accessory 2%
Engine 62%Rolling 4%
Aero 3%
Idle 17%
Drivetrain 6%
In suburban cycle 87% energy lost versus 13% converted to motion

• Automobiles are becoming increasingly electrified
• There is a strong demand for more energy storage on board the vehicle.
• Much research into high-tech batteries

In partnership with Holden the ECOmmodore, a parallel hybrid vehicle.
With aXcess Australia, a series hybrid vehicle.

60 volt battery pack 150 volt Supercapacitor
CSIRO’s Battery Breakthrough

The UltraBattery

An All-Electric Vehicle
Controller
Electric Motor
240V AC
Charger
Storage Device
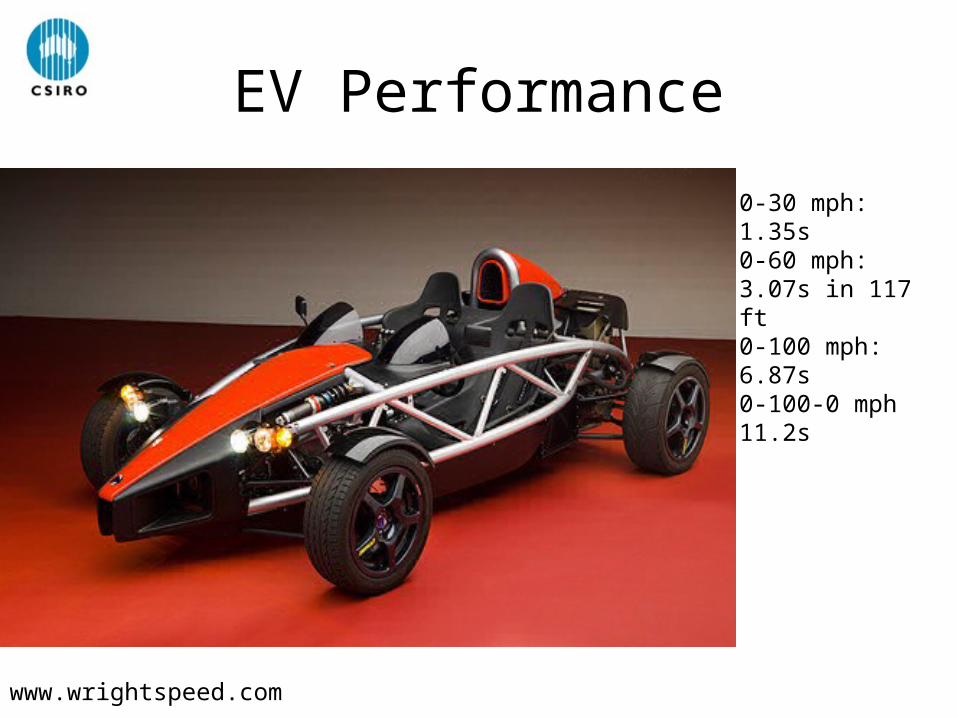
EV Performance
0-30 mph: 1.35s0-60 mph: 3.07s in 117 ft0-100 mph: 6.87s0-100-0 mph 11.2s
www.wrightspeed.com

Finally, the Hydrogen Powered Car
Fuel Cell
Hydrogen
Electric motor

The Future?
• Expect more pressure to reduce emissions
• Simplest ways to reduce emissions: - – Reduce travel (particularly in cities)– Reduce vehicle size where possible– Improve traffic flows– improve fuel economy of vehicles

• Expect more pressure to reduce emissions
• Expect more technological improvements in engines.
• Hybrids save fuel (and emissions) – but mostly in the city
(short journeys and stop-start driving)
The easiest ways to reduce emissions are to reduce travel, reduce vehicle size, then reduce congestion.

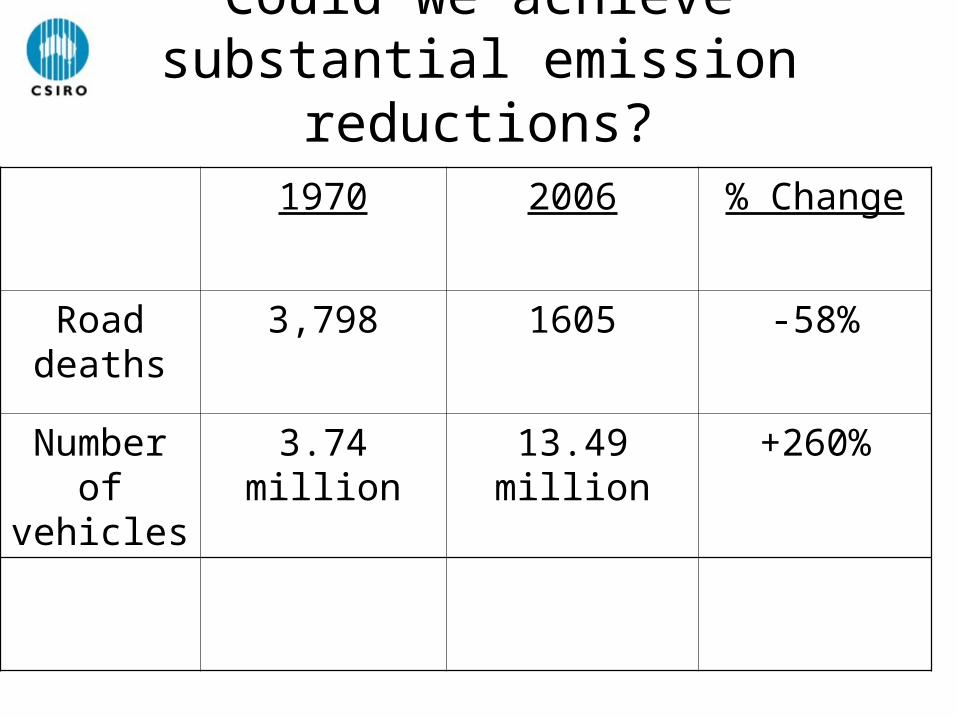
Could we achieve substantial emission reductions?
1970
Road deaths
3,798
Number of vehicles
3.74 million
Could we achieve substantial emission reductions?
1970 2006 % Change
Road deaths
3,798 1605 -58%
Number of vehicles
3.74 million 13.49 million +260%

Could we achieve substantial emission reductions?
1970 2006 % Change
Road deaths
3,798 1605 -58%
Number of vehicles
3.74 million 13.49 million +260%
Death rate
Per 100,000
101.5 11.9 -89%

89% reduction in 36 years!
– Public awareness of the problem– Government response
• Determined planning• Regulations • Driving• Road management• Vehicle technology
– Technology
And at CSIRO we’re working on it!
How did we do it?

Thank you for your
attention