caregiving in the u.s. - aarp the national alliance for caregiving in collaboration with aarp and...
TRANSCRIPT

601 E Street, NWWashington, DC 200491-888-OUR-AARP (1-888-687-2277) toll-freewww.aarp.org
4720 Montgomery Lane, 5th FloorBethesda, MD 20814www.caregiving.org
EXECUTIVE SUMMARY
conducted by
The NATIONAL ALLIANCE for CAREGIVING
in collaboration with AARP
CAREGIVING IN THE U.S.
Funded by
D18196(205)

AcknowledgmentsThe National Alliance for Caregiving in collaboration with AARP andwith funding by MetLife Foundation is proud to present Caregiving inthe U.S.
Many people played important roles throughout the research processincluding the following:
Gail Gibson Hunt, National Alliance for Caregiving
Elinor Ginzler, AARP State and National Initiatives
Linda L. Barrett, Ph.D., AARP Knowledge Management
NAC Advisory Panel
Marge Cantor, Fordham University
John Crews, Centers for Disease Control and Prevention
Pamela Doty, U.S. Department of Health and Human Services
Lynn Friss Feinberg, Family Caregiver Alliance
Rick Greene, Administration on Aging
Carol Levine, United Hospital Fund
Katie Maslow, Alzheimer’s Association
Skip Schlenk, AT&T (Retired)
Melissa Talamantes, University of Texas
Donna Wagner, Towson University
Donna Yee, Asian Community Center, Sacramento, CA
The research was conducted by Belden, Russonello & Stewart for theNational Alliance for Caregiving and AARP under the direction of LindaL. Barrett, Ph.D., and reviewed by senior research advisors in AARPKnowledge Management.
i
©2005 NAC and AARP. Reprinting with permission only.
CAREGIVING IN THE UNITED STATES
The National Alliance for Caregiving is a nonprofit coalition of morethan 40 national organizations that focuses on issues of family care-giving across the life span. Established in 1996 by founding members AARP, the American Society on Aging, the National Association of AreaAgencies on Aging, the National Council on the Aging, and the U.S.Department of Veteran's Affairs, the Alliance was created to conductresearch, do policy analysis, develop national programs, and increasepublic awareness of family caregiving issues. Recognizing that familycaregivers make important societal and financial contributions towardmaintaining the well-being of those for whom they care, the Alliance’smission is to be the objective national resource on family caregiving withthe goal of improving the quality of life for families and care recipients.
AARP is a nonprofit, nonpartisan membership organization that helpspeople 50+ have independence, choice and control in ways that arebeneficial and affordable to them and society as a whole. We produceAARP The Magazine, published bimonthly; AARP Bulletin, our monthlynewspaper; AARP Segunda Juventud, our bimonthly magazine inSpanish and English; NRTA Live & Learn, our quarterly newsletter for50+ educators; and our website, www.aarp.org. AARP Foundation is ouraffiliated charity that provides security, protection, and empowermentto older persons in need with support from thousands of volunteers,donors, and sponsors. We have staffed offices in all 50 states, the Districtof Columbia, Puerto Rico, and the U.S. Virgin Islands.
MetLife Foundation, established in 1976 by MetLife, has been involvedin a variety of healthy aging initiatives addressing issues of caregiving,intergenerational activities, mental fitness, health and wellness pro-grams and volunteer opportunities. Since 1986, the Foundation hassupported research on Alzheimer’s disease. The Foundation was thesponsor of The Forgetting: A Portrait of Alzheimer’s, the Emmy-winningprimetime PBS documentary and educational outreach program onAlzheimer’s disease, which provides resources for caregivers. For moreinformation about MetLife Foundation, visit www.metlife.org.

Intensity of Caregiving 12
Hours of Care Provided and Frequency of Visits 12
Types of Assistance Caregivers Provide 13
IADLs: Managing Everyday Living 13
ADLs: Personal Care 14
Home Modification and Assistive Devices 16
Caregiver Support 16
Primary vs. Secondary Caregivers 16
Unpaid Care 16
Paid Care 17
Stress and Strain of Caregiving 18
Caregivers’ Physical Health 18
Caregivers’ Emotional Health 19
Coping with Stress 20
Impact of Caregiving on Family and Leisure Activities 21
Impact of Caregiving on Work 22
Financial Hardship on Caregivers 23
Supportive Services in the Community 24
Unmet Needs for Help, Information or Support 25
Where Caregivers Go For Information 27
Caregivers in Ethnic Subgroups 27
African-American Caregivers 27
Hispanic Caregivers 29
Asian-American Caregivers 29
White Caregivers 30
Comparison of Caregivers by Age of Recipient 31
Characteristics of Caregivers of Persons Age 50+ 31
Characteristics of Caregivers of Persons Age 18-49 31
Summary and Conclusions 32
Table of ContentsIntroduction and Background
Overview of Methodology iv
Study Limitations v
Key Findings
Profile of Caregivers vi
Profile of Care Recipients vii
Carrying the Load vii
Unmet Needs of Caregivers viii
Detailed Findings
Prevalence of Caregiving in the United States 1
Numbers of Adult Caregivers and Households with Caregivers 1
Who Are the Caregivers? 2
Gender 2
Age 2
Level of Burden 2
Marital Status 3
Education 4
Employment Status 4
Income and Spending 6
Military Service 6
Characteristics of the Caregiving Situation 7
Duration of Care of Persons Being Cared For 7
Living Arrangements 8
Who Are the Care Recipients? 10
Relationship between Caregiver and Recipient 10
Gender 10
Age 10
Marital Status 10
Military Service 10
Health Status of Care Recipients 10
Main Problems or Illnesses 11
Medication Management 12
ii iii
CAREGIVING IN THE UNITED STATES CAREGIVING IN THE UNITED STATES
caregiving, the study focused on those caregivers who are activelyengaged in providing specific types of care for adults of all ages.
To understand the range of experiences and impact on caregivers, aLevel of Burden Index was used. Level of Burden is based on an indexderived from the activities of daily living (ADLs), instrumental activitiesof daily living (IADLs) and the amount of time devoted to caregiving.Level 1 represents the least amount of responsibility and Level 5 thegreatest amount of responsibility. This measure is important as Level ofBurden, the feeling of having a choice in being a caregiver, and the care-giver’s reported health status have the biggest influence on whether ornot a caregiver reports emotional stress, physical strain or financialhardship.
Study LimitationsThe majority of the sample was obtained by using a random digit dialtechnique. However, we found that the incidence of caregivers in theHispanic and Asian ethnic sub-groups was so small that additional tar-geted and surname samples were used, as well as an existing represen-tative panel, to achieve the desired sample size. Consequently, thefindings from the ethnic oversample may not represent all Hispanic orAsian caregivers.
Caregivers from the three sub-ethnic groups, African-Americans,Hispanics and Asian-Americans, under-represent recent immigrants orfirst generation caregivers who speak little or no English. It is alsoimportant to note that sub-ethnic group respondents may not haveinterpreted all questions identically due to their diverse cultural and lin-guistic backgrounds.
Introduction and BackgroundThe purpose of this study was to determine how many caregivers thereare in the U.S., who they are, what they do as caregivers, and how care-giving affects their lives. We also wanted to learn about the people whobenefit from the care they provide.
We estimate there are 44.4 million caregivers age 18 and older in theU.S. (21% of the adult U.S. population) who provide unpaid care to anadult family member or friend who is also age 18 or older. These care-givers are present in an estimated 22.9 million households (21% of U.S.households)
Most caregivers in our study say they experience little physical strain,emotional stress, or financial hardship as a result of being a caregiver.Nonetheless, caregivers who provide the greatest number of hours ofcare and the most intense care are likely to say caregiving takes a toll onthem physically, emotionally, and financially. These caregivers often feelthey had to assume the responsibility for caring for another person.Although this group represents 10-31% of all caregivers, they are thegroup most at risk for experiencing negative consequences from thisrole. With the existing shortage of health care workers in the U.S. today,these caregivers represent the backbone of the long-term care system.
Overview of MethodologyThis study is based on a national survey of 6,139 adults from which1,247 caregivers were identified.1 The interviews included 200 African-American, 200 Hispanic and 200 Asian-American caregivers who wereobtained through oversampling using additional targeted and surnamesamples for Hispanic and Asian-American caregivers. Most interviewswere conducted in English over the telephone between September 5and December 22, 2003. A Spanish version of the interview was initiallyoffered to non-English speaking people of Hispanic descent.2
For purposes of this study, caregivers were defined as people age 18 andover who help another person age 18 or older with at least one of thir-teen tasks that caregivers commonly perform. These activities rangefrom helping another manage finances, shop for groceries, or do house-work (instrumental activities of daily living) or personal care such as tohelping someone get in and out of a chair or bed, get dressed, bathe,use the toilet, or eat (activities of daily living). By using this definition of
iv v
1 With a sample this size, the margin of error is plus/minus 2.8 percentage points at the 95 percentconfidence level. This means that 95 times out of 100, differences of greater or less than 2.8 percentwould not have occurred by chance.2The majority of the sample was obtained by using a random digit dial technique. However, wefound that the incidence of caregivers in the Hispanic and Asian ethnic sub-groups was so smallthat additional targeted and surname samples were used, as well as an existing representativepanel, to achieve the desired sample size. At this point, we were no longer able to offer the optionof conducting the interview in Spanish.
CAREGIVING IN THE UNITED STATES CAREGIVING IN THE UNITED STATES

Profile of Care Recipients> More care recipients are female (65%) than male, and many are wid-
owed (42%).
> More care recipients are older (80% are age 50 or older) rather thanyounger.
> The average age of all care recipients is 66 years. The average age ofyounger care recipients is 33 years old, and the average age of oldercare recipients is 75 years.
> Among care recipients who do not live with their caregiver, morethan half (55%) live in their own home.
> Caregivers who help someone age 50 or older say the main problemor illness the person they care for has is “old age” followed by dia-betes, cancer, and heart disease.
> Caregivers who help someone between the ages of 18-49 say themain problem or illness the person they care for has is mental illness or depression (23%).
> Caregivers of older adults are more likely to be taking care of theirmother (34%), grandmother (11%), or father (10%). Many olderrecipients are widowed (52%) and more than half (53%) live alone.
> Most caregivers (85%) say the person they care for takes prescriptionmedicine.
Carrying the Load> More than one in three caregivers (37%) say no one else provided
unpaid help to the person they cared for during the past year.Among caregivers who say someone else did provide assistanceduring the past year, one in three (34%) says they provide most ofthe unpaid care, and ten percent say they split the care 50/50.
> Using the services of paid personal helpers is less common thanobtaining help from unpaid caregivers. Among caregivers who helpthose living outside of a nursing home, only 41 percent say theircare recipient received paid services during the past year from anaide or nurse, hired housekeeper, or others paid to help.
> Half of all caregivers say they provide care at the lower ranges of theLevel of Burden Index. About thirty percent say they provide care inthe higher range at Levels 4 and 5.
> Although a minority (10%) of caregivers say they provide care atLevel 5, these caregivers are, by definition, involved in the mostintense caregiving situations.
Key FindingsProfile of Caregivers> We estimate that there are 44.4 million caregivers in the U.S. age 18
and older who provide unpaid care to another adult age 18 or older(21% of the adult U.S. population). They are present in an estimated22.9 million households (21% of U.S. households).
> Although one profile does not fit all caregivers, a “typical” caregiverin the U.S. is a 46-year-old female, who has some college education,works, and spends more than 20 hours a week providing care to hermother.
> More caregivers are women (61%) than men (39%).
> More caregivers are between the ages of 18-49 years (58%) than are50 years of age or older (42%).
> Many caregivers work either full or part-time while providing care(59%). More than six in ten (62%) working caregivers say they havehad to make some adjustments to their work life as a result of theircaregiving responsibilities.
> Male caregivers are more likely to be working full or part-time (66%)than female caregivers (55%).
> On average, caregivers provide 21 hours of care per week. Nearly half(48%) of all caregivers say they provide eight hours or less of care perweek and one in five (17%) says they provide more than 40 hours ofcare per week. The average length of care is 4.3 years.
> Overall, female caregivers are providing more hours of care and ahigher level of care than male caregivers.
> Because female caregivers give more care, it is not surprising thatwomen are more likely to report experiencing emotional stress as aresult of caregiving than men (40% v 26% in the highest levels ofstress rating).
> Most caregivers say they are in good health with more than eight inten describing their health as excellent (25%), very good (30%), orgood (28%). One in six caregivers (17%) says their health is fair orpoor.
> Caregivers who report their health is fair or poor are more likely tobe Level 5 caregivers, lower income, living with the care recipient,less educated, age 50+.
vi vii
CAREGIVING IN THE UNITED STATES CAREGIVING IN THE UNITED STATES
Detailed FindingsPrevalence of Caregiving in the United StatesWe estimate there are 44.4 million (21% of the adult population) care-givers age 18 and older in the U.S. who provide unpaid care to an adultfamily member or friend who is also age 18 years or older. These care-givers are present in an estimated 22.9 million households (21% of U.S.households).
Number of American Adult Caregivers and Numbersof U.S. Households with Caregivers Age 50+ Key Finding: An estimated 16 percent of American adults, or 33.9million adult caregivers, provide unpaid care to a recipient age 50and older and an estimated five percent, or 10.6 million adult care-givers, help someone age 18 through 49.
Estimated Percent of Caregivers in U.S. and WithinEach Ethnic Group
Nat’l White Black Hispanic AsianCaregivers 21% 21% 21% 16% 18%
Caregivers of 50+ 16% 17% 15% 12% 15%Caregivers of 18-49 5% 4% 6% 4% 3%
Caregiving households 21% 21% 21% 17% 17%
With caregivers helping 50+ 17% 17% 15% 13% 14%With caregivers helping 18-49 4% 4% 6% 4% 3%
Source: Caregiving in the U.S., National Alliance for Caregiving and AARP, 2004.
Unmet Needs of Caregivers> The most frequently reported unmet needs of caregivers are finding
time for one’s self (35%), managing emotional and physical stress(29%), and balancing work and family responsibilities (29%).
> About three in ten caregivers say they need help keeping the personthey care for safe (30%) and finding easy activities to do with theperson they care for (27%).
> One in five caregivers say they need help talking with doctors andother healthcare professionals (22%) or making end-of-life decisions(20%).
> The Internet is the place caregivers turn to most for information(29%), followed by doctors (28%).
> Seven in ten caregivers (73%) say praying helps them cope withcaregiving stress, six in ten caregivers (61%) say they talk with orseek advice from friends or relatives, and four in ten caregivers(44%) say they read about caregiving in books or other materials.
viii 1
CAREGIVING IN THE UNITED STATES CAREGIVING IN THE UNITED STATES
hours per week providing care. Level 5 caregivers typically help withfour ADLs, six IADLs and provide constant care.
Key Finding: The greater the level of caregiver burden (as measuredby the Level of Burden Index), the stronger the impact caregiving hason the caregiver’s perceived health.
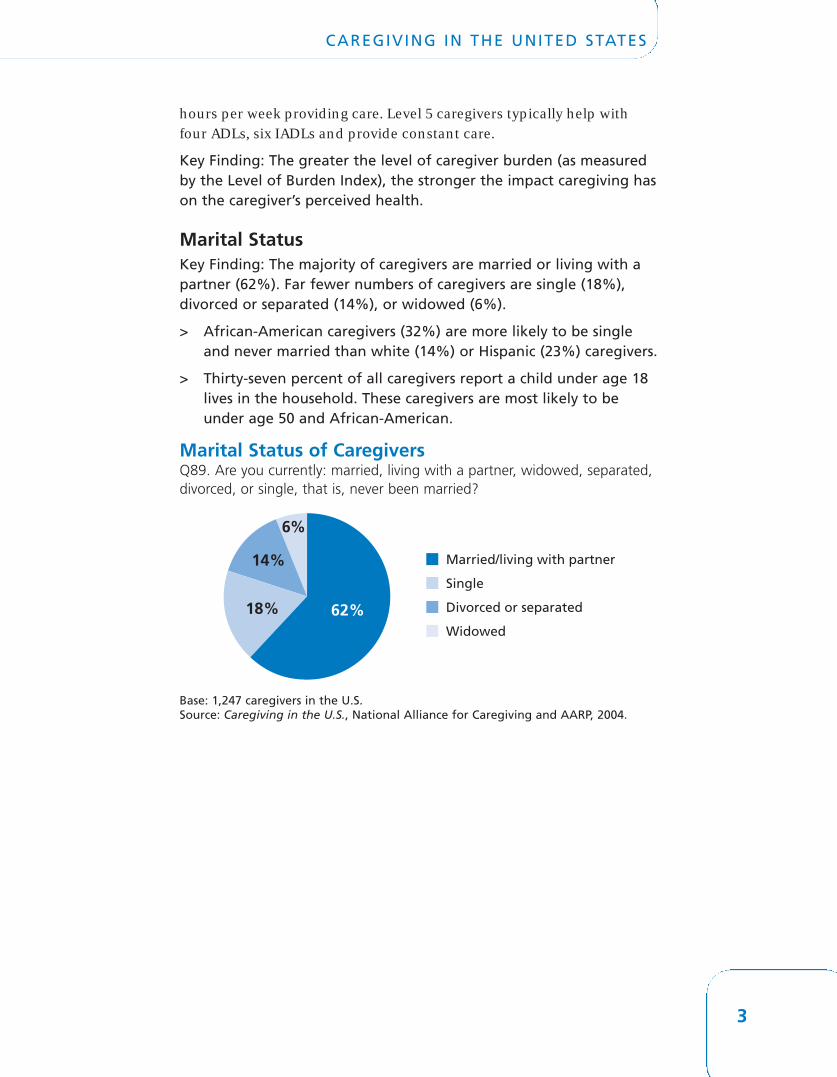
Marital Status Key Finding: The majority of caregivers are married or living with apartner (62%). Far fewer numbers of caregivers are single (18%),divorced or separated (14%), or widowed (6%).
> African-American caregivers (32%) are more likely to be singleand never married than white (14%) or Hispanic (23%) caregivers.
> Thirty-seven percent of all caregivers report a child under age 18lives in the household. These caregivers are most likely to beunder age 50 and African-American.
Marital Status of CaregiversQ89. Are you currently: married, living with a partner, widowed, separated,divorced, or single, that is, never been married?
Base: 1,247 caregivers in the U.S.Source: Caregiving in the U.S., National Alliance for Caregiving and AARP, 2004.
Who Are the Caregivers?The typical caregiver in the United States is a 46-year-old female, whohas some college education, works, and spends more than 20 hours perweek providing unpaid care to her mother.
Gender Key Finding: The caregiving landscape is dominated by women.However, the proportion of men who provide care is substantial (39%).
> Female caregivers are more likely to provide care at the highestLevel of Burden (71% at Level 5 and 58% at Level 1). Male care-givers are more likely to provide care at the lowest Level ofBurden (42% at Level 1 and 29% at Level 5).
> One third (35%) of caregivers say they experience emotionalstress (rate four or five on a five-point scale) as a result of being acaregiver. However, female caregivers (40%) are more likely toreport experiencing emotional stress from caregiving than aremale caregivers (26%).
> Women (42%) are also more likely than men (34%) to report theydidn’t have a choice in becoming a caregiver.
> Male caregivers are more likely to be Asian (54%) than any otherethnic background surveyed.
Age Key Finding: The average age of a caregiver is 46. More than half(58%) of all caregivers are between the ages of 18-49 years.
> Younger caregivers tend to care for younger care recipients.
> Level 5 caregivers are more likely to be age 50 or older (60%)compared to Level 1 caregivers (39%).
> Minority caregivers are more likely to be 18-34 years old thanwhite caregivers.
Level of Burden Background: To measure the intensity of caregiving, caregivers wereclassified into different levels of burden. This was based upon theamount of time per week a caregiver spends helping his or her carerecipient and the number and types of caregiving activities performed.Caregivers were classified into one of five levels, with Level 1 being thelowest in caregiving intensity, and Level 5 being the highest. Each suc-cessive level brings a higher degree of caregiving responsibility ordemand. Level 1 caregivers perform no ADLs and devote relatively few
2 3
CAREGIVING IN THE UNITED STATES CAREGIVING IN THE UNITED STATES
Married/living with partner
Single
Divorced or separated
Widowed
62%18%
14%
6%
hours per week providing care. Level 5 caregivers typically help withfour ADLs, six IADLs and provide constant care.
Key Finding: The greater the level of caregiver burden (as measuredby the Level of Burden Index), the stronger the impact caregiving hason the caregiver’s perceived health.
Marital Status Key Finding: The majority of caregivers are married or living with apartner (62%). Far fewer numbers of caregivers are single (18%),divorced or separated (14%), or widowed (6%).
> African-American caregivers (32%) are more likely to be singleand never married than white (14%) or Hispanic (23%) caregivers.
> Thirty-seven percent of all caregivers report a child under age 18lives in the household. These caregivers are most likely to beunder age 50 and African-American.
Marital Status of CaregiversQ89. Are you currently: married, living with a partner, widowed, separated,divorced, or single, that is, never been married?
Base: 1,247 caregivers in the U.S.Source: Caregiving in the U.S., National Alliance for Caregiving and AARP, 2004.
Who Are the Caregivers?The typical caregiver in the United States is a 46-year-old female, whohas some college education, works, and spends more than 20 hours perweek providing unpaid care to her mother.
Gender Key Finding: The caregiving landscape is dominated by women.However, the proportion of men who provide care is substantial (39%).
> Female caregivers are more likely to provide care at the highestLevel of Burden (71% at Level 5 and 58% at Level 1). Male care-givers are more likely to provide care at the lowest Level ofBurden (42% at Level 1 and 29% at Level 5).
> One third (35%) of caregivers say they experience emotionalstress (rate four or five on a five-point scale) as a result of being acaregiver. However, female caregivers (40%) are more likely toreport experiencing emotional stress from caregiving than aremale caregivers (26%).
> Women (42%) are also more likely than men (34%) to report theydidn’t have a choice in becoming a caregiver.
> Male caregivers are more likely to be Asian (54%) than any otherethnic background surveyed.
Age Key Finding: The average age of a caregiver is 46. More than half(58%) of all caregivers are between the ages of 18-49 years.
> Younger caregivers tend to care for younger care recipients.
> Level 5 caregivers are more likely to be age 50 or older (60%)compared to Level 1 caregivers (39%).
> Minority caregivers are more likely to be 18-34 years old thanwhite caregivers.
Level of Burden Background: To measure the intensity of caregiving, caregivers wereclassified into different levels of burden. This was based upon theamount of time per week a caregiver spends helping his or her carerecipient and the number and types of caregiving activities performed.Caregivers were classified into one of five levels, with Level 1 being thelowest in caregiving intensity, and Level 5 being the highest. Each suc-cessive level brings a higher degree of caregiving responsibility ordemand. Level 1 caregivers perform no ADLs and devote relatively few
2 3
CAREGIVING IN THE UNITED STATES CAREGIVING IN THE UNITED STATES
Married/living with partner
Single
Divorced or separated
Widowed
62%18%
14%
6%
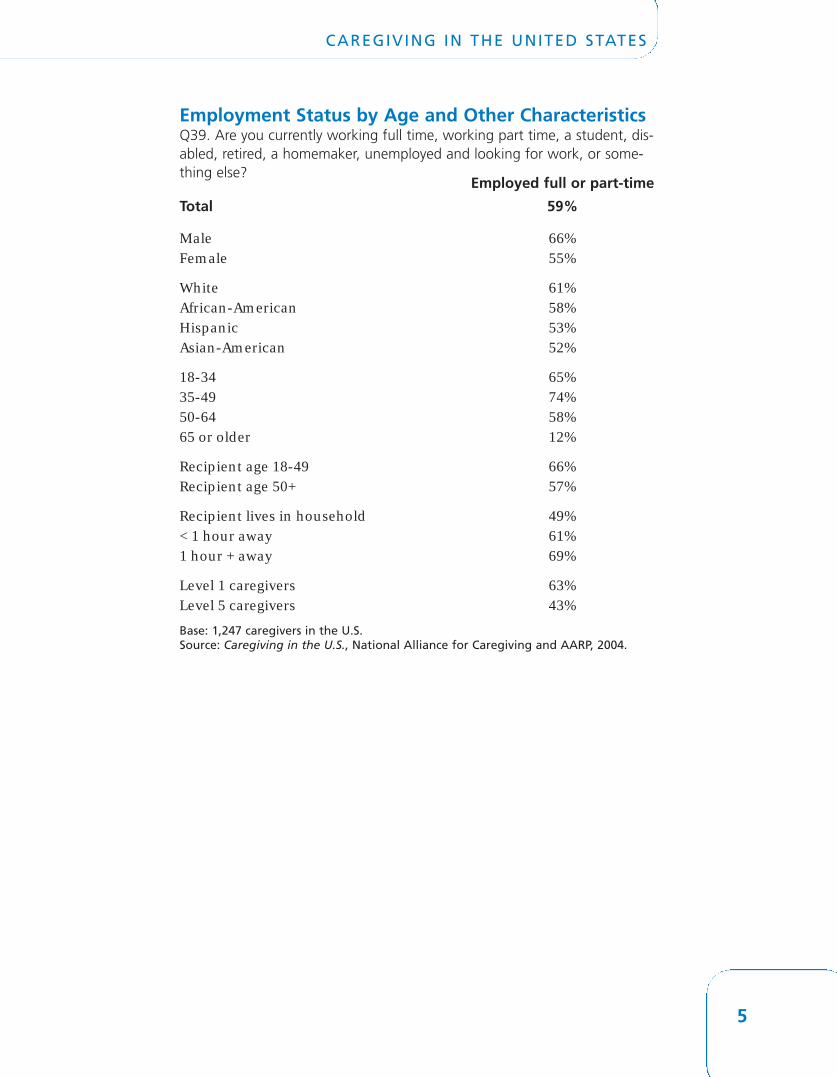
Employment Status by Age and Other CharacteristicsQ39. Are you currently working full time, working part time, a student, dis-abled, retired, a homemaker, unemployed and looking for work, or some-thing else?
Employed full or part-time
Total 59%
Male 66%Female 55%
White 61%African-American 58%Hispanic 53%Asian-American 52%
18-34 65%35-49 74%50-64 58%65 or older 12%
Recipient age 18-49 66%Recipient age 50+ 57%
Recipient lives in household 49%< 1 hour away 61%1 hour + away 69%
Level 1 caregivers 63%Level 5 caregivers 43%
Base: 1,247 caregivers in the U.S.Source: Caregiving in the U.S., National Alliance for Caregiving and AARP, 2004.
Education Key Finding: Almost equal proportions of caregivers have graduatedfrom high school (29%), as those who have some college experience(30%) and those who are college graduates (35%).
> Not surprisingly, a caregiver’s education level and their annualhousehold income are related. Forty-two percent of caregiverswho are high school graduates report an income of $30,000 orless while 36 percent of caregivers who are college graduatesreport an income of $100,000 or more.
> Asian-American caregivers are the most highly educated ethnicgroup in this study with 61 percent having earned a collegedegree or higher.
Employment Status Key Finding: With over 44.4 million Americans providing care toanother adult, the impact on the workplace is substantial. Almost sixin ten caregivers (59%) either work or have worked while providingcare, and 62 percent of caregivers report having had to make somework-related adjustments ranging from going in late and leavingearly to having to give up work entirely.
> More male caregivers say they are working full time (60%) thanfemale caregivers (41%). Caregivers who live more than an houraway from their care recipient (63%) are more likely to work fulltime than caregivers who live with the person they care for (39%).
> More caregivers between the ages of 35-49 (64%) work full timethan do caregivers in the 18-34 year (52%) and 50+ (51%) agebrackets.
> Caregivers with the heaviest caregiving responsibilities are lesslikely to be employed and more likely to be retired than care-givers with less caregiving responsibility.
> More than half of working caregivers (57%) say they have to gointo work late, leave early or take time off during the day to pro-vide care. Fewer working caregivers report having to take a leaveof absence (17%), go from full-time to part-time work (10%), quitworking entirely (6%), lose job benefits (5%), turn down a pro-motion (4%), or choose early retirement (3%).
4 52 U.S. Census Bureau, Current Population Survey, 2002 and 2003 Annual Social and EconomicSupplements, Table 3.
CAREGIVING IN THE UNITED STATES CAREGIVING IN THE UNITED STATES

Characteristics of the Caregiving Situation
Duration of Care of Persons Being Cared For Key Finding: The average length of time caregivers provide care is 4.3years.
Duration of Care for RecipientQ13. For how long [have you been providing/did you provide] help to your(__)? PROMPT: Your best estimate is fine.
Base: 1,247 caregivers in the U.S.Source: Caregiving in the U.S., National Alliance for Caregiving and AARP, 2004.
Duration of Care Caregivers Caregivers All18-49 years 50+ years Caregivers
Occasionally 5% 5% 5%
Less than 1 year 37% 30% 34%
1-4 years 31% 32% 31%
5 or more years 26% 33% 29%
Mean length 3.7 years 4.9 years 4.3 years
> Older caregivers are more likely to say they have provided care for10 years or more, usually for their parent or spouse. Conversely,younger caregivers say they are more likely to have been providingcare for less than six months, mostly to younger care recipients.
Income and Spending Key Finding: Caregivers’ median household income in 2003 was$37,312. (The median household income for people in the U.S. in2002 was $42,409).2
Income of CaregiversQ95. Last year, what was your total annual household income from allsources, before taxes?
Base: 1,247 caregivers in the U.S.Source: Caregiving in the U.S., National Alliance for Caregiving and AARP, 2004.
> Among those providing care to someone 50 or older, the medianhousehold income is $38,125.
> Not counting those who care for a spouse, about half of care-givers contribute financially to the care of their recipient,spending an average of $200 a month.
> A few caregivers spend more per month on out-of-pocketexpenses than others. For example, Level 5 caregivers spend $324per month while primary caregivers spend $232 per month.
> About half of Asian-American caregivers (53%) and White care-givers (42%) report higher household incomes ($50,000 or more)than do African-American caregivers (33%) or Hispanic caregivers(37%).
Military Service> Fourteen percent of all caregivers say they are veterans.
6 7
CAREGIVING IN THE UNITED STATES CAREGIVING IN THE UNITED STATES
0% 20% 40% 60% 80% 100%
Occasionally
<1 year
1-4 years
5+ years
5%
34%
31%
29%
0% 20% 40% 60% 80% 100%
<$30K
$30-49K
$50-99K
$100K+
24%
26%
27%
15%
Living Arrangements of Care RecipientQ6. IF NOT IN HOUSEHOLD, DK, OR REF IN Q4: [Does/Did] your (__) live in:his or her own home, someone else’s home, an independent living or retire-ment community, in an assisted living facility where some care may be pro-vided, a nursing home or facility, somewhere else?
Base: 1,247 caregivers in the U.S.Source: Caregiving in the U.S., National Alliance for Caregiving and AARP, 2004.
> Not surprisingly, care recipients living in nursing homes tend to beolder and to live in an urban setting. Those who live in anassisted living facility are more likely to have an older caregiver.
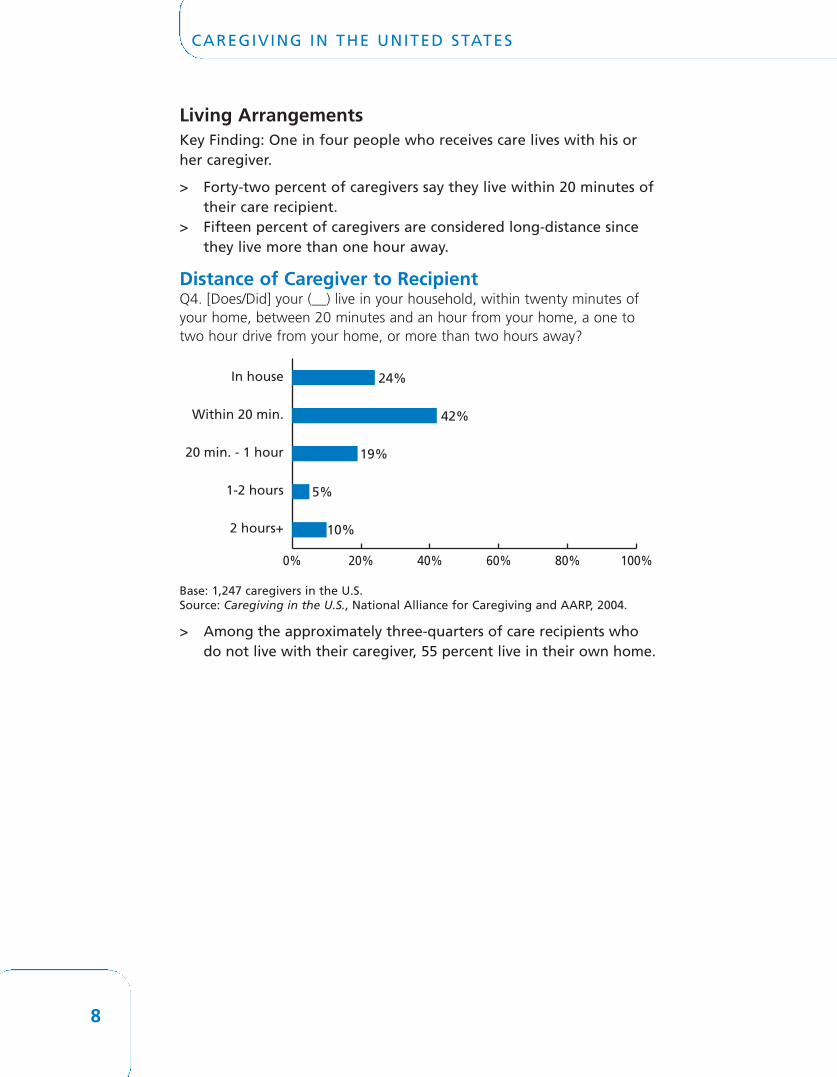
Living Arrangements Key Finding: One in four people who receives care lives with his orher caregiver.
> Forty-two percent of caregivers say they live within 20 minutes oftheir care recipient.
> Fifteen percent of caregivers are considered long-distance sincethey live more than one hour away.
Distance of Caregiver to RecipientQ4. [Does/Did] your (__) live in your household, within twenty minutes ofyour home, between 20 minutes and an hour from your home, a one totwo hour drive from your home, or more than two hours away?
Base: 1,247 caregivers in the U.S.Source: Caregiving in the U.S., National Alliance for Caregiving and AARP, 2004.
> Among the approximately three-quarters of care recipients whodo not live with their caregiver, 55 percent live in their own home.
8 9
CAREGIVING IN THE UNITED STATES CAREGIVING IN THE UNITED STATES
0% 20% 40% 60% 80% 100%
In house
Within 20 min.
20 min. - 1 hour
1-2 hours
2 hours+
24%
42%
19%
5%
10%
Own home
In caregiver’s household
Someone else’s home
Nursing home
Assisted living
Independent living/retirement
55%
24%
8%
5%
4%
3%
0% 20% 40% 60% 80% 100%

Living Arrangements of Care RecipientQ6. IF NOT IN HOUSEHOLD, DK, OR REF IN Q4: [Does/Did] your (__) live in:his or her own home, someone else’s home, an independent living or retire-ment community, in an assisted living facility where some care may be pro-vided, a nursing home or facility, somewhere else?
Base: 1,247 caregivers in the U.S.Source: Caregiving in the U.S., National Alliance for Caregiving and AARP, 2004.
> Not surprisingly, care recipients living in nursing homes tend to beolder and to live in an urban setting. Those who live in anassisted living facility are more likely to have an older caregiver.
Living Arrangements Key Finding: One in four people who receives care lives with his orher caregiver.
> Forty-two percent of caregivers say they live within 20 minutes oftheir care recipient.
> Fifteen percent of caregivers are considered long-distance sincethey live more than one hour away.
Distance of Caregiver to RecipientQ4. [Does/Did] your (__) live in your household, within twenty minutes ofyour home, between 20 minutes and an hour from your home, a one totwo hour drive from your home, or more than two hours away?
Base: 1,247 caregivers in the U.S.Source: Caregiving in the U.S., National Alliance for Caregiving and AARP, 2004.
> Among the approximately three-quarters of care recipients whodo not live with their caregiver, 55 percent live in their own home.
8 9
CAREGIVING IN THE UNITED STATES CAREGIVING IN THE UNITED STATES
0% 20% 40% 60% 80% 100%
In house
Within 20 min.
20 min. - 1 hour
1-2 hours
2 hours+
24%
42%
19%
5%
10%
Own home
In caregiver’s household
Someone else’s home
Nursing home
Assisted living
Independent living/retirement
55%
24%
8%
5%
4%
3%
0% 20% 40% 60% 80% 100%

tify Alzheimer’s or dementia as the main problem or illness afollow-up question that specifically asked about Alzheimer’s orother mental confusion, an additional 17 percent said yes. Takentogether, 23 percent of caregivers report providing care tosomeone with Alzheimer’s, dementia, or other mental confusion.
> Levels 4 and 5 caregivers are more likely to say they are caring forsomeone who has cancer than lower level caregivers. Level 5 care-givers are also more likely to say they are caring for someonewho has had a stroke than Level 1, 2, and 3 caregivers.
> Asian-American caregivers are more likely than other ethnic groupto say being old is their care recipient’s main illness or problem.Hispanic caregivers cite diabetes as their care recipient’s mainhealth problem more than white or Asian-American caregivers.
Main Problems or Illnesses Identified by Caregiver Q11b. What would you say [is/was] the main problem or illness your [carerecipient] has/had?
Base: 1,247 caregivers in the U.S.Source: Caregiving in the U.S., National Alliance for Caregiving and AARP, 2004.
Who Are the Care Recipients?The typical care recipient in the United States is a female, widowed,approximately 66 years old, being cared for by a relative.
Relationship between Caregiver and Care Recipient Key Finding: Most care recipients are related to the person who caresfor them (83%). Care recipients are often the caregiver’s mother(28%), grandmother (9%), or father (8%).
Gender Key Finding: More care recipients are female (65%) than male (31%).
Age Key Finding: More care recipients are older (79% are age 50+) thanyounger (20% are between the ages of 18-49 years).
> The average age of younger care recipients is 33 years; theaverage age of those 50+ is 75 years.
> One in five care recipients (20%) is 85 years of age or older.
> African-American caregivers (27%) are more likely to be caringfor someone under 50 than white caregivers (21%).
Marital Status Key Finding: Forty-two percent of care recipients are widowed, and27 percent are married. Fewer are divorced or separated (15%) or aresingle (14%).
> African-American caregivers are more likely than other ethnicgroup to be helping a single person.
Military Service > Seventeen percent of care recipients are veterans.
Health Status of Care Recipients The types of health problems care recipients experience vary by age.Caregivers who assist younger persons most commonly report their carerecipient as having mental or emotional illness. Caregivers assistingsomeone over 50 say aging or “being old” is the main problem or illnessof their care recipient (see graph on page 11).
> When we asked caregivers an open-ended question about themain problem or illness the person they care for has, only six per-cent of caregivers say the person they care for has Alzheimer’s ordementia. However, when we asked caregivers who did not iden-
10 11
CAREGIVING IN THE UNITED STATES CAREGIVING IN THE UNITED STATES
0% 20% 40% 60% 80% 100%
Old age
Cancer
Diabetes
Mental illness
Heart disease
Alzheimer’s
Stroke
Mobility
Arthritis
Blindness/vision
12%0% 15%
8%4% 9%
7% 23%3%
7%1% 9%
6%0% 8%
5%3% 6%
4%0% 5%
3%2% 3%
5%3% 6%
8%4% 9%
Total
Recipient 18-49 years old
Recipient 50+

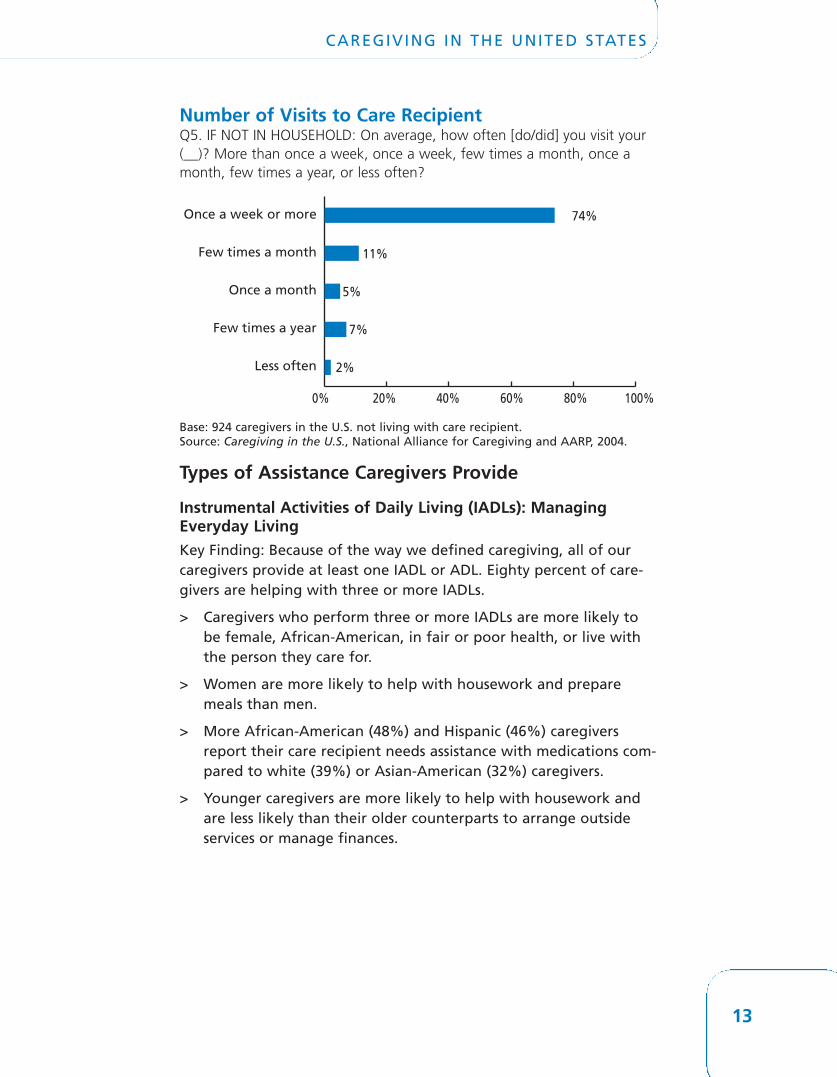
Number of Visits to Care RecipientQ5. IF NOT IN HOUSEHOLD: On average, how often [do/did] you visit your(__)? More than once a week, once a week, few times a month, once amonth, few times a year, or less often?
Base: 924 caregivers in the U.S. not living with care recipient.Source: Caregiving in the U.S., National Alliance for Caregiving and AARP, 2004.
Types of Assistance Caregivers Provide
Instrumental Activities of Daily Living (IADLs): ManagingEveryday LivingKey Finding: Because of the way we defined caregiving, all of ourcaregivers provide at least one IADL or ADL. Eighty percent of care-givers are helping with three or more IADLs.
> Caregivers who perform three or more IADLs are more likely tobe female, African-American, in fair or poor health, or live withthe person they care for.
> Women are more likely to help with housework and preparemeals than men.
> More African-American (48%) and Hispanic (46%) caregiversreport their care recipient needs assistance with medications com-pared to white (39%) or Asian-American (32%) caregivers.
> Younger caregivers are more likely to help with housework andare less likely than their older counterparts to arrange outsideservices or manage finances.
Medication Management Key Finding: Most caregivers (85%) say the person they care for takesprescription medicine. Among caregivers who say the person theycare for takes prescription medicine, 45 percent say the person theycare for needs someone to oversee or manage taking medicine.
> Among caregivers who care for people age 50+, 92 percent saythe person they care for takes prescription medicine.
> In addition, 75 percent of caregivers who assist those withAlzheimer’s say they need to oversee or manage prescriptionmedications for their care recipient.
Intensity of Caregiving: Hours of Care andTypes of Assistance ProvidedThe amount of time spent giving care and the kind of care being pro-vided varies greatly between caregivers. Therefore, it is not surprisingthat some caregivers experience more physical, emotional and financialstress than others.
Hours of Care Provided and Frequency of Visits Key Finding: Caregivers are evenly split between those who say theyspend eight hours or less per week providing care (48%) and thosewho report spending nine hours or more per week providing care(48%).
> On average, caregivers spend 21 hours per week assisting anotherperson.
> Caregivers who provide constant care (40+ hours per week) tendto: > live with the care recipient;
> be in fair or poor health themselves;
> care for someone with Alzheimer’s or dementia;
> have a lower income;
> have a high school education or less.
> Caregivers who spend eight hours or less a week on caregivingare more likely to be male, white, Asian, or employed.
> A majority of caregivers who do not live with the person they carefor say they visit their care recipient at least once a week (74%).
12 13
CAREGIVING IN THE UNITED STATES CAREGIVING IN THE UNITED STATES
0% 20% 40% 60% 80% 100%
Once a week or more
Few times a month
Once a month
Few times a year
Less often
74%
11%
5%
7%
2%

Helping with ADLsQ14-19. I’m going to read a list of kinds of help, which might be providedto a person, if the person cannot do this by him or herself. For each, just tellme if you [provide/provided] this kind of help. [Do/Did] you help your (__)...
Base: 1,247 caregivers in the U.S. Source: Caregiving in the U.S., National Alliance for Caregiving and AARP, 2004.
Performance of ADLs & IADLs:Q14-Q19. I’m going to read a list of kinds of help, which might be providedto a person, if the person cannot do this by him or herself. For each, justtell me if you [provide/provided] this kind of help. [Do/Did] you help your(__)....Q20-Q26. [Do/Did] you provide help for your (__) with:
IADLs Total Level 13 Level 4 Level 5Transportation 82% 73% 90% 95%Grocery shopping 75% 65% 85% 94%Housework 69% 47% 85% 94%Managing finances 64% 60% 72% 76%Preparing meals 59% 32% 79% 97%Giving medicines 41% 13% 65% 85%Arranging services 30% 16% 45% 51%Three or more IADLs 80% 63% 93% 100%None of these IADLs * — — —
ADLs Total Level 13 Level 4 Level 5In/out of bed and chairs 36% — 67% 83%Dressing 29% — 61% 88%Bathing 26% — 51% 83%Toileting 23% — 47% 68%Feeding 18% — 30% 44%Continence/diapers 16% — 29% 53%Three or more ADLs 26% — 53% 84%None of these ADLs 50% 100% 9% —
Base: 1,247 caregivers in the U.S.Source: Caregiving in the U.S., National Alliance for Caregiving and AARP, 2004.
Helping with IADLsQ20-26. [Do/Did] you provide help for your (__) with:
Base: 1,247 caregivers in the U.S.Source: Caregiving in the U.S., National Alliance for Caregiving and AARP, 2004.
> Caregivers at different income and education levels tend to per-form different types of IADLs. For example, caregivers with lowerincomes and less education tend to help with everyday tasks suchas grocery shopping, housework, and meal preparation. Caregiverswith higher incomes and more education tend to help witharranging outside services from agencies. Higher income care-givers are also more likely to assist with managing the care recip-ient’s finances.
Activities of Daily Living (ADLs): Personal Care Key Finding: Half of all caregivers perform the difficult tasks involvedin personal care.
> Providing help getting in and out of bed and chairs, gettingdressed, and personal grooming are the most commonly per-formed ADLs.
> While half of all caregivers say they perform at least one form ofpersonal care (ADL), less than one in five (18%) says they havereceived formal training on how to care for their recipient. African-American caregivers are more likely to report having received someformal training than Asian-American or white caregivers.
> Male caregivers are less likely to help with dressing, bathing orshowering, and dealing with incontinence than female care-givers. The same is true of younger caregivers compared to oldercaregivers.
14 15
CAREGIVING IN THE UNITED STATES CAREGIVING IN THE UNITED STATES
Transportation
Grocery shopping
Housework
Managing finances
Preparing meals
Helping with medication
Managing services
82%
75%
69%
64%
59%
41%
30%
0% 20% 40% 60% 80% 100%
% saying yes
Getting in and out of beds and chairs
Getting dressed
Helping bathe or shower
Getting to and from the toilet
Feeding care recipient
Dealing with incontinence or diapers
36%
29%
26%
23%
18%
16%
0% 20% 40% 60% 80% 100%
% saying yes
3 By definition, Level 1 caregivers perform one or more IADLs, but no ADLs. See DetailedMethodology for a full description of the Level of Burden Index.

Other Unpaid HelpQ31. Has anyone else provided unpaid help to your (__) during the last 12months?
Primary Secondary TotalCaregivers Caregivers Caregivers
Any relative 87% 89% 88%
Daughter 39% 43% 42%
Son 24% 26% 26%
Non-relative 12% 10% 11%
Base: 1,247 caregivers in the U.S. Source: Caregiving in the U.S., National Alliance for Caregiving and AARP, 2004.
> African-American caregivers (12%) are much more likely toreceive help from the recipient’s niece or nephew than white(4%), Asian-American (4%), or Hispanic (2%) caregivers.
Paid Care Key Finding: Four in ten caregivers who help someone not living in anursing home report using paid care in the past year. The mostcommon type of paid care is the use of an aide or nurse obtainedthrough an agency or a housekeeper.
Type of Paid CareQ34-36. IF NOT IN NURSING HOME: During the past 12 months, did your(__) receive paid help from any of the following—regardless of who paid forit. First:
Base: 1,191 caregivers in the U.S. not living in a nursing home.Source: Caregiving in the U.S., National Alliance for Caregiving and AARP, 2004.
> Caregivers most likely to use paid help are older, college edu-cated, upper income, and caring for someone with Alzheimer’s ordementia.
Home Modifications and Assistive Devices Key Finding: Forty percent of caregivers say they have obtained anassistive device to make it easier to care for the person they help andnearly 40 percent have modified the home to make it easier to pro-vide care.
> Caregivers with a Level of Burden between 3-5, and those helpingsomeone with Alzheimer’s or dementia, are more likely than othersto have made home modifications or obtained assistive devices.
> Not surprisingly, caregivers who have greater financial resources aremore likely to make home modifications than those who do not.
Caregiver Support: Who Else HelpsProvide Care? Many caregivers receive unpaid help from others. This assistance mostcommonly comes from the recipient’s children. Caregivers who havehigher incomes and those who have higher Levels of Burden use paidhelp more.
Primary vs. Secondary Caregivers Key Finding: Although many caregivers receive help from others, themajority of caregivers (57%) say they are the primary caregiver andreceive no other unpaid help or they consider themselves to providemost of the unpaid help. Thirty-seven percent of caregivers say noone else provided unpaid help during the last 12 months. Almost sixin ten (59%) say they did not receive paid help during the last 12months from four categories of helpers including nurses, aides, orhousekeepers.
> Caregivers who provide most of the help are typically caring forsomeone age 18-49. They are most likely to be female, older,unemployed or have an income less than $30,000. They provideat least 21 hours of higher level of care each week.
Unpaid CareKey Finding: Nearly six in ten caregivers (59%) say that someone else,usually the recipient’s daughter or son, helped provide unpaid care inthe past year.
16 174 Personal correspondence dated March 25, 2004 from John Crews, DPA, Health Scientist, Centersfor Disease Control and Prevention.
CAREGIVING IN THE UNITED STATES CAREGIVING IN THE UNITED STATES
Aide or nurse through an agency
Hired housekeeper
Other
Aide or nurse independent of an agency
23%
20%
12%
7%
0% 20% 40% 60% 80% 100%

Proportion of caregivers who say their own health isfair or poor87. How would you describe your own health? Is it excellent, very good,good, fair, or poor?
Base: 1,247 caregivers in the U.S.Source: Caregiving in the U.S., National Alliance for Caregiving and AARP, 2004.
Emotional Health Key Finding: Caregiving appears to create more emotional stress thanphysical strain. One-third (35%) of caregivers say taking care of theperson they help rates a four or five on a five-point scale where fiveis very stressful. Approximately one in four (27%) say taking care ofthe person they help is not at all stressful.
> The two greatest predictors of emotional stress are the caregivers’Level of Burden and whether or not they feel they had a choicein assuming the role of caregiver. Caregivers at the highest Levelof Burden and those who feel they had no choice perceive thehighest levels of emotional stress. Other factors associated withcaregivers’ emotional stress are caregivers’ reported health, livingin the same household with the care recipient, and being female.
> Nearly four in ten caregivers (39%) say they feel they had nochoice in taking on the role of a caregiver, and half of thesepeople feel their situation is emotionally stressful. Conversely, justa quarter of those who felt they did have a choice in becoming acaregiver report experiencing emotional stress at the highestlevels.
> Those who say they had no choice in becoming a caregiver tendto be female, primary caregivers, live with the care recipient, saythey are in fair to poor health and provide the highest levels ofcare.
Stress and Strain of Caregiving Most caregivers report low emotional stress, physical strain, and finan-cial hardship as a result of caregiving.
Impact on Caregiver’s Physical and Emotional HealthPhysical HealthKey Finding: A majority of caregivers say they are in good health.The two greatest predictors of caregivers’ physical strain are the care-givers’ reported health and whether they felt they had a choice intaking on caregiving responsibilities.
> Twenty-five percent describe their health as excellent, 30 percentsay their health is very good, and 28 percent say their health isgood. About one in six (17%) considers their health as fair orpoor. In general, about six in ten members of the adult popula-tion in the U.S. say their health is very good or excellent, three inten say their health is good, and one in ten says their health isfair or poor.4
> Almost three in four caregivers say being a caregiver has had noeffect on their health. Caregivers who report caregiving has madetheir health worse tend to be lower income, women, age 50+,provide higher levels of care, and live with the person they pro-vide care for.
> Few caregivers say caregiving is a physical strain. Only 15 percentrate physical strain from caregiving a four or five on a five-pointscale (where five is very much and one is not at all).
> The two greatest predictors of physical strain are caregivers’reported health and whether they felt they had a choice in takingon caregiving responsibilities. Caregivers who report poorerhealth and those that feel they did not have a choice in taking onthis role perceived the greatest physical strain. Level of Burden isanother factor contributing to caregivers’ physical strain. Thehigher the Level of Burden, the greater the caregivers’ perceivedphysical strain.
18 19
CAREGIVING IN THE UNITED STATES CAREGIVING IN THE UNITED STATES
All caregivers
Level 5 caregivers
Lower income (<$30K)
Living with care recipient
Caregivers 50 or older
Lower educated (HS or less)
17%
35%
28%
26%
24%
24%
0% 20% 40% 60% 80% 100%
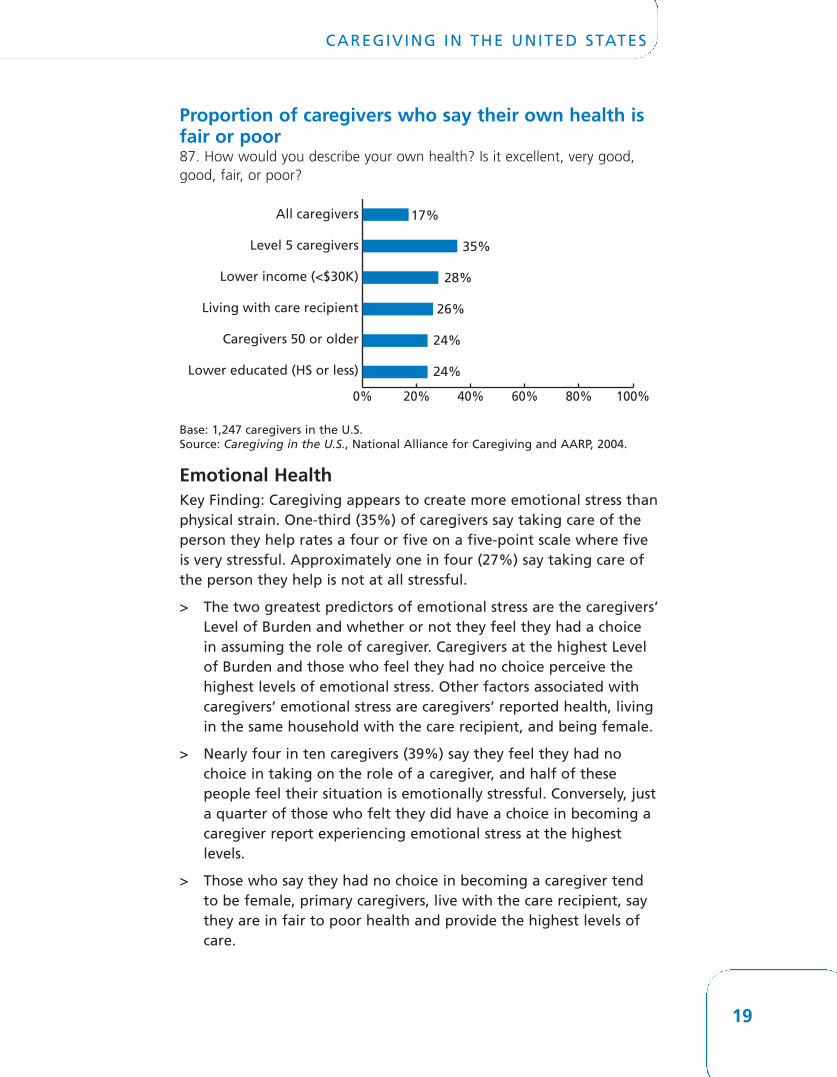
Proportion of caregivers who say their own health isfair or poor87. How would you describe your own health? Is it excellent, very good,good, fair, or poor?
Base: 1,247 caregivers in the U.S.Source: Caregiving in the U.S., National Alliance for Caregiving and AARP, 2004.
Emotional Health Key Finding: Caregiving appears to create more emotional stress thanphysical strain. One-third (35%) of caregivers say taking care of theperson they help rates a four or five on a five-point scale where fiveis very stressful. Approximately one in four (27%) say taking care ofthe person they help is not at all stressful.
> The two greatest predictors of emotional stress are the caregivers’Level of Burden and whether or not they feel they had a choicein assuming the role of caregiver. Caregivers at the highest Levelof Burden and those who feel they had no choice perceive thehighest levels of emotional stress. Other factors associated withcaregivers’ emotional stress are caregivers’ reported health, livingin the same household with the care recipient, and being female.
> Nearly four in ten caregivers (39%) say they feel they had nochoice in taking on the role of a caregiver, and half of thesepeople feel their situation is emotionally stressful. Conversely, justa quarter of those who felt they did have a choice in becoming acaregiver report experiencing emotional stress at the highestlevels.
> Those who say they had no choice in becoming a caregiver tendto be female, primary caregivers, live with the care recipient, saythey are in fair to poor health and provide the highest levels ofcare.
Stress and Strain of Caregiving Most caregivers report low emotional stress, physical strain, and finan-cial hardship as a result of caregiving.
Impact on Caregiver’s Physical and Emotional HealthPhysical HealthKey Finding: A majority of caregivers say they are in good health.The two greatest predictors of caregivers’ physical strain are the care-givers’ reported health and whether they felt they had a choice intaking on caregiving responsibilities.
> Twenty-five percent describe their health as excellent, 30 percentsay their health is very good, and 28 percent say their health isgood. About one in six (17%) considers their health as fair orpoor. In general, about six in ten members of the adult popula-tion in the U.S. say their health is very good or excellent, three inten say their health is good, and one in ten says their health isfair or poor.4
> Almost three in four caregivers say being a caregiver has had noeffect on their health. Caregivers who report caregiving has madetheir health worse tend to be lower income, women, age 50+,provide higher levels of care, and live with the person they pro-vide care for.
> Few caregivers say caregiving is a physical strain. Only 15 percentrate physical strain from caregiving a four or five on a five-pointscale (where five is very much and one is not at all).
> The two greatest predictors of physical strain are caregivers’reported health and whether they felt they had a choice in takingon caregiving responsibilities. Caregivers who report poorerhealth and those that feel they did not have a choice in taking onthis role perceived the greatest physical strain. Level of Burden isanother factor contributing to caregivers’ physical strain. Thehigher the Level of Burden, the greater the caregivers’ perceivedphysical strain.
18 19
CAREGIVING IN THE UNITED STATES CAREGIVING IN THE UNITED STATES
All caregivers
Level 5 caregivers
Lower income (<$30K)
Living with care recipient
Caregivers 50 or older
Lower educated (HS or less)
17%
35%
28%
26%
24%
24%
0% 20% 40% 60% 80% 100%

Impact of Caregiving on Family andLeisure Activities Half of caregivers say their caregiving has resulted in less time for familyand friends. A substantial proportion also report giving up vacations,hobbies or other social activities as a result of caregiving responsibilities.
Impact of Caregiving on Family and Leisure ActivitiesQ53-55. There may have been other ways in which providing care to your(__) has affected your life. As a caregiver …
Base: 1,247 caregivers in the U.S.Source: Caregiving in the U.S., National Alliance for Caregiving and AARP, 2004.
> Caregivers who experience the greatest impact on family andleisure activities are primary caregivers, those residing with thecare recipient, those who provide the highest levels of care, andwho consider their own health to be fair or poor.
Coping with StressCaregivers say they deal with the demands of caregiving by using var-ious coping mechanisms. The most common are praying (73%) andtalking with friends or relatives (61%). Reading about caregiving (44%),exercising (41%), and going on the Internet to find information (33%)are other ways they say they cope with the demands of caregivng.Smaller percentages of caregivers seek help from professional or spiri-tual counselors (27%) and fewer use medication (12%) to cope.
Coping with Demands of CaregivingQ60-67. I’m going to read a list of ways that caregivers such as yourselfhave coped with the demands of caregiving. For each one, please tell mewhether you have used any of these. [Have/Did] you ever [tried/try] to copewith caregiving stress by:
Base: 1,247 caregivers in the U.S.Source: Caregiving in the U.S., National Alliance for Caregiving and AARP, 2004.
> While many caregivers report praying as a way to cope with thedemands of caregiving, African-American (84%) and Hispanic(79%) caregivers use this method of coping significantly morethan white (71%) or Asian-American (50%) caregivers.
> More women (80%) than men (61%) say praying is a way theycope with caregiving demands. Women also tend to cope bytalking with friends or relatives (67%) more than men (51%).
> Those more likely to use the Internet as a tool for dealing withcaregiving demands include Asian-American caregivers (43%), col-lege educated (41%) and upper income (44% of those making$100,000+) caregivers as well as those helping someone withAlzheimer’s or dementia (42%).
20 21
CAREGIVING IN THE UNITED STATES CAREGIVING IN THE UNITED STATES
Less time for friends or family 51%
44%
26%
Give up vacations, hobbies,social activities
Get less exercise than before
0% 20% 40% 60% 80% 100%
% saying yes
Praying 73%
61%
44%
41%
33%
27%
12%
0% 20% 40% 60% 80% 100%
Reading about caregiving
Exercising or working out
Talking with or seeking advice fromfriends or relatives
Going on the Internetto find information
Talking to a professional orspiritual counselor
Taking medication% saying yes
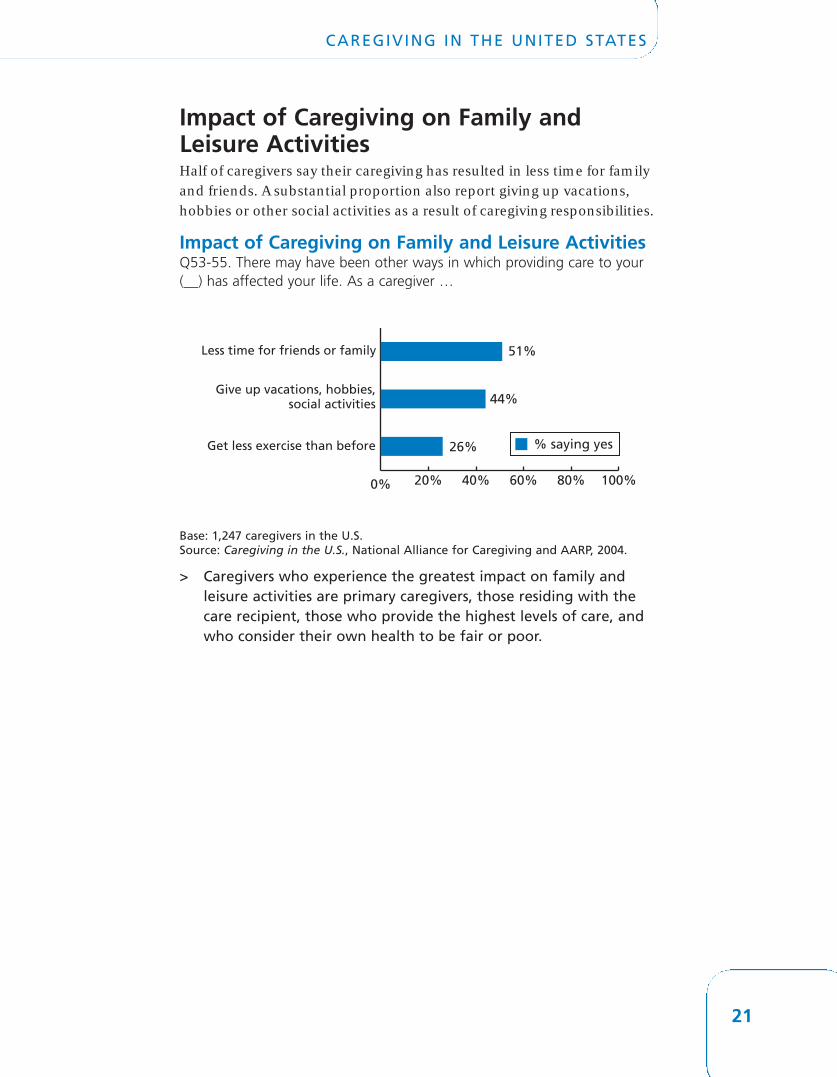

Financial Hardship on Caregivers Only twelve percent of caregivers say caregiving is a financial hardshipfor them (rate it a four or five on a five-point scale where one is no hard-ship at all and five is a great deal of hardship). More than three in four(77%) report that caregiving is very little financial hardship (rate it oneor two on a five-point scale).
> Our analysis shows that the two greatest predictors of caregivers’perception of financial hardship are Level of Burden and whetherthey felt they had a choice in taking on caregiving responsibili-ties. Caregivers at higher Levels of Burden and those who do notfeel they had a choice to take on this role report greater financialhardship. Other factors contributing to financial hardship are thecaregiver’s age, health, living with the care recipient, and income.The older the caregiver, the poorer the caregiver’s perceivedhealth, and living with the care recipient and having a lowerincome increase the reported level of hardship.
> Level 5 caregivers are more likely to say they experience financialhardship (35%) than caregivers at other Levels of Burden, andthey are more likely to say they have requested informationabout financial help for their care recipient than caregivers atLevel 1 (20%), Level 2 (23%), and Level 3 (21%).
> Caregivers who report their annual income is less than $30,000are more likely to say caregiving is a financial hardship (rate it asa four or five on a five-point scale) than caregivers who reporttheir annual household income is $30,000 or more.
> Caregivers who help younger care recipients (25%) are morelikely to say caregiving is a financial hardship than those whoassist older care recipients (9%).
> Younger caregivers (35% of those 18-49 years) are more likely tosay they experience financial hardship as a result of being a care-giver than older caregivers (22% of those age 50+).
> African-American caregivers (22%) say they experience financialhardship as a result of caregiving more than other ethnic groupsHispanic (14%), Asian-American (11%) or white (10%) caregivers.
> Caregivers who live with the person they provide care for are morelikely to say they experience financial hardship as a result of care-giving than those who do not live with the person they care for.
Impact of Caregiving on Work Fifty-nine percent of caregivers say they are currently working (48% full time and 11% part time), or have worked at some time whilebeing a caregiver. More than six in ten (62%) of these working caregiverssay their caregiving responsibilities have led them to make adjustmentsto their work life, including such things as reporting late to work,leaving early, or taking time off, taking a leave of absence or leaving theworkforce entirely.
> Making schedule changes such as going to work late, leavingearly or taking time off during the day to provide care, is themost frequently reported work adjustment (57%).
> Those most likely to say they have made one or more workschedule adjustments are:
> female;
> primary caregivers;
> caregivers at higher Levels of Burden;
> those between the ages of 35-64;
> African-American caregivers;
> those living with the care recipient;
> those helping someone with Alzheimer’s or dementia.
> More than one third of Level 5 caregivers (35%) say they chose togive up work entirely as a result of their caregiving responsibili-ties and 12% chose early retirement.
Work-Related Adjustments by Level of BurdenQ41-Q47. IF WORKING WHILE A CAREGIVER: In your experience as both aworker and a caregiver, did you ever:
TOTAL Level Level Level Level Level1 2 3 4 5
Go in late, leave early, etc. 57% 40% 51% 63% 75% 83%
Take leave of absence 17% 8% 17% 14% 22% 41%
Go from full-time to part-time 10% 3% 7% 9% 15% 37%
Give up work entirely 6% 1% 3% 4% 4% 35%
Lose any job benefits 5% 2% 2% 5% 9% 15%
Turn down promotion 4% 2% 3% 5% 6% 14%
Choose early retirement 3% 1% 1% 2% 3% 12%
None of the above 38% 57% 44% 31% 21% 8%
Base: 935 caregivers employed while caregiving.Source: Caregiving in the U.S., National Alliance for Caregiving and AARP, 2004.
22 23
CAREGIVING IN THE UNITED STATES CAREGIVING IN THE UNITED STATES

Unmet Needs for Help, Information orSupportFinding time for oneself, keeping the care recipient safe at home, andbalancing work and family responsibilities are the top unmet needsidentified by caregivers (see graph on page 26).
> Minority caregivers (Hispanic 80%, African-American 75% andAsian-American 73%) are much more likely to say they need morehelp with information than white caregivers (64%).
> Caregivers of those with Alzheimer’s or dementia and those pro-viding the highest level of care say they need help or additionalinformation more often than other caregivers.
> Of caregivers already receiving an outside service, almost eight inten (79%) say they need more help or information about at leastone of the unmet needs listed.
> Fulfilling personal needs, such as managing stress, finding timefor oneself, and balancing work and family are more likely to bementioned as a need by female caregivers, caregivers under 65,and those living with their care recipient.
Supportive Services in the CommunitySupportive services are used by almost half of all caregivers (48%). One-quarter of caregivers say they requested information about financialhelp for their care recipient.
> Those caring for someone with Alzheimer’s or dementia are morelikely to use outside services than other caregivers.
> Caregivers whose care recipient lives in an urban setting (58%)are more likely than caregivers helping someone in a suburban(42%) or rural setting (44%) to say they use supportive services.Caregivers who live with their care recipient tend to seek sup-portive services more often than caregivers who live within anhour of the person they care for.
> Midlife caregivers age 50-64 (55%) and those age 65+ (56%) aremore likely to use supportive services than younger caregivers(40%).
> More Asian-American (12%), African-American (11%), and white(7%) caregivers say they have taken part in support groups thanHispanic (3%) caregivers.
Use of Outside ServicesQ71-78. In your experience as a caregiver, [have/did] you ever…
Base: 1,247 caregivers in the U.S. Source: Caregiving in the U.S., National Alliance for Caregiving and AARP, 2004.
24 25
CAREGIVING IN THE UNITED STATES CAREGIVING IN THE UNITED STATES
Requested info about financial help
Obtained formal training
Used transportation service
Used service such as Meals on Wheels
Enrolled recipient in recreation camp
Took part in support groups
Enrolled recipient in Adult Day Care
Used respite service
25%
18%
18%
11%
8%
7%
5%
5%
0% 20% 40% 60% 80% 100%

Where Caregivers Go For Information Key Finding: Almost three in ten caregivers say they get informationon caregiving from the Internet (29%) or a doctor (28%). Smallerpercentages rely on family and friends (15%) or other health profes-sionals (10%) for their caregiving information. Other sources of infor-mation on caregiving, such as libraries, employers, and senior centers,were identified by too few caregivers to be significant.
> Those who turn to the Internet for information are likely to havea higher income and be college educated. Forty-one percent saythey live an hour or more away from their care recipient.
> Level 5 caregivers (42%), those living with their care recipient(36%) and caregivers who help someone age 50 or older (31%),are more likely to obtain caregiving information from a doctor.
> Younger caregivers are more likely to turn to friends and familyfor information about caregiving.
Caregivers in Ethnic SubgroupsOverall, African-American, Hispanic and Asian-American caregiversprovide similar types of care and experience similar stresses regardlessof ethnic background. The following bullets report statistically signifi-cant differences based on ethnicity. When an ethnic group is not men-tioned, the difference was not significant.
African-American Caregivers > African-American caregivers are more likely to have children
under age 18 living in the household than caregivers from otherethnic groups (53% v 35% white, 39% Hispanic, 34% Asian). Theyare also more likely to be single, never married (32% v 14%white, 23% Hispanic caregivers) and less likely to be married(13% v 28% white, 30% Hispanic, 33% Asian caregivers).
> Among caregivers who do not live with the person they care for,African-Americans are more likely to say they visit the personthey care for more than once a week (65% v 55% white, 44%Asian-American caregivers).
> African-American caregivers are more likely to live in urban areas(49% v 24% white, 35% Asian-American caregivers). African-American care recipients are also more likely to live in urbanareas (49% v 28% white care recipients).
Unmet NeedsQ82a-n. As a caregiver, on which of the following do you [need/needed]more help or information:
Base: 1,247 caregivers in the U.S.Source: Caregiving in the U.S., National Alliance for Caregiving and AARP, 2004.
26 27
CAREGIVING IN THE UNITED STATES CAREGIVING IN THE UNITED STATES
35%
30%
29%
29%
27%
22%
20%
16%
14%
13%
13%
11%
8%
5%
0% 20% 40% 60% 80% 100%
Finding time for myself
Keeping the person I care forsafe at home
Balancing my work andfamily responsibilities
Managing my emotionaland physical stress
Easy activities I can do withthe person I care for
How to talk with doctors
Making end-of-life decisions
Moving or lifting the person I care for
Managing challenging behaviors,such as wandering
Choosing an assisted living facility
Choosing a home care agency
Choosing a nursing home
Finding non-English educational materials
Managing incontinenceor toileting problems
% saying yes

Hispanic Caregivers > Like African-American caregivers, Hispanic caregivers are likely to
spend more than eight hours a week providing care.
> Hispanic caregivers are more likely to say they live with theperson they care for (34% v 22% white caregivers) and they arealso more likely to say they help the person they care for with atleast one ADL (59% v 48% white caregivers).
> Hispanic caregivers are more likely to say they are Level 4 or 5caregivers (41%) and have given up vacations, hobbies or theirown social activities (48% v 35% African-American caregivers).
Asian-American Caregivers > Asian-American caregivers stand out as being well educated (61%
have at least four years of college v 36% white, 30% African-American, 27% Hispanic caregivers).
> Asian-American caregivers also report higher household incomesthan others (53% report a household income of $50,000+ v 42%white, 33% African-American, 38% Hispanic caregivers).Therefore, it is not surprising that Asian-American caregivers areless likely to say caregiving is a financial hardship.
> Like white caregivers, Asian-American caregivers are more likelyto say the person they care for lives in the suburbs (43% v 27%African-American, 28% Hispanic caregivers). Similarly, Asian-American caregivers are more likely to say they live in the sub-urbs (56% v 40% white, 34% African-American, 37% Hispaniccaregivers).
> Asian-American caregivers are less likely to say the person theycare for has Alzheimer’s or other dementia (86% v 75% white,72% African-American, 75% Hispanic caregivers).
> Asian-American caregivers are less likely to report emotionalstress (only 23% rate a 4 or 5, on a 5-point scale where five is verystressful v 36% white, 36% Hispanic caregivers).
> Asian-American caregivers are more likely to say they tried tocope with stress by going to the Internet to seek information(43% v 33% white, 29% African-American caregivers).
29
CAREGIVING IN THE UNITED STATES
> African-American caregivers are more likely to say they have beenemployed since becoming a caregiver (68% v 56% white care-givers). They are also more likely to say they spend between $101-$500 in a typical month for groceries, medicines, or other kinds ofcash support for the non-spousal person they care for (36% v22% white caregivers). Therefore, it is not surprising that African-American caregivers are more likely to say caregiving is a financialhardship (22% say 4 or 5 on a 5-point scale v 10% white, 14%Hispanic and 11% Asian caregivers). African-American caregiversare also more likely to ask for information on how to get finan-cial help for the person they take care of (30% v 19% Asian-American caregivers).
> African American caregivers are more likely to say they performthree or more IADLs for the person they care for (88% v 78%white, 79% Asian-American caregivers). They are also more likelyto say they obtained formal training of some sort about how tocare for their care recipient (25% v 17% white and 15% Asian-American caregivers).
> African-American caregivers are more likely to say they give medi-cine, pills or injections to the person they care for (48% v 39%white, 32% Asian-American caregivers). These caregivers are morelikely to say they need to know more about the prescription med-ication the person they care for takes (28% v 20% white care-givers).
> African-American caregivers are more likely to say they obtainedtransportation services for the person they care for (28% v 16%white, 18% Hispanic caregivers).
> African-American caregivers are more likely to say they cope withcaregiving stress by praying (84% v 71% white, 50% Asian-American caregivers). African-American caregivers are also morelikely to say they cope with caregiving stress by talking to a pro-fessional or spiritual counselor (35% v 26% white, 25% Hispanic,21% Asian-American caregivers).
28
CAREGIVING IN THE UNITED STATES

Comparison of Caregivers by Age ofRecipient
Key differences between caregivers of persons age 50 and over and per-sons age 18-49 are summarized in the following table.
Comparing Caregivers Characteristics by Age ofRecipient
Recipients 18 - 49 Recipients 50 or older
Average recipient age 33 75
Relationship Adult child, sibling, Mother, grandmotheror non-relative or father
Problems/Illnesses Mental illness Aging, Alzheimer’sdepression, or cancer, diabetes,
emotional problems, heart disease, mobility,financial problems blindness
Average caregiver age 41 47
Demographics Working Retired, married
Support Primary caregivers Get more paidFeel financial hardship Provide three or more
activities of daily living
Base: 1,247 caregivers in the U.S.Source: Caregiving in the U.S., National Alliance for Caregiving and AARP, 2004.
31
CAREGIVING IN THE UNITED STATES
White Caregivers > White caregivers are more likely to say they are age 50 or older
than members of other ethnic groups (46% white, 29% African-American, 34% Hispanic, 35% Asian-American caregivers).
> Like Asian-American caregivers, white caregivers tend to reporthigher incomes (42% make $50,000+). However, unlike Asian-American caregivers, white caregivers are more likely to say theyare currently providing care (68% v 56%).
> While a large proportion of white caregivers say they live in asuburb (40%), white caregivers are more likely to say they live ina rural area (34% v 15% African-American, 19% Hispanic, 9%Asian-American caregivers). White caregivers are also more likelyto say the person they care for lives in the suburbs (40% v 27%African-American, 28% Hispanic caregivers).
> Like Hispanic caregivers, white caregivers are likely to say theyhave given up vacations, hobbies, or their own social activities(45% v 35% African-American caregivers). Yet white caregiversare less likely to say caregiving is a physical strain (69% v 61 %African-America caregivers), and they are more likely to say care-giving is not a financial hardship (79% v 66% African-American).
> White caregivers are also less likely to say they feel a need formore help or information keeping the person they care for safeat home, balancing their work and family responsibilities, findingeasy activities they can do with the person they care for, movingor lifting the person they care for than African-American,Hispanic or Asian-American caregivers.
30
CAREGIVING IN THE UNITED STATES

32
CAREGIVING IN THE UNITED STATES
Summary and ConclusionsCaregivers are a diverse group. Their caregiving experiences range fromthose that are relatively easy to manage, to those that are burdensome.We know that most caregivers today are able to fulfill this role withoutexperiencing overwhelmingly negative physical, emotional, or financialconsequences. We also know that being a caregiver makes those whocarry the heaviest responsibilities vulnerable to risks associated withpoorer health, emotional stress, and economic hardship.
As the baby boom generation ages over the next 25 years, the ranks ofthose needing care will swell and the numbers of those available to pro-vide care are likely to dwindle. This suggests that in the future, our care-givers may feel even less choice about becoming a caregiver than theydo today. It also suggests that they may provide care to two, three, oreven more care recipients. Even if the care recipient has “simple” needs,the sheer numbers of people needing help may increase the caregiverburden.
Indicators from this survey, as well as a weak economy and the aging ofthe baby boomers, tell us that those who provide unpaid care deserveour attention and our assistance.
It is important that we use information from this study to do at leastthree things. First, we need to help current at-risk caregivers so that theycan continue to provide care to family and friends without sacrificingtheir health, financial security and quality of life in the process.Secondly, we need to expand current caregiver programs to include allcaregivers regardless of the age of their care recipient. Thirdly, we needto begin to prepare for the future. This includes encouraging familymembers to plan ahead and discuss their changing needs as they age, aswell as advocating for more public funding for policies and programsthat provide needed services for the long-term care population.
33
APPENDIX
Appendix A: Topline ResultsInterviewing conducted September 5 through December 22, 2003,among N = 1,247 caregivers 18 and older in the United States.
Screening questions, used to identifycaregiver respondents at the outset ofthe interviews for the national study,show the following:
In the U.S.Percent of adults who are caregivers 21%
Number of caregivers 44,443,800
Percent of households with caregiver(s) 21%
Number of households with caregiver(s) 22,901,800
Percents may add up to 99% or 101% due to rounding. Data are weighted bygender, age, and race. Margin of sampling error is + 2.8 percentage points. * indi-cates less than 1%, and — indicates zero.
This survey is part of an important national study conducted by AARPand the National Alliance for Caregiving. We really appreciate your par-ticipation. IF HELPFUL, INTERVIEWER MAY TELL RESPONDENT: Thisis a national survey, and although individual answers are confidential,the results from the overall survey will be published. If you’d like, wecould send you a copy of the final report.
1a. Are you currently providing unpaid help to a relative or friend 18 years orolder, or, was this something you did in the past 12 months but are nolonger doing?
CURRENTLY 66%PAST 12 MO. 34DK/REF *
1. How many adults [do you provide this care for? / did you provide thiscare for in the past 12 months?]
1 69%2 223+ 8DK/REF 1
Mean: 1.7 adults
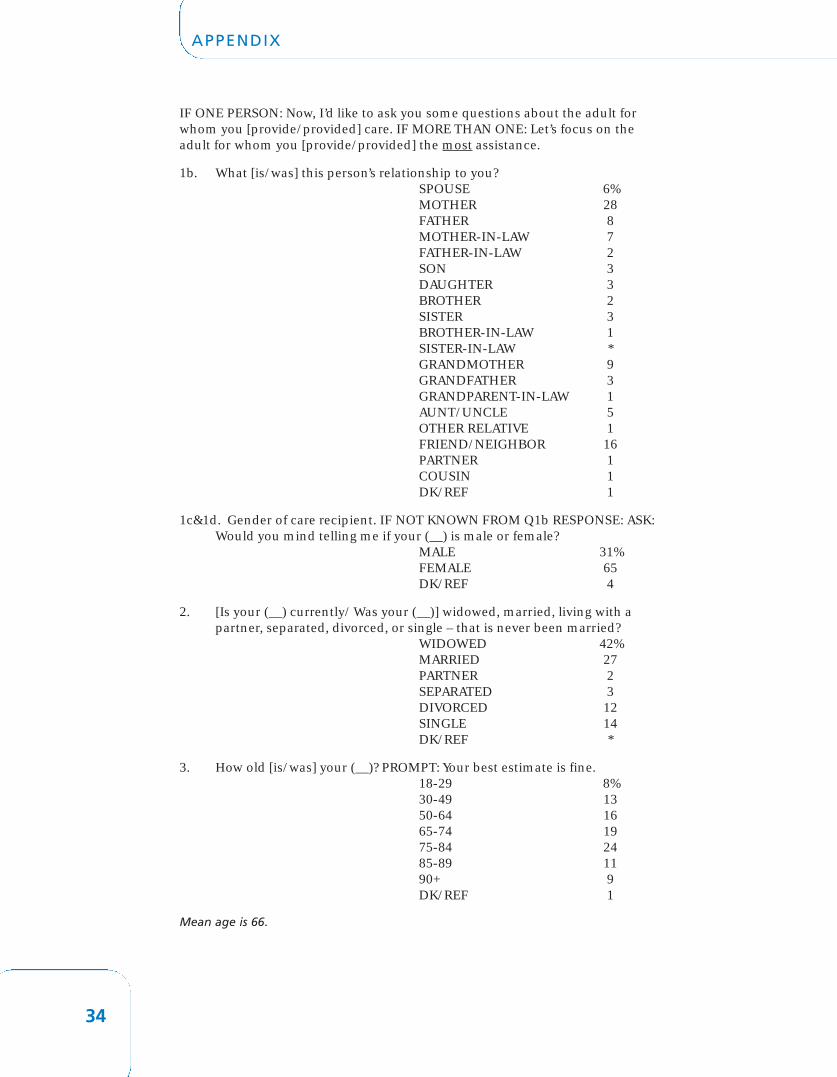
IF ONE PERSON: Now, I’d like to ask you some questions about the adult forwhom you [provide/provided] care. IF MORE THAN ONE: Let’s focus on theadult for whom you [provide/provided] the most assistance.
1b. What [is/was] this person’s relationship to you? SPOUSE 6%MOTHER 28FATHER 8MOTHER-IN-LAW 7FATHER-IN-LAW 2SON 3DAUGHTER 3BROTHER 2SISTER 3BROTHER-IN-LAW 1SISTER-IN-LAW *GRANDMOTHER 9GRANDFATHER 3GRANDPARENT-IN-LAW 1AUNT/UNCLE 5OTHER RELATIVE 1FRIEND/NEIGHBOR 16PARTNER 1COUSIN 1DK/REF 1
1c&1d. Gender of care recipient. IF NOT KNOWN FROM Q1b RESPONSE: ASK:Would you mind telling me if your (__) is male or female?
MALE 31%FEMALE 65DK/REF 4
2. [Is your (__) currently/ Was your (__)] widowed, married, living with apartner, separated, divorced, or single – that is never been married?
WIDOWED 42%MARRIED 27PARTNER 2SEPARATED 3DIVORCED 12SINGLE 14DK/REF *
3. How old [is/was] your (__)? PROMPT: Your best estimate is fine.18-29 8%30-49 1350-64 1665-74 1975-84 2485-89 1190+ 9DK/REF 1
Mean age is 66.
34 35
APPENDIX APPENDIX
4. [Does/Did] your (__) live in your household, within twenty minutes ofyour home, between 20 minutes and an hour from your home, a one totwo hour drive from your home, or more than two hours away?
HOUSEHOLD 24%20 MIN AWAY 4220 MIN TO 1 HR 191 TO 2 HRS 52 HRS + 10DK/REF *
5. IF NOT IN HOUSEHOLD, DK, OR REF IN Q4: On average, how often[do/did] you visit your (__)? More than once a week, once a week, fewtimes a month, once a month, few times a year, or less often?Base N = 924
> ONCE A WEEK 56%ONCE A WEEK 18FEW TIMES A MO 11ONCE A MONTH 5FEW TIMES A YR 7LESS OFTEN 2DK/REF 1
6. IF NOT IN HOUSEHOLD, DK, OR REF IN Q4: [Does/Did] your (__) live in:his or her own home, someone else’s home, an independent living orretirement community, in an assisted living facility where some care maybe provided, a nursing home or facility, somewhere else? Base N = 924
IN OWN HOME 72%OTHERS’ HOME 11IND. LVNG/ RTRMNT 4ASSISTED LVING 6NURSING HOME 7OTHER *DK/REF *
7. IF NOT IN HOUSEHOLD, DK, OR REF IN Q4 OR NOT IN NURSINGHOME IN Q6: [Does/Did] your (__) live: (MULTIPLE PUNCH OKAY)alone, with her/his spouse, with her/his grown children, with otherfamily members, with friends, with an aid, housekeeper, or other staff, orwith someone else? Base N = 869
ALONE 47%SPOUSE 26CHILDREN 11OTHER FAMILY 12FRIENDS 3AID/ HOUSEKPR 3SOMEONE ELSE 1DK/REF *
8. IF NOT IN HOUSEHOLD IN Q4: [Does/Did] your (__) live in an urban,suburban, or rural area? Base N = 925
URBAN 33%SUBURBAN 38RURAL AREA 27DK/REF 2
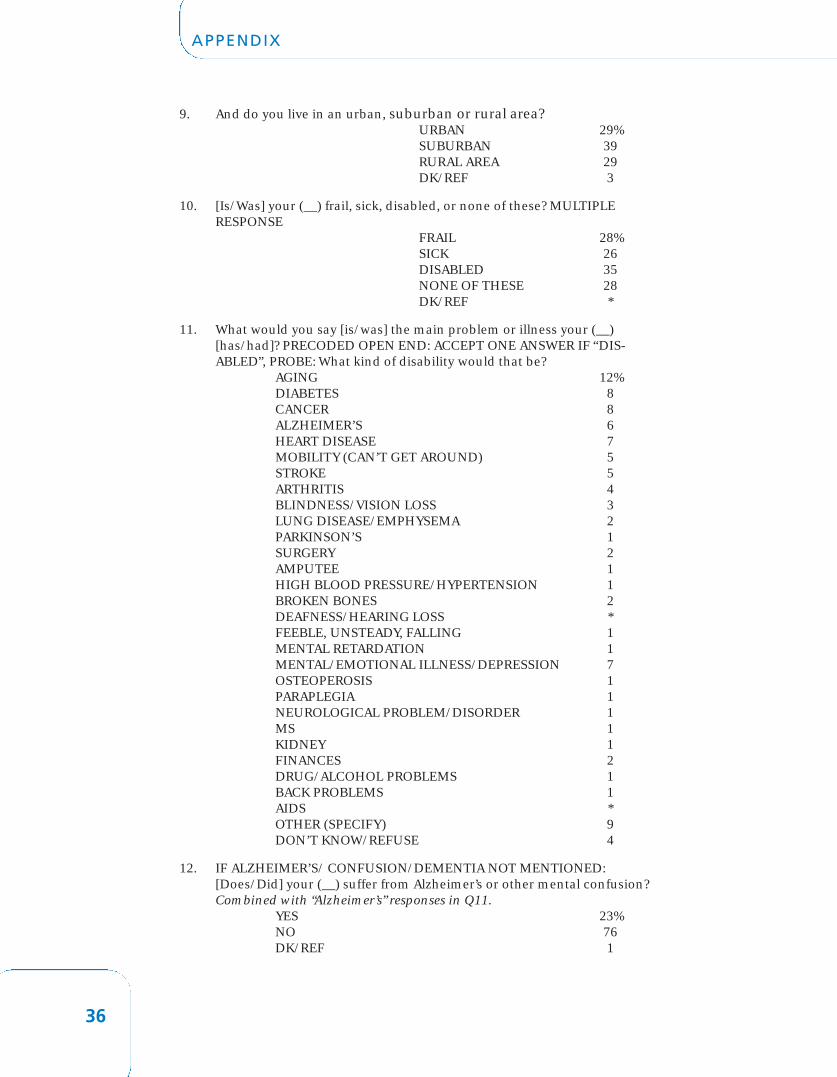
9. And do you live in an urban, suburban or rural area?URBAN 29%SUBURBAN 39RURAL AREA 29DK/REF 3
10. [Is/Was] your (__) frail, sick, disabled, or none of these? MULTIPLERESPONSE
FRAIL 28%SICK 26DISABLED 35NONE OF THESE 28DK/REF *
11. What would you say [is/was] the main problem or illness your (__)[has/had]? PRECODED OPEN END: ACCEPT ONE ANSWER IF “DIS-ABLED”, PROBE: What kind of disability would that be?
AGING 12%DIABETES 8CANCER 8ALZHEIMER’S 6HEART DISEASE 7MOBILITY (CAN’T GET AROUND) 5STROKE 5ARTHRITIS 4BLINDNESS/VISION LOSS 3LUNG DISEASE/EMPHYSEMA 2PARKINSON’S 1SURGERY 2AMPUTEE 1HIGH BLOOD PRESSURE/HYPERTENSION 1BROKEN BONES 2DEAFNESS/HEARING LOSS *FEEBLE, UNSTEADY, FALLING 1MENTAL RETARDATION 1MENTAL/EMOTIONAL ILLNESS/DEPRESSION 7OSTEOPEROSIS 1PARAPLEGIA 1NEUROLOGICAL PROBLEM/DISORDER 1MS 1KIDNEY 1FINANCES 2DRUG/ALCOHOL PROBLEMS 1BACK PROBLEMS 1AIDS *OTHER (SPECIFY) 9DON’T KNOW/REFUSE 4
12. IF ALZHEIMER’S/ CONFUSION/DEMENTIA NOT MENTIONED:[Does/Did] your (__) suffer from Alzheimer’s or other mental confusion?Combined with “Alzheimer’s” responses in Q11.
YES 23%NO 76DK/REF 1
36 37
APPENDIX APPENDIX
13. For how long [have you been providing/did you provide] help to your(__)? PROMPT: Your best estimate is fine. PRE-CODED OPEN END
OCCASION. 5%< 6 MONTHS 166 MOS – 1 YR 181-4 YEARS 315-9 YEARS 1510 YEARS+ 14DK/REF 1
Mean: 4.3 years
I’m going to read a list of kinds of help, which might be provided to a person, ifthe person cannot do this by him or herself. For each, just tell me if you [pro-vide/provided] this kind of help. [Do/Did] you help your (__)....
YES NO DK/REF
14. Get in and out of beds and chairs 36% 64 —
15. Get dressed 29% 71 *
16. Get to and from the toilet 23% 77 —
17. Bathe or shower 26% 74 —
18. Dealing with incontinence or diapers 16% 84 *
19. By feeding him or her 18% 82 —
[Do/Did] you provide help for your (__) with:
YES NO DK/REF
20. Giving medicines, pills, or injections 41% 59 —
21. Managing finances, such as paying bills, or filling out insurance claims 64% 36 —
22. Grocery shopping 75% 25 *
24. Housework, such as doing dishes, laundry, or straightening up 69% 31 —
24b.Preparing meals 59% 42 —
25. Transportation, either by driving him or her, or helping your (__) get transportation 82% 18 *
26. Arranging or supervising services from an agency, such as nurses or aides 30% 70 —
IF NO/DK/REF TO ALL Q14-Q26: TERMINATE
27. Thinking now of all the kinds of help you [provide/provided] for your(__), about how many hours [do/did] you spend in an average week,doing these things?
<1 4%1-8 449-20 2321-39 840+ 17DK/REF 5

28. [Does/Did] your (__) take any prescription medicine?YES 85%NO 12DK/REF 2
29. IF YES IN Q28: Would you say your (__) [needs/needed] someone tooversee giving him/her medicine in the right amount and on time, orthat he/she [manages/had managed] this well on his/her own?Base N = 1049
NEEDS HELP 45%MANAGES 55DK/REF 1
30. IF YES IN Q28: Do you feel you [know/knew] as much as you[need/needed] to about the prescription medicine your (__) [takes/took],or that you [need/needed] to know more about it? Base N = 1049
KNOW AS MUCH 76%KNOW MORE 22DK/REF 2
31. Has anyone else provided unpaid help to your (__) during the last 12months?
YES 59%NO 37DK/REF 3
32a. IF YES IN Q31: What relationship [are/were] they to your (__)? MULTIPLERESPONSE
IF “CHILDREN”, PROBE: Would that be (__)’s son or daughter or both? Base N = 742
SPOUSE/FORMER 7%MOTHER 6FATHER 1MOTHER/FATHER-IN-LAW *SON 26DAUGHTER 42SON/DAUGHTER-IN-LAW 6BROTHER 1SISTER 5BROTHER/SISTER-IN-LAW *NIECE/NEPHEW 5GRANDSON/GRANDDGHTR 9OTHER RELATIVE 3ALL FAMILY 4NON-REL./FRIEND/NEIGH. 11VOLUNTEER 1OTHER (SPECIFY) 1DK/REF 1
38 39
APPENDIX APPENDIX
33. IF YES IN Q31: Who would you consider to be the person who [pro-vides/provided] most of the unpaid care for your (__): you yourself, orsomeone else? Base N = 742
SELF 34%SOMEONE ELSE 55SPLIT 50-50 (VOL.) 10DK/REF 1
IF NOT IN NURSING HOME: During the last 12 months, did your (__) receivepaid help from any of the following—regardless of who paid for it. First: Base N = 1191
YES NO DK/REF
34. An aide or nurses hired throughan agency or service? 23% 74 3
35. An aide or nurse hired independently—that is not through an agency or service? 7% 90 3
36. A housekeeper hired to clean or cook? 20% 80 *
37. Any other people who are paid to help her/him? 12% 86 2
38. IF YES TO ANY IN Q34-Q37 ABOVE: Who would you say [provides/pro-vided] more of your (__)’s care: you, other unpaid helpers, or paid helperssuch as nurses or aides? Base N = 468
RESPONDENT 44%OTHER UNPAID 34PAID HELPERS 19DK/REF 3
39. Now I have a few questions about you. Are you currently working fulltime, working part time, a student, disabled, retired, a homemaker,unemployed and looking for work, or something else?
FULL TIME 48%PART TIME 11RETIRED 16SOMETHING ELSE *DK/REF *
40. IF NOT CURRENTLY EMPLOYED OR A PAST CAREGIVER: [Have youbeen employed at any time since you began helping your (__)? / Were youemployed at any time while you were helping your (__)]? Base N = 782
YES 59%NO 41DK/REF *

IF WORKING WHILE A CAREGIVER: In your experience as both a worker and acaregiver, did you ever: Base N = 935
YES NO DK/REF
41. Have to go in late, leave early, or take time off during the day to provide care? 57% 43 *
42. Have to take a leave of absence? 17% 83 *
43. Have to go from working full-time topart-time, or taken less demanding job? 10% 90 *
44. Have to turn down a promotion? 4% 95 1
45. Lose any of your job benefits? 5% 95 1
46. Have to give up working entirely? 6% 94 —
47. Choose early retirement? 3% 97 *
52. IF NOT SPOUSE: How much of your money would you estimate you[spend/spent] in a typical month for groceries, medicines, or other kindsof cash support for your (__)’s care if any? Your best estimate is fine.Base N = 1180
$0 34%$1-$50 15$51-$100 11$101-$500 25$501+ 3DK/REF 11
Mean for those who make financial contributions: $200 per month
There may have been other ways in which providing care to your (__) hasaffected your life. As a caregiver,
YES NO DK/REF
53. [Do/Did] you have less time for friends or other family members than before? 51% 48 1
54. [Do/Did] you have to give up vacations, hobbies, or your own social activities? 44% 56 *
55. [Do/Did] you have to get less exercise than before? 26% 74
56. Think of a scale from 1 to 5, where 1 is not a strain at all and 5 is verymuch of a strain. How much of a physical strain would you say thatcaring for your (__) [is/was] for you?
1 NOT A STRAIN 44%2 233 174 85 VERY MUCH 7DK/REF 1
40 41
APPENDIX APPENDIX
57. Using the same scale from 1 to 5, where 1 is not at all stressful and 5 isvery stressful, how emotionally stressful would you say that caring foryour (__) [is/was] for you?
1 NOT STRESSFUL 27%2 173 204 165 VERY STRESSFUL 18DK/REF 1
58. Using the same scale from 1 to 5, where 1 is no hardship at all and 5 is agreat deal of hardship, how much of a financial hardship would you saythat caring for your (__) [is/was] for you?
1 NO HARDSHIP 62%2 143 114 55 GREAT DEAL 7DK/REF *
59. We have been talking about the help you [provide/provided] for your(__). Do you feel you had a choice in taking on this responsibility forcaring for your (__)?
YES 59%NO 39DK/REF 1
I’m going to read a list of ways that caregivers such as yourself have coped withthe demands of caregiving. For each one, please tell me whether you have usedany of these. [Have/Did] you ever [tried/try] to cope with caregiving stress by:
YES NO DK/REF
60. Talking with or seeking advice from friends or relatives? 61% 39 *
61. Exercising or working out? 41% 59 *
62. Taking any kind of medication? 12% 88 *
63. Talking to a professional or spiritual counselor? 27% 73 *
65. Praying? 73% 27 *
66. Going on the Internet to find information? 33% 67 *
67. Reading about caregiving in books or other materials? 44% 56 *
IF YES IN Q66: Which of the following things have you looked for on theInternet? All Base N = 431
YES NO DK/REF
68. Information about your (__)’s condition and treatment? 88% 11 *
69. Information about services available for people like your (__)? 55% 45 —
70. Support or advice from people with similar caregiving experiences? 39% 61 —

In your experience as a caregiver, [have/did] you ever....
YES NO DK/REF
71. [Requested/Request] information about how to get financial help for your (__)? 25% 75 *
72. [Taken/Take] part in support groups for caregivers? 7% 92 *
73. [Used/Use] a respite service to take care of your (__) to free up your time? 5% 93 3
74. [Helped/Help] enroll your (__) in Adult Day Care? 5% 95 *
75. [Helped/Help] enroll your (__) in a recreation program or camp? 8% 92 *
77. [Had/Have] an outside service such as Meals on Wheels deliver meals to your (__)’s home? 11% 89 *
78. [Had/Have] an outside service providetransportation for your (__) instead of you providing the transportation? 18% 82 *
Have you done or obtained any of these types of things to make it easier to carefor your (__):
YES NO DK/REF
79. Had modifications made in the house or apartment where your (__) [lives/lived] to make things easier for your (__)? 39% 61 *
80. Obtained formal training of some sort about how to care for a person with your (__)’s needs? 18% 81 *
81. Obtained a bathing bench, magnifying lens for reading, or other helpful devices for your (__)? 40% 60 1
As a caregiver, on which of the following do you feel you [need/needed] morehelp or information:
YES NO DK/REF
82a. Keeping the person I care for safe at home 30% 69 1
82b. Managing challenging behaviors, such as wandering 14% 85 1
82c. Easy activities I can do with the person I care for 27% 73 *
82d. Managing incontinence or toileting problems 11% 89 *
82e. Moving or lifting the person I care for 16% 84 *
82f. Balancing my work and family responsibilities 29% 71 1
82g. Finding time for myself 35% 64 1
82h. Choosing an assisted living facility 13% 87 *
82i. Choosing a nursing home 8% 92 1
82j. Choosing a home care agency 13% 86 *
82k. How to talk with doctors andother healthcare professionals 22% 78 *
82l. Managing my emotional andphysical stress 29% 70 1
42 43
APPENDIX APPENDIX
82m. Making end-of-life decisions 20% 80 1
82n. Finding non-English languageeducational materials 5% 95 *
83. If you were looking for information about some aspect of helping takecare of your (__), where would you turn? MULTIPLE RESPONSE
INTERNET 29%DOCTOR 28FAMILY/ FRIEND 15HEALTH PROFESSIONALS 10BOOKS, MAG., LIBRARY 7GOV’T AGENCY 5SENIOR CITIZEN’S CENTER 3CHURCH/REL. ORG. 3AGING ASSOC./GRP/ORG 2EMPLOYER 1SUPPORT GRPS/PPL LIKE ME 1HOSPITAL/CLINIC 1OTHER 2DK/REF 10
And finally, just a few questions for classification purposes only....
87. How would you describe your own health? Is it excellent, very good,good, fair, or poor?
EXCELLENT 25%VERY GOOD 30GOOD 28FAIR 12POOR 5DK/REF *
88. How would you say taking care of your (__) has affected your health? Hasmade it better, not affected it, or made it worse?
BETTER 9%NO EFFECT 74WORSE 15DK/REF 2
89. Are you currently:Married 56%Living w/ a partner 6Widowed 6Separated 3Divorced 11Single, never married 18DK/REF *
91. Did you ever serve on active duty in the US Armed Forces? PROBE: Army,Navy, Air Force, Marines, Coast Guard or Women’s Armed Forces
YES 14%NO 86DK/REF *
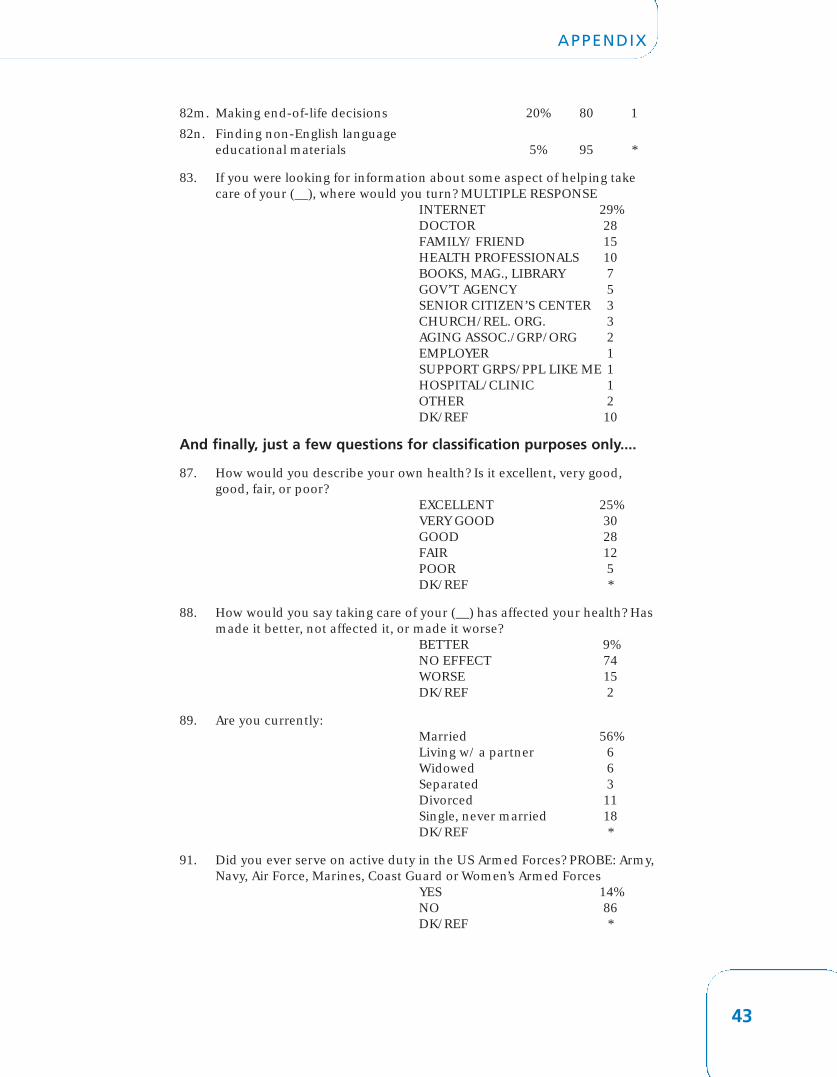
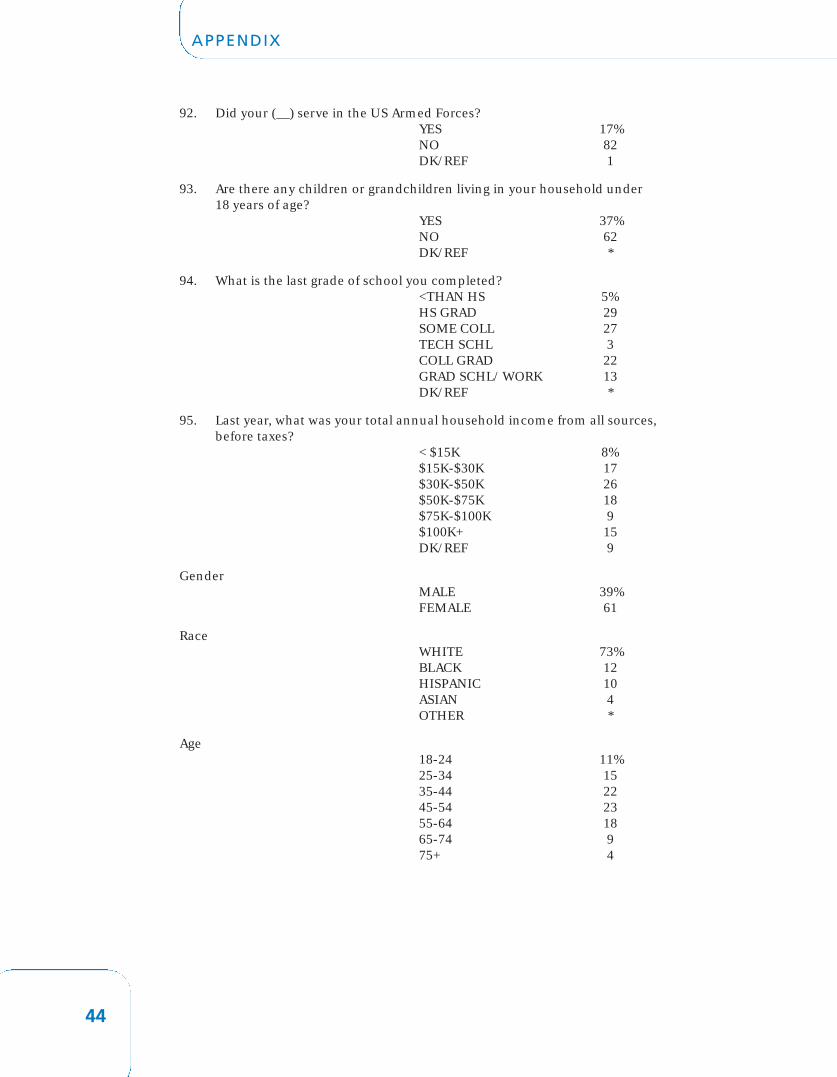
92. Did your (__) serve in the US Armed Forces?YES 17%NO 82DK/REF 1
93. Are there any children or grandchildren living in your household under18 years of age?
YES 37%NO 62DK/REF *
94. What is the last grade of school you completed?<THAN HS 5%HS GRAD 29SOME COLL 27TECH SCHL 3COLL GRAD 22GRAD SCHL/ WORK 13DK/REF *
95. Last year, what was your total annual household income from all sources,before taxes?
< $15K 8%$15K-$30K 17$30K-$50K 26$50K-$75K 18$75K-$100K 9$100K+ 15DK/REF 9
GenderMALE 39%FEMALE 61
RaceWHITE 73%BLACK 12HISPANIC 10ASIAN 4OTHER *
Age18-24 11%25-34 1535-44 2245-54 2355-64 1865-74 975+ 4
44
APPENDIX

601 E Street, NWWashington, DC 200491-888-OUR-AARP (1-888-687-2277) toll-freewww.aarp.org
4720 Montgomery Lane, 5th FloorBethesda, MD 20814www.caregiving.org
EXECUTIVE SUMMARY
conducted by
The NATIONAL ALLIANCE for CAREGIVING
in collaboration with AARP
CAREGIVING IN THE U.S.
Funded by
D18196(205)