cardiovascular risk in young women with polycystic ovary syndrome … · cardiovascular risk in...
TRANSCRIPT
Cardiovascular risk in young
women with Polycystic Ovary
Syndrome
Rose-Marie Coulson
MB BCh, MRCP (UK)
Centre for Endocrine and Diabetes Sciences, Institute of
Molecular and Experimental Medicine,
School of Medicine, Cardiff University
A thesis submitted to Cardiff University in candidature for the
degree of Doctor of Medicine (MD)
2014

DECLARATION This work has not been submitted in substance for any other degree or award at this or any other university or place of learning, nor is being submitted concurrently in candidature for any degree or other award. Signed ………………………………………… (candidate) Date …………………... STATEMENT 1 This thesis is being submitted in partial fulfillment of the requirements for the degree of …………………………(insert MCh, MD, MPhil, PhD etc, as appropriate) Signed ………………………………………… (candidate) Date ………………….. STATEMENT 2 This thesis is the result of my own independent work/investigation, except where otherwise stated. Other sources are acknowledged by explicit references. The views expressed are my own. Signed ………………………………………… (candidate) Date ……………………. STATEMENT 3
I hereby give consent for my thesis, if accepted, to be available online in the University’s Open Access repository and for inter-library loan, and for the title and summary to be made available to outside organisations. Signed ………………………………………… (candidate) Date ……………………. STATEMENT 4: PREVIOUSLY APPROVED BAR ON ACCESS I hereby give consent for my thesis, if accepted, to be available online in the University’s Open Access repository and for inter-library loans after expiry of a bar on access previously approved by the Academic Standards & Quality Committee. Signed ………………………………………… (candidate) Date…………………….

i
CONTENTS
Contents i
Summary x
Acknowledgements xi
Publications and Presentations xii
Abbreviations xiv
List of Figures xix
List of Tables xx
Chapter 1: Introduction 1
1.1 Polycystic Ovary Syndrome 1
1.1.1 Introduction 1
1.1.2 Historical Overview and Diagnosis 1
1.1.3 Limitations of Research 3
1.1.4 Pathogenesis 4
1.1.4.1 Abnormal Hypothalamic Pituitary Function 4
1.1.4.2 Ovarian Androgen Production 5
1.1.4.3 Insulin Resistance 5
1.1.4.4 Pre-natal Androgen Exposure 6
1.1.4.5 Low-birth Weight and Premature Pubarche 7
1.1.4.6 Adipose Tissue Expandability 7
1.1.4.7 Genetic Factors 8
1.1.5 Prevalence 9
1.1.6 Clinical Features 10

ii
1.1.6.1 Reproductive 10
1.1.6.2 Dermatological 10
1.1.6.3 Metabolic 11
1.1.7 Natural History 12
1.1.7.1 Cancer 12
1.1.7.2 Cardiovascular Disease 12
1.1.7.3 Type 2 Diabetes 14
1.2 PCOS and Glucose Tolerance 15
1.2.1 Insulin Resistance 16
1.2.2 Beta Cell Dysfunction 17
1.2.3 Glucose Intolerance 18
1.2.4 Type II Diabetes 20
1.2.5 Obesity and Visceral Adiposity 20
1.2.6 Inflammation 22
1.3 PCOS and Cardiovascular Risk 23
1.3.1 Hypertension 23
1.3.2 Dyslipidaemia 24
1.3.3 Smoking 24
1.3.4 Non-Alcoholic Fatty Liver Disease 25
1.4 PCOS and Cardiovascular Disease 26
1.5 PCOS and Subclinical Cardiovascular Disease 27

iii
1.5.1 Subclinical Cardiovascular Disease 27
1.5.2 Assessment of Subclinical Cardiovascular Disease 29
1.5.3 Endothelial Dysfunction 31
1.5.4 Coronary Artery Calcification 32
1.5.5 Carotid Intima Thickness 32
1.5.6 Arterial Stiffness 33
1.5.7 Diastolic Dysfunction 33
1.6 Mechanisms of Cardiovascular Disease in PCOS 34
1.6.1 Obesity 34
1.6.1.1 Adipose Tissue Distribution 34
1.6.1.2 Adipocytokines 35
1.6.2 Insulin Resistance 38
1.6.3 Hyperglycaemia 39
1.6.4 Oxidative Stress 39
1.6.5 Androgens 41
1.7 Thesis Aims 43
Chapter 2: Methodology 45
2.1 Outline of Study 45
2.1.1 Study Approval 45
2.1.2 Recruitment 45
2.1.3 Inclusion and Exclusion Criteria of Study Participants 45
iv
2.1.4 Consent 46
2.1.5 Protocol 46
2.2 Clinical Assessment 47
2.2.1 History and Examination 47
2.2.2 Blood Pressure Measurement 47
2.3 Biochemical and Metabolic Measurements 47
2.3.1 Sample Collection and Storage 47
2.3.2 Assays 48
2.3.3 Estimations of Insulin Resistance and Insulin Sensitivity 48
2.4 Body Composition Measurements 50
2.3.1 Anthropometric Measurements 50
2.3.2 Dual Energy X Ray Absorptiometry 51
2.3.3 Computed Tomography 52
2.5 Vascular Measurements 53
2.5.1 Applanation Tonometry 53
2.5.1.1 Pulse Wave Analysis 58
2.5.1.2 Pulse Wave Velocity 58
2.5.2 Carotid Ultrasound 59
2.5.2.1 Carotid Intima Media Thickness 59
2.6 Cardiac Measurements 59
v
2.6.1 Myocardial function 60
2.7 Statistical Analyses 60
2.7.1 Sample size calculation 60
2.7.2 Regression analyses 60
Chapter 3: Demographic, Metabolic and Anthropometric Results 62
3.1 Introduction 62
3.2 Study Recruitment 63
3.3 Demographic Data of Study Population 64
3.3.1 Number of Subjects 64
3.3.2 PCOS Subjects and Different Diagnostic Criteria Groups 64
3.3.3 Age and BMI Distribution 65
3.3.3.1 Adjustment for Age and BMI 66
3.3.4 Ethnicity 66
3.3.5 Smoking Status 66
3.3.6 Medications 67
3.4 Metabolic Characteristics of Study Population 67
3.4.1 Glucose Tolerance Status 68
3.4.1.1 Screening for Glucose Tolerance in PCOS 68
3.4.2 Insulin Resistance and Glucose Area Under the Curve 70

vi
3.4.3 Lipid Profile 70
3.4.4 High Sensitivity C Reactive Protein 72
3.4.5 Testosterone 72
3.4.6 High Molecular Weight Adiponectin 72
3.5 Anthropometric Characteristics of the Study Population 74
3.5.1 Waist and Hip Circumference 74
3.5.2 Total Body Fat, Regional Body Fat and Lean Mass Assessed by
DEXA 74
3.5.3 Subcutaneous and Visceral Fat Mass Assessed by CT 75
3.6 Summary of Results 77
3.7 Discussion 78
Chapter 4: Cardiovascular Results 84
4.1 Introduction 84
4.2 Resting Heart Rate 85
4.3 Blood Pressure 85
4.3.1 Peripheral Blood Pressure 85
4.3.2 Central Blood Pressure 86

vii
4.4 Augmentation Index 86
4.5 Pulse Wave Velocity 86
4.6 Carotid Intima Media Thickness 87
4.7 Echocardiographic Measures 89
4.8 Summary of Results 91
4.9 Discussion 91
Chapter 5: Associations of Metabolic Parameters and Body Composition with
Cardiovascular Measures 95
5.1 Introduction 95
5.2 Metabolic Parameters and Cardiovascular Function in Women
with PCOS 96
5.2.1 Insulin Resistance 97
5.2.2 Testosterone 97
5.2.3 Adiponectin 98
5.3 Body Mass Index and Metabolic and Cardiovascular Function in
Women with PCOS 99

viii
5.3.1 Body Mass Index and Metabolic Parameters 99
5.3.2 Body Mass Index and Cardiovascular Function 100
5.4 Association of Body Composition and Insulin Resistance with
Cardiovascular Measures 102
5.5 Association of Insulin Resistance with Cardiovascular Measures
Adjusted for Log Visceral Fat 104
5.6 Summary of Results 105
5.7 Discussion 106
Chapter 6: Discussion 109
6.1 Background 109
6.2 Discussion of Results 111
6.3 Study Limitations 114
6.4 Implication of Results on Clinical Practice 117
6.5 Future Studies 120

ix
6.6 Conclusion 121
Appendix 1 Patient Information Sheet 122
Appendix 2 Healthy Volunteer Recruitment Advert 127
Appendix 3 Healthy Volunteer with higher BMI Recruitment
Advert 128
Appendix 4 Healthy Volunteer Information Sheet 129
Appendix 5 Patient Consent Form 134
Appendix 6 Healthy Volunteer Consent Form 135
Appendix 7 Case Report Form for Patients 136
Appendix 8 Case Report Form for Healthy Volunteers 143
References 150

x
SUMMARY
Background: Young women with Polycystic Ovary Syndrome (PCOS) may have
increased measures of cardiovascular risk. It is difficult to determine how much of
this risk is due to PCOS itself and how much is due to obesity and insulin resistance,
which are common in PCOS and are themselves associated with greater
cardiovascular risk.
Aims and Methods: The study aimed to determine if arterial stiffness, carotid
intima-media thickness and diastolic dysfunction were increased in young women
with PCOS independently of the effects of obesity. A cross-sectional study of
women with PCOS and healthy volunteers aged 16-45 years was undertaken.
Subjects had a comprehensive assessment of body composition (including computed
tomography assessment of visceral fat), measurements of arterial stiffness (aortic
pulse wave velocity; aPWV), common carotid intima-media thickness (ccIMT),
diastolic function (longitudinal tissue velocity; e’:a’) and metabolic measures
including an oral glucose tolerance test to assess insulin area under the curve
(IAUC), a marker of insulin resistance.
Results: After adjustment for age and body mass index, PCOS subjects had greater
insulin response (IAUC) following glucose challenge (adjusted difference [AD]
35900 pmol min/l, P<0.001), higher testosterone (AD 0.57 nmol/l, P<0.001) and
high molecular weight adiponectin (AD 3.01µg/ml, P=0.02) than controls. There
were no significant differences in aPWV (AD -0.13m/s, P=0.33), ccIMT (AD -
0.01mm, P=0.13) or e’:a’ (AD -0.01, P=0.86). After adjustment for age, height and
central pulse pressure, aPWV and e’:a’ were associated with log visceral fat and
IAUC. After adjusting for log visceral fat, the relationships between aPWV or e’:a’
and IAUC were only party attenuated. There was no relationship between
cardiovascular measures and adiponectin or testosterone.
Conclusions: Insulin resistance and central obesity are associated with subclinical
dysfunction in young women, but a diagnosis of PCOS does not appear to confer
additional risk at this age.

xi
Acknowledgments
Firstly, I would like to thank my supervisor Dr Aled Rees for his guidance and
support provided throughout this study. I would also like to thank the people who
assisted in this project; Dr Kate Craig and team for allowing access to the Clinical
Research Facility, Emma Rees for the echocardiographic and carotid intima-media
thickness measurements, Sarah Darlington for the recording and interpretation of the
DEXA scans, Helen Blundell for the capture and interpretation of the abdominal CT
scans, and Professor Frank Dunstan for his assistance with the statistical analyses.
Without the patients and volunteers who willingly gave up their time to participate in
this study, this research would not have been possible and I am very grateful to them
all.
Lastly, I would like to thank my husband for his constant encouragement and
support to ensure this thesis was written; my parents-in-law for their help with
looking after our son; Huw for the happiness and joy you have brought to our lives
and to our beautiful daughter Lowri, thank you for arriving after the MD viva and
allowing me to complete the corrections.

xii
PUBLICATIONS AND PRESENTATIONS
Publication Arising from Research
Rees E, Coulson R, Dunstan F, Evans WD, Blundell HL, Luzio SD, Dunseath G,
Halcox JP, Fraser AG, Rees DA. Central arterial stiffness and diastolic dysfunction
are associated with insulin resistance and abdominal obesity in young women but
polycystic ovary syndrome does not confer additional risk. Human Reproduction
2014; 29:2041-2049
Presentations to Learned Societies
Rees E, Coulson R, Dunstan F, Evans W, Blundell H, Luzio S, Dunseath G, Halcox
J, Fraser A, Rees DA. Central arterial stiffness and diastolic dysfunction are
associated with insulin resistance and abdominal obesity in young women but
polycystic ovary syndrome does not confer additional risk. (Oral) Welsh Endocrine
and Diabetes Society Meeting, May 2014
Coulson R, Rees E, Dunstan F, Evans W, Blundell H, Luzio S, Dunseath G, Halcox
J, Fraser A, Rees DA. Central arterial stiffness and diastolic dysfunction are
associated with insulin resistance and abdominal obesity in young women but
polycystic ovary syndrome does not confer additional risk. (Poster) British
Endocrine Society, Liverpool 2014

xiii
Hocking R, Rees DA. Screening for glucose intolerance in young women with
polycystic ovary syndrome: what is the optimum strategy? (Poster) British
Endocrine Society, Manchester 2010

xiv
ABBREVIATIONS
17-β 17 β-hydroxysteroid dehydrogenase
Β Beta
a’ Late diastolic (atrial) myocardial velocity
ADA American Diabetes Association
AE-PCOS Androgen Excess and Polycystic Ovary Syndrome society
AGE Advanced glycation end products
Ai Augmentation Index
Akt/PKB Akt/Protein kinase B
AMH Anti mullerian hormone
ASAA Acute-phase serum amyloid A
AUC Area under the curve
BMI Body mass index
CAC Coronary artery calcification
ccIMT Common carotid intima-media thickness
CI Confidence interval
CIMT Carotid intima-media thickness
cm centimetre
CRF Clinical Research Facility
CRP C reactive protein

xv
CT Computed Tomography
CU Cardiff University
DENND1A DENN/MADD domain containing 1A
DEXA dual energy x ray absorptiometry
DI Disposition index
DNA Deoxyribonucleic acid
e’ Early diastolic myocardial velocity
e’:a’ Early: late diastolic myocardial velocity ratio
EBCT Electron beam computed topography
FFM Fat free mass
FPG Fasting plasma glucose
FMD Flow-mediated vasodilatation
FSH Follicle stimulating hormone
GDR Glucose disposal rate
GLUT-4 Glucose transporter 4
GnRH Gonadotrophin releasing hormone
GWAS Genome-wide association studies
HbA1c Glycated haemoglobin
HDL High density lipoprotein
HMW High molecular weight
xvi
HOMA Homeostatic model assessment
HOMA-IR Homeostatic model assessment- insulin resistance
hsCRP High sensitivity C reactive protein
HV Healthy Volunteer
ICAM-1 intercellular adhesion molecule-1
ICD-9-CM International Classification of Diseases, Ninth Revision, Clinical
Modification
IGT Impaired glucose tolerance
IL-6 Interleukin-6
IR Insulin resistance
IRS Insulin receptor substrate
l litre
LDL Low density lipoprotein
LH Luteinising hormone
LHCGR Luteinising hormone/choroidogonadotrophin receptor
m metre
MAPK Mitogen-activated protein kinase
MI Myocardial infarction
ml Millilitre
mmol Milimoles

xvii
mTOR Rapamycin
NAD(P)H Nicotinamide adenine dinucleotide phosphate oxidase
NAFLD Non-alcoholic fatty liver disease
NICE National Institute for Health and Care Excellence
NIH National Institute of Health
NO Nitric Oxide
OGTT Oral glucose tolerance test
OR Odds ratio
OSA Obstructive sleep apnoea
PCOS Polycystic Ovary Syndrome
PI3K Phosphoinositide 3-kinase
PKC Protein Kinase C
PP Pulse pressure
PWV Pulse wave velocity
QUICKI Quantitative insulin sensitivity check index
RAGE Receptor for advanced glycation end product
RNA Ribonucleic acid
RNS Reactive nitrogen species
ROS Reactive oxygen species
s’ Longitudinal systolic function

xviii
SC Subcutaneous
T2DM Type 2 Diabetes
THADA Thyroid associated protein
TNFα Tumour necrosis factor alpha
UHW University Hospital of Wales
USA United States of America
VCAM-1 Vascular cell adhesion molecule-1
WHO World Health Organisation
WISE Women’s Ischaemia Syndrome Evaluation
XO Xanthine Oxidase

xx
LIST OF TABLES
Table No. Title Page No.
1.1 Diagnosis of Polycystic Ovary Syndrome 3
1.2 Prevalence of Polycystic Ovary Syndrome by
Different Diagnostic Criteria 10
1.3 Prevalence of Type 2 Diabetes in Polycystic Ovary
Syndrome 15
1.4 World Health Organisation: Thresholds for Diagnosis
of Diabetes and Dysglycaemia 18
2.1 Intra-operator Variability for Pulse Wave Analysis 58
3.1 Polycystic Ovary Syndrome Subjects in Different
Diagnostic Criteria Groups 65
3.2 Age and Body Mass Index of Study Population 65
3.3 Ethnicity of Study Population 65
3.4 Smoking Status of Study Population 66
3.5 Glucose Tolerance Status of Study Population 67
3.6 Outcome of Screening Tests for Diabetes and Dysglycaemia
in Polycystic Ovary Syndrome 68
3.7 Metabolic Characteristics of the Study Population Unadjusted and
Adjusted for Age and Body Mass Index 73

xxi
3.8 Anthropometric Characteristics of the Study Population
Unadjusted and Adjusted for Age and Body Mass Index 76
4.1 Cardiovascular Characteristics of the Study Population
Unadjusted and Adjusted for Age and Body Mass Index 88
4.2 Echocardiographic Measures Unadjusted and Adjusted
for Age and Body Mass Index 90
5.1 Effect of Insulin Resistance on Cardiovascular Measures
in Women with PCOS 97
5.2 Effect of Testosterone on Cardiovascular Measures
in women with PCOS 98
5.3 Effect of Adiponectin on Cardiovascular Measures
in Women with PCOS 99
5.4 Effect of Body Mass Index on Metabolic Parameters
in Women with PCOS 100
5.5 Effect of Body Mass Index on Cardiovascular Measures
in Women with PCOS 101
5.6 Associations of Measures of Body Composition and Insulin
Resistance with Diastolic Function, Aortic Pulse Wave
Velocity and Common Carotid Intima-Media Thickness 103

xxii
5.7 Associations of Markers of Insulin Resistance with
Cardiovascular Measures Adjusted for Log Visceral Fat
Area 104

1
CHAPTER 1: INTRODUCTION
1.1 Polycystic Ovary Syndrome
1.1.1 Introduction
Polycystic ovary syndrome (PCOS) is characterised by hyperandrogenism, ovarian
dysfunction (oligo-anovulation and subfertility) and polycystic ovaries. The
pathogenesis remains to be fully elucidated although insulin resistance is thought to
play a role. Briefly reviewing the historical and scientific literature provides an
insight into the difficulties of defining the syndrome and the evolution of the current
diagnostic criteria.
1.1.2 Historical Overview and Diagnosis
Hippocrates (460-377 BC) noted ‘women whose menstruation is less than three days
or is meagre, are robust, with a healthy complexion and masculine appearance; yet
they are not concerned about bearing children nor do they become pregnant’[1].
This could be one of the first documented accounts of PCOS. However, reviewing
historical documentation and applying diagnoses retrospectively must be done with
caution. The paper, ‘Le virilisme pilaire et son association a l’insuffisance
glycolytique (Diabète des femmes à barbe) by Achard and Thiers in 1921 [2]
associates insulin resistance with hirsutism and is sometimes referred to as an early
description of PCOS. However, a review of this case report in 2000 concluded that
there was little evidence for PCOS and that non-classical adrenal hyperplasia was a
more likely diagnosis [3].
In 1935 Stein and Leventhal reported a case series of seven women aged between 20
and 33 years with infertility, amenorrhoea and bilateral polycystic ovaries at

2
laparotomy. Four of the women were noted to have hirsutism, one woman had acne
and three were obese [4]. This is thought to be the first definitive description of the
syndrome which bore the name ‘Stein-Leventhal syndrome’ until the middle of the
twentieth century when it became known as PCOS.
During the 20th
century, it became possible to assay hormone levels and in 1990 The
National Institute of Health (NIH) consensus group included biochemical
hyperandrogenism as a diagnostic criterion for PCOS [5]. However, polycystic
ovarian morphology was not considered to be important for diagnosis at this time.
With the ability to non-invasively assess the ovaries using ultrasound, this was
revised and included in the 2003 Rotterdam criteria for diagnosis of PCOS [6]. The
diagnostic criteria were updated in 2006 by the Androgen Excess and PCOS (AE-
PCOS) Society [7]. Outlined in Table 1.1 are the main consensus groups and the
definitions of PCOS that were agreed upon. The Rotterdam criteria include a
broader spectrum of PCOS than the NIH and AE-PCOS society criteria, as
hyperandrogenism does not need to be present for the diagnosis. In December 2013,
the Endocrine Society endorsed the Rotterdam criteria for the diagnosis of PCOS in
pre-menopausal women [8].
Recently it has been suggested that Anti Mullerian Hormone (AMH) measurement
could itself become a diagnostic criterion for PCOS [9] or as a substitute for
polycystic ovarian morphology on ultrasound [10]. However, others have found very
high levels of AMH to be specific but not sensitive for PCOS and do not support its
use in the diagnosis [11]. The diagnosis of PCOS continues to be debated and is
likely to evolve with time.

3
Table 1.1 Diagnosis of Polycystic Ovary Syndrome
Consensus Group Year Criteria
National Institute of Health (NIH)
Bethesda, USA5
1990 Chronic anovulation and
Clinical and/or biochemical signs of
hyperandrogenism and
Exclusion of other aetiologies*
European Society for Human
Reproduction and Embryology and
the American Society for
Reproductive Medicine
Rotterdam6
2003 Oligo- and/or anovulation and/or
Clinical and/or biochemical signs of
hyperandrogenism and/or
Polycystic Ovaries and
Exclusion of other aetiologies*
( 2 or more of the first three criteria must be
present and the exclusion of other
aetiologies)
The Androgen Excess and PCOS
Society (AE-PCOS)7
2006 Hyperandrogenism (clinical and/or
biochemical) and
Ovarian dysfunction (oligo-anovulation
and/or polycystic ovaries) and
Exclusion of other aetiologies* and **
*Congenital Adrenal Hyperplasia, Androgen secreting neoplasms, Cushing’s syndrome,
Thyroid dysfunction, Hyperprolactinaemia, Idiopathic Hirsutism and **Syndromes of severe
insulin resistance
1.1.3 Limitations of Research
PCOS is a syndrome and not a disease entity; it is a collection of clinical features for
which there is no single diagnostic test. The disorder is heterogeneous and different
phenotypes exist depending on the diagnostic criteria used. There are no
internationally agreed assays for measuring androgens in women, nor which
androgens should be measured. The Endocrine Society have stated that biochemical
hyperandrogenism refers to an elevated serum androgen level and includes an
elevated total, bioavailable or free serum testosterone level [8]. It is acknowledged
4
in the guideline that there is no absolute level which is diagnostic of PCOS. The
ultrasound criterion for diagnosis of PCOS is also debated, with one group recently
suggesting that the follicle number should be increased from to 12 to 19 [9]. These
factors must be taken into account when comparing research studies as the groups
studied may not be comparable.
1.1.4 Pathogenesis
The aetiology of PCOS is yet to be determined and is likely to be multifactorial.
Hypotheses have focused on the following observed physiological abnormalities:
hypersecretion of Luteinising Hormone (LH), increased ovarian androgen production
and insulin resistance. Other hypotheses include prenatal androgen exposure, low
birth weight and premature pubarche, and adipose tissue expandability.
1.1.4.1 Abnormal Hypothalamic Pituitary Function
Hypersecretion of LH relative to follicle stimulating hormone (FSH) from the
pituitary was one of the earliest findings in women with PCOS. This has been
attributed to an increased gonadotropin-releasing hormone (GnRH) pulse frequency
from the hypothalamus which increases production of LH relative to FSH [12]. The
higher LH levels result in an increase in ovarian theca cells androgen production [13]
as explained below.
The disordered GnRH secretion could be secondary to an intrinsic defect in the
GnRH pulse generator. An alternative explanation is that GnRH is less sensitive to
and less inhibited by oestradiol and progesterone in women with PCOS [14].
Treatment with anti-androgens restores the GnRH pulse sensitivity to oestradiol and
progesterone inhibition feedback [15]. This suggests that the hypothalamus and
pituitary have a role in the pathogenesis of PCOS but hyperandrogenism precedes

5
the disordered GnRH secretion. A hypothalamic-pituitary defect is unlikely to
explain the pathogenesis of PCOS alone, as not all women with PCOS have elevated
LH levels.
1.1.4.2 Ovarian Androgen Production
In the ovary, theca cells synthesise androgens and granulosa cells synthesise
oestrogen. LH stimulates the theca cells to produce androstenedione mediated by
cytochrome P-450c17. The androstenedione is then converted to testosterone by 17
β-hydroxysteroid dehydrogenase (17β) or aromatized by cytochrome P-450arom to
form oestrone. Oestrone is then converted to oestradiol also within the granulosa
cell. FSH regulates the aromatase activity of the granulosa cells. In normal women
androstenedione is preferentially converted to oestradiol.
In PCOS the theca cells are more efficient at converting androstenedione to
testosterone than normal theca cells [16]. There is also evidence to suggest increased
theca cell proliferation [13] and increased cytochrome-P17 transcription within the
PCOS theca cells [17]. The ovaries preferentially synthesise androgens when there is
a higher LH relative to FSH concentration which is another contributing factor to the
higher ovarian androgen production in PCOS.
1.1.4.3 Insulin Resistance
Insulin resistance is defined as a decreased ability of insulin to stimulate glucose
uptake in adipocytes, skeletal and cardiac muscle cells, suppress hepatic glucose
production and suppress lipolysis. In people with insulin resistance, higher levels of
insulin are required to achieve the metabolic effects of insulin [18]. In 1980 basal-
and glucose-stimulated hyperinsulinaemia was reported in women with PCOS
compared to weight-matched controls [19]. The positive correlation of insulin and

6
androgen levels in women with PCOS suggests that insulin might contribute to the
hyperandrogenism [19]. Interestingly, insulin action on steroidogenesis in the PCOS
ovary is preserved but insulin action on glucose metabolism is decreased [20]. Theca
cells from women with PCOS are more responsive to the androgenic effects of
insulin than controls [21]. Insulin also acts synergistically with LH in the ovary, to
increase androgen production [22].
In the liver, insulin decreases the synthesis of sex hormone binding globulin,
resulting in an increase in free testosterone in the circulation [23].
Insulin may also have an effect on the hypothalamic-pituitary axis. In rat pituitary
cells, it has been shown that insulin enhances GnRH-mediated LH and FSH
secretion [24].
The hyperinsulinaemia in PCOS could potentially explain the LH hypersecretion and
the increased ovarian androgen production.
1.1.4.4 Prenatal Androgen Exposure
In 1982 it was demonstrated that female rhesus monkeys exposed to exogenous
androgens prenatally had ambiguous genitalia at birth [25]. Long-term follow up of
the monkeys found the development of a PCOS-like phenotype, in particular those
that were overweight, with hyperinsulinaemic androgen excess, elevated LH levels,
polycystic ovaries, dyslipidaemia and increased visceral adiposity [26]. However,
this finding has yet to be confirmed in humans. A longitudinal study of 244
unselected girls recruited prenatally, failed to demonstrate an association between
diagnosis of PCOS at age 15 and maternal hyperandrogenism throughout pregnancy
or foetal hyperandrogenism at birth [27]. The diagnosis of PCOS in adolescents is
challenging and a longer follow up and larger study group may have yielded

7
different results. It is also possible that the sampling of androgens during pregnancy
missed a window of maternal or foetal androgen excess [28].
1.1.4.5 Low-birth Weight and Premature Pubarche
Girls with low birth weight and premature pubarche, experience menarche before 12
years of age and develop hyperinsulinaemic androgen excess [29]. Ibanez et al have
treated this group with metformin pre and during puberty and have found this
prevents the development of features of PCOS [30]. The adipose tissue
expandability hypothesis, explained below, could explain why low birth weight girls
are predisposed to developing PCOS.
1.1.4.6 Adipose Tissue Expandability
The adipose tissue expandability theory, proposed by Virtue and Vidal-Puig [31], is
based on the idea that subcutaneous (SC) adipose tissue has a limited capacity to
expand safely. Once the individual capacity (determined by genetic and
environmental factors) has been exceeded, a lipotoxic state develops. This is
characterised by dyslipidaemia, an unfavourable adipocytokine profile and lipid
deposition in non-subcutaneous adipose tissue and organs such as the liver or
muscle, resulting in insulin resistance. This theory could explain the
hyperinsulinaemic androgen excess seen in PCOS. Some patients develop
symptoms after a period of weight gain. Other women with PCOS are of normal
weight and these women may have exceeded their individual capacity of adipose
tissue expansion.
The prenatal and early years is an essential time when the adult number of
adipocytes is determined. Low birth-weight babies have their growth restricted in
utero and it is proposed that the number of pre-adipocyte precursors are reduced,

8
reducing the amount of adipose tissue development. Some will catch-up during the
post natal period but development of fat free mass is prioritised, resulting in little
subcutaneous fat mass accumulation. These girls will therefore have a lower set
point for exceeding their individual capacity for adipose tissue expansion and
therefore may be predisposed to developing PCOS [32].
1.1.4.7 Genetic Factors
There is often a clustering of PCOS within families [33, 34] and twin studies have
shown a heritability of 75% for PCOS with a correlation of 0.71 between
monozygotic twins and 0.38 between dizygotic twins [35]. This suggests that there
is a genetic predisposition/factor involved in the aetiology of PCOS. There have
been numerous studies looking for a genetic defect in PCOS using a candidate gene
approach, but the results of these are inconclusive [36]. The candidate gene
approach is limited by the lack of understanding into PCOS and it is hoped that using
the genome-wide association study (GWAS) approach will overcome this. An initial
GWAS in China found association of PCOS (Rotterdam criteria) with the following
three loci: 2p16.3 (luteinising hormone/choroidogonadotrophin receptor; LHCGR),
2p21 (thyroid associated protein; THADA) and 9q33.3 (DENN/MADD domain
containing 1A; DENND1A) [37]. Two of these loci, THADA and DENND1A have
been confirmed to be present in a European PCOS cohort (NIH criteria) but there
was insufficient power to confirm LHCGR as a risk locus [38]. McAllister et al
have demonstrated overexpression of DENND1A in polycystic ovary theca cells and
concluded that the gene plays a key role in the hyperandrogenaemia seen in PCOS
[39]. A GWAS has identified THADA as a novel Type 2 diabetes (T2DM) gene
associated with pancreatic beta cell dysfunction [40]; this might explain in part the
increased risk of T2DM observed in PCOS.
9
The FTO gene has been associated with obesity and a meta-analysis of European
data [41] and Chinese data [42] have confirmed the association of the FTO gene with
PCOS. In the Chinese data, this positive association was observed in both obese and
non-obese women.
The Chinese have demonstrated different genotype-phenotype correlations of PCOS
[43] which suggests it is a heterogeneous condition with different genes contributing
to the different phenotypes seen.
1.1.5 Prevalence
PCOS is the commonest endocrinopathy in pre-menopausal women. During the
1990s, studies in the United States of America (USA) [44, 45], Spain [46] and
Greece [47] using the NIH criteria for diagnosis, found prevalence rates of PCOS
between 4-6.8%. However, an Oxford study conducted at the same time found
prevalence rates of between 8% (using NIH criteria) and 26% (using polycystic
ovaries on ultrasound and an additional feature of PCOS as diagnostic criteria) [48].
In a study of unselected obese, Spanish women a PCOS prevalence rate of 28.3%
was demonstrated using the NIH criteria [49]. More recent studies [50-52] have
found similar prevalence rates of PCOS using all three consensus group definitions;
these are summarised in Table 2. However, an analysis of a USA commercial
medical database estimated the prevalence of PCOS at 1.6% [53]. This much lower
prevalence rate in a large population group of 12,171,830 may be attributed to the
analysis relying on International Classification of Diseases, Ninth Revision, Clinical
Modification (ICD-9-CM) codes and none of the group were assessed clinically.
March et al [50] in their community Australian study found that 68% of women with

10
PCOS were undiagnosed and this could also contribute to the difference in
prevalence rates seen between the studies in Table 1.2 and the American study.
Table 1.2 Prevalence of Polycystic Ovary Syndrome by Different Diagnostic
Criteria
Study Group Population
number
NIH Rotterdam AE-PCOS
Australia50
728 8.7% 11.9% 10.2%
Iran51
1126 7.1% 14.6% 11.7%
Turkey52
392 6.1% 19.9% 15.3%
1.1.6 Clinical Features
Traditionally, PCOS has been seen as a syndrome with reproductive and
dermatological features but more recently metabolic components have been
recognised.
1.1.6.1 Reproductive
Approximately 70% of women with PCOS have oligomenorrhoea or amenorrhoea
[54]. Menstrual cycles are irregular and can be anovulatory resulting in infertility in
up to 30% [54]. Women with PCOS are also more likely to develop gestational
diabetes in pregnancy and have a higher risk of pregnancy complications than
controls [55].
1.1.6.2 Dermatological
Hirsutism is present in 66% of women with PCOS, 25% have male pattern balding
or acne, and acanthosis nigricans (a sign of insulin resistance) is seen in 2.5% [54].

11
1.1.6.3 Metabolic
Women with PCOS are commonly overweight or obese. Although prevalence rates
vary greatly (6-100%) depending on population studied and diagnostic criteria used,
a recent systematic review and meta-analysis estimated the pooled prevalence to be
61% [56]. Insulin resistance is common in PCOS with prevalence rates reported
from 44 to 70% [57] and has been shown to be independent of obesity [58].
Dyslipidaemia is present in up to 70% of women with PCOS [59]. There is an
adverse lipid profile with high triglycerides, low high-density lipoprotein cholesterol
(HDL-cholesterol), increased low density lipoprotein cholesterol (LDL-cholesterol)
and increased non HDL-cholesterol [60]. A meta-analysis has found that this
adverse profile remained after body mass index (BMI) matching [60]. Hypertension
has been reported to be up to three times higher in PCOS women compared to
controls [61] however, obesity could be an important confounding factor [62].
Impaired glucose tolerance (IGT) and T2DM are elevated in women with PCOS in
both BMI and non-BMI matched studies [63] and will be discussed in more detail
later. With many of the individual components of the metabolic syndrome more
prevalent in the PCOS population, it is not surprising that the prevalence of
metabolic syndrome is itself increased [63]. Obstructive sleep apnoea (OSA) has
been found to be five- to thirty-times higher in women with PCOS compared to
BMI-matched controls [64]. Non-alcoholic fatty liver disease (NAFLD) has been
found in 0-100% of women with PCOS depending on the criteria used for diagnosis
of both PCOS and NAFLD and the presence of obesity [65].
12
1.1.7 Natural History
The clinical features of PCOS could result in long term health consequences for
women with the syndrome.
1.1.7.1 Cancer
Oligomenorrhoea or amenorrhoea in the presence of pre-menopausal oestrogen
levels could in theory lead to endometrial hyperplasia and an increased risk of
endometrial cancer. A recent meta-analysis has found that women with PCOS have
an increased risk of endometrial cancer (Odds Ratio (OR) 2.79; 95% Confidence
Interval (CI) 1.31-5.95, p<0.008) and in those under 54 years of age this was
increased further (OR 4.05; 95% CI 2.42-6.76, P<0.00001) [66]. The meta-analysis
also evaluated breast and ovarian cancers. There was no significant increased risk in
either breast or ovarian cancer, except in women under 54 years of age where there
was an increased risk of ovarian cancer (OR 2.52; 95% CI 1.08-5.89, p<0.03) [66].
However, no adjustment was made for obesity,which is common in PCOS and is
itself a risk factor for endometrial cancer. Work conducted in our own group has
used a large, community-based database to show that women with PCOS did not
have an increased risk of cancer, including endometrial, compared to age- and BMI-
matched controls [67].
1.1.7.2 Cardiovascular Disease
Obesity, hypertension, dyslipidaemia and T2DM are all risk factors for
cardiovascular disease. In 1992 a metabolic risk factor model predicted a 7 fold-
increase in myocardial infarction (MI) in women with PCOS [61]. However, early
retrospective cohort studies of women with PCOS did not reveal a significant excess
of cardiovascular death or morbidity [68, 69] compared to the general population.

13
The nurses’ health study, a prospective cohort study of 82,439 nurses with 14 years
of follow-up, found a significantly increased risk of non-fatal or fatal coronary heart
disease in women who had reported very irregular menstrual cycles (age-adjusted
relative risk 1.67, 95% CI 1.35-2.06) which remained after adjustment for body mass
index and other confounding factors (multivariate risk ratio 1.53, 95% CI 1.24-1.90)
[70]. Although there was no confirmed diagnosis of PCOS in these women, the
commonest cause for irregular menstrual cycles is PCOS. A second prospective
cohort study with follow-up for 40 years found an increased risk of cardiovascular
mortality in women who had a past history of irregular menstrual cycles (age
adjusted hazard ratio 1.42, 95% confidence interval 1.03-1.94), but this did not
remain significant after adjusting for BMI (age adjusted hazard ratio 1.35, 95% CI
0.97-1.52) [71]. A subgroup analysis of The Women’s Ischemia Syndrome
Evaluation (WISE) study found that postmenopausal women with features of PCOS
had a significantly worse cumulative 5-year cardiovascular event-free survival than
women without clinical features of PCOS, 78.9% versus 88.7% p=0.006 [72]. A
meta-analysis in 2011 found the relative risk for coronary heart disease or stroke to
be 2.02 comparing women with PCOS to women without PCOS. This increased
relative risk was reduced to 1.55 following adjustments for body mass index (BMI)
[73]. However, the research group who predicted a 7-fold increase in myocardial
infarction in women with PCOS did not confirm this in their own 21 year controlled
follow-up study. There was no difference in MI, stroke or mortality between the two
groups, although the PCOS group had a higher prevalence of hypertension and
elevated triglyceride levels [74]. Work conducted in our own group has used a large,
community-based database to show that women with PCOS did not have an
increased risk of large vessel disease but there was an increased risk of T2DM

14
compared to age- and BMI-matched controls [67]. The studies to date are therefore
conflicting with respect to clinical cardiovascular disease. Further, large prospective
cohort studies are thus needed with clearly defined PCOS phenotype groups and a
longer term follow-up, in order to clarify this association.
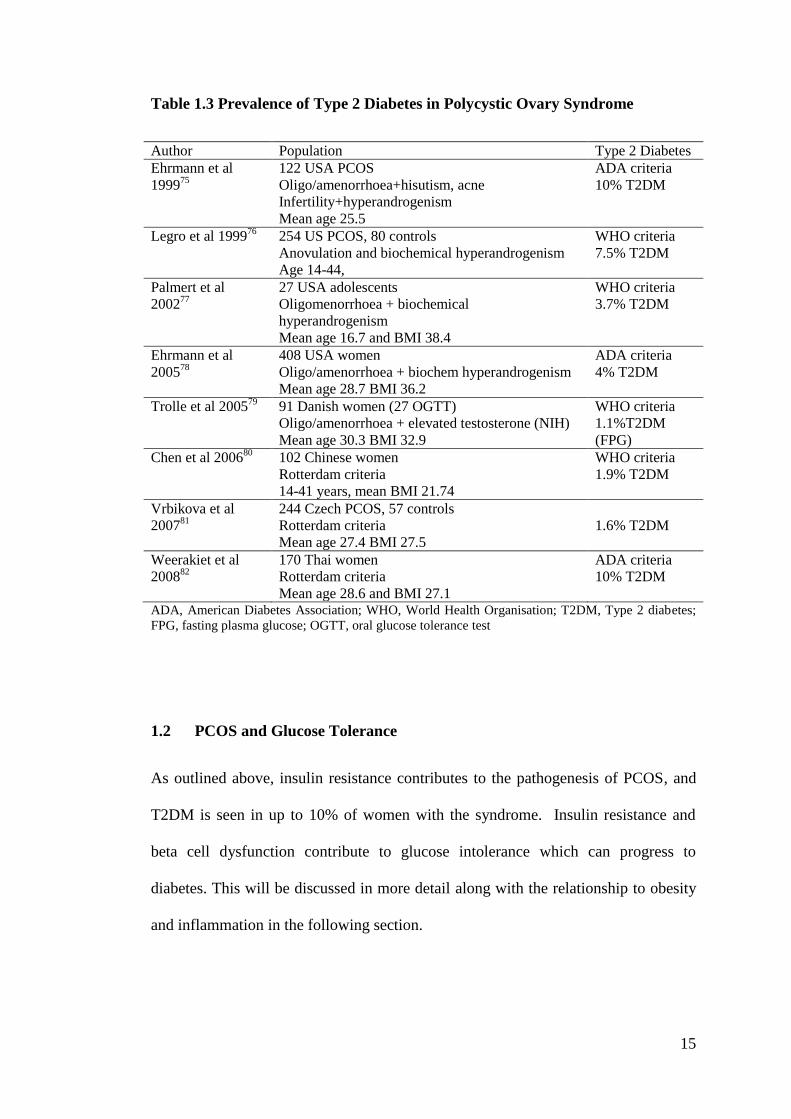
1.1.7.3 Type 2 Diabetes
As mentioned above, there is an increased risk of developing T2DM in PCOS. A
number of research groups have studied this and the prevalence rates for T2DM in
women with PCOS vary from 1.6%-10% depending on the criteria used for the
diagnosis and the age, ethnicity and BMI of the population. This is summarised in
Table 1.3.
15
Table 1.3 Prevalence of Type 2 Diabetes in Polycystic Ovary Syndrome
Author Population Type 2 Diabetes
Ehrmann et al
199975
122 USA PCOS
Oligo/amenorrhoea+hisutism, acne
Infertility+hyperandrogenism
Mean age 25.5
ADA criteria
10% T2DM
Legro et al 199976
254 US PCOS, 80 controls
Anovulation and biochemical hyperandrogenism
Age 14-44,
WHO criteria
7.5% T2DM
Palmert et al
200277
27 USA adolescents
Oligomenorrhoea + biochemical
hyperandrogenism
Mean age 16.7 and BMI 38.4
WHO criteria
3.7% T2DM
Ehrmann et al
200578
408 USA women
Oligo/amenorrhoea + biochem hyperandrogenism
Mean age 28.7 BMI 36.2
ADA criteria
4% T2DM
Trolle et al 200579
91 Danish women (27 OGTT)
Oligo/amenorrhoea + elevated testosterone (NIH)
Mean age 30.3 BMI 32.9
WHO criteria
1.1%T2DM
(FPG)
Chen et al 200680
102 Chinese women
Rotterdam criteria
14-41 years, mean BMI 21.74
WHO criteria
1.9% T2DM
Vrbikova et al
200781
244 Czech PCOS, 57 controls
Rotterdam criteria
Mean age 27.4 BMI 27.5
1.6% T2DM
Weerakiet et al
200882
170 Thai women
Rotterdam criteria
Mean age 28.6 and BMI 27.1
ADA criteria
10% T2DM
ADA, American Diabetes Association; WHO, World Health Organisation; T2DM, Type 2 diabetes;
FPG, fasting plasma glucose; OGTT, oral glucose tolerance test
1.2 PCOS and Glucose Tolerance
As outlined above, insulin resistance contributes to the pathogenesis of PCOS, and
T2DM is seen in up to 10% of women with the syndrome. Insulin resistance and
beta cell dysfunction contribute to glucose intolerance which can progress to
diabetes. This will be discussed in more detail along with the relationship to obesity
and inflammation in the following section.

16
1.2.1 Insulin Resistance
Insulin resistance (IR) has previously been defined and its contribution to the
pathogenesis of PCOS outlined.
The prevalence of IR in PCOS varies greatly in published studies, from 44-95% [57,
83, 84] compared to 10-25% of the general population [83]. The wide variation
could be attributed to the use of different diagnostic criteria for PCOS, different
methods to assess and define IR, and differences in BMI and ethnicity. For example,
a group investigating IR in different phenotypes of PCOS, found that 71.4% of the
study population were IR. However, 80.4% of the classic phenotype, 65% of the
ovulatory phenotype and 38.1% of the normoandrogenic phenotype were IR [85].
An Australian group found that 95% of obese women with PCOS had IR compared
to 75% of lean women with PCOS [84].
Insulin binds to its cell membrane receptor and activates intracellular cascades
through the phosphoinositide 3-kinase (PI3K) pathway and the mitogen-activated
protein kinase (MAPK) signal transduction pathway [86]. The PI3K pathway
mediates glucose uptake by increasing the translocation of the insulin-responsive
glucose transporter, GLUT 4, from intracellular vesicles to the cell surface; increases
glycogen synthesis via activation of Akt/protein kinase B (Akt/PKB) and regulates
protein synthesis and degradation via rapamycin (mTOR) [87]. The MAPK pathway
controls cell growth and differentiation [87]. In women with PCOS, abnormalities in
cell responsiveness to insulin and insulin signalling defects have been described.
The major defect is in the early stages of insulin signal transduction, post receptor
binding. This has been demonstrated in adipocytes [88, 89] and skeletal muscle [90,
91]. The defect appears to be secondary to increased inhibitory serine

17
phosphorylation of the insulin receptor and insulin receptor substrate (IRS)-1 [57].
In adipocytes there is also reduced expression of GLUT-4 [92]. As mentioned
previously, in ovarian granulosa-lutein cells insulin resistance is selective, affecting
metabolic but not other actions of insulin [20]. However, in skeletal muscle it is
thought that both metabolic and mitogenic pathways are affected [93].
1.2.2 Beta Cell Dysfunction
Insulin is secreted by pancreatic β-cells in response to a glucose stimulus. More
insulin is secreted in an environment of insulin resistance, resulting in
hyperinsulinaemia [94]. When the β-cells are not able to secrete enough insulin to
meet the body’s requirements, glucose intolerance develops [95]. Therefore, insulin
secretion should be investigated in the context of insulin sensitivity.
Increased fasting insulinaemia and increased insulinaemia at 2 hours after an oral
glucose tolerance test (OGTT) have been demonstrated in women with PCOS
(regardless of diagnostic group) in comparison to age-matched controls [96].
However, the control women had a significantly lower body mass index than the
PCOS subjects and therefore obesity could be a confounding factor. Other studies
have found reduced insulin secretory responses to intravenous glucose and meals
when expressed relative to the degree of insulin resistance, in women with PCOS
[97, 98]. The disposition index (DI), the product of insulin sensitivity and insulin
secretion, is reduced in both obese and lean women with PCOS when compared to
age- and weight-matched controls [99]. These studies suggest that there is a defect
in insulin secretion in response to glucose in women with PCOS.

18
1.2.3 Glucose Intolerance
When the body is no longer able to maintain blood glucose levels in the normal
range, glucose intolerance develops. This occurs when there is a defect in the
secretion of insulin and/or the pancreatic cells are unable to compensate for the
body’s insulin resistance. The World Health Organisation definitions of
dysglycaemia and diabetes are in Table 1.4.
Table 1.4 World Health Organisation: Thresholds for Diagnosis of Diabetes and
Dysglycaemia.
Venous plasma glucose (mmol/L)
Normal Fasting <6.1 and
2hr glucose during OGTT <7.8
Diabetes Fasting ≥ 7.0 or
2 hour glucose during OGTT ≥ 11.1 or
HbA1c ≥48mmol/mol
Impaired Glucose
Tolerance
Fasting <7.0 and
2 hour glucose during OGTT ≥ 7.8 and <11.1
Impaired Fasting
Glycaemia
Fasting ≥ 6.1 and <7.0
OGTT, Oral glucose tolerance test 75 grams of glucose. An HbA1c 42-47mmol/mol identifies people
with ‘pre diabetes’. Adapted from the World Health Organisation Website
As insulin resistance and beta cell dysfunction are present in women with PCOS,
IGT would be expected. A recent meta-analysis found an increased prevalence of
IGT in women with PCOS (OR 2.48; 95% CI 1.63-3.77) and this remained in studies
who had BMI-matched women (OR 2.54; 95% CI 1.44, 4.47) [100]. The prevalence
of IGT in PCOS ranges from 9.4-35% [75-82] depending on diagnostic criteria used
for PCOS and IGT and the age, BMI and ethnicity of the subjects. The highest
prevalence was in an American population; in a similar aged, unscreened female US
population the prevalence of IGT was 1.6% (Third National Health and Nutrition

19
Survey). In women with PCOS, increasing age, a first degree relative with diabetes
and a higher BMI increases the risk of developing IGT and T2DM [75, 76, 78, 101].
There is an excess of IGT in women with PCOS. This is important as IGT identifies
individuals at high risk of developing T2DM and is itself a risk factor for
cardiovascular disease [102, 103]. With intervention it is possible to reduce the risk
of patients with IGT developing T2DM [104, 105]. Therefore, it would be important
to identify women with PCOS who have IGT as it possible to intervene and improve
their cardiovascular risk profile. It is debated how and when women with PCOS
should be screened for glucose intolerance. The Androgen Excess Society
recommends that all PCOS patients should be screened with an OGTT on diagnosis;
women with IGT should have an annual OGTT to look for the development of
T2DM and women with normal glucose tolerance should have a biannual OGTT
[106]. The National Institute for Health and Care Excellence (NICE) have also
recommended an OGTT at diagnosis and an annual OGTT to women with IGT.
They suggest an annual OGTT should be considered in women at high risk of
T2DM; strong family history of T2DM, BMI more than 30 (more than 25 in Asians)
and in women who have had gestational diabetes. All women who do not have an
annual OGTT should have a biannual OGTT or a fasting glucose annually and an
OGTT if the fasting glucose is more than 5.6 mmol [107]. An OGTT is costly for the
patient and healthcare provider. Research groups have attempted to identify the
highest risk individuals but these have often used biochemical tests not routinely
available in clinical practice [80-82]. One group used decision tree modelling based
on medical history and clinical data only and were able to identify all women with
normal glucose tolerance and allowed a 22% reduction in the number of OGTTs
[108]. Measurement of glycated haemoglobin (HbA1c) is now accepted as a

20
diagnostic criterion for diabetes but it has not been shown to be effective in
identifying IGT in women with PCOS [109].
1.2.4 Type 2 Diabetes
PCOS is recognised by the American Diabetes Association as a non-modifiable risk
factor for Type 2 Diabetes. A meta-analysis has found an increased prevalence of
Type 2 Diabetes in PCOS, [OR 4.43 (95% CI 4.06, 4.82)] and in BMI matched
populations, [OR 4.00 (95% CI 1.97, 8.10)] [100]. The progression to type 2
diabetes is about 2-3% per year and as with IGT, higher BMI and family history of
type 2 diabetes are strong predictors [76,101]. Fasting plasma glucose is advocated
as a screening test for type 2 diabetes but in women with PCOS this underestimates
the prevalence of type 2 diabetes by 50% [76]. An OGTT is the most reliable
method to diagnose type 2 diabetes but as mentioned previously is expensive and
time consuming. There have been a few studies looking at HbA1C for the diagnosis
of type 2 diabetes in PCOS but these have shown HbA1c to be inferior to the OGTT
[109-111]. Currently screening for type 2 diabetes in PCOS should be in line with
guidance from the Androgen Excess Society and NICE. Identifying type 2 diabetes
in women with PCOS is important as there is significant morbidity and mortality
attached to the diagnosis and it is itself a risk factor for cardiovascular disease. It
allows women to receive appropriate treatment and screening for microvascular
disease.
1.2.5 Obesity and Visceral Adiposity
Obesity and in particular visceral adiposity (intra-peritoneal fat, also known as
central fat) are independent risk factors for cardiovascular disease [112, 113, 114].

21
Visceral adiposity is also a risk factor for Type 2 diabetes independent of body mass
index [115].
A systematic review and meta-analysis has found that in women with PCOS the
prevalence of obesity and overweightness varies from 6-100% with a pooled
estimated prevalence of 61% (95% CI 54-68%) [56]. When obesity alone is
considered, the prevalence is 12.5-100% with a pooled estimated prevalence of 49%
(95% CI 42-55%) and this is significantly higher in studies comparing women with
and without PCOS [56]. The prevalence of central obesity ranged from 20-85.5%
with a pooled estimate of 54% (95% CI 43-62%) and in studies comparing women
with and without PCOS, the prevalence of central obesity was significantly higher
[56].
It is not known whether PCOS itself contributes to obesity/central adiposity or
whether obesity/central adiposity contributes to PCOS. A Spanish study diagnosed
PCOS in 28.3% of overweight/obese women consulting for weight loss compared to
an overall prevalence of PCOS in 6.5% pre-menopausal Spanish women [116].
However, not all women who are obese have PCOS and not all women with PCOS
are obese, so obesity alone does not cause PCOS but may unmask the phenotype in
women predisposed to developing the condition. In support of this, losing 5% of
body weight has been shown to result in significant improvements in symptoms of
hyperandrogenism and ovulatory function in women with PCOS [117].
As outlined above, women with PCOS [56] and non-obese women with PCOS [118]
may have greater central adiposity than BMI matched controls. However, the former
study used waist circumference >80 cm and waist to hip ratio >0.85 and the latter
used ultrasound to assess central adiposity. These methods are not the gold standard

22
and one study, using Magnetic Resonance Imaging (the gold standard), did not find
any difference in body fat distribution between PCOS patients and BMI-matched
controls [119]. Central obesity in PCOS worsens hyperandrogenaemia [120, 121],
anovulation [122] and is associated with greater insulin resistance [120, 123].
1.2.6 Inflammation
Central adiposity is associated with insulin resistance and cardiovascular disease, as
discussed above, and has also been associated with low-grade inflammation [124].
C-reactive protein (CRP), an acute phase reactant that is a marker of systemic
inflammation is elevated in obesity [125] and is itself an independent risk factor for
type 2 diabetes and cardiovascular disease [126].
Interleukin-6 (IL-6), secreted by adipocytes and stromovascular cells, and tumour
necrosis factor alpha (TNFα), secreted by macrophages infiltrating adipocytes, are
both mediators of inflammation. They are associated with obesity [127] and both
interfere with insulin signalling in adipose tissue resulting in insulin resistance [128,
129].
Circulating inflammatory markers in PCOS have recently been examined in a meta-
analysis. No significant differences were found in TNF-α or IL-6 but CRP was 96%
higher in women with PCOS compared to controls, an observation which remained
even after studies with mismatches for BMI or prevalence of obesity were excluded
[130].

23
1.3 PCOS and Cardiovascular Risk
Impaired glucose tolerance, type 2 diabetes, obesity, visceral adiposity and chronic
inflammation are independent cardiovascular risk factors and were discussed above.
This section will examine the presence of other cardiovascular risk factors in patients
with PCOS, including hypertension, dyslipidaemia and smoking status.
1.3.1 Hypertension
In a large retrospective, Chinese study, the prevalence of hypertension in PCOS was
19.2% compared to 11.9% in controls [131]. Hypertension has been reported to be
up to three times higher in PCOS women compared to controls [61]. After
matching for body mass index, the Chinese study found that hypertensive PCOS
patients had significantly higher lipid, insulin and glucose levels than those who
were normotensive [131] suggesting that hypertension in PCOS could be a marker
for a worse metabolic profile, increasing the risk factors for cardiovascular disease or
a marker for the metabolic syndrome. One study investigating the effect of obesity
and androgens on blood pressure, found that overweight women with PCOS had
similar frequencies of undiagnosed hypertension to overweight men and higher than
those in non-hyperandrogenic women [132]. They also found that weight excess and
hypertension in men and women with PCOS increased left ventricular wall thickness
(a marker of target organ damage) [132]. Obesity could be an important
confounding factor [62]. However, a Taiwanese study found that higher free
androgen index was associated with increased systolic and diastolic blood pressure
independent of age, BMI and insulin resistance [133].

24
1.3.2 Dyslipidaemia
Dyslipidaemia is present in up to 70% of women with PCOS [59]. It can present
with different patterns, including low levels of high-density lipoprotein cholesterol
(HDL-cholesterol), and increased triglycerides, low density lipoprotein cholesterol
(LDL-cholesterol) and non HDL-cholesterol [60]. The most common pattern is the
atherogenic lipoprotein phenotype characterised by hypertriglyceridemia and
decreased HDL-cholesterol. It is the pattern most commonly seen in type 2 diabetes
and thought to be a consequence of insulin resistance. It is seen most commonly in
obese PCOS patients and is present in up to 70% of American women with PCOS
and only 50% of Italian women with PCOS [134]. The prevalence of increased
levels of LDL-cholesterol in women with PCOS is lower and ranges from 24 to 40%
[134, 135] and is less dependent on body weight [60]. Non-HDL cholesterol is also
significantly higher in women with PCOS, and remains so after adjusting for BMI
[60].
1.3.3 Smoking
Work conducted in our group, using a large community-based database, found that
39% of women with PCOS were current or ex-smokers compared to 35.1% of
controls [67]. Women with PCOS who smoke have a worse lipid profile than PCOS
non-smokers [136, 137]. Increased testosterone and fasting insulin levels have been
demonstrated in PCOS smokers compared to non-smokers [138], but another study
found no differences in androgen levels [136]. As obesity may be a confounding
factor in cardiovascular risk in women with PCOS, an Italian group studied smoking
in lean PCOS women and found that smoking increased markers of cardiovascular
25
risk in this group [139]. After adjustment for BMI, triglyceride levels were still
higher in PCOS smokers than non-smokers [136].
1.3.4 Non-Alcoholic Fatty Liver Disease
Non-alcoholic fatty liver disease (NAFLD) is the accumulation of fat in more than
5% of hepatocytes (confirmed on imaging or histology) with no significant alcohol
history or other cause found for the hepatic steatosis. There is evidence from cross-
sectional studies that NAFLD is associated with increased cardiovascular risk and
disease [140-142]. However, the evidence for this from cohort studies is conflicting
[143]. Potential co-founders are obesity and Type 2 diabetes which are commonly
present in patients with NAFLD, and are themselves independent risk factors for
cardiovascular disease.
NAFLD is present in 0-100% of women with PCOS depending on the criteria used
to diagnose PCOS and NAFLD [65]. Currently, there is little evidence to suggest
that NAFLD confers additional cardiovascular risk in women with PCOS.
Dawson et al compared the cardiovascular risk profiles in women with PCOS and
women with PCOS and NAFLD [144]. They did not find a difference in lipid
profile, blood pressure, biomarkers of endothelial function or inflammatory markers
between the two groups, despite the PCOS and NAFLD group being heavier. They
suggested that no difference was found because insulin resistance is thought to
contribute to the pathogenesis of both conditions. Sprung et al studied endothelial
function and body fat composition in women with PCOS. The hepatic intracellular
triaclyglycerol pools did not account for the endothelial dysfunction and the authors
concluded that PCOS women with NAFLD do not have additional cardiovascular
risk compared to women with PCOS alone [145].
26
1.4 PCOS and Cardiovascular Disease
With the increased prevalence of cardiovascular risk factors in women with PCOS, it
would be reasonable to expect an increase in cardiovascular events such as
myocardial infarction or stroke. Three large prospective cohort studies have found
an increased risk of cardiovascular events in women reporting clinical features of
PCOS [70-72] and this was discussed in more detail in section 1.1.7.2.
A meta-analysis in 2011 found the relative risk for coronary heart disease or stroke
was 2.02 comparing women with PCOS to women without PCOS. This increased
relative risk was reduced to 1.55 following adjustments for BMI [73]. However, a
large community-based, controlled study of young women with PCOS failed to find
an increased risk of large vessel disease [67]. This may have been because the
population was young and yet to develop cardiovascular events. A further meta-
analysis in 2014 examined non-fatal cardiovascular events in women with PCOS. In
women over 45 years, the risk of non-fatal stroke was significantly increased but this
became non-significant after matching for BMI [146]. In the group as a whole there
was no increased risk of non-fatal stoke or non-fatal coronary heart disease [146].
Two studies with 21 and 23 years of follow-up found no difference in cardiovascular
events between PCOS women and controls [74,147]. However, a 20 year
retrospective cohort study found (age-group-specific) odds ratios for the prevalence
of MI and angina in women with PCOS compared to the local female population
ranged between 2.6 (95%CI 1.0, 6.3) and 12.9 (95% CI 3.4, 48.6) with the highest
ratio being for MI in the over 65 year age group [148]. In this study there were
significant correlations with age, history of hypertension and smoking.

27
There is thus no evidence presently of increased cardiovascular events in young
women with PCOS. There may be an excess of cardiovascular events in older
women with PCOS but it is not possible to ascertain the mechanism from these
studies.
1.5 PCOS and Subclinical Cardiovascular Disease
Clinical cardiovascular events, such as MI and stroke, do not appear to be increased
in young women with PCOS but are possibly increased in older women with the
syndrome. It would be preferable to determine whether women with PCOS are at
increased risk of developing cardiovascular events before they happen. Coronary
atherosclerosis was found in 50% of young men (mean age 22 years) killed in the
Vietnam War [149]. Is it therefore possible to identify cardiovascular disease in
young asymptomatic women with PCOS?
1.5.1 Subclinical Cardiovascular Disease
Risk factors for cardiovascular disease identify people at higher risk of
cardiovascular events but do not assess their individual burden of disease. They are
useful therapeutic targets but do not identify an individual’s risk of sustaining an
event. Cardiovascular events are preceded by the development of atherosclerosis,
endothelial and myocardial dysfunction, which may serve as useful surrogate
measures of disease risk.
Atherogenesis begins at sites of injury to the endothelium (the inner layer of the
arterial vessel wall), often caused by local shear forces. This is exacerbated by high
levels of LDL-cholesterol, low levels of HDL-cholesterol, smoking, diabetes,
hypertension, oxidative stress and systemic inflammatory states. These factors

28
decrease the endothelial cell production of nitric oxide (NO). This vasodilatory
molecule inhibits key events in the development of atherosclerosis such as leukocyte
adhesion and migration, smooth muscle cell proliferation, platelet adhesion and
aggregation. When NO production is decreased, the vasodilatory capacity of the
blood vessel is reduced and the normal protective function of the vascular
endothelium is lost. LDL-cholesterol can then infiltrate into the subendothelial space
where it is oxidised. The dysfunctional endothelial cells also express adhesion
molecules (such as vascular cell adhesion molecule-1 (VCAM-1), intercellular
adhesion molecule-1 (ICAM-1)) that promote the binding of circulating monocytes
to the endothelium. The monocytes migrate into the carotid intima where they
differentiate into macrophages. The macrophages internalise the oxidised LDL-
cholesterol and become lipid-laden foam cells. Inflammatory mediators invade this
lesion and promote the formation of a fibrous cap. Ongoing inflammatory response
in the vascular wall promotes the accumulation of more LDL-cholesterol and the
growth of the lesion. The fibrous cap can rupture, resulting in platelet aggregation
and coagulation leading to the formation of thrombus. The thrombus can partially or
totally occlude a vessel resulting in a cardiovascular event [150-152].
Subclinical cardiovascular disease is the identification of these early changes in
asymptomatic individuals, before the progression to significant narrowing of the
blood vessels and symptomatic disease. This is important to improve risk
stratification and prevent clinical disease. For example, one study has demonstrated
that identifying subclinical cardiovascular disease improves medication adherence in
asymptomatic individuals [153].

29
1.5.2 Assessment of Subclinical Cardiovascular Disease
There are several non-invasive and invasive methods to identify subclinical
cardiovascular disease. These include assessment of endothelial function and
measuring the burden of arterial calcification and plaques, carotid artery intima-
media thickness, arterial stiffness and diastolic function of the heart.
Peripheral endothelial function can be measured using plethysmography of the
forearm circulation, flow-mediated vasodilatation (FMD) of the brachial artery and
finger plethysmography [152]. The former is limited by the need for arterial
puncture and the latter is a relatively new method. The most commonly used method
is the FMD technique. This involves placing an occluding cuff over an artery
immediately proximal or distal to the site to be imaged, for 5 minutes. In response to
the ischaemia, endothelial nitric oxide is released during the reactive hyperaemia
(flow-mediated) causing dilatation of the artery. Measurements of the artery
diameter are taken pre and post cuff inflation. When endothelial dysfunction is
present, FMD is reduced. Biochemical indices of endothelial function can also be
measured including total nitric oxide, nitrite and nitrate.
Coronary artery calcification (CAC) can be assessed using electron-beam computed
tomography (EBCT). Coronary calcium reflects the atherosclerotic plaque burden,
because calcium deposits are related to the lipid and apoptotic remnants of the
plaque [154]. The advantage of this technique is that it is non-invasive, however
there is exposure to a small amount of radiation and no information on the
susceptibility of plaques to rupture is gained [152].
Carotid intima-media thickness (CIMT) is measured in the common carotid artery,
using B-mode ultrasonography. It reflects the diffuse thickening of the intimal layer

30
during atherosclerosis. This non-invasive technique does not expose a subject to
radiation and is highly reproducible. However, as with EBCT CAC measurement, it
does not give an indication of susceptibility of plaques to rupture [152]. High
resolution magnetic resonance imaging is a non-invasive method which does not
expose an individual to radiation and is able to measure plaque volume, composition
and susceptibility to rupture [152]. However, this is not widely available and is
expensive. Coronary angiography allows direct visualisation of the plaque burden
and degree of luminal narrowing of the coronary arteries but is invasive.
Arterial stiffening occurs when the arterial wall becomes less elastic or distensible
resulting in a reduction of the capacity of the vessel to accommodate volume
changes throughout the cardiac cycle. Atherosclerosis is thought to contribute to
arterial stiffening [155,156]. Possible mechanisms of arterial stiffening include
derangement of the elastic laminae with increasing age [157]; hypertension induced
structural changes such as hypertrophy and changes in the extracellular matrix [158];
disruption of the nitric oxide pathway in the endothelium affecting the vascular tone
and elastic properties of the arterial wall [159] and a direct effect of insulin on the
vessel wall or elevated glucose levels resulting in collagen cross linking due to non-
enzymatic glycation [160]. Arterial stiffness can be measured non-invasively using
applanation tonometry and this technique is discussed in more detail in Chapter 2.
The principal measurement recorded is the pulse wave velocity (PWV); the stiffer
the arteries the higher the PWV.
There are two aspects of diastolic heart function; relaxation and stiffness, which
describe different properties of the myocardium. The relaxation phase (a dynamic
and energy consuming phase) begins at the end of systolic contraction and continues
throughout isovolumic relaxation and early diastolic filling. Impairment of this
31
phase is due to regional dyssynchrony or a reduction in energy supply such as
myocardial hypertrophy or ischaemia. Diastolic stiffness is measured at the end of
diastole and reflects passive ventricular motion; it is dependent on left atrial
contractility and the viscoelastic properties of the left ventricle. Changes in stiffness
result from changes in the composition of the myocardium such as interstitial
fibrosis or left ventricular hypertrophy [161]. Diastolic function may by assessed by
pulsed myocardial velocity imaging of the lateral and septal mitral annulus averaged
over three consecutive cycles. Early diastolic (e’) and atrial (a’) myocardial
velocities are recorded. The e’ reflects passive filling and a’ reflects filling related to
atrial contraction. In a compliant ventricle, most of the filling occurs passively and
e’ is larger than a’. In impaired relaxation, diastolic dysfunction, e’ declines and a’
increases as atrial contraction contributes more to diastolic filling.
1.5.3 Endothelial Dysfunction
Endothelial dysfunction measured by FMD has been shown to correlate with
coronary artery endothelial function [162] and be an independent predictor of
coronary artery disease [163]. Endothelial dysfunction in women with PCOS,
assessed by reduced FMD, has been demonstrated in some [164,165] but not all
[166,167] studies. A recent meta-analysis has found that the pooled mean FMD was
3.4% lower in women with PCOS compared to controls and that the difference was
not influenced by BMI or age [168].
A few studies have measured total nitric oxide in women with PCOS and controls
and not found any differences between the groups [169, 170]. Work in our own
group has confirmed this using more sensitive methods to assess nitric oxide and its
metabolites [171].

32
1.5.4 Coronary Artery Calcification
A meta-analysis of 30 prospective studies in asymptomatic subjects found that the
presence of CAC was associated with an increased risk of cardiovascular and all-
cause mortality [172]. The American College of Cardiology Foundation and the
American Heart Association have provided pooled data for outcome with CAC
scores [173]. In the absence of CAC, there was a low risk of cardiovascular events.
However, the relative risk of cardiovascular events in those with intermediate and
high levels of CAC scores compared to those with low levels were 4.3 and 7.2
respectively.
The Dallas heart study did not find an increase in CAC in pre-menopausal women
with PCOS compared to controls despite the PCOS group having a greater
prevalence of cardiovascular risk factors and higher BMI and blood pressure [174].
However, other studies have found an increased prevalence of CAC in pre-
menopausal women with PCOS [175-177] and post-menopausal women with PCOS
[178].
1.5.4 Carotid Intima Media Thickness
A systematic review and meta-analysis of CIMT and cardiovascular events found an
increase in CIMT thickness of 0.10mm predicted a 15% increased risk of myocardial
infarction and an 18% increased risk of stroke [179].
Some studies have demonstrated an increase in CIMT in young women with PCOS
compared to BMI and age matched controls [180-185] but not others [166, 186].
One study demonstrated a difference in CIMT in older PCOS subjects only [187].
The mean difference in CIMT among women with PCOS compared to controls was
found to be 0.072 mm (95% CI 0.04-0.105, P<0.0001) in a meta-analysis of high

33
quality studies, however there was no significant difference in studies with fair or
lower quality [188].
1.5.5 Arterial Stiffness
Augmentation Index and PWV, both measures of arterial stiffness, independently
predict cardiovascular events and/or mortality in the general population [189, 190],
the elderly [191, 192] and in disease states including end-stage renal disease [193,
194], hypertension [195, 196] and impaired glucose tolerance/diabetes [197].
Arterial stiffness has also been associated with cardiovascular risk factors including
hypercholesterolaemia [198] and smoking [199].
In women with PCOS some studies have found evidence of increased arterial
stiffness [201-203]. One study found evidence of increased arterial stiffness in the
brachial artery but not the aorta of women with PCOS [204].
1.5.6 Diastolic Dysfunction
Risk factors for the development of preclinical diastolic dysfunction include
coronary artery disease, diabetes, hypertension, hyperlipidaemia and the metabolic
syndrome [205]. Diastolic dysfunction has been shown to progress to heart failure
and is an independent risk for all-cause mortality [206,207].
Impaired diastolic function has been reported in some studies comparing PCOS
women with age and BMI matched controls [180, 208] but not all [209].

34
1.6 Me chanisms of Cardiovascular Disease in PCOS
The potential mechanisms of cardiovascular disease in PCOS are discussed below.
1.6.1 Obesity
Traditionally, adipose tissue has been seen as an inert store of energy but has
recently been identified as a metabolically active endocrine organ which secretes
adipose-tissue derived substances such as adipocytokines affecting a range of body
functions. Excess adipose tissue results in obesity, a chronic, low-grade pro-
inflammatory state in which the hyperplasia and hypertrophy of adipose cells causes
a disturbance of adipokine secretion [210]. The systemic inflammation and
abnormal production of adipocytokines have been identified as important factors in
the formation and progression of atherosclerosis [211].
1.6.1.1 Adipose Tissue Distribution
The distribution of adipose tissue is important as visceral adiposity is an independent
risk factor for cardiovascular disease [112, 113, 114] and there are obese people who
appear to be metabolically healthy and not at increased risk for cardiovascular events
[212, 213]. Waist circumference is a stronger risk factor than BMI for
cardiovascular disease [113, 214, 215] and waist circumference correlates well with
visceral adipose tissue volume [216]. This has been proposed as a reason for men
having higher rates of cardiovascular disease than women as they are more likely to
accumulate fat around the abdomen (android obesity) than women who are more
likely to accumulate fat around the lower body (gynoid obesity) [217]. The
Framingham study found that 40% of men and women had increased visceral fat
despite modestly elevated BMI of 27 kg/m2
in women and 28 kg/m2
in men [218].
The adipose tissue expandability theory, mentioned previously, could explain this
35
finding. In a state of positive energy balance, once an individual has reached the
limit of their capacity to store fat in the subcutaneous tissues a lipotoxic state
develops and one of the consequences is accumulation of fat in ectopic deposits. Not
all individuals increase visceral fat when overfed, only those with a defective
regulation of lipid-storing genes in subcutaneous fat [219].
Women with PCOS may have greater central adiposity than BMI-matched controls
in both non-obese and obese subjects [56, 118]. Whether obesity or central
adiposity are independent risk factors for cardiovascular risk/disease in PCOS is yet
to be established.
As part of the adipose tissue expandability hypothesis, an unfavourable
adipocytokine profile is suggested and this may provide a link between visceral fat
and cardiovascular disease and will be discussed further below.
1.6.1.2 Adipocytokines
Adipocytokines are peptides secreted by adipose tissue. Adipokines (adiponectin,
leptin, visfatin, apelin, chemerin and acute-phase serum amyloid A) are secreted
from the adipocytes whereas cytokines (TNFα and interleukins) are secreted from
the stromovascular cells. Resistin is an adipocytokine secreted from both adipocytes
and stromovascular cells.
Adiponectin has anti-inflammatory, anti-atherogenic and anti-diabetic effects, and
promotes good endothelial function [220]. Weight loss and insulin-sensitising drugs
increase plasma adiponectin levels [221]; pro-inflammatory cytokines reduce the
secretion of adiponectin from cultured adipocytes [222] which provides evidence to
support the link between inflammation and insulin resistance and obesity. Plasma
adiponectin levels appear to be reduced in people with insulin resistance and

36
coronary artery disease [223]. A systematic review and meta-analysis has found that
adiponectin levels are significantly lower in PCOS women compared to BMI-
matched controls [224]. Low levels of adiponectin were associated with insulin
resistance and PCOS severity but not with testosterone in the PCOS group [224].
However, a recent randomised controlled trial in women with PCOS found no effect
of metformin on adiponectin levels despite weight loss and an improvement in
insulin resistance [225].
Leptin promotes insulin resistance, hypertension, atherosclerosis, vascular
inflammation, oxidative stress and endothelial dysfunction but may reduce infarct
size and decrease hypoxic damage in cardiomyocytes [220]. Leptin levels rise with
increasing body fat and may be a link between obesity and cardiovascular disease.
In the general population leptin is associated with cardiovascular disease but this is
dependent on BMI [226]. In women with PCOS, some studies have found no
association of leptin with PCOS after accounting for BMI [227, 228] but others have
noted increased leptin levels independent of obesity [229, 230]. One study has found
that secretion of leptin is altered in women with PCOS compared to normal women
[231].
Visfatin is mainly produced in visceral fat and may reduce infarct size and reduce
hypoxic-induced damage. However, high levels of visfatin are associated with
endothelial inflammation, plaque destabilisation, increased oxidative stress and
increased pro-inflammatory cytokine levels [220]. One study has suggested that
visfatin may be an important link between intra-abdominal obesity and diabetes
[232] but others have disputed this [233, 234]. Visfatin increases insulin secretion
and insulin receptor phosphorylation in mouse pancreatic β-cells [235] and increases
with progressive β-cell deterioration in Type 2 Diabetes [236]. In women with

37
PCOS, circulating visfatin levels are positively associated with BMI [237-239],
fasting insulin levels [239] and blood pressure [238].
Apelin reduces atherogenesis, macrophage inflammation, cardiomyocyte
contractility and heart failure and increases serum adiponectin levels and decreases
leptin levels [220]. Significantly lower levels of apelin have been demonstrated in
women with PCOS compared to BMI matched controls [240, 241].
Chemerin is thought to reduce endothelial cell inflammation and promote
angiogenesis [220]. It also plays a role in adipocyte differentiation, glucose
homeostasis and lipolysis in adipose tissue [242]. Plasma levels are positively
correlated with BMI, blood pressure and circulating triglycerides [243]. It has been
found to be associated with arterial stiffness, after adjustment for other
cardiovascular risk factors [244] but does not predict coronary atherosclerosis [245].
In women with PCOS, chemerin levels are increased and metformin has been shown
to reduce levels whereas insulin increases the levels [246].
Acute-phase serum amyloid A (ASAA) is a pro-inflammatory adipokine that is
increased in obese and insulin-resistant people. It is also elevated in the plasma and
adipose tissue (visceral and subcutaneous depots) in women with PCOS. Treatment
with metformin for six months reduces the level of ASAA [247].
Adiponectin and leptin, two of the first adipokines to be discovered, have been more
extensively researched than the others. Adiponectin and apelin appear to have a
protective role and be anti-inflammatory and anti-atherogenic whereas leptin and
ASAA are pro-inflammatory and pro-atherogenic. Chemerin and visfatin are less
clear-cut. Adipokines have a role in the metabolic abnormalities seen in PCOS but
whether they are a cause or consequence of the syndrome is yet to be determined.

38
Resistin is secreted by macrophages and is associated with endothelial dysfunction
(promotes adhesion molecules and proliferation), insulin resistance and increases
secretion of pro-inflammatory cytokines [220]. It has been shown to be predictive of
5 year mortality in people who have had an atherothrombotic stroke [248]. There is
no difference in resistin serum levels between PCOS subjects and matched controls
but messenger RNA levels were twice as high in omental adipocytes from PCOS
women [249].
Interleukins and TNF-α were discussed in section 1.2.6.
1.6.2 Insulin Resistance
Insulin resistance is present in both obese and non-obese women with PCOS [84]
and could provide a link between PCOS and cardiovascular disease independently of
BMI. Insulin resistance itself increases the risk for coronary artery disease [250].
Endothelial cells, vascular smooth muscle cells and macrophages all involved in the
development of atherosclerosis, express insulin receptors which are down-regulated
in hyperinsulinaemia [251]. The PI3K and MAPK insulin signalling pathways
regulate endothelial NO production and secretion of endothelin-1 (a vasoconstrictor)
respectively, and the balance of these determines the response of the vessel to
insulin. In insulin resistance the PI3K pathway is down regulated but the MAPK
pathway remains intact [252]. This results in a reduction in available NO and
therefore a relative increase in endothelin-1 both of which contribute to endothelial
dysfunction and the development of atherosclerosis, as demonstrated in mice [251].
In humans, IR has been shown to alter large artery compliance [253] and affect
endothelial function [254]. Insulin is not able to reduce aortic stiffness in insulin-
resistant subjects and this correlates with whole-body insulin resistance [255]. These
39
studies provide further evidence to support a link between insulin resistance and
subclinical cardiovascular disease.
1.6.3 Hyperglycaemia
Insulin resistance and a failure of pancreatic β cells to secrete enough insulin results
in hyperglycaemia. There is evidence that lowering glucose levels results in a
reduction in cardiovascular events in Type 1 and Type 2 Diabetes [256-258]. An
association between glucose level 2 hours after a 75 gram glucose load and
cardiovascular disease has been demonstrated in the general population [259, 260].
These findings suggests that there could be a link between hyperglycaemia and
cardiovascular disease.
Hyperglycaemia results in increased leucocyte adhesion to endothelial cells, an
initial step in atherogenesis, likely mediated by increased expression of adhesion
molecules such as VCAM-1 and ICAM-1 and increased oxidative stress [261].
Hyperglycaemia-induced advanced glycation end products (AGEs) formed by non-
enzymatic reaction of glucose with proteins and lipids and can occur intra- or extra-
cellularly [262]. These bind to the receptor for AGEs (RAGE) which promotes
VCAM-1 expression [263]. Blocking of RAGE has been shown to prevent
atherosclerosis in a mouse model [263]. High intracellular glucose concentrations
also activate protein kinase C (PKC) which results in generation of reactive oxygen
species [264] which are discussed below and are implicated in atherogenesis.
1.6.4 Oxidative Stress
Excessive production of oxidants in the presence of limited antioxidants results in
oxidative stress and this has been proposed as a unifying mechanism for the
development of endothelial dysfunction resulting from a number of cardiovascular

40
risk factors such as diabetes, hypertension and smoking [265]. Oxidants include
reactive oxygen species (ROS), products of normal cellular metabolism derived from
oxygen and reactive nitrogen species (RNS) derived from nitrogen oxide. At low
levels, ROS and RNS have a beneficial role including defence against infections. At
high levels, they damage DNA and cellular lipids and proteins [266]. Antioxidants
such as glutathione peroxidase and paroxanase, dispose of or prevent formation of
oxidants.
ROS have been implicated in the formation of the fatty streak in atherosclerosis
through to plaque rupture [265]. In humans, ROS production is significantly higher
in unstable angina versus stable angina, suggesting a role in modulating plaque
stability [267]. Nicotinamide adenine dinucleotide phosphate oxidase (NAD(P)H)
and Xanthine Oxidase (XO) are enzymes in vascular cells which generate ROS, and
these have been shown to be activated in coronary arteries of patients with coronary
artery disease [268].
Oxidant levels are increased in obesity [269, 270] and are decreased in response to
weight loss and calorie restriction [271, 272]. Contributors to oxidative stress in
obesity include hyperglycaemia, hyperlipidaemia, hyperleptinaemia and chronic
inflammation [272].
A meta-analysis has found increased circulating levels of homocysteine and
asymmetric dimethylarginine (both increase ROS production) in women with PCOS
compared to controls [273]. Circulating glutathione, and paroxonase-1 activity (both
anti-oxidants) were decreased in women with PCOS compared to control women
[273]. These findings persisted when studies which BMI and age matched women in
PCOS and control groups were examined [273]. This is an important finding as

41
obesity itself is associated with increased oxidative stress and obesity is common in
PCOS. Oxidative stress may have a role in vascular dysfunction in women with
PCOS independently of weight.
1.6.5 Androgens
Before the age of 75, the incidence of heart disease is lower in women than men. It
has been postulated that androgens may have a detrimental effect on cardiovascular
health and/or that oestrogens are protective. In support of this, adolescent boys have
higher blood pressure than age-matched girls when androgen levels are increasing
[274] and in rat models, castrated male rats and males rats treated with flutamide
have blood pressures equivalent to female rats and significantly lower than untreated
males [275]. It has been speculated that androgens cause an increase in renin
activity, resulting in an increase in angiotensin II. This results in hypertension via
oxidative stress causing renal vasoconstriction and by increasing sodium
reabsorption [276].
However, there is an increasing amount of data suggesting that low testosterone
levels in men are associated with an increase in cardiovascular mortality and
morbidity [277-281]. Low testosterone may reflect poor health; obesity and Type 2
Diabetes are associated with low testosterone levels, which are risk factors for
cardiovascular disease themselves and therefore possibly confounding factors. If
testosterone was detrimental to cardiovascular health, it would be expected that
female to male transsexual patients treated with testosterone would have
significantly increased cardiovascular disease events, but this has not been found
[281]. Testosterone replacement to physiological levels has been shown to improve
risk factors for atherosclerosis including reduction of central adiposity and insulin

42
resistance, improvement of lipid and inflammatory profiles and vascular function
[282]. Animal studies have shown that castration accelerates aortic plaque
development whilst testosterone replacement significantly reduced plaque formation,
also suggesting a link between testosterone and atherosclerosis [283]. Testosterone
may exert an anti-atherogenic effect by causing vasodilatation; reducing pro-
inflammatory cytokine production; reducing adhesion molecule expression and
inhibiting the formation of foam cells [284]. It is not clear whether androgens are
beneficial or detrimental in health.
In women with PCOS there are also conflicting results regarding cardiovascular
disease and androgens. Compared to healthy controls, CIMT was increased in
women with PCOS independently of obesity but related directly to androgen excess
[185]. In a different study, treatment with spironolactone (an anti-androgen)
improved endothelial function to the same extent as healthy controls but without a
change in androgen levels [285]. However, one study found that
dehydroepiandrosterone sulphate was a strong negative predictor of CIMT in women
with PCOS, suggesting a protective effect of androgens [184].

43
1.7 Thesis Aims
PCOS is a common endocrine disorder of young women associated with many
cardiovascular disease risk factors. Whether this collection of risk factors results in
an increase in cardiovascular events is debated. Large cohort studies have suggested
an increase in non-fatal and fatal cardiovascular events in women who reported
irregular menstruation [70-72]. One meta-analysis found that women with PCOS
were twice as likely to have a cardiovascular event compared to controls, however
the odds ratio was reduced to 1.55 after adjustment for BMI [73]. Other studies have
failed to demonstrate an increase in cardiovascular events in pre- or post-menopausal
women with PCOS [67, 147, 148].
Markers of subclinical cardiovascular disease may be increased in young and middle
aged women with PCOS including endothelial dysfunction [164-166], carotid
intima-media thickness [180-185], arterial stiffness [164, 166, 200] and myocardial
dysfunction [180, 208]. However, it is difficult to determine how much of this is due
to PCOS per se or to obesity which is common in PCOS and is itself a risk factor for
cardiovascular disease. One study has found no difference in large artery
distensibility in women with PCOS compared to controls, but did find that it was
inversely related to adiposity [201].
Hypothesis: Cardiovascular risk (measured by arterial stiffness, common carotid
intima-media thickness and myocardial dysfunction) is increased in young women
with PCOS independently of obesity compared to healthy volunteers.

44
Aims
1. Determine whether cardiovascular risk is increased in young women with
PCOS independently of obesity.
2. Explore the relationship between regional body composition and markers of
subclinical cardiovascular disease in young women with PCOS.
3. Explore the relationship between insulin sensitivity and markers of
subclinical cardiovascular disease in young women with PCOS.

45
CHAPTER 2: METHODS
2.1 Outline of Study
2.1.1 Study Approval
The study was approved by the Research and Development department at the
University Hospital of Wales (UHW) (Ref 08/RPM/4276) and the South East Wales
Research Ethics Committee (Ref 08/WSE04/53), before it commenced. The study
was sponsored by Cardiff University (CU) (Ref SPON CU 523-08).
2.1.2 Recruitment
Patients aged between 16 and 45 years of age were recruited from local
endocrinology, dermatology and gynaecology clinics. They were provided with an
information sheet giving details about the study (Appendix 1). The initial contact
was followed up with a telephone call to determine interest and confirm eligibility.
Healthy volunteers (HVs) aged between 16 and 45 years, were recruited from UHW
and CU using poster advertisements and intranet postings (Appendix 2). Further
recruitment of HVs was achieved by advertising in the local paper (Appendix 3). All
interested, eligible women were provided with an information sheet (Appendix 4)
and were telephoned a week later to determine if they wished to participate or not.
2.1.3 Inclusion and Exclusion Criteria of Study Participants
Patients who met the Rotterdam criteria for diagnosis of PCOS were included [6].
Congenital adrenal hyperplasia, Cushing’s syndrome, androgen-secreting tumours,
hyperprolactinaemia and thyroid dysfunction were excluded by biochemical testing.
Women were excluded from participation if they were pregnant, breastfeeding or if
they had a history of diabetes, hypertension or hyperlipidaemia. Potential
participants who were taking, or had taken in the previous 3 months, anti-

46
hypertensive agents, lipid-lowering agents, glucose lowering agents, weight reducing
agents or glucocorticoids were also excluded.
The healthy state of the volunteers was established by history, physical examination
and biochemical testing. They were included if they had regular menstrual cycles
(every 27-32 days) and excluded if there was a family history of PCOS, evidence of
hyperandrogenism or if they had a history of hypertension, hyperlipidaemia or
impaired glucose metabolism.
All women were investigated during the follicular phase of their menstrual cycle if
they had mild oligomenorrhoea or eumenorrhoea. No restrictions were applied to
women with severe oligomenorrhoea or amenorrhoea.
2.1.4 Consent
All participants gave written informed consent prior to entering the study
(Appendices 5 and 6).
2.1.5 Protocol
Participants attended the Clinical Research Facility (CRF), UHW at 8am following
an overnight fast. All subjects had a pregnancy test to confirm that they were not
pregnant before a clinical assessment, venepuncture and oral glucose tolerance test
were undertaken. Computed tomography (CT) and dual energy x ray absorptiometry
(DEXA) scans were performed at the Medical Physics Department in UHW, carotid
ultrasound and echocardiography at The Wales Heart Institute, UHW and
applanation tonometry at the CRF. The information acquired was recorded on case
report forms (Appendices 7 and 8).

47
2.2 Clinical Assessment
The clinical assessment was undertaken by me.
2.2.1 History and Examination
Details of past medical history, medication taken currently and in the previous 3
months, contraceptive use, smoking history, family history and menstrual history
were recorded. A routine physical examination was performed.
2.2.2 Blood Pressure Measurement
After five minutes of rest in a seated position, three blood pressure recordings were
taken from the right brachial artery using a validated semi-automated oscillometric
device (Omron 7051T; Omron Corporation, Tokyo, Japan). The mean of these
recordings was used in this study.
2.3 Biochemical and Metabolic Measurements
The blood sampling was undertaken by me.
2.3.1 Sample Collection and Storage
With the subject at rest, an intravenous cannula or butterfly needle was inserted into
a suitable vein in the antecubital fossa or forearm and secured. Blood was obtained
directly into blood bottles via a vaccutainer or via a syringe and then decanted into
blood bottles. The cannula or butterfly needle was then flushed with 5 millilitres
(mls) of normal saline. The bottles were marked with the subject number and 0
minutes. The subject then received a drink containing 113 mls of Polycal® with 187
mls of water. Thirty, 60, 90 and 120 minutes later further blood samples were
collected and marked with the subject number and time. The first 5 mls of blood at
each collection were discarded and the cannula was flushed with 5 mls of normal
saline after the sampling was completed. The cannula or butterfly needle was
48
removed after the 120 minutes sample was taken. Samples were centrifuged at 4000
rpm for 8 minutes and stored at -30°C prior to analysis.
2.3.2 Assays
Serum total cholesterol, high density lipoprotein cholesterol (HDL) and triglycerides
were assayed using an Aeroset automated analyser (Abbott Diagnostics, Berkshire,
UK); LDL cholesterol (LDL) was calculated using Friedewald’s formula. Insulin
was measured using an immunometric assay specific for human insulin (Invitron,
Monmouth, UK) and glucose was measured using the Aeroset chemistry system
(Abbott Diagnostics, Berkshire, UK). High sensitivity C-reactive protein (hsCRP)
was assayed by nephelometry (BN™ II system, Dade Behring, Milton Keynes, UK)
and total testosterone was measured by liquid chromatography-tandem mass
spectrometry (Quattro™ Premier XE triple quadruple tandem mass spectrometer,
Waters Ltd, Watford, UK). High molecular weight (HMW) adiponectin was
measured by ELISA (EMD Millipore, Billerica, MA). The intra- and inter-assay
coefficients of variation were all less than 9%.
2.3.3 Estimations of Insulin Sensitivity and Insulin Resistance
The hyperinsulinaemic-euglycaemic clamp is the gold standard method to measure
insulin sensitivity [286]. Insulin is infused intravenously at a constant rate in
subjects who have fasted overnight. Blood glucose levels are measured every 5 to
10 minutes and 20% dextrose is given intravenously at a variable rate to maintain
euglycaemia. It is assumed that the hyperinsulinaemic state suppresses hepatic
gluconeogenesis. After several hours of constant insulin infusion, steady state
conditions are achieved for plasma insulin, blood glucose and glucose infusion. As
there is no net change in glucose, the glucose infusion rate equals glucose disposal
rate (GDR) in the subject. To generate an estimate of insulin sensitivity, GDR is

49
normalised to body weight or fat free mass (FFM). Alternatively, an insulin
sensitivity index is calculated using the formula:
SIClamp = M/(G x ∆I)
where M = glucose infusion rate, G = steady state blood glucose concentration and
∆I = difference between fasting and steady-state insulin concentrations. Tam et al
have determined that an individual with an M or GDR value of
<5.6mg/kgFFM+17.7∙min has an 80% chance of being insulin resistant [287]. The
main advantage of this method is that whole body glucose disposal is measured
directly at a defined level of hyperinsulinaemia. However, the method is labour-
intensive, time consuming and expensive and for these reasons was not used as there
were large numbers of subjects recruited to the study.
Alternative methods have been established to overcome the limitations of the
hyperinsulinaemic-euglycaemic clamp. Two well described and widely published
methods are the homeostatic model assessment (HOMA) [288] and the quantitative
insulin sensitivity check index (QUICKI) [289]. HOMA-IR is a paradigm model
derived from a mathematical assessment of the interaction between β-cell function
and IR and is calculated using the formula:
HOMA-IR = (FPI x FPG)/22.5
where FPI = fasting plasma insulin (mU/l) and FPG = fasting plasma glucose
(mmol/l). QUICKI uses a log transform of the insulin-glucose product and therefore
correlates to HOMA-IR. These methods require a single fasting insulin and fasting
glucose measurement and are therefore ideal for studies involving large numbers of
subjects. HOMA-IR was used in this study for these reasons and because it correlates
highly (Rs=0.88, P<0.0001) with the hyperinsulinaemic-euglycaemic clamp [288].

50
The above methods do not measure insulin sensitivity in a dynamic state. An OGTT
enables assessment of glucose tolerance and insulin secretion in response to a
glucose challenge. Insulin measurements at 0, 30, 60, 90 and 120 minutes after a 75
grams glucose challenge allow calculation of area under curve (AUC) insulin. The
AUC insulin will be greater in an insulin resistant subject than a normal subject, as
more insulin will be secreted in response to the glucose load. This is clinically
important and has been associated with cardiovascular mortality [290]. Post-
challenge insulin levels have also been shown to improve the performance of
visceral fat adiposity in identifying subjects with metabolic disease [291]. Glucose
levels 2 hours after an oral glucose challenge have also been associated with
cardiovascular mortality [292, 293].
2.4 Body Composition Measurements
2.4.1 Anthropometric Measurements
The anthropometric measurements were taken by me.
Height was measured to the nearest 0.1 centimetre (cm) using a stadiometer and
recorded in metres (m). Measurements were taken with the subject’s footwear
removed. Their head, back, buttocks and heels were placed against the wall and they
were asked to look straight ahead. The headboard was then moved until firmly
pushing on the vertex.
Weight was measured to the nearest 0.5 kilogram using digital weighing scales
(Omron Monitor BF500, Omron Corporation, Japan). Subjects wore light clothing
and had footwear removed.
Body Mass Index (BMI) was calculated as weight (kg) divided by height (m)
squared.

51
Waist circumference was measured at minimal respiration to the nearest 0.5 cm by
positioning a tape parallel to the floor and immediately above the superior iliac
crests. Hip circumference was measured to the nearest 0.5 cm by positioning a tape
parallel to the floor and at the greatest protrusion of the buttocks.
2.4.2 Dual Energy X Ray Absorptiometry
A whole body image was obtained (Hologic Discovery A absorptiometer) with the
subject in the supine position. Body composition was determined using Auto Whole
Body Fan Beam software version 13.3.0.1:3 by a single operator, Dr Sarah
Darlington who was blind to the subject status. An example of the image recorded is
shown in Figure 2.1. The image was subdivided into different regions by adjusting
the white lines on the image to ensure all tissues were enclosed. Fat mass, lean mass
and percentage fat were determined for regional areas and in total. An example of
the output generated is shown in Figure 2.2.
Figure 2.1 An Example of the DEXA Image Acquired
Adipose tissue
Lean tissue
Line subdividing body into regions

52
Figure 2.2 An Example of the Body Composition Results
2.4.3 Computed Tomography
With the subject in the supine position, one cross-sectional scan was obtained by CT
(Hawkeye, GE Medical Systems) using standard acquisition parameters (140kV,
2.5mA, 10mm slice width, 13.6 s rotation time, 2562
pixel matrix) at the level of the
fourth and fifth lumbar spines. The image was imported into MATLAB (Maths
Works) and analysed by a single operator, Dr Helen Blundell who was blind to
subject status. The image was segmented into areas of non-adipose tissue and
adipose tissue using a fixed range of CT numbers (-120 to -80 to represent fat)
derived from a previously published study [294]. The visceral adipose tissue area
and total adipose tissue areas were calculated by segmenting an intra-peritoneal
region and the whole image respectively as shown in Figure 2.3. Subcutaneous
adipose tissue area was calculated by subtracting the visceral fat area from the total
fat area.

53
Figure 2.3 Cross-sectional CT Scan Image
2.5 Vascular Measurements
Arterial stiffness and carotid intima thickness were measured to assess the vascular
status of the subjects. The methods used were applanation tonometry and carotid
ultrasound, respectively. These methods were chosen because they are non-invasive
and highly reproducible and therefore ideal for studies involving large numbers of
subjects.
2.5.1 Applanation Tonometry
The Sphygmocor® apparatus (AtCor Medical, Sydney, Australia) was used to
measure peripheral arterial wave forms from which measures of arterial stiffness
were derived. A highly sensitive pressure transducer (tonometer) was placed over
the point of maximal palpable pulsation of the radial, carotid or femoral artery.
Gentle downward pressure was applied to the sensor to partially compress the artery
beneath underlying structures, as shown in Figure 2.4. The sensor detected dynamic
Intraperitoneal region enclosed within the yellow line.
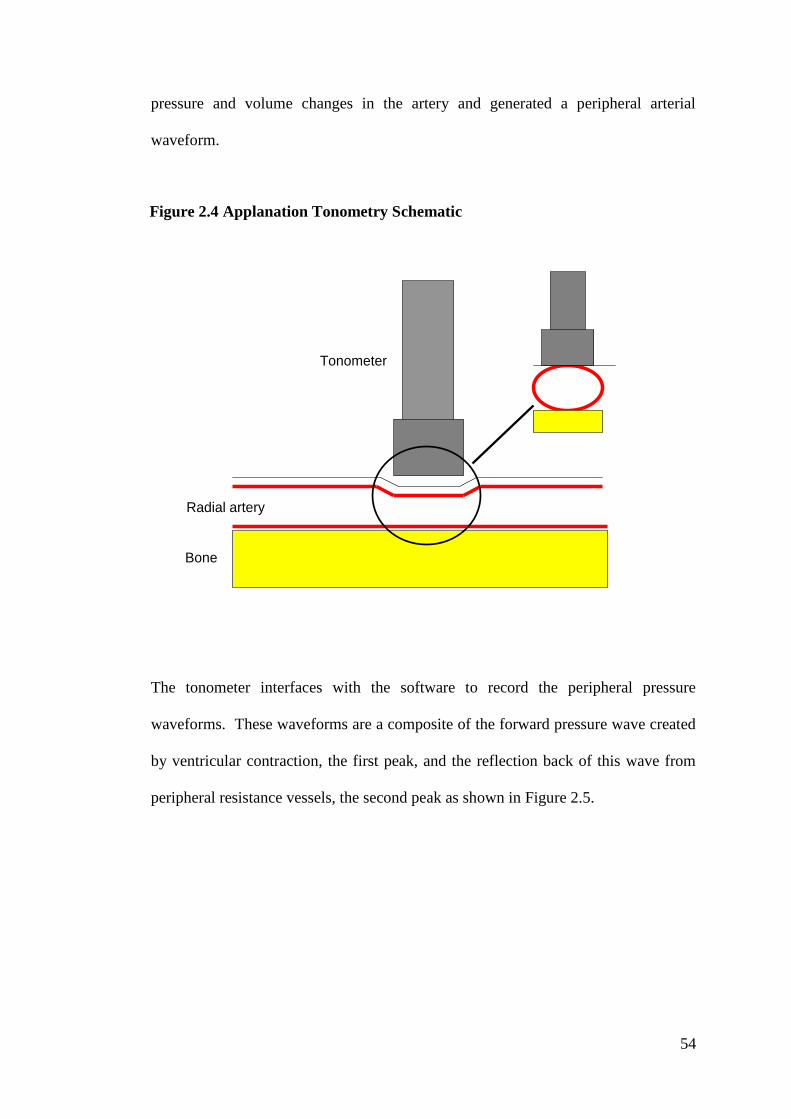
54
pressure and volume changes in the artery and generated a peripheral arterial
waveform.
The tonometer interfaces with the software to record the peripheral pressure
waveforms. These waveforms are a composite of the forward pressure wave created
by ventricular contraction, the first peak, and the reflection back of this wave from
peripheral resistance vessels, the second peak as shown in Figure 2.5.
Bone
Radial artery
Tonometer
Figure 2.4 Applanation Tonometry Schematic

55
Fig. 2.5 Radial Peripheral Waveform Recorded by Applanation Tonometry
(adapted from Oliver et al 2003 [295])
The Sphygmocor® software derives a central pressure waveform, as shown in Figure
2.6, from 20 recorded and averaged peripheral waveforms using a validated,
generalised transfer function [296]. Augmentation index (Ai) (the difference between
the first and second systolic peaks (∆P) expressed as a percentage of the pulse
pressure (PP)), is a measure of arterial stiffness and can be derived from the central
pressure waveform.
Primary systolic peak
Secondary systolic peak
Time (milliseconds)
Blood pressure (mmHg)

56
Figure 2.6 Central Aortic Waveform Derived From Peripheral Wave Form
using a Generalised Transfer Factor (adapted from Oliver et al 2003 [295])
P1 First systolic peak
P2 Second systolic peak
∆P Difference between first and second systolic peaks
PP Pulse pressure
TF Foot of wave
TR Time between TF and inflection
Before clinical cardiovascular events occur, arterial walls becomes less elastic or
distensible resulting in a reduction of the vessel capacity to accommodate volume
changes throughout the cardiac cycle. Higher systolic pressures are generated as the
aorta distends less well, maintenance of the pulse pressure is impaired due to reduced
elastic recoil and pressure waves and their reflections from peripheral resistance
vessels are transmitted at higher velocities. Therefore, in stiffer arteries the reflected
wave is seen earlier and if it appears before aortic valve closure will add to or
augment the pressure produced by the initial wave resulting in higher central arterial
pressures and a higher Ai.
Ai and pulse wave velocity (PWV), measures of arterial stiffness, independently
predict cardiovascular events and/or mortality in the general population [189, 190],
P1
P2
∆P
TR
PP
TF
incisura
Time (milliseconds)
Blood pressure
(mmHg)

57
the elderly [191, 192] and in disease states including end-stage renal disease [193,
194], hypertension [195, 196] and impaired glucose tolerance/diabetes [197].
Arterial stiffness has also been associated with cardiovascular risk factors including
hypercholesterolaemia [198] and smoking [199].
Measurements were taken by me in accordance with international recommendations
[297].
Formal training was undertaken for pulse wave analysis using the sphygmocor at the
‘Arterial Stiffness Theory and Practice’ course at the Vascular Research Unit in
Addenbrooke’s Hospital. Prior to commencement of the study, intra-operator
variability was established by performing pulse wave analysis on 15 volunteers at
two time points, ten minutes apart. The mean difference and the standard deviation
of the difference between the readings were calculated for augmentation index and
aortic pulse wave velocity and were 2.93% and 1.98% and 0.35m/s and 0.29m/s
respectively, as shown in Table 2.1. This is comparable with previously published
data which found the intra-operator standard deviation of the difference between
readings to be 5.37% for augmentation index and 1.09 m/s for aortic pulse wave
velocity [298].

58
Table 2.1 Intra-operator Variability for Pulse Wave Analysis
Age AIx 1 AIx 2 Difference
AIx 1 & 2
aPWV 1 aPWV 2 Difference
aPWV 1
&2
22 3.0 2.0 1 5.9 5.6 0.3
39 0.0 2.0 2 7.6 6.8 0.8
36 16 11 5 5.7 5.8 0.1
34 10 10 0 7.7 7.5 0.2
34 23 25 2 6.5 5.8 0.7
26 -6.0 -8.0 2 6.5 6.5 0.0
45 30 30 0 6.1 7.0 0.9
40 35 30 5 7.4 6.7 0.7
42 16 13 3 8.6 8.7 0.1
38 5.0 10 5 8.3 8.4 0.1
27 22 27 5 5.2 5.3 0.1
40 7.0 13 6 6.8 7.2 0.4
21 0.0 -3.0 3 5.7 5.4 0.3
25 -4.0 -5.0 1 5.7 5.9 0.2
36 14 10 4 6.9 6.6 0.3
Mean 2.93 0.35
SD 1.98 0.29
AIx, Augmentation Index; aPWV, aortic pulse wave velocity
2.5.1.1 Pulse Wave Analysis
Peripheral pressure wave forms were recorded from the right radial artery with the
subject at rest for 10 minutes, as described above. Ai and central aortic pressure
were derived from analysis of the central waveform. Ai was adjusted to a heart rate
of 75 beats per minute.
2.5.1.2 Pulse Wave Velocity
During pressure wave recordings for PWV, the subject had continuous 3 lead ECG
recording allowing gating of the pressure wave to the peak of the R wave on the
ECG. This allowed the time for the pressure wave to move from the ascending aorta
to the peripheral pulse to be calculated. Measurements were taken from the carotid
notch to the carotid, radial and femoral pulses to determine distance. From these

59
measurements, brachial (determined from recordings at the carotid and radial pulses)
and aortic (determined from recordings at the carotid and femoral) pulse wave
velocities were calculated as the distance/time in metre per second.
2.5.2 Carotid Ultrasound
Ultrasound imaging (Aloka Prosound SSD-5500, 7.5MHz linear array transducer)
was undertaken by a single investigator, Mrs Emma Rees, who was blind to the
subject status. An image was recorded of the right and left common carotid artery
with the subject lying supine after 5 minutes of rest.
2.5.2.1 Carotid Intima Media Thickness
Measurements of carotid intima-media thickness (CIMT) were taken off-line, from a
one centimetre segment of the common carotid artery proximal to the bifurcation,
using automated-tracking and analysis software (Carotid Analyzer, Medical Imaging
Applications). A mean of left and right sided values was used to calculate CIMT.
The coefficient of variance for the right and left common carotid arteries were 5%
and 6% respectively. These were calculated on a sample of 20 subjects selected with
a random number generator, from repeated analysis of the raw Digital Imaging and
Communications in Medicine (DICOM) files for a single session.
2.6 Cardiac Measurements
Echocardiography (Vivid 7, GE Medical Systems, Horten, Norway, with a 2.5MHz
transducer and harmonic imaging) was undertaken by Mrs Emma Rees who was
blind to subject status. Images were acquired at passive end-expiration where
possible. Standard echocardiographic measurements and calculations were
performed during off-line analysis using EchoPAC PC software version 110.0.0 (GE

60
Healthcare) according to the recommendations of the European Association of
Echocardiography [299].
2.6.1 Myocardial Function
Longitudinal systolic function (s’) and diastolic function ( e’, a’ and e’:a’ ratio) were
assessed by pulsed Doppler myocardial velocity imaging. The e’ and a’ are measures
of left ventricular myocardial velocity related to passive filling and the component of
filling related to atrial contraction, respectively. Reproducibility for resting
myocardial velocities are well defined in the Wales Heart Research Institute (WHRI)
echo laboratory and are all <10%, this was not repeated for the PCOS data. All
echocardiograms in this study were undertaken in the WHRI echo laboratory.
2.7 Statistical Analyses
Statistical analyses were undertaken with the help of Professor Frank Dunstan,
statistician, Institute of Primary Care and Public Health, Cardiff University.
2.7.1 Sample Size Calculation
The planned sample size was 80 in each group. This would give 80% power for
detecting a difference of 0.45m/sec in aortic PWV or one of 0.25 in e’:a’. I regarded
these differences in PWV and e’:a’ as being aetiologically significant. The likely
power for the regression analyses was harder to estimate without detailed knowledge
of the relationships but estimated to be 80% for detecting partial correlation
coefficients of around 0.25.
2.7.2 Regression Analyses
Comparisons between patients with PCOS and controls, both unadjusted and
adjusted, were performed by using linear models when distributions of variables
were approximately normally distributed and using bootstrapping when this was not

61
the case. Relationships with age and BMI were checked for linearity using graphical
methods and examining residuals.
Relationships between fat measures and arterial stiffness parameters were also
estimated using linear modelling. Fat measures were first converted into z-scores to
facilitate comparison between models; a regression coefficient associated with a fat
measure could then be interpreted as the effect on the outcome of a change of one
standard deviation of the fat measure. Models were adjusted for age, central pulse
pressure and, where there was evidence that body size was a confounder, for height.
Interaction terms between PCOS status and the explanatory factors were included in
the models to test if the relationships varied between PCOS subjects and controls.

62
CHAPTER 3: Demographic, Metabolic and Anthropometric Results
3.1. Introduction
Risk factors for cardiovascular disease include impaired glucose tolerance (IGT),
Type 2 diabetes, an adverse lipid profile, elevated high sensitivity C reactive protein
(hsCRP), obesity, visceral adiposity, hypertension and smoking. Factors which may
explain the mechanisms of cardiovascular disease include the distribution of adipose
tissue, adipocytokines, insulin resistance, hyperglycaemia, oxidative stress and
androgens. This chapter will explore many of these risk factors and potential
mediators of cardiovascular disease in our study population. As discussed in the
introduction, the best method for screening PCOS women for dysglycaemia is
debated and in a subgroup of the PCOS cohort we measured fasting glucose,
glycated haemoglobin (HbA1C) and performed an oral glucose tolerance test to
determine the best method in our local population.
The aims of this chapter are to:
1. Present the data on study recruitment
2. Present the age and BMI distribution of the population and explain what
adjustments were needed
3. Present the ethnicity, smoking status and medications taken by the subjects
4. Explore any differences between the PCOS group and HV groups in terms of
metabolic factors; glucose tolerance, insulin area under the curve (AUC),
glucose AUC, lipid profile, hsCRP, adiponectin and testosterone
5. Examine the different screening methods for identifying dysglycaemia in
PCOS

63
6. Explore any differences between the PCOS group and HV group in terms of
anthropometric data; waist and hip circumferences, waist to hip ratio, total
body fat, total lean mass and trunk fat measured by dual energy x ray
absorptiometry (DEXA); and total fat, visceral fat and subcutaneous fat as
measured by Computed Tomography (CT)
3.2 Study Recruitment
From the departmental database and outpatient clinics at the University Hospital of
Wales, women of the correct age with a presentation of hirsutism,
oligo/amenorrhoea, infertility, biochemical hyperandrogenaemia or obesity were
identified. Of these, 229 had an alternative diagnosis to PCOS or failed to meet the
inclusion/exclusion criteria. A further 257 were not contactable or declined to
participate. From local advertisement, 269 expressed an interest in being a healthy
volunteer. One hundred and seventy four were excluded as they did not meet the
inclusion and exclusion criteria. Please see Figure 3.1.

64
Figure 3.1 Study Recruitment Flow Diagram
3.3 Demographic Data
The numbers of subjects in each group, their age, BMI, smoking status, ethnicity and
medications taken are presented below. The PCOS group was analysed with respect
to the three different diagnostic criteria for PCOS.
3.3.1 Number of Subjects
Eighty-four women with PCOS and 95 healthy volunteers participated in the study.
3.3.2 PCOS Subjects and Different Diagnostic Criteria
The Rotterdam criteria were used in the recruitment of PCOS subjects. The NIH
criteria are the least inclusive requiring a diagnosis of hyperandrogenism and chronic
anovulation. The AE-PCOS criteria are broader including hyperandrogenism and
ovulatory dysfunction (olig- or an-ovulation or polycystic ovaries) and the
PCOS
570
Alternative Diagnosis
Failed inclusion/exclusion criteria
229
Not contactable
Declined to participate
257
Included
84
HV
269
Failed to meet inclusion/exclusion criteria
174
Included
95

65
Rotterdam are the most inclusive as a diagnosis of hyperandrogenism is not needed.
This is reflected in the numbers of women in this study meeting the different
diagnostic criteria as shown in Table 3.1.
Table 3.1 Polycystic Ovary Syndrome Subjects in Different Diagnostic Criteria
Groups
Diagnostic
Criteria
NIH Rotterdam AE-PCOS
Number of subjects 66 84 75
3.3.3 Age and BMI Distribution
During recruitment it was noticed that the HV group had a lower mean BMI than the
PCOS group. To address this, an advert was placed in the local paper for healthy
volunteers with a dress size of 16 or more (Appendix 3). Dress size was used to
reflect a larger BMI, as it was thought most women would know their dress size but
may not know their BMI. The mean age and standard deviation (SD) of the PCOS
and HV groups were 29.8 years ± 6.7 and 32.6 years ± 7.9 respectively, which was
significantly higher in the HV group (p=0.01). The mean BMI and SD of the PCOS
and HV groups were 33.3 kg/m2 ± 7.8 and 27.6 kg/m
2 ± 6.3 respectively, which was
a significant difference (p<0.001). Results are displayed in Table 3.2.
Table 3.2 Age and Body Mass Index of Study Population
PCOS
Mean (SD)
HV
Mean (SD)
Difference
(PCOS-HV)
95% CI p-value
Age (years) 29.8 (6.7) 32.6 (7.9) -2.9 -5.0, -0.7 0.01
BMI (kg/m2) 33.3 (7.8) 27.6 (6.3) 5.7 3.6, 7.8 <0.001
SD, standard deviation
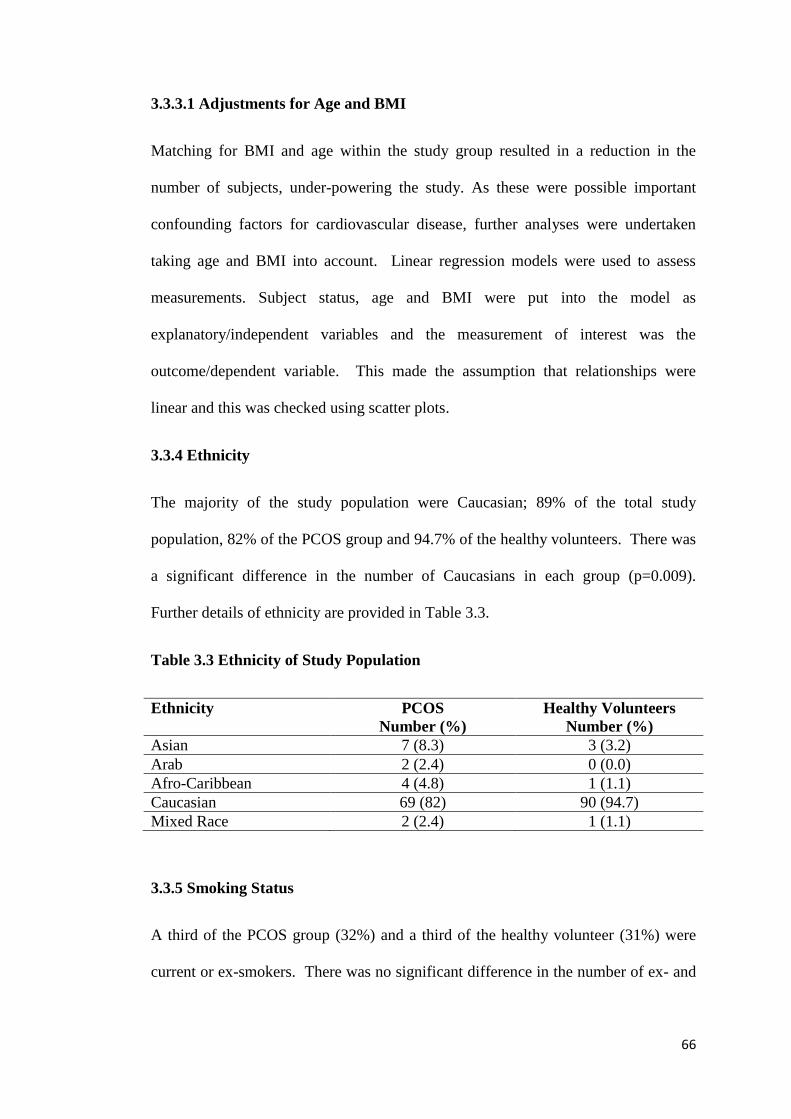
66
3.3.3.1 Adjustments for Age and BMI
Matching for BMI and age within the study group resulted in a reduction in the
number of subjects, under-powering the study. As these were possible important
confounding factors for cardiovascular disease, further analyses were undertaken
taking age and BMI into account. Linear regression models were used to assess
measurements. Subject status, age and BMI were put into the model as
explanatory/independent variables and the measurement of interest was the
outcome/dependent variable. This made the assumption that relationships were
linear and this was checked using scatter plots.
3.3.4 Ethnicity
The majority of the study population were Caucasian; 89% of the total study
population, 82% of the PCOS group and 94.7% of the healthy volunteers. There was
a significant difference in the number of Caucasians in each group (p=0.009).
Further details of ethnicity are provided in Table 3.3.
Table 3.3 Ethnicity of Study Population
Ethnicity PCOS
Number (%)
Healthy Volunteers
Number (%)
Asian 7 (8.3) 3 (3.2)
Arab 2 (2.4) 0 (0.0)
Afro-Caribbean 4 (4.8) 1 (1.1)
Caucasian 69 (82) 90 (94.7)
Mixed Race 2 (2.4) 1 (1.1)
3.3.5 Smoking Status
A third of the PCOS group (32%) and a third of the healthy volunteer (31%) were
current or ex-smokers. There was no significant difference in the number of ex- and

67
current smokers compared to non-smokers in each group (p=1.0). Results are
displayed in Table 3.4.
Table 3.4 Smoking Status of Study Population
Smoking Status PCOS
Number (%)
Healthy Volunteers
Number (%)
Non-smoker 57 (68) 65 (68)
Ex-smoker 12 (14) 19 (20)
Smoker 15 (18) 11 (12)
3.3.6 Medication
As this was a study of young women, ladies taking contraceptive pills were included.
Recruitment would have been more difficult if this was an exclusion criterion as they
are widely used in this age group. Twenty-eight (29.5%) of the HVs and 19 (22.6%)
of the PCOS group were taking a contraceptive pill; there was no significant
difference between the two groups, p=0.3. Twelve of the PCOS group and 8 of the
HVs were taking antidepressants. Two PCOS women were taking a proton-pump
inhibitor and one of the HVs. One of the HVs was taking acetazolamide and three
others were taking antihistamines as required.
3.4 Metabolic Characteristics of Study Population
The glucose tolerance status, measures of insulin resistance, glucose AUC, lipid
profile, hsCRP, testosterone and high molecular weight (HMW) adiponectin data are
presented in this section. Data on screening for dysglycaemia in PCOS are also
presented.

68
3.4.1 Glucose Tolerance Status
All women had a 75 gram oral glucose tolerance test (OGTT); samples from two
healthy volunteers were lost in the lab and one PCOS subject did not complete the
OGTT. None of the subjects had any known pre-existing diabetes or pre-diabetes
states. There was an abnormality of the OGTT in 16% of the PCOS subjects
compared to 4% of the HVs, which was significantly higher (p=0.02). Details are
shown in Table 3.5.
Table 3.5 Glucose Tolerance Status of Study Population
Normal
Number (%)
Diabetes
Number (%)
IGT
Number (%)
IFG
Number (%)
PCOS 70 (84) 5 (6) 8 (10) 0 (0)
HV 89 (96) 0 (0) 4 (4) 0 (0) IGT- Impaired glucose tolerance, IFG – Impaired fasting glycaemia.
3.4.1.1 Screening for Glucose Intolerance in PCOS
In a subgroup of PCOS subjects (n=34), HbA1c was measured along with the
OGTT. Seven women were identified as having abnormal glucose tolerance on one
or more of the three screening tests and the results are displayed in table 3.6. If an
OGTT had not been performed, 5 diagnoses of IGT or diabetes would have been
missed (subject numbers 1-5). The HbA1c identified subject number 6 as having
diabetes who had a normal fasting glucose and OGTT by World Health Organisation
(WHO) diagnostic criteria, although if the American Diabetes Association (ADA)
criteria were applied she would have been defined as having impaired fasting
glycaemia. Subject number 7 was identified as having diabetes by all three
screening tests. All subjects except subject number 6, who was identified by HbA1c
alone, had a BMI>37 kg/m2.

69
Table 3.6 Outcome of Screening tests for Diabetes and Dysglycaemia in Polycystic Ovary Syndrome
Subject
Number
Diagnosis HbA1c
(mmol/mol)
FPG
(mmol/l)
2 hour glucose
(mmol/l)
BMI
(kg/m2)
Age
(years)
Ethnicity
1 IGT 29 4.4 8.2 43 30 Caucasian
2 Diabetes 36 4.8 11.6 37.5 37 Caucasian
3 Diabetes 37 5.6 11.3 37 40 Caucasian
4 IGT 39 5.6 7.9 45.7 22 Caucasian
5 IGT 40 5.6 8.0 42.7 35 Caucasian
6 Diabetes 48 5.6 4.9 27.8 24 Arab
7 Diabetes 54 8.7 14.1 42.7 29 Caucasian
FPG, fasting plasma glucose; BMI, body mass index; IGT, impaired glucose tolerance
Diabetes: WHO/ADA HbA1c ≥ 48 mmol/mol or FPG ≥7.0mmol/l or 2 hour glucose OGTT ≥11.1mmol/l
Impaired glucose tolerance: WHO/ADA FPG <7.0mmol/l and 2 hour glucose OGTT ≥ 7.8mmol/l
Impaired fasting glycaemia: WHO FPG ≥ 6.1 mmol/l and <7.0 mmol/l, ADA FPG ≥5.6 mmol/l and < 7.0 mmol/l
High risk of diabetes: WHO HbA1c 42-47mmol/mol, ADA 39mmol/mol-47mmol/mol
Results displayed in red are abnormal as per WHO criteria
Results displayed in blue are abnormal according to ADA criteria; this is also the cut off for an oral glucose tolerance test according to NICE
guidelines

71
3.4.2 Insulin Resistance and Glucose Area Under the Curve
Insulin resistance was assessed by measuring insulin AUC and homeostatic model
assessment for insulin resistance (HOMA-IR). The mean insulin AUC in the PCOS
and HV groups was 101000 pmol min/l and 50900 pmol min/l respectively which
was significant before (p<0.001) and after adjustment (p<0.001) for age and BMI, as
shown in Table 3.7. The mean HOMA-IR in the PCOS and HV groups was 4.94 and
2.33 respectively, which was also significant before (p<0.001) and after adjustments
(p=0.003) for age and BMI, as shown in Table 3.7. The mean glucose AUC was
higher in the PCOS group than the HV group, 812 mmol min/l and 699 mmol min/l
respectively, which was significant before (p<0.001) and after (p=0.005) adjustments
for age and BMI, as shown in Table 3.7. Adjusting for age only, resulted in little
change in the mean difference between the two groups for IAUC, HOMA-IR and
glucose AUC but the p value remained significant. Adjusting for BMI only, resulted
in a greater change in the mean difference between the two groups for IAUC,
HOMA-IR and glucose AUC and this was also significant. BMI was having a
greater influence on the difference between the two groups, although after
adjustment for age and BMI there remained a significant difference between the two
groups.
3.4.3 Lipid Profile
The mean total cholesterol was 4.80 mmol/l and 4.63 mmol/l in the PCOS and HV
groups, respectively. In the PCOS group the mean HDL-cholesterol was 1.32
mmol/l and in the HV group 1.39 mmol/l. The mean LDL-cholesterol was 2.97
mmol/l in the PCOS group and 2.79 mmol/l in the HV group. There were no
significant differences in total cholesterol, HDL-cholesterol or LDL-cholesterol

72
between the two groups before or after adjustment for age and BMI. The mean
triglycerides in the PCOS group was 1.11 mmol/l compared to 0.96 mmol/l in the
HV group. This was significant before adjustment for age and BMI (p=0.031) but
not after the adjustment was made (p=0.841). These results are presented in Table
3.7. BMI accounted for the difference in triglycerides between the two groups.
3.4.4 High Sensitivity C Reactive Protein
The mean hsCRP was 4.67 mg/l in the PCOS group and 2.49 mg/l in the HV group.
This was significantly higher in the PCOS group in the unadjusted analysis
(p=0.002) but not after adjustments for age and BMI (p=0.553), please see Table 3.7.
Adjustments for age only and BMI only were done. Adjusting for BMI only, the
difference became non-significant suggesting that BMI was contributing to the
difference rather than age.
3.4.5 Testosterone
The mean testosterone was 1.39 nmol/l in the PCOS group and 0.77 nmol/l in the
HV group. Testosterone was significantly higher in the PCOS group in unadjusted
(p<0.001) and adjusted (p<0.001) analyses. Please see Table 3.7.
3.4.6 High Molecular Weight Adiponectin
In the PCOS group the mean HMW adiponectin was 10.5 µg/ml and in the HV
group 10.1 µg/ml. There was no significant difference in unadjusted analyses
(p=0.723) but mean HMW adiponectin became higher in the PCOS group after
adjustment (p=0.02). Please see Table 3.7. When the adjustment for BMI only was
done, the adiponectin was significantly higher in the PCOS group suggesting that
BMI was contributing to the difference.

73
Table 3.7 Metabolic Characteristics of the Study Population Unadjusted and Adjusted for Age and Body Mass Index
Unadjusted Adjusted
PCOS
Mean (SD)
HV
Mean (SD)
Difference
(PCOS-HV)
95% CI P-value Difference
(PCOS-HV)
95% CI P-value
Insulin AUC
(pmol min/l)
101000
(66000)
50900
(34700)
50000 32800, 68400 <0.001 35900 19900, 52600 <0.001
HOMA-IR 4.94 (4.15) 2.33 (1.45) 2.61 1.71, 3.52 <0.001 1.33 0.45, 2.21 0.003
Glucose
AUC (mmol
min/l)
812 (250) 699 (134) 113 54, 169 <0.001 78.4 26.9, 131.6 0.005
TC (mmol/l) 4.80 (0.75) 4.63 (0.83) 0.17 -0.06, 0.41 0.152 0.19 -0.06, 0.45 0.139 HDL-C
(mmol/l) 1.32 (0.35) 1.39 (0.33) -0.07 -0.17, 0.03 0.166 0.07 -0.04, 0.17 0.196
LDL-C
(mmol/l) 2.97 (0.68) 2.79 (0.78) 0.18 -0.04, 0.40 0.115 0.11 -0.13, 0.35 0.346
TG (mmol/l) 1.11 (0.47) 0.96 (0.45) 0.15 0.01, 0.29 0.031 0.01 -0.13, 0.16 0.841 hsCRP (mg/l) 4.67 (5.92) 2.49 (3.04) 2.18 0.81, 3.55 0.002 0.41 -0.95, 1.78 0.553 Testosterone
(nmol/l) 1.39 (0.81) 0.77 (0.38) 0.61 0.43, 0.80 <0.001 0.57 0.36, 0.78 <0.001
Adiponectin
(µg/ml) 10.5 (8.9) 10.1 (7.0) 0.4 -1.98, 2.84 0.723 3.01 0.49, 5.53 0.020
AUC, area under the curve; TC, total cholesterol; HDL-C, high density lipoprotein cholesterol; LDL-C, low density lipoprotein cholesterol; TG, triglycerides; hsCRP, high
sensitivity C reactive protein

74
3.5 Anthropometric Characteristics of Study Population
The waist and hip circumferences, waist to hip ratio measurements and body
composition as assessed by DEXA and CT are presented below.
3.5.1 Waist and Hip Circumference
The mean waist circumferences were 98.1cm and 85.4 cm in the PCOS and HV
groups, respectively. The mean hip circumferences were 117.5 cm and 105.5 cm in
the PCOS and HV groups, respectively. The mean waist to hip ratio was 0.83 and
0.81 in the PCOS and HV groups. All parameters were significantly higher in the
PCOS group in the unadjusted analyses (waist circumference, p<0.001; hip
circumference p<0.001 and waist hip ratio, p<0.03) but differences were not
significant after adjustments (waist circumference, p=0.101; hip circumference,
p=0.91 and waist to hip ratio, p=0.09). Please see Table 3.8. Adjusting for age and
BMI separately, suggested that BMI was contributing to the difference between the
two groups.
3.5.2 Total Body Fat, Regional Body Fat and Lean Mass Assessed by DEXA
The Hologic Discovery A absorptiometer was not always available due to servicing
or awaiting repairs, therefore only 146 women had a DEXA scan. The mean total
lean mass, mean total body fat and mean trunk fat in the PCOS group were 46477
grams, 41281 grams and 20574 grams respectively. In the HV group, the mean total
lean mass, mean total body fat and mean trunk fat were 40937 grams, 29058 grams
and 13130 grams respectively. PCOS women had a higher lean mass, total body fat
and trunk fat mass compared to HVs (p<0.001 for all parameters) but after
adjustments for age and BMI there were no significant differences (p=0.513, p=0.401

75
and p=0.515 respectively). Please see Table 3.8. Adjusting for age and BMI
separately, suggested that BMI was contributing to the difference.
3.5.3 Subcutaneous and Visceral Fat Measurement Assessed by CT
In the PCOS group, the mean total fat, subcutaneous fat and visceral fat areas were
361 cm2, 322 cm
2 and 39.1 cm
2 respectively. In the HV group, the mean total fat,
subcutaneous fat and visceral fat areas were 286 cm2, 257 cm
2 and 28.5 cm
2
respectively. Before adjustments for age and BMI, the mean of all parameters were
higher in the PCOS group compared to the HV group (p=0.001 for total fat and
subcutaneous fat and p=0.007 for visceral fat). After adjustment there were no
differences between the two groups for total fat (p=0.904), subcutaneous fat
(p=0.783) or visceral fat (p=0.529). Please see Table 3.8. Adjusting for age and BMI
separately, suggested that BMI was contributing to the difference.

76
Table 3.8 Anthropometric Characteristics of the Study Population Unadjusted and Adjusted for Age and Body Mass Index
Unadjusted Adjusted
PCOS
Mean (SD)
HV
Mean (SD)
Difference
(PCOS-HV)
95% CI P-value Difference
(PCOS-HV)
95% CI P-value
WC (cm) 98.1 (17.9) 85.4 (13.8) 12.7 8, 17.4 <0.001 1.65 -0.33, 3.62 0.101 HC (cm) 117.5 (18.0) 105.5 (14.4) 12.1 7.3, 16.9 <0.001 -0.09 -1.66, 1.48 0.91 Waist: Hip
ratio 0.83 (0.05) 0.81 (0.05) 0.02 0.01, 0.04 <0.003 0.02 -0.002, 0.03 0.09
DEXA total
lean mass (g) 46477 (9700) 40937 (5551) 5540 2839, 8082 <0.001 -630 -2371, 1130 0.513
DEXA total
body fat (g) 41281
(15811)
29058
(11934)
12222 7747,
17041
<0.001 -620 -2250, 738 0.401
DEXA trunk
fat (g) 20574 (9232) 13130 (6766) 7444 4861,
10204
<0.001 273 -643, 1182 0.515
CT Total fat
(cm2)
361 (126) 286 (130) 75 30.6,110.8 0.001 -1.6 -27.3, 24.1 0.904
CT SC fat
(cm2)
322 (110) 257 (115) 65 25.2, 96.1 0.001 -3.4 -27.7, 20.9 0.783
CT Visceral
fat (cm2)
39.1 (28.2) 28.5 (19.5) 10.6 2.7, 17.4 0.007 1.8 -3.9, 7.5 0.529
WC, waist circumference; HC, hip circumference; SC, subcutaneous

77
3.6 Summary of Demographic, Metabolic and Anthropometric Results
All PCOS women met the Rotterdam criteria, 66 met the NIH criteria and 75 met the AE-
PCOS criteria. Women with PCOS were significantly heavier and younger than the HVs, so
adjustments were made for these in further analyses as they were potential confounding
factors for cardiovascular disease. The majority of women were Caucasian, however there
were significantly more Caucasians in the HV group compared to the PCOS group. There
were no significant differences between the two groups with respect to numbers of
smokers/exsmokers and the number of women taking the contraceptive pill.
In the PCOS group, 5 women were found to have diabetes and 8 IGT compared to 4 HVs
having IGT. There was a significant difference between the two groups in the numbers of
women having an abnormal OGTT. In a subgroup of PCOS women, HbA1c was not able to
identify all women with an abnormal OGTT result. Markers of insulin resistance (HOMA-IR
and insulin AUC), glucose AUC and testosterone were significantly higher in the PCOS
group before and after adjustment. There were no significant differences in cholesterol
measurements. Triglycerides and hsCRP were significantly higher in the PCOS group before
adjustment but there were no differences after adjustment. High molecular weight (HMW)
adiponectin did not differ between the groups in the unadjusted analyses but became
significantly higher in the PCOS group after adjustment.
All anthropometric measurements were significantly higher in the PCOS group in unadjusted
analyses, but none were significant after adjustments for age and BMI. Not surprisingly,
adjusting for BMI alone, resulted in no significant difference between the two groups.

78
3.7 Discussion
All women with PCOS met the Rotterdam criteria for diagnosis of PCOS as this was part of
the inclusion criteria for the study. The AE-PCOS criteria were met by more women than the
NIH criteria, the latter has the strictest criteria for the diagnosis of PCOS. This was not
surprising and reflects the prevalence of PCOS by the different criteria in the general
population; the prevalence of PCOS diagnosed by the Rotterdam criteria being the highest
and the prevalence of PCOS diagnosed by the NIH criteria being the lowest [50, 51]. This
study was not designed to determine if there were any differences in cardiovascular risk
between the different diagnostic groups. It has been suggested that non-NIH PCOS may
present with a less adverse cardiometabolic profile than women with PCOS diagnosed by
NIH criteria [52, 301]. A study examining vascular function in the different categories of
PCOS found elevated asymmetric dimethylarginine (ADMA), an inhibitor of nitric oxide
production, in both NIH-PCOS and non-NIH PCOS patients which were significantly higher
than controls; however, there were no differences between NIH PCOS and non-NIH PCOS
and controls for other measures of vascular health including central aortic pulse wave
velocity and endothelial function [302].
The BMI of the PCOS group was significantly higher than the HV group in our study. This
reflects the high levels of obesity in women with PCOS [56]. As obesity is associated with
hypertension and dysgylcaemia, this may have contributed to difficulty in recruiting ‘healthy’
volunteers who are obese and well. It may be that obese women are less likely to be
volunteers in research studies than women of a normal weight. The HV group were older
than the PCOS group and this could have occurred as older women may be more concerned
about their health than younger women and more likely to volunteer in a study investigating
cardiovascular risk.

79
The majority of women in the study were Caucasian but there were more ethnic minorities
represented in the PCOS group. Asians and Arabs are at higher risk of developing glucose
intolerance than Caucasians and this could have affected the results but the numbers involved
are small and are unlikely to have made a big difference.
Smoking is a risk factor for cardiovascular disease but there were no significant differences in
history of smoking between the PCOS and HV groups in our study and so unlikely to have
affected our results. However, the total smoking pack year history was not ascertained and
the effect of this on cardiovascular risk was not determined. The prevalence of smokers or
ex-smokers in this study was 32% which is similar to that of work done by own group
looking at a large community-database when the prevalence was 39% [67].
There is some evidence to suggest that oral contraceptive pills containing higher levels of
ethinyl estradiol, are associated with impaired glucose tolerance and insulin resistance in the
general population [303], increasing cardiovascular risk. However, a review suggests that
the risk of cardiovascular events is minimal particularly in women who do not smoke and are
not hypertensive [304]. A systematic review and meta-analysis of oral contraceptive use in
women with PCOS also failed to find any clinically significant adverse metabolic profiles
[305]. In our study there were no differences in oral contraceptive use between the PCOS
group and HV group and therefore any increased cardiometabolic risk from the oral
contraceptive pill, if present, is unlikely to have affected our results.
More IGT and diabetes were found in the PCOS group than in the healthy volunteers. This is
not surprising as women with PCOS are at increased risk of developing glucose intolerance
and diabetes [67, 100]. The prevalence rates of diabetes and IGT in PCOS are 1.6-10% [75-
82] and 9.4-35% [75-82] respectively. The prevalence rates I found in my study were
similar, 6% had diabetes and 10% had IGT. As known IGT and diabetes were exclusion

80
criteria in this study, the actual prevalence of IGT and diabetes in our local PCOS population
may be higher. The mean BMI was higher in the PCOS group and this may be a factor in
explaining the higher prevalence of dysglycaemia in the PCOS group; however, the measures
of insulin resistance and glucose AUC were higher in the PCOS group than the HV group
even after BMI- and age-matching. Therefore differences in BMI are unlikely to contribute
solely to the differences in the prevalence of diabetes/IGT between the two groups.
The OGTT is the gold standard for diagnosing abnormalities of glucose metabolism.
Alternatives are the fasting plasma glucose and the HbA1c which are more convenient, less
costly and less labour intensive than the OGTT. In our population, HbA1c was not able to
identify all women with dysglycaemia and if this had been used alone, five out of six (83%)
ladies with an abnormal OGTT would have been missed. Therefore, in patients with PCOS
HbA1c may not be an adequate screening test for diagnosing glucose intolerance and diabetes
in PCOS. This is in agreement with other studies [109-110]. Following the NICE guidance
[107] would have identified all women in this subgroup with IGT/diabetes as all had a fasting
plasma glucose ≥5.6 mmol or a BMI more than 30. However, as the mean BMI in this
population was 33.3 there may not be many women who would be excluded from having an
OGTT.
Markers of insulin resistance (HOMA-IR and Insulin AUC) were significantly higher in the
PCOS group both before and after adjustments for age and BMI. This is consistent with
other studies. Previous authors have also shown basal- and glucose- stimulated
hyperinsulinaemia in women with PCOS compared to weight-matched controls [19] and IR is
present in PCOS independently of obesity [58].
This study found no differences in total or LDL-cholesterol between the two groups.
Trigylcerides were higher in the PCOS group compared to the HV group in the unadjusted

81
analyses, but no differences were seen between the two groups after adjustment for age and
BMI. After adjustment for age alone, the difference remained significant; whereas adjusting
for BMI alone negated the differences, implying that BMI was driving the difference between
the two groups. The most common adverse lipid profile in PCOS is elevated triglycerides and
decreased HDL-cholesterol and has been reported in up to 70% of American women with
PCOS [134]. Our findings are not consistent with a meta-analysis which found adverse lipid
profiles remained in PCOS women after BMI matching [60]. This study did not match for
age and they found that women with PCOS diagnosed by NIH criteria had worse lipid
profiles than women diagnosed by Rotterdam criteria; this may partially explain the
differences with my results.
A meta-analysis found that high sensitivity CRP was elevated in women with PCOS
compared to controls, an observation which remained after studies with mismatches for BMI
or prevalence of obesity were excluded [130]. Our study is not in agreement with this finding
as there was no difference in hsCRP after matching for age and BMI. The meta-analysis
included studies using NIH criteria and Rotterdam criteria to diagnose PCOS and this may
partly explain the differences between our study and the meta-analysis.
Testosterone was significantly higher in the PCOS group before and after matching for age
and BMI. This was expected as hyperandrogenism is common in women with PCOS,
although the diagnosis of PCOS using the Rotterdam criteria does not necessarily require
biochemical hyperandrogenism to be present.
A systematic review and meta-analysis found that adiponectin levels were significantly lower
in PCOS women than BMI-matched controls [224]. However, some studies have not found
any difference in adiponectin levels between PCOS and controls [306,307]. This study
found no difference in HMW adiponectin between the two groups in unadjusted analyses;

82
after adjustment for age and BMI, HMW adiponectin was higher in the PCOS group
(p=0.02). In the meta-analysis, the majority of studies had measured total adiponectin and
used NIH criteria for diagnosis of PCOS, whereas I measured HMW adiponectin and used
Rotterdam criteria for diagnosis of PCOS which could be an explanation for the discrepancy
in findings. The PCOS women were more insulin resistant than the HVs in our study, even
after adjustments for age and BMI, and therefore, it would be expected that the HMW
adiponectin levels would be lower in the PCOS group as increasing insulin resistance has
been associated with lower HMW adiponectin levels. However, there is some evidence to
suggest that the morphology of adipocytes in subcutaneous and visceral adipose tissue may
be important in regulating the secretion of adiponectin. One study has shown that
hypertrophied adipocytes in subcutaneous adipose tissue secrete less adiponectin than smaller
adipocytes and that the percentage of small fat cells in subcutaneous adipose tissue correlates
with serum HMW adiponectin [308]. It could be that in our population, PCOS women had
more small fat cells than the HVs explaining my finding of increased HMW adiponectin in
the PCOS group.
All anthropometric measures and assessments of body composition were significantly higher
in the PCOS group in the unadjusted analyses but no differences were seen between the two
groups after adjustment for age and BMI. A meta-analysis found that women with PCOS
had greater central adiposity than BMI-matched controls [56] and a further study found that
non-obese PCOS women had greater accumulation of central fat mass than BMI-matched
controls [118]. Neither of these studies matched for age and the former used waist
circumference >80cm and waist:hip ratio >0.85 to define central obesity whilst the latter used
ultrasound. We adjusted for age and used CT to assess fat distribution which is a more
accurate method. A study using MRI (the gold standard along with CT) to assess body fat
distribution did not find any differences in body fat distribution between PCOS patients and

83
controls [119] which is in agreement with our findings. As higher BMI can reflect a greater
lean mass, DEXA was used to assess lean and fat mass in our population. A higher
proportion of lean mass may protect against cardiovascular disease; however, there was no
difference in lean mass after adjustment for age and BMI between the two groups.

84
CHAPTER 4: Cardiovascular Results
4.1 Introduction
Higher resting heart rate and hypertension are risk factors for cardiovascular disease
and therefore resting heart rate and blood pressure were measured in our study
population. As we were investigating a young population who had no known
cardiovascular disease, surrogate markers of cardiovascular disease were measured to
identify any subclinical cardiovascular disease. These included augmentation index
(Ai), pulse wave velocity (PWV), common carotid intima-media thickness (ccIMT)
and diastolic heart function. Aortic PWV, ccIMT and diastolic heart function are all
independent predictors of cardiovascular disease [179, 189, 190, 206, 207].
The aims of this chapter are to:
1. Present the data on resting heart rate and blood pressure
2. Present the data on Ai, brachial PWV and aortic PWV
3. Present the data on ccIMT measurements
4. Present the data on echocardiogram measurements
5. Compare the findings with other studies
As significant differences between the age and body mass index (BMI) of the
polycystic ovary syndrome (PCOS) group and healthy volunteer (HV) group were
found (see Chapter 3), results are presented unadjusted and adjusted for age and BMI.

85
4.2 Resting Heart Rate
The mean resting heart rate was higher in the PCOS group 74.6 beats per minute
(bpm) compared to the HV group 70.1 bpm, p=0.009. However, after adjustments
the difference was no longer significant, p=0.250. Please see Table 4.1. After
adjusting for age alone, there remained a significant difference in the results
suggesting BMI was mediating the difference in heart rate in the unadjusted analyses.
4.3 Blood Pressure
The peripheral blood pressure and central blood pressure measurements are presented
below. The central blood pressure was derived from data collected during
applanation tonometry.
4.3.1 Peripheral Blood Pressure
None of the subjects included in the study had a systolic blood pressure greater than
or equal to 140 mmHg. Four of the PCOS group (4.8%) and no-one in the HV group
had a diastolic blood pressure greater than or equal to 90 mmHg (p=0.047). The
mean systolic pressure in the PCOS group was 114.4 mmHg and in the HV group
112.1 mmHg, p=0.135. After adjustments for age and BMI, there was no significant
difference in mean systolic blood pressure between the two groups, p=0.313. The
mean diastolic blood pressure in the PCOS group was 67.2 mmHg and in the HV
group 64.4 mmHg, which was significantly higher, p=0.047. After adjustments for
age and BMI this was no longer significant, p=0.480. Please see Table 4.1. Adjusting
for age alone, diastolic pressure remained higher in the PCOS group but no
significant differences were found when adjusting for BMI alone; suggesting that

86
BMI exerted the main influence on the difference in diastolic blood pressure between
the two groups.
4.3.2 Central Blood Pressure
Central systolic blood pressure was no different between the two groups before
(p=0.381) and after adjustment for age and BMI (p=0.543). Mean central diastolic
blood pressure was higher in the PCOS group before adjustments, PCOS mean 68.6
mmHg and HV mean 65.2 mmHg, p=0.02. After adjustment there was no difference,
p=0.269. Please see Table 4.1. Adjusting for age only, the significant difference in
central diastolic blood pressure remained but not after adjusting for BMI alone; also
suggesting that BMI was mediating the difference between the two groups in the
unadjusted analyses.
4.4 Augmentation Index
The mean Ai, adjusted to a heart rate of 75 bpm, in the PCOS group was 3.72% and
in the HV group 5.6%. There were no differences between the two groups in the
unadjusted (p=0.343) or age and BMI adjusted analyses (p=0.935). Please see Table
4.1. Adjusting for BMI alone resulted in a lower mean Ai in the PCOS group
whereas adjusting for age alone had no significant effect.
4.5 Pulse Wave Velocity
The mean aortic PWV in the PCOS group was 6.40 metres per second (m/s) and in
the HV group 6.41 m/s and was no different before (p=0.921) or after full adjustment
(p=0.334). The mean brachial PWV in the PCOS group was 7.17 m/s and in the HV

87
group 7.16 m/s, which was also not different in unadjusted (p=0.976) or adjusted
analyses (p=0.977). Please see Table 4.1. Adjusting for age only, all parameters
remained non-significant. However, adjusting for BMI alone resulted in the aortic
PWV just becoming significantly lower in the PCOS group compared to the controls
(p=0.016).
4.6 Carotid Intima Media Thickness
The mean common carotid artery intima media thickness was 0.50 mm in the PCOS
group and 0.51mm in the HV group. There was no difference before (p=0.100) or
after adjustment (p=0.133). Please see Table 4.1. Adjusting for BMI alone, the
ccIMT was significantly lower in the PCOS group than the HV group. There were no
differences when adjusting for age alone.

88
Table 4.1 Cardiovascular Characteristics of the Study Population Unadjusted and Adjusted for Age and Body Mass Index
Unadjusted Adjusted
PCOS
Mean (SD)
HV
Mean (SD)
Difference
(PCOS-HV)
95% CI P-value Difference
(PCOS-HV)
95% CI P-value
HR (bpm) 74.6 (11.0) 70.1 (10.9) 3.5 1.11, 7.80 0.009 2.10 -1.49,5.69 0.250 Peripheral
SBP (mmHg) 114.4 (9.7) 112.1 (10.3) 2.3 0.71, 5.26 0.135 -1.50 -4.43, 1.43 0.313
Peripheral
DBP (mmHg) 67.2 (9.5) 64.4 (9.1) 2.8 0.04, 5.60 0.047 1.02 -1.82, 3.85 0.480
Central
SBP (mmHg) 97.3 (9.5) 95.9 (10.9) 1.4 -1.71, 4.45 0.381 -0.88 -3.74, 1.97 0.543
Central
DBP (mmHg) 68.6 (9.6) 65.2 (9.4) 3.4 0.53, 6.21 0.02 1.63 -1.27, 4.52 0.269
AI (75bpm) 3.72 (11.31) 5.69 (15.41) -1.97 -6.06, 2.12 0.343 0.15 -3.40, 3.69 0.935 aPWV (m/s) 6.40 (1.03) 6.41 (0.97) -0.02 -0.32, 0.29 0.921 -0.13 -0.40, 0.14 0.334 bPWV (m/s) 7.17 (1.05) 7.16 (1.31) 0.01 -0.35, 0.36 0.976 0.01 -0.37, 0.38 0.977 ccIMT (mm) 0.50 (0.06) 0.51 (0.06) -0.01 -0.04, 0.00 0.100 -0.01 -0.03, 0.00 0.133
HR, heart rate; SBP, systolic blood pressure; DBP, diastolic blood pressure; AI, augmentation index; aPWV, aortic pulse wave velocity; bPWV, brachial
pulse wave velocity; ccIMT, common carotid intima media thickness

89
4.7 Echocardiographic Measures
The mean of the following echocardiographic variables were no different between the
PCOS group and HV group before or after adjustments for age and BMI; left
ventricular (LV) posterior wall thickness, LV end-diastolic septal thickness, LV end-
diastolic dimension, LV end-diastolic volume, LV end-systolic volume, stroke
volume and ejection fraction. Fractional shortening was higher in the PCOS group
prior to adjustment for age and BMI but not after. The echocardiographic measures
that were particularly of interest, as they are independent predictors for cardiovascular
mortality, were the longitudinal systolic myocardial velocity (s’), the early diastolic
myocardial velocity and the early to late myocardial velocity ratio. The mean early
diastolic myocardial velocity was 14.71 cm/s in the PCOS group and 14.57 cm/s in
the HV group. The mean systolic myocardial velocity was 9.84 cm/s in the PCOS
group and 9.83 cm/s in the HV group. The mean early:late diastolic myocardial
velocity ratio was 1.82 in the PCOS group and 1.76 in the HV group. There was no
difference between the two groups for early diastolic myocardial velocity, systolic
myocardial velocity or the early:late diastolic myocardial velocity ratio before
adjustments (p=0.756, p=0.974 and p=0.586 respectively) or after adjustments
(p=0.345, p=0.511 and p=0.860 respectively). Please see Table 4.2.

90
Table 4.2 Echocardiographic Measures Unadjusted and Adjusted for Age and Body Mass Index
Unadjusted Adjusted
PCOS
Mean (SD)
HV
Mean (SD)
Difference
(PCOS-HV)
95% CI P-value Difference
(PCOS-HV)
95% CI P-value
LV posterior wall
thickness (cm)
0.86 (0.14) 0.85 (0.13) 0.01 -0.03, 0.05 0.662 -0.04 -0.88 ,0.01 0.059
LV end-diastolic
septal thickness
(cm)
0.85 (0.14) 0.81 (0.13) 0.04 -0.01, 0.08 0.084 -0.01 -0.05, 0.03 0.578
LV end-diastolic
dimension (cm)
4.65 (0.38) 4.63 (0.38) 0.03 -0.09, 0.15 0.634 -0.04 -0.17, 0.08 0.492
Fractional
shortening (%)
35.4 (5.0) 33.6 (5.5) 1.8 0.17, 3.42 0.031 1.28 -0.47, 3.03 0.151
LV end-diastolic
volume (ml)
85.8 (13.6) 84.7 (16.4) 1.0 -4.76, 6.79 0.729 -3.72 -9.14, 1.71 0.177
LV end-systolic
volume (ml)
35.5 (6.9) 33.8 (6.8) 1.7 -0.95, 4.26 0.210 -0.63 3.16, 1.90 0.623
Stroke volume (ml) 65.6 (12.9) 64.0 (11.1) 1.6 -2.03, 5.18 0.389 -0.15 -3.91, 3.61 0.936
Ejection fraction
(%)
58.7 (4.0) 59.9 (4.5) -1.3 -2.92, -0.37 0.125 -0.78 -2.55, 1.00 0.387
Early diastolic
myocardial velocity
(cm/s)
14.71 (2.72) 14.57 (2.68) 0.14 -0.76, 1.05 0.756 0.42 -0.45, 1.29 0.345
Systolic myocardial
velocity (cm/s)
9.84
(1.64)
9.83
(1.78)
0.01 -0.57, 0.59 0.974 -0.22 -0.88, 0.44 0.511
Early:late diastolic
myocardial velocity
1.82 (0.57) 1.76 (0.58) -0.05 -0.25, 0.14 0.586 -0.01 -0.18, 0.15 0.860

91
4.8 Summary of Cardiovascular Results
The resting heart rate, peripheral and central diastolic blood pressures were
significantly higher in the PCOS group in the unadjusted analyses, but were not
significant after adjustment for age and BMI. Adjusting for BMI alone removed the
differences between the two groups, suggesting that the difference in the unadjusted
analyses was mediated by BMI. There were no differences in the central and
peripheral systolic blood pressures, Ai, aortic PWV, brachial PWV or ccIMT between
the two groups before or after adjustments for age and BMI. The measures of cardiac
function were not different between the two groups before or after adjustments for
age and BMI except for fractional shortening; this was significantly higher in the
PCOS group in the unadjusted analyses but not after the adjustment for age and BMI
was made.
4.9 Discussion
The resting heart rate was significantly higher in the PCOS group compared to the
HV group before adjustments were made. This is in agreement with another study
which found significantly higher heart rate in women with PCOS compared to age-
matched controls [309]. However, this study had significant differences in BMI
between the PCOS group and controls. After adjustments for BMI there were no
differences between the two groups in resting heart rate which is in agreement with
other studies who have age- and BMI-matched their subjects [166, 204]. The
difference between the unadjusted and adjusted analyses in my study is likely to be
due to obesity.

92
Defining hypertension as a peripheral blood pressure greater than or equal to 140/90
mmHg, the prevalence of hypertension was 4.8% in the PCOS group and 0% in the
HV group. This is much lower than the prevalence reported by a Chinese study,
19.2% [131] and the Dallas heart study, 29.2% [174]. In the Dallas heart study, the
PCOS group had a significantly higher BMI than the controls. As women with
hypertension and those on antihypertensive medications were excluded from
participating in this study, it is not surprising that the prevalence rates were lower.
The mean diastolic blood pressure was significantly higher in the PCOS group in the
unadjusted analyses but not after adjustment. Blood pressure is a continuous variable
and increases with age and BMI. The difference seen in the unadjusted analyses may
be related to the higher BMI in the PCOS group which was a greater significant
difference than the older age in the HV group. The potential mechanisms causing
hypertension in obesity include hyperinsulinaemia, activation of the renin-
angiotensin-aldosterone system, sympathetic nervous system stimulation and
abnormal levels of leptin [310].
Atcor medical, the company manufacturing the sphygmocor apparatus which was
used in this study, have published mean values and reference ranges for Ai in a
healthy population; for ages 20-, 30- and 40-years the mean Ai is -4.67%, 3.03% and
10.73% respectively. In the PCOS group the mean age was 29.8 years and the mean
Ai was 3.72%. In the HV group the mean age was 32.6 years and the mean Ai was
5.69%. Both the PCOS and HV groups had comparable results with the published
age-specific mean Ai values. In a healthy population the mean aortic PWV is 6.1 m/s
in the under 30 year age group and 6.6 m/s in the 30-39 year age group [311]. In this
study the mean aortic PWV was 6.4 m/s in the PCOS group and 6.41 m/s in the HV

93
group. These both fall within the published normal range of 4.6-7.5 m/s for the under
30 year olds and 4.4-8.1 m/s in the 30-39 year olds [311].
There was no evidence of increased arterial stiffness (measured by aortic and brachial
PWV) in this population of PCOS women compared to healthy volunteers. This is in
agreement with Muneyyirci-Deale et al [202], Ketel et al [201] and Moran et al [302]
who found no relationship between arterial stiffness and PCOS after adjustment for
BMI and age. Ketel et al also used Rotterdam criteria to diagnose PCOS but had
fewer subjects in their study than mine [201]. The mean aortic PWV was 6.31 m/s in
the lean PCOS group and 6.82 m/s in the obese PCOS group [201] comparable with
the mean 6.4 m/s in this study. Moran et al included women diagnosed by NIH
criteria and non-NIH criteria but found no differences between these groups [302].
Cussons et al [203] also found no difference between non-obese PCOS and controls
in arterial stiffness, as measured by PWV and Ai. However, other studies have found
evidence of increased arterial stiffness in women with PCOS [164, 166, 200]. Meyer
et al also measured arterial stiffness by PWV but the mean age and BMI of their
population were higher than this study which may partially explain the differences in
findings [164]. Soares et al used carotid ultrasound to assess artery distensibilty and
stiffness index, a different method to that used in this study [166].
There was no difference in ccIMT between the PCOS and HV groups. This is in
contrast with a meta-analysis which found that women with PCOS had ccIMT around
0.08mm greater than matched controls [188]. The mean ccIMT of the PCOS patients
included in the meta-analysis varied from 0.41 mm to 0.7 mm [188] and the mean
ccIMT of PCOS patients in my study was 0.5 mm. The meta-analysis considered the
potential confounders of age and obesity but included women who were diagnosed
with PCOS using the three different criteria. This study included women with PCOS

94
diagnosed by the Rotterdam criteria and this may explain some of the difference in
outcomes of the studies. Talbott et al [187] also failed to find a difference in ccIMT
in PCOS patients under the age of 45 years. As subjects were young in this study
population, it may be that the metabolic alterations were not yet sufficient to result in
measurable ccIMT changes; repeating the study in 15-20 years might conceivably
yield different results.
There were no differences in echocardiographic measures between the two groups
before or after adjustment for age and BMI except for fractional shortening which
was significant in the unadjusted but not the adjusted analysis. One study has
reported increased left ventricular posterior wall thickness and ejection fraction in
women with PCOS compared to controls [180] whilst others have not [209, 312].
Some studies have reported impaired diastolic function in women with PCOS
compared to age- and BMI- matched controls [180, 208] while others have not [209,
312]. The differences in results may be related, in part, to the lack of sensitivity of
traditional left ventricular echocardiographic measures.

95
CHAPTER 5 – Associations of Metabolic Parameters and Body Composition
with Cardiovascular Measures
5.1 Introduction
The previous two results chapters have compared the metabolic, anthropometric and
cardiovascular data between the polycystic ovary syndrome (PCOS) group and
healthy volunteer (HV) group, unadjusted and adjusted for age and body mass index
(BMI). Insulin resistance (a risk factor for cardiovascular disease) and testosterone
(a possible protector against the development of cardiovascular disease) were
significantly different between the two groups after adjustment for age and BMI.
Adiponectin, which has anti-atherogenic properties, was significantly higher in the
PCOS group in the adjusted analyses. These metabolic variables were explored
further to identify any influence on cardiovascular function.
Obesity is common in PCOS and is itself a risk factor for cardiovascular disease.
Studies to date have reported conflicting results on the risk of cardiovascular disease
and cardiovascular events in women with PCOS. Obesity could partly explain these
differing results. Body composition variables were explored further to determine
any influence on cardiovascular measures in our population.
As metabolic and body composition could be jointly contributing to cardiovascular
outcomes these were explored in multivariable analyses. The models were then
adjusted to explore whether adiposity and insulin resistance affected cardiovascular
function independently of each other.
Three cardiovascular measures were selected for analyses: aortic pulse wave velocity
(aPWV), common carotid intima-media thickness (ccIMT) and the ratio of early to

96
late diastolic mitral velocity (e’:a’). These were chosen as aPWV and ccIMT have
the greatest validity as predictors of cardiovascular events in the general population
[189, 190, 179]. The measure of diastolic function chosen was e’:a’ as this is less
sensitive to change in pre-load [299], an important consideration because of the
potential influence of obesity in this population, and because it is an independent
predictor of death [206].
The aims of the chapter are to:
1. Determine the effect of insulin resistance, testosterone and adiponectin on
cardiovascular measures in women with PCOS.
2. Determine the effect of BMI on cardiovascular measurements and metabolic
parameters in women with PCOS.
3. Explore any association between body composition and insulin resistance
with cardiovascular function
4. Explore any association between insulin resistance and cardiovascular
function adjusted for visceral fat
5.2 Metabolic Parameters and Cardiovascular Function in Women with PCOS
The PCOS population were initially divided into four groups, according to quartiles
of HOMA-IR, testosterone and adiponectin. The mean and standard deviation for
the chosen cardiovascular measures were calculated for each group. Comparisons
were then made between the quartiles.
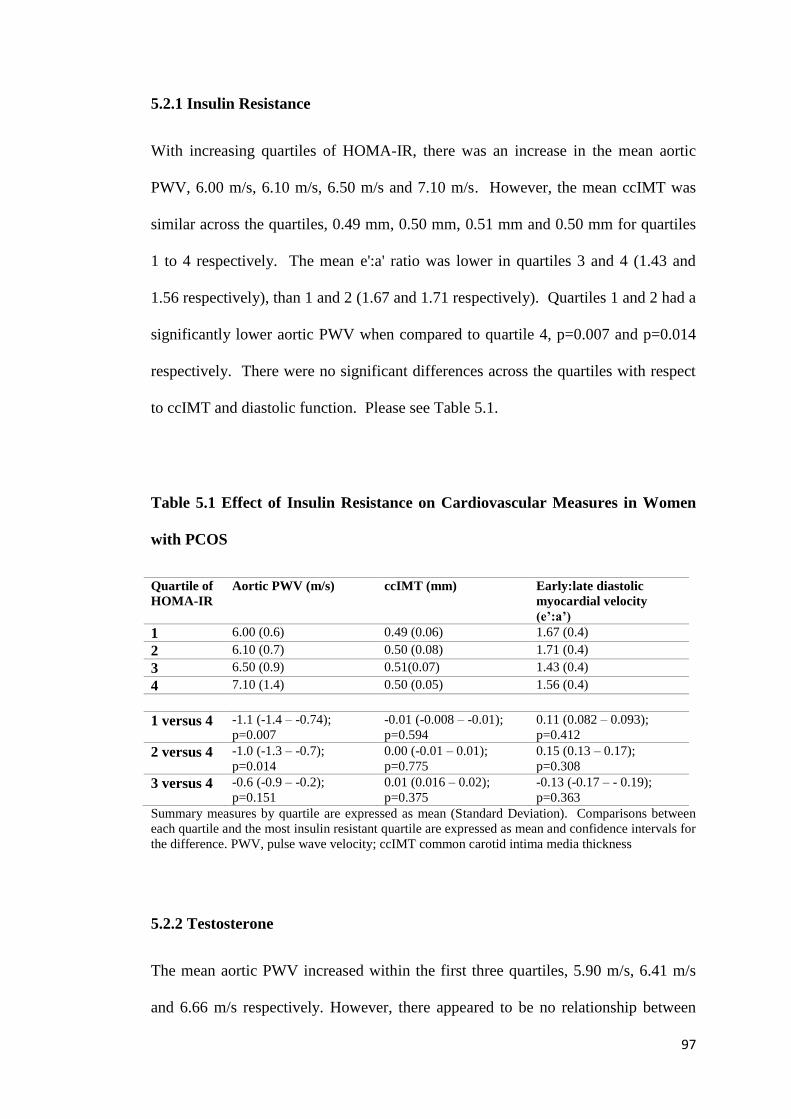
97
5.2.1 Insulin Resistance
With increasing quartiles of HOMA-IR, there was an increase in the mean aortic
PWV, 6.00 m/s, 6.10 m/s, 6.50 m/s and 7.10 m/s. However, the mean ccIMT was
similar across the quartiles, 0.49 mm, 0.50 mm, 0.51 mm and 0.50 mm for quartiles
1 to 4 respectively. The mean e':a' ratio was lower in quartiles 3 and 4 (1.43 and
1.56 respectively), than 1 and 2 (1.67 and 1.71 respectively). Quartiles 1 and 2 had a
significantly lower aortic PWV when compared to quartile 4, p=0.007 and p=0.014
respectively. There were no significant differences across the quartiles with respect
to ccIMT and diastolic function. Please see Table 5.1.
Table 5.1 Effect of Insulin Resistance on Cardiovascular Measures in Women
with PCOS
Quartile of
HOMA-IR
Aortic PWV (m/s) ccIMT (mm) Early:late diastolic
myocardial velocity
(e’:a’)
1 6.00 (0.6) 0.49 (0.06) 1.67 (0.4)
2 6.10 (0.7) 0.50 (0.08) 1.71 (0.4)
3 6.50 (0.9) 0.51(0.07) 1.43 (0.4)
4 7.10 (1.4) 0.50 (0.05) 1.56 (0.4)
1 versus 4 -1.1 (-1.4 – -0.74);
p=0.007
-0.01 (-0.008 – -0.01);
p=0.594
0.11 (0.082 – 0.093);
p=0.412
2 versus 4 -1.0 (-1.3 – -0.7);
p=0.014
0.00 (-0.01 – 0.01);
p=0.775
0.15 (0.13 – 0.17);
p=0.308
3 versus 4 -0.6 (-0.9 – -0.2);
p=0.151
0.01 (0.016 – 0.02);
p=0.375
-0.13 (-0.17 – - 0.19);
p=0.363
Summary measures by quartile are expressed as mean (Standard Deviation). Comparisons between
each quartile and the most insulin resistant quartile are expressed as mean and confidence intervals for
the difference. PWV, pulse wave velocity; ccIMT common carotid intima media thickness
5.2.2 Testosterone
The mean aortic PWV increased within the first three quartiles, 5.90 m/s, 6.41 m/s
and 6.66 m/s respectively. However, there appeared to be no relationship between

98
testosterone quartile and mean ccIMT or mean e':a'. There were no significant
relationships between quartiles of testosterone and the cardiovascular markers.
Please see Table 5.2.
Table 5.2 Effect of Testosterone on Cardiovascular Measures in Women with
PCOS
Quartile of
Testosterone
Aortic PWV (m/s) ccIMT (mm) Early:late diastolic
myocardial velocity
(e’:a’)
1 5.90 (0.6) 0.51 (0.07) 1.71 (0.4)
2 6.41 (1.4) 0.46 (0.11) 1.60 (0.5)
3 6.66 (1.1) 0.51 (0.07) 1.45 (0.4)
4 6.62 (1.4) 0.50 (0.06) 1.61 (0.4)
1 versus 4 -0.72 (-1.1 – -0.4);
p=0.08
0.01 (0.01 – 0.02);
p=0.327
0.1 (0.09 – 0.12); p=0.490
2 versus 4 -0.21 (-0.22 – -0.20);
p=0.585
-0.04 (-0.01 – -0.06);
p=0.061
-0.01 (-0.04 – 0.04);
p=0.493
3 versus 4 0.04 (-0.9 – 0.17);
p=0.927
0.01 (0.007 – 0.02);
p=0.536
-0.16 (-0.17 – -0.15);
p=0.226
Summary measures by quartile are expressed as mean (standard deviation). Comparisons between
each quartile and the highest testosterone quartile are expressed as mean and confidence intervals for
the difference. PWV, pulse wave velocity; ccIMT common carotid intima media thickness.
5.2.3 Adiponectin
With increasing quartiles of adiponectin, mean aortic PWV decreased; quartile one,
6.74 m/s, quartile two, 6.49 m/s, quartile 3, 6.34 m/s and quartile 4, 6.06 m/s. This
reached statistical significance for quartile 1 versus quartile 4. The mean ccIMT
decreased across the four quartiles; quartile one, 0.51mm, quartile two 0.51 mm,
quartile 3, 0.50 mm and quartile 4, 0.47mm but none of these reached significance.
There appeared to be no relationship with quartile of adiponectin and e':a' with the
exception of quartile 3 which was significantly lower than quartile 4. Please see
Table 5.3.

99
Table 5.3 Effect of Adiponectin on Cardiovascular Measures in Women with
PCOS
Quartile of
Adiponectin
Aortic PWV (m/s) ccIMT (mm) Early:late diastolic
myocardial velocity
(e’:a’)
1 6.74 (1.1) 0.51 (0.07) 1.56
2 6.49 (1.1) 0.51(0.06) 1.56
3 6.34 (1.0) 0.50 (0.07) 1.46
4 6.06 (0.8) 0.47 (0.07) 1.77
1 versus 4 0.68 (0.56 – 0.81);
p=0.053
0.04 (0.036 – 0.042);
p=0.067
-0.21 (-0.23 – -0.19);
p=0.163
2 versus 4 0.43 (0.29 – 0.57);
p=0.198
0.04 (0.03 – 0.04);
p=0.087
-0.21 (-0.25 – -0.17);
p=0.433
3 versus 4 0.28 (0.21 – 0.36);
p=0.534
0.03 (0.019 – 0.025);
p=0.285
-0.31 (-0.37 – -0.25);
p=0.028
Summary measures by quartile are expressed as mean (SD). Comparisons between each quartile and
the highest adiponectin quartile are expressed as mean and confidence intervals for the difference
5.3 Body Mass Index and Metabolic and Cardiovascular Measures in Women
with PCOS
Women with PCOS were divided into four groups according to quartile of BMI.
Mean and standard deviation for each metabolic parameter (HOMA-IR, testosterone
and adiponectin) and cardiovascular measure (aortic PWV, ccIMT and e’:a’) were
calculated for each group. Comparisons were made between the lower BMI quartiles
and the most obese BMI quartile.
5.3.1 Body Mass Index and Metabolic Parameters
The mean HOMA-IR increased with increasing quartile of BMI; 3.13, 3.21, 5.68 and
7.87 for quartiles one to four respectively. There appeared to be no relationship with
testosterone and quartile of BMI and this was confirmed when comparing the mean
difference between quartiles. Mean adiponectin decreased with increasing quartiles
of BMI; 17.2 µg/ml, 10.9 µg/ml, 9.1 µg/ml and 4.6 µg/ml. The lower two quartiles

100
compared to quartile 4 for HOMA-IR and adiponectin revealed significant
relationships. The lowest two BMI quartiles were less insulin resistant than the
highest quartile (p=0.001 for both) and had higher levels of adiponectin (p<0.001
and p=0.003). A comparison of quartiles 3 and 4 for adiponection also reached
statistical significance. Please see Table 5.4.
Table 5.4 Effect of Body Mass Index on Metabolic Parameters in Women with
PCOS
Quartile of
BMI
HOMA-IR Testosterone
(nmol/l)
Adiponectin
(µg/ml)
1 3.13 (3.3) 1.58 (0.7) 17.2 (11.3)
2 3.21 (3.2) 1.62 (0.7) 10.9 (8.2)
3 5.68 (4.2) 2.37 (1.2) 9.1 (6.2)
4 7.87 (5.1) 1.99 (0.9) 4.6 (2.5)
1 versus 4 -4.74 (-5.50 – -4.70);
p=0.001
-0.41 (-50 – -0.33);
p=0.166
12.6 (8.8 – 16.5); p<0.001
2 versus 4 -4.66 (-6.37 – -2.92);
p=0.001
-0.37 (-0.40 – -0.30),
p=0.219
6.3 (3.9 – 8.9); p=0.003
3 versus 4 -2.19 (-2.58 – -1.80);
p=0.150
0.38 (0.25 – 0.50);
p=0.291
4.5 (2.9 – 6.2); p=0.006
Summary measures by quartile are expressed as mean (SD). Comparisons between each quartile and
the most obese are expressed as mean and confidence intervals for the difference
5.3.2 Body Mass Index and Cardiovascular Function
With increasing quartiles of BMI there was an increase in mean aPWV; quartile one,
5.86 m/s; quartile two, 6.09 m/s; quartile three, 6.41 m/s and quartile four, 7.30 m/s.
Mean ccIMT measurements also increased with increasing quartile; first quartile,
0.47mm; second quartile, 0.49 mm; third quartile, 0.51 mm and fourth quartile, 0.52
mm. Mean e’:a’ ratios decreased with increasing quartile; quartile 1, 2.16;quartile 2,
1.78; quartile 3, 1.68 and quartile 4, 1.35.
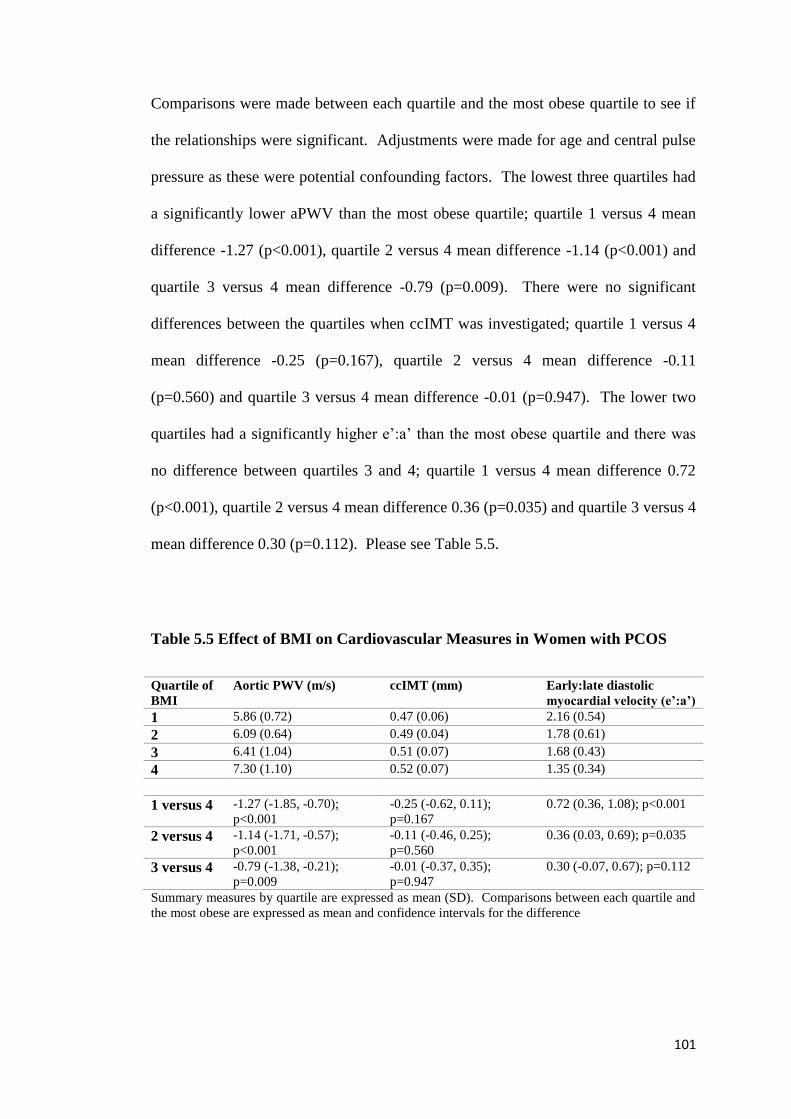
101
Comparisons were made between each quartile and the most obese quartile to see if
the relationships were significant. Adjustments were made for age and central pulse
pressure as these were potential confounding factors. The lowest three quartiles had
a significantly lower aPWV than the most obese quartile; quartile 1 versus 4 mean
difference -1.27 (p<0.001), quartile 2 versus 4 mean difference -1.14 (p<0.001) and
quartile 3 versus 4 mean difference -0.79 (p=0.009). There were no significant
differences between the quartiles when ccIMT was investigated; quartile 1 versus 4
mean difference -0.25 (p=0.167), quartile 2 versus 4 mean difference -0.11
(p=0.560) and quartile 3 versus 4 mean difference -0.01 (p=0.947). The lower two
quartiles had a significantly higher e’:a’ than the most obese quartile and there was
no difference between quartiles 3 and 4; quartile 1 versus 4 mean difference 0.72
(p<0.001), quartile 2 versus 4 mean difference 0.36 (p=0.035) and quartile 3 versus 4
mean difference 0.30 (p=0.112). Please see Table 5.5.
Table 5.5 Effect of BMI on Cardiovascular Measures in Women with PCOS
Quartile of
BMI
Aortic PWV (m/s) ccIMT (mm) Early:late diastolic
myocardial velocity (e’:a’)
1 5.86 (0.72) 0.47 (0.06) 2.16 (0.54)
2 6.09 (0.64) 0.49 (0.04) 1.78 (0.61)
3 6.41 (1.04) 0.51 (0.07) 1.68 (0.43)
4 7.30 (1.10) 0.52 (0.07) 1.35 (0.34)
1 versus 4 -1.27 (-1.85, -0.70);
p<0.001
-0.25 (-0.62, 0.11);
p=0.167
0.72 (0.36, 1.08); p<0.001
2 versus 4 -1.14 (-1.71, -0.57);
p<0.001
-0.11 (-0.46, 0.25);
p=0.560
0.36 (0.03, 0.69); p=0.035
3 versus 4 -0.79 (-1.38, -0.21);
p=0.009
-0.01 (-0.37, 0.35);
p=0.947
0.30 (-0.07, 0.67); p=0.112
Summary measures by quartile are expressed as mean (SD). Comparisons between each quartile and
the most obese are expressed as mean and confidence intervals for the difference

102
5.4 Association of Body Composition and Insulin Resistance with
Cardiovascular Measures
Multivariable analyses were undertaken to examine the relationships between
obesity and insulin resistance with cardiovascular function. Potential confounders of
age, height, central pulse pressure and LDL cholesterol were controlled for.
Interaction terms between PCOS status and the explanatory factors were included in
the models to see if the relationships varied between PCOS subjects and controls.
The standardised regression coefficient, 95% confidence interval, p value and the
percentage variation explained in the models were calculated.
Body composition markers (log visceral fat area and BMI) were strongly associated
with diastolic function (e’:a’) and aortic PWV (p<0.0001 for all relationships). There
was no association between log visceral fat area and BMI with ccIMT (p=0.382 and
p=0.101 respectively). The markers of insulin resistance (HOMA-IR and Insulin
AUC) were strongly associated with diastolic function (e’:a’) and aortic PWV
(p<0.0001 for all relationships). The interaction terms were not significant
suggesting that the relationships between the cardiovascular risk factors and the
explanatory variables were similar in both the PCOS and HV groups. There was no
significant overall association with HOMA-IR and ccIMT (p=0.750). However, the
association between insulin AUC and ccIMT varied in the two groups with no
association seen in the PCOS group (p=0.650) but a strong association in the HV
group (p=0.009). Please see Table 5.6.

103
Table 5.6 Associations of Measures of Body Composition and Insulin Resistance with Diastolic Function, Aortic Pulse Wave Velocity
and Common Carotid Intima-Media Thickness
Standardised regression
coefficient
95% CI P-value Percentage variation
explained
Log visceral fat area
E’:a’ -0.386 -0.536, -0.236 <0.0001 48.4
Aortic PWV 0.291 0.153, 0.434 <0.0001 32.4
Common carotid IMT 0.067 -0.084, 0.217 0.382 31.1
BMI
E’:a’ -0.449 -0.584, -0.315 <0.0001 48.8
Aortic PWV 0.383 0.253, 0.513 <0.0001 38.9
Common carotid IMT 0.114 -0.022, 0.251 0.101 30.3
HOMA-IR
E’:a’ -0.311 -0.452, -0.171 <0.0001 41.6
Aortic PWV 0.298 0.164, 0.432 <0.0001 34.1
Common carotid IMT -0.022 -0.159, 0.115 0.750 30.2
Insulin AUC
E’:a’ -0.466 -0.609, -0.323 <0.0001 47.7
Aortic PWV 0.304 0.159, 0.449 <0.0001 33.9
Common carotid IMT
PCOS
-0.047 -0.252, 0.158 0.650 37.3
Common carotid IMT HV 0.323 0.084, 0.562 0.009 31.6
Percentage variation explained includes age, height, central pulse pressure and LDL cholesterol. E’:a’, early:late mitral velocity ratio; PWV, pulse wave velocity; IMT,
intima media thickness

104
5.5 Association of Insulin Resistance with Cardiovascular Measures Adjusted
for Log Visceral Fat
Further analyses were undertaken to see if adiposity and insulin resistance affected
cardiovascular function independently of each other. The results were adjusted on
insulin sensitivity for log visceral fat. This adjustment reduced the strength of the
associations between HOMA-IR and aortic PWV, and insulin AUC and aortic PWV
which nevertheless remained significant (p=0.015, and p=0.015 respectively). There
was no longer a significant association between HOMA-IR and diastolic function
after adjustment for log visceral fat area (p=0.063) but the association between
insulin AUC and e':a' remained highly significant (P<0.0001). The associations
between HOMA-IR and ccIMT, and between insulin AUC and ccIMT in the PCOS
group remained non-significant (p=0.270 and p=0.548). The association between
insulin AUC and ccIMT in the HV group remained, but was less significant
(p=0.028). Please see Table 5.7.
Table 5.7 Associations of Markers of Insulin Resistance with Cardiovascular
Measures Adjusted for Log Visceral Fat Area
Standardised
regression
coefficient
95% CI p-value
HOMA-IR
E’:a’ -0.099 -0.180, 0.005 0.063
Aortic PWV 0.214 0.043, 0.385 0.015
Common carotid IMT -0.099 -0.274, 0.077 0.270
Insulin AUC
E’:a’ -0.173 -0.266, -0.080 <0.0001
Aortic PWV 0.214 0.042, 0.385 0.015
Common carotid IMT
PCOS
-0.076 -0.329, 0.176 0.548
Common carotid IMT
HV
0.314 0.035, 0.593 0.028
E’:a’, early:late mitral velocity ratio; PWV, pulse wave velocity; IMT, intima media thickness

105
5.6 Summary of Results
In the PCOS group, there was a significant relationship between HOMA-IR and
aortic PWV, but no relationship between testosterone and adiponectin with
cardiovascular measures. This would suggest that worsening insulin resistance was
associated with arterial stiffness. With increasing quartiles of BMI, mean HOMA-IR
increased and adiponectin decreased suggesting that, as expected, more obese
women with PCOS are more insulin resistant and have lower levels of adiponectin.
There appeared to be no clear relationship with testosterone and BMI in PCOS
women.
Mean aortic PWV and ccIMT increased with increasing quartiles of BMI in the
PCOS group suggesting that obesity was associated with worse cardiovascular
function. Diastolic function decreased with increasing quartiles of BMI. There was
a significant difference across the lower three quartiles with the most obese quartile
for aortic PWV and diastolic function (except quartile 3 compared to quartile 4 for
diastolic function) but no significant differences between the groups with respect to
ccIMT. Increasing BMI in women with PCOS appeared to be associated with stiffer
arteries and worse diastolic function but there was no effect on ccIMT.
In multivariable analyses, body composition and insulin resistance measures were all
significantly associated with aortic PWV and diastolic function, after controlling for
the potential confounding influences of age, height, central pulse pressure and LDL-
cholesterol. There was no association between log visceral fat, BMI, HOMA-IR and
ccIMT. Insulin AUC was associated with ccIMT in the healthy volunteers but not in
the PCOS group.

106
Further adjustments for log visceral fat area revealed that the strengths of the
associations between measures of insulin resistance and both aortic PWV and
diastolic function were reduced but remained significant. This suggests that insulin
resistance may be contributing to increased arterial stiffness and diastolic
dysfunction independently of visceral fat.
5.7 Discussion
In this study, central arterial stiffness and diastolic dysfunction were associated with
insulin resistance and abdominal obesity in young women. It is likely that insulin
resistance and abdominal obesity exert effects on cardiovascular function that are at
least in part mediated independently of each other. PCOS does not appear to confer
any additional cardiovascular risk in young women. Adiponectin and testosterone do
not appear to be conferring any protection against cardiovascular risk in young
women with PCOS.
Some studies have demonstrated that women with PCOS have stiffer arteries [164,
166, 200] than controls whereas others, like mine, have found no difference in
arterial stiffness between women with PCOS and controls [201, 202, 203]. These
differing results may be due to small numbers of subjects, failure to adjust fully for
obesity, or estimating stiffness in a single arterial territory. Previous studies have
used simple anthropometric measures to assess adiposity whereas in this study CT
was incorporated, a more accurate and precise measure of regional fat distribution.
DEXA was also used to assess lean mass and fat mass, as a higher BMI can reflect a
greater lean mass as well as increased fat. This study has demonstrated that central
obesity is associated with arterial stiffness in women with PCOS but this is not

107
affected by the syndrome itself. This is in agreement with Ketel et al [201] who
used waist circumference as an indicator of central obesity whereas this study used
CT. Ketel et al did not make an assessment of insulin resistance in their study [201]
whereas this study did and found that insulin resistance was having an independent
effect on arterial stiffness. Cussons et al, in agreement with my study, found no
difference in arterial stiffness (assessed by PWV and Ai) between PCOS women and
controls but did find that flow-mediated dilatation (FMD) was reduced in the PCOS
group [203]. This group did not demonstrate any difference in markers of insulin
resistance between the PCOS women and controls but did find elevated androgens in
the PCOS group and attributed the difference in FMD to the androgens [203].
Meyer et al found that women with PCOS had stiffer arteries and were more insulin
resistant than controls; they demonstrated that in women with PCOS, insulin
resistance was making an independent contribution to the variance in PWV [164]. In
this study, the PCOS group were significantly more insulin resistant and had higher
testosterone levels that the HV group. Insulin resistance was independently
associated with arterial stiffness but testosterone had no significant association with
arterial stiffness.
There was no significant difference in ccIMT between the PCOS group and HVs in
adjusted or unadjusted analyses. These results are in agreement with those of Talbott
et al [187] whose PCOS population had a mean testosterone of 1.6mmol/l similar to
our own. Studies reporting a greater ccIMT in PCOS women had higher mean
testosterone values [180-182] than this study, but had used less sensitive methods
than the mass spectrometry method adopted here to measure testosterone.
Vryonidou et al have suggested that hyperandrogenism partly attenuates the
difference in ccIMT that they found between PCOS women and controls [184].

108
However, I did not find any association between ccIMT and testosterone. The mean
testosterone level was higher in the Vryonidou et al study but they used less
sensitive methods to measure testosterone than I did. No association was found
between insulin resistance or body composition with ccIMT in my study, except for
insulin AUC in the HV group. This is in agreement with Soares et al who also failed
to demonstrate a difference in ccIMT between PCOS women and healthy controls
and found no difference in markers of insulin resistance between the two groups
[166]. Vryonidou et al found no association between insulin resistance and ccIMT
but did with BMI and ccIMT [184].
There were no difference in echocardiographic measures between PCOS women and
HVs in this study. However, diastolic function was associated with insulin resistance
and central adiposity. Kosmala et al [312] also found that impaired systolic and
diastolic function were associated with insulin resistance in young, obese women
with PCOS. In this study, lean women with PCOS were also included and therefore
adds knowledge to the Kosmala et al study. Yarali et al also found that fasting
insulin level correlated negatively with e’:a’ ratio and have suggested that there is an
association between insulin resistance and diastolic dysfunction in women with
PCOS [208].

109
CHAPTER 6: Discussion
6.1 Background
Polycystic ovary syndrome (PCOS) is characterised by hyperandrogenism, ovarian
dysfunction and polycystic ovaries. The pathogenesis is debated but insulin
resistance is thought to play a role. It is a common condition, affecting 4-20% of
pre-menopausal women depending on criteria used for diagnosis and ethnicity.
Many cardiovascular risk factors have been documented to occur in the PCOS
population including hypertension [61], dyslipidaemia [59, 60, 134], insulin
resistance [57, 83, 84], type 2 diabetes [67, 75-82, 100] and impaired glucose
tolerance [75-82]. Due to the presence of these cardiovascular risk factors, it is
expected that women with PCOS are at greater risk of cardiovascular disease than
women without the syndrome.
Three large prospective cohort studies have found an increased risk of cardiovascular
events in women reporting a history of clinical features of PCOS [70-72]. A
retrospective cohort study found increased odds ratio for the prevalence of
myocardial infarction (MI) and angina in women with PCOS compared to the local
female population; this was highest in women over the age of 65 years [148]. A
meta-analysis in 2011, found the relative risk for coronary heart disease or stroke
was 2.02 in women with PCOS compared to female controls [73]; this was reduced
to 1.55 following adjustments for BMI [73]. However, two long-term follow-up
studies failed to find a difference in the number of cardiovascular events between
women with PCOS and controls [41, 147]. Work by our own group looked at a large
community-based database and found no increased risk of large vessel disease in

110
women with PCOS [67]. A meta-analysis in 2014, found an increased risk of non-
fatal stroke in women over 45 years but this observation did not remain after
adjustment for BMI [146]; there was no significant increased risk of MI [146].
There may be an excess of cardiovascular events in older women with PCOS but
there is no evidence currently of increased cardiovascular events in young women
with PCOS.
Subclinical cardiovascular disease can be assessed by measuring endothelial
dysfunction, carotid intima-media thickness (cIMT), arterial stiffness and myocardial
dysfunction. Some [164, 165, 168] but not all [166, 167, 169-171] studies have
found evidence of endothelial dysfunction in women with PCOS. Evidence of
increased cIMT in women with PCOS has been demonstrated in some studies [180-
185, 188]. However, others have failed to find any increased cIMT in women with
PCOS [166, 186]; one study only found evidence of increased cIMT in older women
with PCOS [187]. Arterial stiffness in women with PCOS has been demonstrated in
some studies [164, 166, 200] but not in others [201-203]. Some studies have
reported impaired diastolic function in women with PCOS compared to controls
[180, 208] but others have not [209, 312].
Obesity is common in women with PCOS [56] and is itself a risk factor for
cardiovascular disease. It is difficult to determine whether any cardiovascular risk in
young women with PCOS is due to the syndrome itself or to obesity. Some people
with obesity appear to be metabolically healthy and not at increased risk for
cardiovascular disease [212, 213] whilst others are metabolically unhealthy and are
at increased risk for cardiovascular disease. The distribution of body fat is important
as visceral adiposity is an independent risk factor for cardiovascular disease [112-
114]. There is some evidence to suggest women with PCOS may have greater
111
central adiposity than controls [56, 118]; however, Barber et al, using magnetic
resonance imaging (MRI), the gold standard for measuring fat distribution, failed to
find any evidence of increased visceral fat in women with PCOS compared to
matched controls [119].
Possible mechanisms by which obesity contributes to cardiovascular disease are
unclear but secretion of adipocytokines may play a role. Some adipocytokines have
been associated with endothelial dysfunction and oxidative stress which contribute to
the development of atherosclerosis [220]. Hyperinsulinaemia and insulin resistance
have also been associated with altered adipocytokine secretion [235, 220]. Insulin
resistance itself increases the risk for coronary artery disease [250] and has been
shown to alter large artery compliance [253] and affect endothelial function [254].
Although obesity is common in PCOS it is not universal [56]. Insulin resistance is
also common in PCOS [57, 83, 84] and is present in non-obese and obese women
with PCOS [84].
In light of these considerations, this study sought to determine whether there was
increased cardiovascular risk in young women with PCOS which was independent of
obesity. The relationships between insulin resistance and cardiovascular function,
and body composition and cardiovascular function were also explored.
6.2 Discussion of Results
This study has shown that arterial stiffness, carotid intima-media thickness and
diastolic function are not increased in young women with PCOS compared to
healthy volunteers, after careful adjustment for age and BMI. In this population,
there was a positive association between insulin resistance and visceral adipose

112
tissue with central arterial stiffness and an inverse association of these measures with
diastolic function. The association was reduced but still remained significant for
insulin resistance and both central arterial stiffness and diastolic dysfunction after
adjusting for log visceral fat. This suggests that insulin resistance and visceral fat
were mediating an effect on the cardiovascular measures, independently of each
other.
Some studies have demonstrated that women with PCOS have stiffer arteries [164,
166, 200] than controls whereas others, like mine, have found no difference in
arterial stiffness between women with PCOS and controls [201-203]. These
differing results may be due to small numbers of subjects, failure to adjust fully for
obesity, or estimating stiffness in a single arterial territory. Previous studies have
used simple anthropometric measures to assess adiposity whereas this study
incorporated CT, a more accurate and precise measure of regional fat distribution.
This study has demonstrated that central obesity is associated with arterial stiffness
in women with PCOS but arterial stiffness is not affected by the syndrome itself.
This is in agreement with Ketel et al [201] who used waist circumference as an
indicator of central obesity. Central adiposity is a risk factor for cardiovascular
disease in other populations [112-114]. Central adiposity has also been shown to be
associated with increasing arterial stiffness in the elderly [313] and in healthy
children [314]. Possible mechanisms for central adiposity to cause arterial stiffness
include an unfavourable adipocytokine profile and/or insulin resistance.
In this study population, insulin resistance was associated with arterial stiffness
independently of visceral fat. Markers of insulin resistance, HOMA-IR and insulin
area under the curve (IAUC), were significantly higher in the PCOS group after
adjustments for age and BMI. This is consistent with other studies in the literature

113
[19, 58, 84]. Insulin resistance disrupts insulin signalling pathways [252], resulting
in a reduction in nitric oxide and a relative increase in endothelin-1. Both of these
alterations may contribute to the development of atherosclerosis, as demonstrated in
mice [251]. Hyperinsulinaemia has been shown to promote smooth muscle cell
growth, endothelial dysfunction, oxidative stress and activate the sympathetic
nervous system [315] which could all contribute to increased arterial stiffness. The
finding that insulin resistance persists in women with PCOS compared to HV after
adjustment for BMI and age, is potentially an important finding as it could provide a
link between PCOS and cardiovascular disease independently of BMI.
There was no significant difference in ccIMT between the PCOS group and HVs in
adjusted or unadjusted analyses. These results are in agreement with those of Talbott
et al [187] whose PCOS population had a mean testosterone of 1.6mmol/l similar to
our own. It is unclear whether testosterone is protective or detrimental to
cardiovascular health. When quartiles of testosterone were examined in the PCOS
group, there were no significant relationship with cardiovascular measures and
therefore in this group testosterone does not appear to be playing a role in
cardiovascular risk in women with PCOS. There was no association between insulin
resistance or body composition with ccIMT.
This study did not demonstrate any differences in echocardiographic measures
between PCOS and HVs. Some studies have reported impaired diastolic function in
women with PCOS compared to age- and BMI- matched controls [180, 208] while
others have not [209]. Differing results may be in part due to the lack of sensitivity
of traditional left ventricular echocardiographic measures used. There was an
association with insulin resistance and visceral adiposity with diastolic heart function
in my study. Kosmala et al [312] also found that impaired systolic and diastolic

114
function were associated with insulin resistance in young, obese women with PCOS.
Hyperinsulinaemia could potentially cause cardiac hypertrophy through myocyte
growth and interstitial fibrosis, resulting in cardiac dysfunction. Obesity results in
increased blood volume and blood pressure which can lead to compensatory cardiac
hypertrophy and in time to cardiac dysfunction.
6.3 Study Limitations
There are a number of limitations in this study. The study was cross-sectional in
design; therefore the possibility that the association seen between fat distribution,
hyperinsulinaemia and cardiovascular dysfunction was mediated by an unmeasured
common underlying factor cannot be discounted. This study does not give insight
into the mechanisms causing cardiovascular dysfunction; it could be postulated that
insulin resistance and central adiposity were influencing cardiovascular dysfunction
independently of each other and therefore there may be more than one mechanism
involved.
Selection bias may have influenced our results. Recruitment of PCOS women who
by chance were healthier than non-enrolled PCOS women (bias towards the null)
may have happened. This is because women with a history of diabetes,
hypertension, dyslipidaemia or medication for these were excluded from
participating. If women with these cardiovascular risk factors had been included, a
difference in cardiovascular function between the two groups may have been found.
The more inclusive Rotterdam criteria for diagnosis of PCOS were used in this study
and may have resulted in the recruitment of women with milder phenotypes of the
syndrome. A ‘healthy worker’ effect (bias away from the null) may have occurred

115
as some of the volunteers were recruited from medical staff and students at our
institution. Due to the nature of their studies and work, they may have been more
likely to have increased knowledge and awareness of cardiovascular disease than the
general population. If this knowledge was put into practice then they may have been
healthier than the general population.
The intention was to age- and BMI-match PCOS subjects with HVs but this was not
achieved; however, these potential confounding factors were adjusted for carefully in
statistical analyses to avoid any influence they may have had on cardiovascular
outcome measures. Obesity itself is associated with hypertension, dyslipidaemia,
diabetes and impaired glucose tolerance and therefore may have contributed to the
difficulty of recruiting obese, ‘healthy’ volunteers. Obese women may be less likely
to volunteer to participate in research studies than women with a normal BMI
whereas obese women with PCOS may be more likely to participate as they have a
medical diagnosis and hope to benefit their own health. Initially, healthy volunteers
were recruited from our institution. Young students participated and there was no
difficulty in age-matching at that time, although there was difficulty in BMI-
matching. As recruitment was widened to the local community, the age of healthy
volunteers increased. It may be that older women were more likely to take part as
they had concerns about their health and were less likely to be responsible for the
care of young children. As young women with PCOS were included in this study,
the findings cannot be extrapolated to older women with PCOS.
The majority of women enrolled in the study were Caucasian; however, significantly
more ethnic minority groups were represented in the PCOS group. Asian and
Middle Eastern populations are more at risk of developing diabetes than Caucasians.

116
This could have influenced the outcome of the study but the numbers were relatively
small and therefore analyses were not undertaken excluding these women.
The amount of physical activity undertaken by the subjects was not assessed and this
could have been a confounding factor. It is possible that women with PCOS were
more physically active than the HVs thus offering them some cardiovascular
protection.
A basic smoking history was taken to ascertain whether the subjects were current or
ex-smokers as smoking is a risk factor for cardiovascular disease. Smoking pack
year history was not assessed; this is a weakness in the study as some women may
have had a greater lifetime exposure to cigarette smokers than others.
Women were identified to have diabetes or impaired glucose tolerance in both the
PCOS group and HV group. This was unknown pathology and the women were not
excluded from analyses. It could be that this affected the results, especially as there
was a significant difference between the two groups. However, as there was no
difference in cardiovascular function between the two groups it is unlikely to have
had a significant effect. The models exploring body composition and insulin
resistance markers with cardiovascular function did not find any differences between
the groups except for insulin area under the curve and cIMT in the HVs.
It is not possible to completely exclude an association between PCOS and arterial
stiffness or diastolic function because of the sample size. However, this is one of the
largest studies on cardiovascular function in PCOS ever conducted, suggesting that
any effects of the syndrome on these cardiovascular measures independent of
obesity, if present, are likely to be small.

117
6.4 Implication of Results on Clinical Practice
This study has shown that a diagnosis of PCOS itself does not increase
cardiovascular risk in young women with PCOS. Further studies are needed to
confirm this, but it is reassuring information for the healthcare provider to give to the
patient. However, this study has shown that central obesity and insulin resistance are
associated with cardiovascular risk in young women, and patients should be
counselled regarding this.
Obesity and central adiposity can be easily measured in clinic by measuring BMI
and waist circumference. These are of low cost and do not expose the patient to
radiation. They can be repeated to assess the effectiveness of any interventions.
Insulin resistance is harder to assess in the clinical setting. A fasting glucose and
fasting insulin sample are needed to calculate HOMA-IR and although this is
feasible it does require patients to be fasted. Assessing patients for the development
of diabetes and impaired glucose tolerance is most easily done by measuring
glycated haemoglobin. However, this study and others [109, 110] have shown that
this misses a significant number of cases and the clinician needs to be aware of the
limitations of this test. An oral glucose tolerance test (OGTT) is the best method but
is inconvenient and costly for the healthcare provider and patient. OGTTs should be
performed at diagnosis and in high risk groups in the PCOS population as suggested
in the NICE guidelines [107]. Women with PCOS should be strongly advised and
encouraged to maintain a normal BMI (less than 25 in Caucasians and less than 23 in
Asians) and waist circumference (less than 80 centimetres).
Interventions to assist weight loss, reduce central adiposity and improve insulin
resistance in women with PCOS include lifestyle measures (diet and exercise) and
118
medication such as orlistat, glucagon-like peptide-1 (GLP-1) mimetics and
metformin. Lifestyle intervention is recommended as the first line treatment for
prevention of cardiovascular disease by the AE-PCOS society [316]. Calorie
restriction can reduce BMI, abdominal obesity and insulin resistance in women with
PCOS [317-319]. A 24 week structured exercise program consisting of three
supervised 30 minute sessions on a bicycle ergometer with a target of 60-70% of
maximal oxygen consumption resulted in reduction in weight, BMI, waist
circumference and an improvement in insulin resistance indices in obese PCOS
women [319]. However, Hutchinson et al found no change in weight or waist
circumference with their exercise intervention program (12 weeks of three
supervised, intensive one hour training sessions) but did find a significant
improvement in insulin resistance, a reduction in visceral fat mass and triglycerides
in obese PCOS women [320]. Two systematic reviews and meta-analyses have
confirmed that lifestyle intervention in women with PCOS reduces weight and waist
circumference and improves insulin resistance [321, 322]. Sprung et al found an
improvement in endothelial function (measured by flow-mediated dilatation) in
overweight and obese women with PCOS using a 16 week moderate-intensity
aerobic exercise training program which was independent of improvements in body
composition and insulin resistance [323]. They also found that compared to obese
controls, women with PCOS had defective microvascular function which improved
with a supervised 16 week moderate-intensity aerobic exercise program via the up
regulation of nitric oxide [324]. In addition to the benefits to cardiovascular health
outlined above, regular exercise also improves reproductive function [319] and
cardiorespiratory fitness [325]. Women with PCOS should be strongly encouraged
to undertake regular aerobic exercise even if weight loss is not achieved.

119
Orlistat and Liraglutide are the only licensed medications for weight loss in the UK.
Orlistat is an established medication and has been shown to reduce weight in women
with PCOS [326]. Liraglutide, a glucagon-like peptide-1 (GLP-1) mimetic, has very
recently received a licence for weight loss in the UK. Several studies have
demonstrated that liraglutide is effective in reducing weight in women with PCOS.
One observational study of 84 obese and overweight PCOS women, who had failed
to lose weight with metformin and lifestyle intervention, found a mean weight loss
of 9 kilograms when treated with liraglutide [327]. A further observational study of
36 obese PCOS women treated with liraglutide for 12 weeks, found a mean weight
loss of 3.8 kilograms and significant improvement in uncontrolled eating and
emotional eating scores [328]. Liraglutide in combination with metformin resulted
in greater weight loss and reduction in waist circumference than metformin or
liraglutide alone in a randomised open-label study in obese PCOS women [329]. Six
months treatment with liraglutide has also been shown to significantly reduce
procollagen type III amino-terminal peptide (PIIINP), an early marker of liver
fibrosis, in obese women with PCOS [330]. These women had also lost weight and
therefore the reduction in PIIINP may have been related to the weight loss or the
liraglutide treatment or a combination of the two. There is a potential risk of
developing medullary thyroid cancer with liraglutide treatment, careful discussion
with the patient should be undertaken before prescribing it for weight loss in women
with PCOS. Exenatide, another GLP-1 has also been shown to reduce weight in
women with PCOS [331] but does not have marketing authorisation for weight loss
in the UK.
Metformin has been shown to reduce weight and/or waist circumference in women
with PCOS in some [332, 333] but not all studies [334]. Work, by our own group

120
and Diamanti-Kandarakis et al found that metformin reduces arterial stiffness and/or
improves endothelial function in women with PCOS [332, 335]. Metformin has also
been shown to revert some women with PCOS and IGT to normal glucose tolerance
[336] and reduce circulating CRP [337]. Metformin is safe in pregnancy and
consideration should be given to prescribing this for PCOS women at higher risk of
cardiovascular disease.
Attention should also be given to other modifiable cardiovascular risk factors; PCOS
patients should be discouraged from smoking; blood pressure and lipid profiles
should be assessed regularly and treated as needed.
6.5 Future Studies
This study looked at young women with PCOS and it could be that the population
had yet to develop subclinical cardiovascular disease. Increasing age is associated
with increased cardiovascular risk. In order to establish if cardiovascular events are
affected in older women with PCOS, a sample of older women with PCOS and HVs
should be investigated. Alternatively, this cohort of patients and healthy volunteers
should be followed up in the future but results would not be available for many
years. Larger and prospective longitudinal studies would also be useful to confirm if
the findings of this study are reflected in an ongoing absence of an increase in
cardiovascular risk.
As PCOS is a heterogeneous disorder, larger studies, sufficiently powered to look at
subgroups within the PCOS population, are needed to identify who is most likely to
develop cardiovascular risk factors and disease. This would help clinicians stratify
who was at greatest risk and who would benefit most from intervention. This is

121
particularly important as PCOS is very common and potentially poses a large burden
on the National Health Service.
Testosterone could be protective or detrimental in cardiovascular health and a study
specifically designed to examine whether women with PCOS are offered some
cardiovascular protection or not from testosterone should be undertaken.
6.6 Conclusion
This is the first study to comprehensively assess the relationships between carotid
intima-media thickness, arterial stiffness, myocardial function, metabolic
abnormalities and regional fat distribution in women with PCOS. It demonstrates
that central arterial stiffness and diastolic dysfunction are not increased in young
women with PCOS compared to healthy volunteers, after adjustment for age and
BMI. Insulin resistance and visceral adipose tissue are associated with arterial
stiffness and diastolic dysfunction in young women and are likely to exert their
effects on cardiovascular risk independently of each other. This extends the
understanding of cardiovascular risk in young women with PCOS. Further studies
are needed to establish whether young women with PCOS are protected from
cardiovascular dysfunction by an unknown factor related to the syndrome. Central
obesity and insulin resistance are modifiable risk factors for cardiovascular disease
in young women with PCOS, and lifestyle measures which target weight loss remain
crucially important in disease management.

122
Appendix 1
VISCERAL FAT AND VASCULAR RISK IN POLYCYSTIC OVARY SYNDROME
PATIENT INFORMATION SHEET (Version 2 September 2008)
1. Title of study Stratification of cardiometabolic risk in Polycystic Ovary Syndrome: is visceral fat a major player? 2. Introduction You are being invited to take part in a clinical research study. This study will also form part of a higher degree (MD) educational qualification. Before you decide whether you wish to become involved it is important that you understand why the research is being done and what it will involve. Please take time to read the following information carefully and discuss it with others if you wish. Please do not hesitate to ask us if there is anything that is not clear or if you would like more information. Take time to consider whether or not you would wish to take part. Thank you for reading this. 3. What is the purpose of this study? Polycystic ovary syndrome (PCOS) is the commonest hormone condition in women of reproductive age, affecting up to 10% of the premenopausal population. In addition to its well-recognised effects on weight gain, excessive hair growth and infertility, it is becoming increasingly clear that PCOS is associated with long-term health risks including diabetes and arterial (blood vessel)/heart muscle disease, both of which are related to impaired action of insulin throughout the body, also known as insulin resistance. There is increasing evidence that a major underlying cause of insulin resistance is a build up of a particular type of fat around the bowel called visceral fat. There have not been any studies on the relationship between visceral fat and arterial disease (or ‘stiffness’) or heart muscle function in young women with PCOS, but this may be an important area to study as research in middle-aged women with PCOS has shown that visceral fat is associated with increased ‘furring’ of the arteries in the neck, which is a marker for early heart disease. We aim to measure visceral fat area in women with PCOS and

123
relate this to arterial stiffness and heart muscle function. This study will involve two visits to the Clinical Research Facility and the Welsh Heart Research Institute at the Heath hospital, each lasting 2-3 hours or one visit lasting 6 hours. 4. Why have I been chosen? You have been chosen for this study as your doctor has identified you as having PCOS. A total of 100 patients and 100 healthy volunteers will be studied. 5. Do I have to take part? It is up to you to decide whether or not to take part. If you decide to take part you will be given this information sheet to keep and be asked to sign a consent form. If you decide to take part you are still free to withdraw at any time and without giving a reason. A decision to withdraw at any time, or a decision not to take part, will not affect the standard of care you receive. 6. What will happen to me if I take part? The study will take place at the Clinical Research Facility and the Welsh Heart Research Institute at the University Hospital of Wales. You will be asked to attend in the morning having only had water to drink (i.e. no breakfast, tea or coffee) on 2 separate days. Each visit will last approximately 2-3 hours. If you are a smoker we request that you avoid smoking on each morning. We will firstly require you to have a pregnancy test before carrying out any measurements. We will then measure your weight, height, blood pressure, waist circumference, hip circumference and take a brief clinical history. We will take blood samples (approximately four tablespoons) to check levels of ‘fat’ proteins (called adiponectin, PAI-1 and RBP-4), blood vessel proteins (called BNP, ICAM-1, VCAM-1 and TBARS) and to measure cholesterol, insulin, glucose and CRP (a marker of inflammation in the body). We will also measure a
urine sample for a substance called 8-epi-PGF2, which is a marker of cholesterol damage. Next we will measure the amount of visceral fat in your body by three techniques: the BIA (bioimpedance) method, DEXA and CT scanning. The BIA technique is a simple, rapid and non-invasive technique which is used routinely in clinical practice to measure a patient’s percentage body fat. It sends a very small electrical current through the body and measures the body’s resistance to this current to determine the amount of fat, muscle and water present. The amount of electrical current is so small that you will be unable to feel it. The DEXA scan is also a simple, rapid and non-invasive technique which is used routinely in clinical practice. This scan does involve a very small dose of radiation, equivalent to what you would be exposed to simply by

124
living in Cardiff for 1 day. A CT scan will then be performed. Unlike CT scans used in medical practice this will be a single image (or ‘slice’) only, taken at the level of your lower spine. This will give us enough information to measure the amount of visceral fat present, while minimising your exposure to radiation. The amount of radiation you will receive is very small and similar to what you would be exposed to simply by living in Cardiff for 1 week. We will then measure the stiffness of your blood vessels and your heart muscle function. The ‘arterial stiffness’ test will be performed using an item of equipment called a ‘Sphygmocor’ machine. This technique, which is completely painless and ‘non-invasive’, consists of a small pencil-like probe placed over the wrist, which measures the waveform of the pulse. Further measurements will be obtained over pulses in the neck (the carotid artery) and top of the leg (femoral artery). The ‘heart muscle’ test will be performed at the Welsh Heart Research Institute using a technique called echocardiography. This is a painless non-invasive ultrasound technique used routinely in clinical practice to give pictures of the heart muscle and chambers within the heart. It uses a very high frequency sound which cannot be heard, but can be emitted and detected by special machines. Finally we will ask you to attend the Clinical Research Facility on a second morning for an oral glucose tolerance test (OGTT). This will assess how good your body is at handling sugar (termed ‘insulin resistance’). We request that you attend in the morning having only had water to drink (i.e. no breakfast, tea or coffee). We will take a blood test from you (roughly one tablespoon) then we will ask you to take a drink containing a measured amount of glucose. Further blood samples (at 30, 60 and 90 minutes) will be taken during the test and a final test is taken at two hours. Each blood sample will be roughly one tablespoon. If you wish we will be able to reimburse any travelling expenses / car parking fees incurred while attending for the study visits. 7. What do I have to do? It is important that you take your regular medication in the normal way without altering the dose or timing of these. You should inform us of any dose adjustments. There are no lifestyle or dietary restrictions and you can continue your daily activities normally. We request that you report any illnesses to us as they may influence the timing of your test visit. You should inform us if there is any possibility of you being pregnant and this will be tested for in all participants. If you are pregnant you will not be able to participate in this study. For the study visits, we ask that you attend the Clinical Research

125
Facility at 8 o’clock in the morning having fasted from midnight the previous night. You can drink water freely up to this point. 8. What are the possible disadvantages and risks of taking part? Other than possible discomfort (temporary pain, swelling, bruising and rarely infection) caused by the collection of blood, no other side effects are anticipated from the study procedures, though as outlined above, a ‘single slice’ CT scan and DEXA scan do involve exposure to a small amount of radiation. In addition the CT scan could by chance pick up an unsuspected abnormality in your abdomen, in which case you will be given an opportunity to discuss these findings further with Dr Aled Rees. Similarly, the echocardiogram and blood tests may pick up unsuspected abnormalities in which case you will again be given an opportunity to discuss these findings further with Dr Rees.
9. What are the potential benefits of taking part? There are unlikely to be any direct benefits for you but the study may provide us with important information in determining whether visceral fat could be important in the development of arterial disease and heart muscle dysfunction in women with PCOS. It may therefore be possible in future to use treatments which reduce visceral fat to prevent the development of arterial disease in patients with PCOS. 10. Will I be able to have the results of my tests? We will contact you if there are any unsuspected abnormalities in your test results and you will be given an opportunity to discuss these findings with Dr Aled Rees. If you wish to have all your test results (including normal results), we will be able to provide these for you on your request. 11. What if something goes wrong? This study is being indemnified by Cardiff University. If you are harmed by taking part in this research project, there are no special compensation arrangements. If you are harmed due to someone’s negligence, then you may have grounds for a legal action but you may have to pay for it. Regardless of this, if you wish to complain, or have any concerns about any aspect of the way you have been approached or treated during the course of this study, the normal National Health Service complaints mechanisms should be available to you. 12. Will my taking part in this study be kept confidential? All information which is collected about you during the course of the research will be kept strictly confidential. Any information about you which leaves the hospital will have your name and address removed so that you cannot be recognised from it. With

126
your permission your GP will be informed of your participation in this study. With your permission we may also look at sections of your medical notes which are relevant to the research study. 13. What will happen to the results of the research study? The results of the research study will be prepared for publication in appropriate medical journals together with presentation at medical conferences. Patients participating in the study will be able to obtain a copy of the results after they have been published in the relevant journal(s). Patients will not be identified in any report/publication. 14. Who is organising and funding the research? The study is being organised by Dr Aled Rees (the Principal Investigator) and Dr Rosie Hocking (Research Registrar) from the Centre for Endocrine and Diabetes Sciences at the University Hospital of Wales. Funding for the study is provided from funds within the Centre for Endocrine and Diabetes Sciences at the University Hospital of Wales. The doctors conducting the research are not being paid for including and looking after patients in the study. 15. Who has reviewed the study? The study has been reviewed by the Cardiff and Vale NHS Trust Research and Development Office and by the South Wales Research Ethics Committee. 16. Contact for further information Should you have any further queries regarding this research study, then please do not hesitate to contact me on 02920 742341. You can also contact me via e-mail on [email protected]. Or you can contact Dr Rosie Hocking by email [email protected] or on 02920748251 or 07866771280. Thank you for considering taking part in this study. Dr Aled Rees Senior Lecturer in Endocrinology You will be given a copy of this Patient Information Sheet and a signed consent form to keep

127
Appendix 2: Healthy Volunteer Recruitment Advert

128
Appendix 3: Healthy Volunteer with Higher BMI Recruitment Advert

129
Appendix 4
VISCERAL FAT AND VASCULAR RISK IN POLYCYSTIC OVARY SYNDROME
HEALTHY VOLUNTEER INFORMATION SHEET
(Version 4 March 2010)
1. Title of study Stratification of cardiometabolic risk in Polycystic Ovary Syndrome: is visceral fat a major player? 2. Introduction You are being invited to take part in a clinical research study. This study will also form part of a higher degree (MD) educational qualification. Before you decide whether you wish to become involved it is important that you understand why the research is being done and what it will involve. Please take time to read the following information carefully and discuss it with others if you wish. Please do not hesitate to ask us if there is anything that is not clear or if you would like more information. Take time to consider whether or not you would wish to take part. Thank you for reading this. 3. What is the purpose of this study? Polycystic ovary syndrome (PCOS) is the commonest hormone condition in women of reproductive age, affecting up to 10% of the premenopausal population. In addition to its well-recognised effects on weight gain, excessive hair growth and infertility, it is becoming increasingly clear that PCOS is associated with long-term health risks including diabetes and arterial (blood vessel) disease, both of which are related to impaired action of insulin throughout the body, also known as insulin resistance. There is increasing evidence that a major underlying cause of insulin resistance is a build up of a particular type of fat around the bowel called visceral fat. There have not been any studies on the relationship between visceral fat and arterial disease (or ‘stiffness’) or heart muscle function in young women with PCOS, but this may be an important area to study as research in middle-aged women with PCOS has shown that visceral fat is associated with increased ‘furring’ of the arteries in the neck, which is a marker for early heart disease. We aim to measure visceral fat area in women with PCOS and relate this to arterial stiffness and heart muscle function. In order for us to investigate this we need to see how normal healthy
130
individuals, like yourself, who don’t have PCOS, respond to the same tests to see if there is a difference with our study patients. This study will involve two visits to the Clinical Research Facility and the Welsh Heart Research Institute at the Heath hospital, each lasting 2-3 hours or one visit lasting 6 hours. 4. Why have I been chosen? You have been chosen for this study as you are healthy and similar in terms of age to the patients with PCOS. A total of 100 patients and 100 healthy volunteers will be studied. 5. Do I have to take part? It is up to you to decide whether or not to take part. If you decide to take part you will be given this information sheet to keep and be asked to sign a consent form. If you decide to take part you are still free to withdraw at any time and without giving a reason. 6. What will happen to me if I take part? The study will take place at the Clinical Research Facility and the Welsh Heart Research Institute at the University Hospital of Wales. You will be asked to attend in the morning having only had water to drink (i.e. no breakfast, tea or coffee) on 2 separate days. Each visit will last approximately 2-3 hours. If you are a smoker we request that you avoid smoking on each morning. We will firstly require you to have a pregnancy test before carrying out any measurements. We will then measure your weight, height, blood pressure, waist circumference, hip circumference and take a brief clinical history. We will take blood samples (approximately six tablespoons) to check levels of your hormones (testosterone, thyroid function, prolactin and 17-hydroxyprogesterone), ‘fat’ proteins (called adiponectin, PAI-1 and RBP-4), blood vessel proteins (called BNP, ICAM-1, VCAM-1 and TBARS) and to measure cholesterol, insulin, glucose and CRP (a marker of inflammation in the body). We will
also measure a urine sample for a substance called 8-epi-PGF2, which is a marker of cholesterol damage. Next we will measure the amount of visceral fat in your body by three techniques: the BIA (bioimpedance) method, DEXA and CT scanning. The BIA technique is a simple, rapid and non-invasive technique which is used routinely in clinical practice to measure a patient’s percentage body fat. It sends a very small electrical current through the body and measures the body’s resistance to this current to determine the amount of fat, muscle and water present. The amount of electrical current is so small that you will be unable to feel it. The DEXA scan is also a simple, rapid and non-invasive technique which is used routinely in clinical practice.

131
This scan does involve a very small dose of radiation, equivalent to what you would be exposed to simply by living in Cardiff for 1 days. A CT scan will then be performed. Unlike CT scans used in medical practice this will be a single image (or ‘slice’) only, taken at the level of your lower spine. This will give us enough information to measure the amount of visceral fat present, while minimising your exposure to radiation. The amount of radiation you will receive is very small and similar to what you would be exposed to simply by living in Cardiff for 1 week. We will then measure the stiffness of your blood vessels and your heart muscle function. The ‘arterial stiffness’ test will be performed using an item of equipment called a ‘Sphygmocor’ machine. This technique, which is completely painless and ‘non-invasive’, consists of a small pencil-like probe placed over the wrist, which measures the waveform of the pulse. Further measurements will be obtained over pulses in the neck (the carotid artery) and top of the leg (femoral artery). The ‘heart muscle’ test will be performed at the Welsh Heart Research Institute using a technique called echocardiography. This is a painless non-invasive ultrasound technique used routinely in clinical practice to give pictures of the heart muscle and chambers within the heart. It uses a very high frequency sound which cannot be heard, but can be emitted and detected by special machines. Also at the Welsh Heart Research Institute we will examine the main artery in the neck (the carotid artery) using a special ultrasound probe. This is also a painless, non-invasive technique. Finally we will ask you to attend the Clinical Research Facility on a second morning for an oral glucose tolerance test (OGTT). This will assess how good your body is at handling sugar (termed ‘insulin resistance’). We request that you attend in the morning having only had water to drink (i.e. no breakfast, tea or coffee). We will take a blood test from you (roughly one tablespoon) then we will ask you to take a drink containing a measured amount of glucose. Further blood samples (at 30, 60 and 90 minutes) will be taken during the test and a final test is taken at two hours. Each blood sample will be roughly one tablespoon. If you wish we will be able to reimburse any travelling expenses / car parking fees incurred while attending for the study visits. We will also give you a single payment of £50 to reimburse you for your time spent on the study. 7. What do I have to do? It is important that you take any regular medication in the normal way without altering the dose or timing of these. You should inform us of any dose adjustments. There are no lifestyle or dietary restrictions and you can continue your daily activities normally. We request that you report any illnesses to us as they may influence the timing of your test visit.
132
You should inform us if there is any possibility of you being pregnant and this will be tested for in all participants. If you are pregnant you will not be able to participate in this study. For the study visit, we ask that you attend the Clinical Research Facility at 8 o’clock in the morning having fasted from midnight the previous night. You can drink water freely up to this point. 8. What are the possible disadvantages and risks of taking part? Other than possible discomfort (temporary pain, swelling, bruising and rarely infection) caused by the collection of blood, no other side effects are anticipated from the study procedures, though as outlined above, a ‘single slice’ CT scan and DEXA scan do involve exposure to a small amount of radiation. In addition the CT scan could by chance pick up an unsuspected abnormality in your abdomen, in which case you will be given an opportunity to discuss these findings further with Dr Aled Rees. Similarly, the echocardiogram and blood tests may pick up unsuspected abnormalities in which case you will be given an opportunity to discuss these findings with Dr Rees. 9. What are the potential benefits of taking part? There are unlikely to be any direct benefits for you but the study may provide us with important information in determining whether visceral fat could be important in the development of arterial disease in women with PCOS. It may therefore be possible in future to use treatments which reduce visceral fat to prevent the development of arterial disease in patients with PCOS. 10. Will I be able to have the results of my tests? We will contact you if there are any unsuspected abnormalities in your test results and you will be given an opportunity to discuss these findings with Dr Aled Rees. If you wish to have all your test results (including normal results), we will be able to provide these for you on your request. 11. What if something goes wrong? This study is being indemnified by Cardiff University. If you are harmed by taking part in this research project, there are no special compensation arrangements. If you are harmed due to someone’s negligence, then you may have grounds for a legal action but you may have to pay for it. Regardless of this, if you wish to complain, or have any concerns about any aspect of the way you have been approached or treated during the course of this study, the normal National Health Service complaints mechanisms should be available to you.

133
12. Will my taking part in this study be kept confidential? All information which is collected about you during the course of the research will be kept strictly confidential. Any information about you which leaves the hospital will have your name and address removed so that you cannot be recognised from it. With your permission your GP will be informed of your participation in this study. With your permission we may also look at sections of your medical notes which are relevant to the research study. 13. What will happen to the results of the research study? The results of the research study will be prepared for publication in appropriate medical journals together with presentation at medical conferences. Patients participating in the study will be able to obtain a copy of the results after they have been published in the relevant journal(s). Patients will not be identified in any report/publication.
14. Who is organising and funding the research? The study is being organised by Dr Aled Rees (the Principal Investigator) and Dr Rosie Hocking (Research Registrar) from the Centre for Endocrine and Diabetes Sciences at the University Hospital of Wales. Funding for the study is provided from funds within the Centre for Endocrine and Diabetes Sciences at the University Hospital of Wales. The doctors conducting the research are not being paid for including and looking after patients in the study. 15. Who has reviewed the study? The study has been reviewed by the Cardiff and Vale NHS Trust Research and Development Office and by the South Wales Research Ethics Committee.
16. Contact for further information Should you have any further queries regarding this research study, then please do not hesitate to contact me on 02920 745002. You can also contact me via e-mail on [email protected] or Dr Rosie Hocking by email [email protected] or 07866771280. Thank you for considering taking part in this study.
Dr Aled Rees Senior Lecturer in Endocrinology You will be given a copy of this Information Sheet and a signed consent form to keep

134
Appendix 5
VISCERAL FAT AND VASCULAR RISK IN POLYCYSTIC OVARY SYNDROME
Patient Identification Number for this study:
PATIENT CONSENT FORM (Version 2, September 2008)
Title of Study: Stratification of cardiometabolic risk in Polycystic Ovary Syndrome: is visceral fat a major player?
Name of Researchers: Dr Aled Rees, Dr Rosie Hocking
Please initial box 1. I confirm that I have read and understood the information sheet dated
September 2008 (version 2) for the above study and have had the opportunity to ask questions.
2. I understand that my participation is voluntary and that I am free to
withdraw at any time, without giving any reason, without my medical care or legal rights being affected.
3. I understand that sections of my medical notes may be looked at by
responsible individuals from regulatory authorities where it is relevant to my taking part in research. I give permission for these individuals to have access to my records.
4. I consent to my GP being informed of my participation in the Study. 5. I consent to a pregnancy test. 6. I agree to take part in the above study. __________________________ _____________ ____________ Name of patient Date Signature _________________________ _____________ _____________ Researcher Date Signature _______________________ _____________ ______________ Name of person taking consent Date Signature (if different from researcher)
1 copy for patient; 1 for researcher; 1 to be kept with hospital notes

135
Appendix 6
VISCERAL FAT AND VASCULAR RISK IN POLYCYSTIC OVARY SYNDROME Subject Identification Number for this study:
HEALTHY VOLUNTEER CONSENT FORM (Version 4 March 2010)
Title of Study: Stratification of cardiometabolic risk in Polycystic Ovary Syndrome: is visceral fat a major player?
Name of Researchers: Dr Aled Rees, Dr Rosie Hocking
Please initial box 1. I confirm that I have read and understood the information sheet dated
March 2010(version 4) for the above study and have had the opportunity to ask questions.
2. I understand that my participation is voluntary and that I am free to
withdraw at any time, without giving any reason, without my medical care or legal rights being affected.
3. I understand that sections of my medical notes may be looked at by
responsible individuals from regulatory authorities where it is relevant to my taking part in research. I give permission for these individuals to have access to my records.
4. I consent to my GP being informed of my participation in the Study. 5. I consent to a pregnancy test. 6. I agree to take part in the above study. __________________________ _____________ ____________________ Name of volunteer Date Signature __________________________ _____________ ____________________ Researcher Date Signature __________________________ _____________ ______________ Name of person taking consent Date Signature (if different from researcher)
1 copy for patient; 1 for researcher; 1 to be kept with hospital notes

Subject Number:
136
VISCERAL FAT AND VASCULAR RISK IN PCOS: CASE REPORT FORM FOR PATIENTS
Patient Details Enrolment Number ………………………………………………………………….. Age …………………………………………………………………. Date of Visit …………………………………………………………………..
Inclusion Criteria Diagnosis of PCOS (2 out of 3)
[ ] Ovulatory dysfunction (<6 cycles year) [ ] Androgen excess (clinical or biochemical) [ ] Polycystic ovaries on ultrasound [ ] Age 16-45
Exclusion Criteria
[ ] Pregnancy [ ] CAH [ ] Breastfeeding [ ] Cushings [ ] Hypertension [ ] Hyperprolactinaemia [ ] Diabetes [ ] Thyroid disease [ ] Glucocorticoids (current/last 3 mnth) [ ] Androgen secreting tumour [ ] Lipid lowering agents (current/last 3 mnth) [ ] Glucocorticoid resistance [ ] Antihypertensives (current/last 3 mnth) [ ] Antidiabetic agents (current/last 3 mnth) [ ] Antiobesity agents (current/last 3 mnth)
Consent [ ] Discuss Information Sheet and obtain informed consent
Pregnancy Test
[ ] Negative [ ] Positive Batch No…………… Expiry Date………………… Performed by……………. Witnessed by…………………….

Subject Number:
137
Medical History ……………………………………………………………………………………………
……………………………………………………………………………………………
…………………………………………………………………………………………..
Smoking Status Nonsmoker Y/N Exsmoker (details)…………………………….
Smoker (details)……………………………….
Drug History
Drug......................................................................................................................
Dose......................................................................................................................
Duration.................................................................................................................
Allergies………………………………………………………………………………….
Contraception…………………………………………………………………………...
Family History
……………………………………………………………………………………………
……………………………………………………………………………………………
……………………………………………………………………………………………
Menstrual History
Age at Menarche……………………………………………………………………...
Eumenorrhoeic cycle length…………………… Day no………………….
Oligomenorrhoeic LMP…………………………………………………………….
Amenorrhoeic LMP…………………………………………………………….
______________________________________________________________
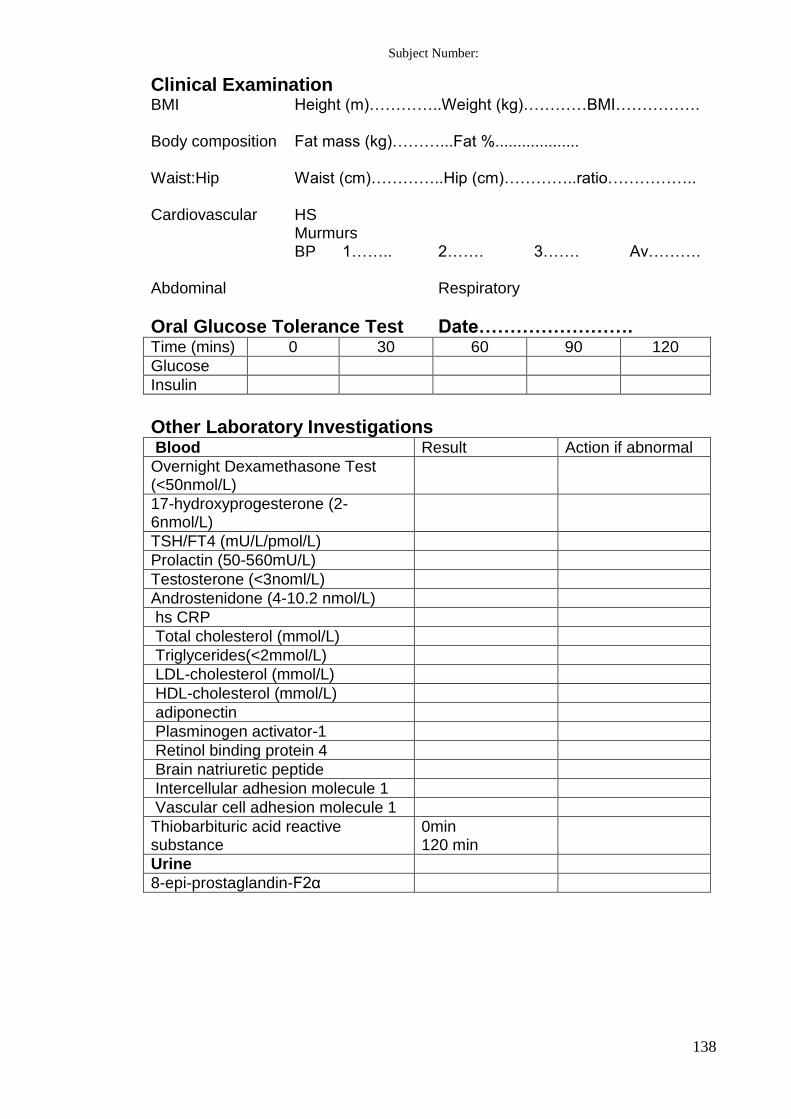
Subject Number:
138
Clinical Examination BMI Height (m)…………..Weight (kg)…………BMI……………. Body composition Fat mass (kg)………...Fat %................... Waist:Hip Waist (cm)…………..Hip (cm)…………..ratio…………….. Cardiovascular HS Murmurs BP 1…….. 2……. 3……. Av………. Abdominal Respiratory
Oral Glucose Tolerance Test Date……………………. Time (mins) 0 30 60 90 120
Glucose
Insulin
Other Laboratory Investigations Blood Result Action if abnormal
Overnight Dexamethasone Test (<50nmol/L)
17-hydroxyprogesterone (2-6nmol/L)
TSH/FT4 (mU/L/pmol/L)
Prolactin (50-560mU/L)
Testosterone (<3noml/L)
Androstenidone (4-10.2 nmol/L)
hs CRP
Total cholesterol (mmol/L)
Triglycerides(<2mmol/L)
LDL-cholesterol (mmol/L)
HDL-cholesterol (mmol/L)
adiponectin
Plasminogen activator-1
Retinol binding protein 4
Brain natriuretic peptide
Intercellular adhesion molecule 1
Vascular cell adhesion molecule 1
Thiobarbituric acid reactive substance
0min 120 min
Urine
8-epi-prostaglandin-F2α

Subject Number:
139
Medical Physics Department CT Abdomen Date………………………………. Total fat Subcutaneous fat Visceral fat
DEXA scan Date…………………………………..
Absolute total body fat (kg)
Relative total body fat (%)
Absolute total lean mass (kg)
Relative total lean mass (%)
Absolute total abdominal fat (kg)
Relative total abdominal fat (%)
_____________________________________________________

Subject Number:
140
Welsh Heart Research Institute Date………………….. Augmentation Index and Pulse Wave Velocity
Distance Blood Pressure SSN to carotid pulse………………..mm A………………………..mmHg SSN to radial pulse…………………mm B………………………..mmHg C………………………..mmHg SSN to femoral pulse………………mm Average……………….mmHg
Augmentation Index
A B Average
Augmentation Index (%)
Central aortic pressure (mmHg)
Time to return of reflected wave Tr (ms)
Heart Rate (bpm)
Pulse Wave Velocity
A B Average
Carotid-radial (m/s)
Carotid-femoral (m/s)
______________________________________________________________

Subject Number:
141
Carotid Intima
mm mm
Right carotid
Left carotid
Wave intensity
Echocardiogram
Systolic fn – long axis fn
Diastolic fn – e’
Diastolic fn – a’
Diastolic fn – e’:a’ ratio
______________________________________________________________

Subject Number:
142
End of Study Study completed: Yes [ ] Date……………………… No [ ] Date………………………. If No, reason study not completed [ ] subject withdrawal of consent [ ] Other………………………...... ……………………………………………………………………………………………………………………………………………………………………………………
Adverse Events ………………………………………………………………………………………………………………………………………………………………………………………………………………………………………………………………………………………………………………………………………………………………………………………………………………………………………………………………………………………………………………………………………………………………. ____________________________________________________________

Subject Number:
143
VISCERAL FAT AND VASCULAR RISK IN PCOS: CASE REPORT FORM FOR HEALTHY VOLUNTEERS
Version 1 Oct 2008
Volunteer Details Enrolment Number ………………………………………………………………….. Age ………………………………………………………………….. Date of Visit …………………………………………………………………..
Inclusion Criteria [ ] Age 16-45 [ ] Regular menstruation (27-32 days)
Exclusion Criteria
[ ] Pregnancy [ ] Family history of PCOS [ ] Breastfeeding [ ] Hirsutism [ ] Glucocorticoids (current/last 3 mnth) [ ] Hypertension [ ] Lipid lowering agents (current/last 3 mnth) [ ] Diabetes [ ] Antihypertensives (current/last 3 mnth) [ ] Antidiabetic agents (current/last 3 mnth) [ ] Antiobesity agents (current/last 3 mnth)
Consent [ ] Discuss Information Sheet and obtain informed Consent
Pregnancy Test
[ ] Negative [ ] Positive Batch No:………… Expiry Date………… Performed by…………………………… Witnessed by………………………… _____________________________________________________________

Subject Number:
144
Medical History ……………………………………………………………………………………………
……………………………………………………………………………………………
…………………………………………………………………………………………..
Smoking Status Nonsmoker Y/N Exsmoker (details)…………………………….
Smoker (details)……………………………….
Drug History
Drug....................................................................................................................
Dose....................................................................................................................
Duration..............................................................................................................
Allergies………………………………………………………………………………..
Contraception………..………………………………………………………………...
Family History
……………………………………………………………………………………………
……………………………………………………………………………………………
……………………………………………………………………………………
Menstrual History
Age at Menarche……………………………………………………………………...
Eumenorrhoeic cycle length…………………… Day no………………….
Oligomenorrhoeic LMP…………………………………………………………….
Amenorrhoeic LMP…………………………………………………………….
______________________________________________________________
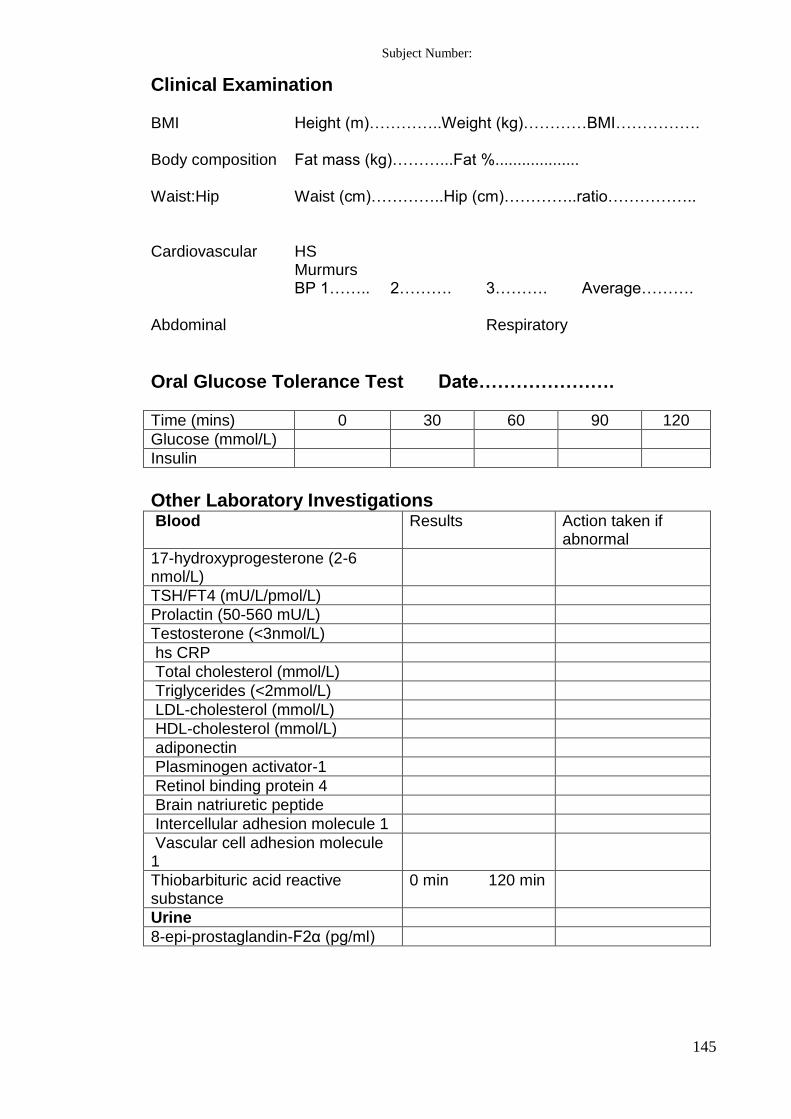
Subject Number:
145
Clinical Examination BMI Height (m)…………..Weight (kg)…………BMI……………. Body composition Fat mass (kg)………...Fat %................... Waist:Hip Waist (cm)…………..Hip (cm)…………..ratio…………….. Cardiovascular HS Murmurs BP 1…….. 2………. 3………. Average………. Abdominal Respiratory
Oral Glucose Tolerance Test Date………………….
Time (mins) 0 30 60 90 120
Glucose (mmol/L)
Insulin
Other Laboratory Investigations Blood Results Action taken if
abnormal
17-hydroxyprogesterone (2-6 nmol/L)
TSH/FT4 (mU/L/pmol/L)
Prolactin (50-560 mU/L)
Testosterone (<3nmol/L)
hs CRP
Total cholesterol (mmol/L)
Triglycerides (<2mmol/L)
LDL-cholesterol (mmol/L)
HDL-cholesterol (mmol/L)
adiponectin
Plasminogen activator-1
Retinol binding protein 4
Brain natriuretic peptide
Intercellular adhesion molecule 1
Vascular cell adhesion molecule 1
Thiobarbituric acid reactive substance
0 min 120 min
Urine
8-epi-prostaglandin-F2α (pg/ml)

Subject Number:
146
Medical Physics Department, UHW CT Abdomen Date………………….. Total Fat Subcutaneous fat Visceral fat
DEXA scan Date…………………
Absolute total body fat (kg)
Relative total body fat (%)
Absolute total lean mass (kg)
Relative total lean mass (%)
Absolute total abdominal fat (kg)
Relative total abdominal fat (%)
____________________________________________________

Subject Number:
147
Welsh Heart Research Institute Date……………………………. Augmentation Index and Pulse Wave Velocity Distance Blood Pressure SSN to carotid pulse………………..mm A………………………..mmHg SSN to radial pulse…………………mm B………………………..mmHg SSN to femoral pulse………………mm Average……………….mmHg
Augmentation Index
A B Average
Augmentation Index (%)
Central aortic pressure (mmHg)
Tr (ms)
Heart Rate (bpm)
Pulse Wave Velocity
A B Average
Carotid-radial (m/s)
Carotid-femoral (m/s)
___________________________________________________

Subject Number:
148
Carotid Intima
mm mm
Right Carotid
Left Carotid
Wave Intensity
Echocardiogram
Systolic fn – long axis fn
Diastolic fn – e’
Diastolic fn – a’
Diastolic fn – e’:a’ ratio
_____________________________________________________

Subject Number:
149
End of Study Study completed: Yes [ ] date…………………….. No [ ] date…………………….. If No, reason study not completed [ ] patient withdrawal of consent [ ] other……………………………… ……………………………………………………………………………………………………………………………………………………………………………………
Adverse Events ………………………………………………………………………………………………………………………………………………………………………………………………………………………………………………………………………………………………………………………………………………………………………………………………………………………………………………………………………………………………………………………………………………………………. _____________________________________________________________

150
References
1. Azziz R, Dumesic DA, Goodarzi MO. Polycystic Ovary Syndrome: an ancient
disorder? Fertil Steril 2011; 95: 1544-1548
2. Archard Ch, Thiers J. Le virilisme pilaire et son association a l’insuffusance
glycolytique (Diabète des femmes à barbe). Bull Acad Nat Med 1921; 86: 51-66
3. Jeffcoate W, Kong MF. Diabete des femmes a barbe: a classic paper reread. Lancet
2000; 356: 1183-1185
4. Stein IF, Leventhal ML. Amenorrhea Associated with Bilateral Polycystic Ovaries.
Am J Obstet Gynecol 1935; 29: 181-191
5. Zawadzki JK, Dunaif A. Diagnostic criteria for polycystic ovary syndrome: towards
a rational approach. In Dunaif A, Givens JR, Haseltine FP, Merriam GR (eds.)
Polycystic Ovary Syndrome. Boston. Blackwell Scientific Publications 1992: 377-
384
6. The Rotterdam ESHRE/ASRM-sponsored PCOS consensus workshop group.
Revised 2003 consensus on diagnostic criteria and long-term health risks related to
polycystic ovary syndrome (PCOS). Human Reproduction 2004; 19: 41-47
7. Azziz R, Carmina E, Dewailly D, Diamanti-Kandarakis E, Escobar-Morreale HF,
Futterweit W, et al. Position Statement: criteria for defining polycystic ovary
syndrome as a predominantly hyperandrogenic syndrome: an Androgen Excess
Society Guideline. J Clin Endocrinol Metab 2006; 91:4237-45
8. Legro RS, Arslanian SA, Ehrmann DA, Hoeger KM, Murad MH, Pasquali R, Welt
CK. Diagnosis and treatment of Polycystic Ovary Syndrome: An Endocrine Society
Clinical Practice Guideline. Journal of Clinical Endocrinology and Metabolism
2013; 98: 4565-4592

151
9. Dewailly D, Gronier H, Poncelet E, Robin G, Leroy M, Pigny P, Duhamel A,
Catteau-Jonard S. Diagnosis of polycystic ovary syndrome (PCOS): revisiting the
threshold values of follicle count on ultrasound and of the serum AMH level for the
definition of polycystic ovaries. Human Reproduction 2011; 26:3123-3129
10. Eilertsen TB, Vanky E, Cohen SM. Anti-Mullerian Hormone in the diagnosis of
polycystic ovary syndrome: can morphologic description be replaced? Human
Reproduction 2012; 27:2494-2502
11. Rosenfield RL, Wroblewski K, Padmanabhan V, Littlejohn E, Mortensen M,
Ehrmann DA. Antimullerian hormone levels are independently related to ovarian
hyperandrogenism and polycystic ovaries. Fertil Steril 2012; 98:242-249
12. Waldstreicher J, Santoro NF, Hall HJE, Filicori M, Crowley WF. Hyperfunction of
the hypothalamic-pituitary axis in women with polycystic ovarian disease: Indirect
evidence of partial gonadotroph desensitisation. J Clin Endocrinol Metab 1988;
66:165-172
13. Rosenfield RL. Ovarian and adrenal function in polycystic ovary syndrome.
Endocrinol Metab Clin North Am 1999; 28:265-293
14. Pastor CL, Griffin-Korf ML, Aloi JA, Evans WS, Marshall JC. Polycystic Ovary
syndrome: evidence for reduced sensitivity of the gonadotropin-releasing hormone
pulse generator to inhibition by estradiol and progesterone. J Clin Endocrinol Metab
1998; 83:582-590
15. Eagleson CA, Gingrich M, Pastor C, et al. Polycystic Ovarian Syndrome: evidence
that flutamide restores sensitivity of the GnRH puse generator to inhibition by
estradiol and progesterone. J Clin Endocrinol Metab 2000; 85:

152
16. Gilling-Smith C, Willis DS, Beard RW, Franks S. Hypersecretion of
androstenedione by isolated theca cells from polycystic ovaries. J Clin Endocrinol
Metab 1994; 79:1158-1165
17. Nelson VL, Legro RS, Strauss JF III, McAllister JM. Augmented androgen
production is a stable steroidogenic phenotype of propagated theca cells from
polycystic ovaries. J Clin Endocrinol Metab 1999; 13:946-957
18. Kahn CR. The molecular mechanisms of insulin action. Annu Rev Med 1985;
36:429-451
19. Burghen GA, Givens JR, Kitabchi AE. Correlation of hyperandrogenism with
hyperinsulinism in polycystic ovarian disease. J Clin Endocrinol Metab 1980;
50:113-116
20. Rice S, Christoforidis N, Gadd C, Nikolaou D, Seyani L, Donaldson A, Margara R,
Hardy K, Franks S. Impaired insulin–dependent glucose metabolism in granuolsa-
lutein cells from anovulatory women with polycystic ovaries. Human Reproduction
2005; 20:373-381
21. Nestler JE, Jakubowicz DJ, de Vargas AF, Brik C, Quintero N, Medina F. Insulin
stimulates testosterone biosynthesis by human thecal cells from women with
polycystic ovary syndrome by activating its own receptor and using inositoglycan
medicators as the signal transduction system. J Clin Enodcrinol Metab 1998;
83:2001-2005
22. Nestler JE, Strauss 3rd
JF. Insulin as an effector of human ovarian and adrenal
steroid metabolism. Endocrinol Metab Clin North Am 1991; 20:807-823
23. Nestler JE, Powers LP, Matt DW, Steingold KA, Plymate SR, Rittmaster RS, Clore
JN, Blackard WG. A direct effect of hyperinsulinaemia on serum sex hormone-

153
binding globulin levels in obese women with polycystic ovary syndrome. J Clin
Endocrinol Metab 1991; 72:83-89
24. Adashi EY, Hsueh AJ, Yen SS. Insulin enhancement of leutinising hormone and
follicle-stimulating hormone release by cultured pituitary cells. Endocrinology
1981; 1081441-149
25. Goy RW, Robinson JA Prenatal exposure of rhesus monkeys to patent androgens:
morphological, behavioural, and physiological consequences. Banbury Rep 1982;
11:355-378
26. Abbott DH, Tarantal AF, Dumesic DA. Fetal, infant, adolescent and adult
phenotypes of polycystic ovary syndrome in prenatally androgenised female rhesus
monkeys. Am J Primatol 2009; 71:776-784
27. Hickey M, Sloboda DM, Atkinson HC, Doherty DA, Franks S, Norman RJ,
Newnham JP, Hart R. The relationship between maternal and umbilical cord
androgen levels and ovarian function in adolescence: a prospective cohort study. J
Clin Endocrinol Metab 2009; 94:3714-3720
28. Zegher F, Ibanez L. Early origins of Polycystic Ovary Syndrome: Hypotheses May
Change Without Notice. J Clin Endocrinol Metab 2009; 94:3682-3685
29. Ibanez L, Potau N, Francois I, de Zegher F. Precocious pubarche, hyperinsulinism
and ovarian hyperandrogenism in girls: relation to reduced fetal growth. J Clin
Endocrinol Metab 1998 83:3558-3562
30. Ibanez L, Lopez-Bermejo A, Diaz M, Marcos MV, de Zegher F. Early metformin
therapy in girls with precocious pubarche to reduce hirsutism, androgen excess and
oligomenorrhoea in adolescence. J Clin Endocrinol Metab 2011; 96:1262-1267
31. Virtue S, Vidal-Puig A. It’s not how fat you are, it’s what you do with it that
counts. PLoS Bio 2008; 6:e237

154
32. De Zegher F, Lopez-Bermejo A, Ibanez L. Adipose tissue expandability and the
early origins of polycystic ovarian syndrome. Trends Endocrinol Metab 2009;
20:418-423
33. Azziz R, Kashar-Miller MD. Family History as a risk factor for the polycystic ovary
syndrome. J Paediatr Endocrinol Metab 2000; 13:1303-1306
34. Kashar-Miller MD, Nixon C, Boots LR, Go RC, Azziz R. Prevalence of polycystic
ovary syndrome (PCOS) in first degree relatives of patients with PCOS. Fertil Steril
2001; 75:53-58
35. Vink JM, Sadrzadeh S, Lambalk CB, Boomsma DI. Heretability of polycystic ovary
syndrome in a Dutch twin family study. J Clin Endocrinol Metab 2006; 91:2100-
2104
36. Barber TM, Franks S. Genetics of Polycystic Ovary Syndrome. Front Horm Res
2013; 40:28-39
37. Chen ZJ, Zhao H, HE L, Shi Y, Qin Y, Shi Y, Li Z, You L, Zhap J, Liu J, Liang X,
Zhao X, Zhao J, Sun Y, Zhang B, Jiang H, Zhao D, Bian Y, Gao X, Geng L, Li Y,
Zhu D, Sun X, Xu JE, Hao C, Ren CE, Zhang Y, Chen S, Zhang W, Yang A, Yan J,
Li Y, Ma J, Zhao Y. Genome-wide association study identifies susceptibility loci for
polycystic ovary syndrome on chromosomes 2p 16.3, 2p21 and 9q33.3. Nature
Genetics 2011; 43:55-59
38. Goodarzi MO, Jones MR, Li X, Chuia A, Garcia O, Chen Y, Krauss RM, Rotter JI,
Ankener W, Legro R, Azziz R, Strauss JF III, Dunaif A, Urbanek M. Replication of
Association of DENND1A and THADA variants with polycystic ovary syndrome in
European cohorts. Journal of Medical Genetics 2012; 49:90-95

155
39. McAllister JM, Modi B, Miller BA, Biegler J, Bruggeman R, Legro RS, Strauss JF
III. Overexpression of a DENND1A isoform produces a polycystic ovary syndrome
theca phenotype. Proc Natl Acad Sci USA 2014; 15:1519-15927
40. Zeggini E, Scott LJ, Saxena R, Voight BF, Marchini JL, Hu T, de Bakker Pl,
Abecasis GR, Almgren P, Anderson G et al. Meta-analysis of genome-wide
association data and large scale replication identifies additional susceptibility loci for
type 2 diabetes. Nature Genetics 2008; 40:638-645
41. Wojciechowski P, Lipowska A, Rys P, Ewens KG, Franks S, Tan S, Lerchbaum E,
Vcelak J, Attaoua R, Straczkowski M, Azziz R, Barber TM, Hinney A, Obermayer-
Pietsch B, Lukasova P, Bendlova B, Grigorescu F, Kowalska I, Goodarzi MO,
GIANT consortium, Strauss JF III, McCarthy MI, Malecki MT. Impact of FTO
genotypes on BMI and weight in polycystic ovary syndrome: a systematic review
and meta-analysis. Diabetologia 2012; 55:2636-2645
42. Li T, Wu K, Xing X, Wang P, Cui L, Liu H, Cui Y, Bian Y, Ning Y, Zhao H, Tang
R, Chen ZJ. Common variant rs9939609 in gene FTO confers risk to polycystic
ovary syndrome. PLoS One 2013; 8:e66250
43. Cui L, Zhao H, Zhang B, Qu Z, Liu J, Laing X, Zhao X, Zhao J, Sun Y, Wang P, Li
T, Shia Y, Chen Z-J. Genotype-phenotype correlations of PCOS susceptibility SNPs
identified by GWAS in a large cohort of Han Chinese women. Human Reproduction
2013; 28:538-544
44. Knochenhauer ES, Key TJ, Kashar-miller M, Waggoner W, Boots LR and Azziz R.
Prevalence of the Polycystic Ovary Syndrome in unselected Black and White women
of the Southeastern United States: A prospective study. J Clin Endocrinol Metab
1998; 83:3078-3082

156
45. Azziz R, Woods KS, Reyna R, Key TJ, Knochenhauer ES, Yildiz BO. The
prevalence and features of the Polycystic Ovary Syndrome in an unselected
population. J Clin Endocrinol Metab 2004; 89:2745-2749
46. Asuncion M, Calvo RM, San Millan JL, Sancho J, Avila S, Escobar-Morreale HF. A
prospective study of the prevalence of the polycystic ovary syndrome in unselected
Caucasian women from Spain. J Clin Endocrinol Metab 2000; 85:2434-2438
47. Diamanti-Kandarakis E, Kouli CR, Bergiele AT, Filandra FA, Tsianateli TC, Spina
GG, Zapanti ED, Bartzis MI. A survey of the Polycystic Ovary Syndrome in the
Greek Island of Lesbos: Hormonal and Metabolic Profile. J Clin Endocrinol Metab
1999; 84: 4006-4011
48. Michelmore KF, Balen AH, Dunger DB, Vessey MP. Polycystic ovaries and
associated clinical and biochemical features in young women. Clin Endocrinol 1999;
51:779-786
49. Alvarez-Blasco F, Botella-Carretero JI, San Millan JL, Escobar-Morreale HF.
Prevalence and characteristics of the Polycystic Ovary Syndrome in overweight and
obese women. Arch Inter Med 2006; 166:2081-2086
50. March WA, Moore VM, Willson KJ, Phillips DIW, Norman RJ, Davies MJ. The
prevalence of polycystic ovary syndrome in a community sample assessed under
contrasting diagnostic criteria. Hum Reprod 2010; 25: 544-551
51. Tehrani FR, Simbar M, Tohidi M, Hosseinpanah F, Aziz F. The prevalence of
polycystic ovary syndrome in a community sample of Iranian population: Iranian
PCOS prevalence study. Reproductive Biology and Endocrinology 2011; 9:39-39
52. Yildiz BO, Bozdag G, Yapici Z, Esinler I, Yarali H. Prevalence, phenotype and
cardiometabolic risk of polycystic ovary syndrome under different diagnostic
criteria. Hum Reprod 2012; 27:3067-3073

157
53. Okoroh EM, Hooper C, Atrash HK, Yusuf HR, Boulet SL. Prevalence of polycystic
ovary syndrome among the privately insured, United States, 2003-2008. Am J of
Obstet and Gynaecol 2012, 207:299.e1-7
54. Balen A, Conway G, Kaltsas G, Techastraisak K, Manning P, West C, Jacobs S.
Polycystic Ovary Syndrome: the spectrum of the disorder in 1741 patients. 1995
Human Reproduction 10:2107-2111
55. Kjerulff LE, Sanchez-Ramos L, Duffy D. Pregnancy outcomes in women with
polycystic ovary syndrome: a meta-analysis. Am J Obstet Gynecol. 2011 Jun
204(6):558.e1-6
56. Lim SS, Davies MJ, Norman RJ, Moran LJ. Overweight, obesity and central obesity
in women with polycystic ovary syndrome: a systematic review and meta-analysis.
Human Reproduction Update 2012 18:618-637
57. Diamanti-Kandarakis E, Dunaif A. Insulin Resistance and the Polycystic Ovary
Syndrome Revisited: An update on mechanisms and implications. Endocrine
Reviews 2012 33:981-1030
58. Dunaif A. Segal KR, Futterweit W, Dobrjansky A. Profound peripheral insulin
resistance, independent of obesity, in polycystic ovary syndrome. Diabetes 1989
38:1165-1174
59. Legro RS, Kunselman AR, Dunaif A. Prevalence and predictors of dyslipidaemia in
women with polycystic ovary syndrome. Am J Med 2001 111:607-613
60. Wild RA, Rizzo M, Clifton S, Carmina E. Lipid levels in polycystic Ovary
syndrome: systematic review and meta-analysis. Fertility and Sterility 2011
95:1073-1079
61. Dahlgren E, Janson PO, Johansson S, Lapidus L, Oden A. Polycystic Ovary
Syndrome and risk for myocardial infarction. Evaluated from a risk factor model

158
based on a prospective population study of women. Acta Obstet Gynecol Scand
1992, 71599-604
62. Luque-Ramirez M, Alvarez-Blasco F, Mendieta-Azcona C, Botella-Carretero JL,
Escobar-Morreale HF. Obesity is the major determinant of the abnormalities in
blood pressure found in young women with the polycystic ovary syndrome. J Clin
Endocrinol Metab 2007 92:2141-2148
63. Moran LJ, Misso ML, Wild RA, Norman RJ. Impaired glucose tolerance, type 2
diabetes and the metabolic syndrome in polycystic ovary syndrome: a systematic
review and meta-analysis. Human Reproduction Update 2010 16:347-363
64. Vgontzas AN, Legro RS, Bixler EO, Grayev A, Kales A, Chrousos GP. Polycystic
ovary syndrome is associated with obstructive sleep apnoea and daytime sleepiness:
role of insulin resistance. J Clin Endocrinol Metab 2001 86:517-520
65. Vassilatou E. Non-alcoholic fatty liver disease and polycystic ovary syndrome.
World J Gastroenterol 2014 20: 8351-8363
66. Barry JA, Azizia MM, Hardiman PJ. Risk of endometrial, ovarian and breast cancer
in women with polycystic ovary syndrome: a systematic review and meta-analysis.
Hum Reprod Update 2014 20:748-758
67. Morgan CL, Jenkins-Jones S, Currie CJ, Rees DA. Evaluation of Adverse Outcomes
in Young Women with Polycystic Ovary Syndrome versus Matched, Reference
Controls: A Retrospective, Observational Study. J Clin Endocrinol Metab 2012,
97(9): 3251-3260
68. Pierpoint T, McKeigue PM, Isaacs AJ, Wild SH, Jacobs HS. Mortality of women
with Polycystic Ovary Syndrome at long-term follow-up. J Clin Epidemiol 1998,
51(7): 581-586

159
69. Wild S, Pierpoint T, McKeigue P, Jacobs H. Cardiovascular disease in women with
polycystic ovary syndrome at long-term follow-up: a retrospective cohort study.
Clin Endo 2000, 52:595-600
70. Solomon CG, Hu FB, Dunaif A, Rich-Edwards JE, Stampfer MJ, Willett WC,
Speizer FE, Manson JE. Menstrual Cycle Irregularity and Risk for Future
Cardiovascular Disease. J Clin Endocrinol Metab 2002, 87:2013-2017
71. Wang ET, Cirillo PM, Vittinghoff E, Bibbins-Domingo K, Cohn BA, Cedars MI.
Menstrual Irregularity and Cardiovascular Mortality. J Clin Endocrinol Metab 2011,
96(1): E114-118
72. Shaw LJ, Merz CNB, Azziz R, Stanczyk FZ, Sopko G, Braunstein GD, Kelsey SF,
Kip KE, Cooper-DeHoff RM, Johnson BD, Vaccarino V, Reis SE, Bittner V,
Hodgson TK, Rogers W, Pepine CJ. Postmenopausal Women with a History of
Irregular Menses and Elevated Androgen Measurements at High Risk for Worsening
Cardiovascular Event-Free Survival: results from the National Institutes of Health-
National Heart, Lung and Blood Institute Sponsored Women’s Ischemia Syndrome
Evaluation. J Clin Endocrinol Metab 2008, 93(4): 1276-1284
73. De Groot PCM, Dekkers OM, Romijn JA, Dieben SWM, Helmerhorst FM. PCOS,
coronary heart disease, stroke and the influence of obesity: a systematic review and
meta-analysis. Human Reprod Update 2011, 17(4) 495-500
74. Schmidt J, Landin-Wilhelmsen K, Brannstrom M, Dahlgren E. Cardiovascular
Disease and Risk Factors in PCOS Women of Postmenopausal Age: A 21 year
Controlled Follow-Up Study. J Clin Endocrinol Metab 2011, 96(12):3794-3803
75. Ehrmann DA, Barnes RB, Rosenfield RL, Cavaghan MK, Imperial J (1999)
Prevalence of Impaired Glucose Tolerance and Diabetes in Women with Polycystic
Ovary Syndrome. Diabetes Care 22:141-146

160
76. Legro RS, Kunselman AR, Dodson WC, Dunaif A (1999) Prevalence and Predictors
of risk for Type 2 Diabetes Mellitus and Impaired Glucose Tolerance in Polycystic
Ovary Syndrome: A Prospective, Controlled Study in 254 Affected Women. J Clin
Endocrinol Metab 84: 165-169
77. Palmert MR, Gordon CM, Kartashov AI, Legro RS, Emans SJ, Dunaif A (2002)
Screening for Abnormal Glucose Tolerance in Adolescents with Polycystic Ovary
Syndrome. J Clin Endocrinol Metab 87:1017-1023
78. Ehrmann DA, Kasza K, Azziz R, Legro RS, Ghazzi MN (2005) Effects of Race and
Family History of Type 2 Diabetes on Metabolic Status of Women with Polycystic
Ovary Syndrome. J Clin Endocrinol Metab 90:66-71
79. Trolle B, Lauszus FF (2005) Risk factors for glucose intolerance in Danish women
with polycystic ovary syndrome. Acta Obstet Gynacol Scand 84:1192-1196
80. Chen X, Yang D, Li L, Feng S, Wang L (2006) Abnormal glucose tolerance in
Chinese women with polycystic ovary syndrome. Human Reproduction 21:2027-
2032
81. Vrbikova J, Dvorakova K, Grimmichova T, Hill M, Stanicka S, Cibula D, Bendlova
B, Starks L, Vondra K. (2007) Prevalence of insulin resistance and prediction of
glucose intolerance and type 2 diabetes mellitus in women with polycystic ovary
syndrome. Clin Chem Lab Med 45: 639-44
82. Weerakiet S, Tingthanatikul Y, Boonnag P, Wansumrith S, Rattansairi S,
Leelaphiwat S (2007) Can adiponectin predict abnormal glucose tolerance in Thai
women with polycystic ovary syndrome? J Obstet Gynaecol Res 1:55-61
83. Ovalle F, Azziz R. 2002 Insulin Resistance, polycystic ovary syndrome and Type 2
Diabetes. Fertility and Sterility 77:1095-1105

161
84. Stepto NK, Cassar S, Joham AE, Hutchinson SK, Harrison CL, Goldstein RF, Teede
HJ. 2013 Women with polycystic ovary syndrome have intrinsic insulin resistance
on euglycaemic-hyperinsulinaemic clamp. Human Reproduction 28:777-784
85. Moghetti P, Tosi F, Bonin C, Di Sarra D, Fiers T, Kaufman JM, Giagulli VA,
Signori C, Zambotti F, Dall’Alda M, Spiazzi G, Zanolin ME, Bonora E. Divergences
in insulin resistance between the different phenotypes of the polycystic ovary
syndrome. 2013 J Clin Endocrinol Metab 98:E628-37
86. Virkamaki A, Ueki K, Khan CR. Protein-protein interaction in insulin signalling and
the molecular mechanisms of insulin resistance. J Clin Invest 1999 103:931-943
87. Saltiel AR, Khan CR. Insulin signalling and the regulation of glucose and lipid
metabolism. Nature 2001 414:799-806
88. Dunaif A, Segal KR, Shelley DR, Green G, Dobrjansky A, Licholai T. Evidence for
distinctive and intrinsic defects in insulin action in polycystic ovary syndrome.
Diabetes 1992 41:1257-1266
89. Ciaraldi TP, El-Roeiy A, Madar Z, Reichart D, Olefsky JM, Yen SS. Cellular
mechanisms of insulin resistance in polycystic ovarian syndrome. J Clin Endocrinol
Metab 1992 75:577-583
90. Dunaif A, Xia J, Brook CB, Schenker E, Tang Z. Excessive insulin receptor serine
phosphorylation in cultured fibroblasts and in skeletal muscle. J Clin Invest 1995
96:801-810
91. Dunaif A, Wu X, Lee A, Diamanti-Kandarakis E. Defects in insulin receptor
signalling in vivo in the polycystic ovary syndrome. Am J Physiol Endocrinol
Metab 2001 281:E392-E399

162
92. Rosenbaum D, Haber RS, Dunaif A. Insulin resistance in polycystic ovary
syndrome: decreased expression of GLUT-4 glucose transporters in adipocytes. Am
J Physiol 1993 264:E197-E202
93. Rajkhowa M, Brett S, Cuthbertson DJ, Lipina C, Ruiz-Alcaraz AJ, Thomas GE,
Logie L, Petrie JR, Sutherland C. Insulin resistance in polycystic ovary syndrome is
associated with defective regulation of ERK1/2 by insulin in skeletal muscle in vivo.
Biochem J 2009 418:665-671
94. Bergman RN, Finegood DT, Kahn SE. The evolution of β-cell dysfunction and
insulin resistance in type 2 diabetes. Eur J Clin Invest 2002 32 (Suppl 3);35-45
95. Bergmann RN, Phillips LS, Cobelli C. Physiological evaluation of factors
controlling glucose tolerance in man: measurement of insulin sensitivity and β-cell
glucose sensitivity from the response to intravenous glucose. J Clin Invest 1981
68:1456-1467
96. Amato MC, Galluzzo A, Finocchiaro S, Criscimanna, Giordano C. The evaluation
of metabolic parameters and insulin sensitivity for a more robust diagnosis of the
polycystic ovary syndrome. Clinical Endocrinology 2008 69:52-60
97. Ehrmann DA, Sturis J, Byrne MM, Karrison T, Rosenfield RL, Polonsky KS.
Insulin secretory defects in polycystic ovary syndrome. Relationship to insulin
sensitivity and family history of non-insulin-dependent diabetes mellitus. J Clin
Invest 1995 96:520-527
98. O’Meara NM, Blackman JD, Ehrmann DA, Barnes RB, Jaspan JB, Rosenfield RL,
Polonsky KS. Defects in Beta-cell function in functional ovarian hyperandrogenism.
J Clin Endocrinol Metab 1993 76:1241-1247

163
99. Dunaif A, Finegood DT. Beta-cell dysfunction independent of obesity and glucose
intolerance in the polycystic ovary syndrome. J Clin Endocrinol Metab 1996;
81:942-946
100. Moran LJ, Misso ML, Wild RA, Norman RJ. Impaired glucose tolerance,
type 2 diabetes and metabolic syndrome in polycystic ovary syndrome: a systematic
review and meta-analysis. Human Reproduction Update 2010; 16:347-363
101. Norman RJ, Masters L, Milner CR, Wang JX, Davies MJ. Relative risk of
conversion from normoglycaemia to impaired glucose tolerance or non-insulin
dependent diabetes mellitus in polycystic ovary syndrome. Human Reproduction
2011; 16:1995-1998
102. Fuller JH, Shipley MJ, Rose G, Jarrett RJ, Keen H. Coronary heart disease
risk and impaired glucose tolerance. The Whitehall study. Lancet 1980; 1:1373-
1376
103. Jarrett RJ. The cardiovascular risk associated with impaired glucose
tolerance. Diabet Med 1996; 13:S15-19
104. Lindström J, Ilanne-Parikka P, Peltonen M, Aunola S, Eriksson JG, Hemiö
K, Hämäläinen H, Härkönen P, Keinänen-Kiukaanniemi S, Laakso M, Louheranta
A, Mannelin M, Paturi M, Sundvall J, Valle TT, Uusitupa M, Tuomilehto J; Finnish
Diabetes Prevention Study Group. Sustained reduction in the incidence of type 2
diabetes by lifestyle intervention: follow-up of the Finnish Diabetes Prevention
Study Lancet 2006; 368:1673-1679
105. Knowler WC, Barrett-Connor E, Fowler SE, Hamman RF, Lachin JM,
Walker EA, Nathan DM, Diabetes Prevention Program Research Group. Reduction
in the incidence of type 2 diabetes with lifestyle intervention or metformin. New
Engl J Med 2002; 346:393-403

164
106. Salley KES, Wickham EP, Cheang KI, Essah PA, Karjane NW, Nestler JE.
Position Statement: Glucose Intolerance in Polycystic Ovary Syndrome – A Position
Statement of the Androgen Excess Society. J Clin Endocrinol Metab 2007; 92:4546-
4556
107. National Institute for Health and Clinical Excellence. Clinical Knowledge
Summaries: Polycystic Ovary Syndrome 2013 www.cks.nice.org.uk/polycystic-
ovary-syndrome#!topicsummary
108. Mohlig M, Floter A, Spranger J, Weickert MO, Schill T, Schlosser HW,
Brabant G, Pfeiffer AFH, Selbig J, Schofl C. Predicting impaired glucose
metabolism in women with polycystic ovary syndrome by decision tree modelling.
Diabetologia 2006; 49:2572-2579
109. Celik C, Abali R. Bastu E, Tasdemir N, Tasdemir UG, Gul A. Assessment of
impaired glucose tolerance prevalence with haemoglobin A1c and oral glucose
tolerance test in 252 Turkish women with polycystic ovary syndrome: a prospective,
controlled study. Hum Reprod 2013; 28: 1062-1068
110. Velling Magnussen L, Mumm H, Andersen M, Glintborg D. Hemoglobin
A1c as a tool for the diagnosis of type 2 diabetes in 208 premenopausal women with
polycystic ovary syndrome. Fertil Steril 2011; 96:1275-80.
111. Lerchbaum E, Schwetz V, Giuliani A, Obermayer-Pietsch B. Assessment of
glucose metabolism in polycystic ovary syndrome: HbA1c or fasting glucose
compared with the oral glucose tolerance test as a screening method. Hum Reprod
2013; 28:2537-44.
112. De Michele M, Panico S, Iannuzzi A, Celentano E, Ciardullo AV, Galasso R,
Sacchetti L, Zarilli F, Bond MG, Rubba P. Association of obesity and central fat

165
distribution with carotid artery wall thickening in middle-aged women. Stroke 2002;
33:2923-2928
113. Larsson B, Svardsudd K, Welin L, Wilhelmsen L, Bjorntorp P, Tibblin G.
Abdominal adipose tissue distribution, obesity and risk of cardiovascular disease and
death: 13 year follow-up of participants in the study of men born in 1913. British
Med Journal 1984; 288:1401-1404
114. Lapidus L, Bengtsson C, Larsson B, Pennert K, Rybo E, Sjostrom L.
Distribution of adipose tissue and risk of cardiovascular disease death: a 12 year
follow up of participants in the population study of women in Gothenburg, Sweden.
British Med Journal 1984; 289:1257-1261
115. Boyko EJ, Fujimoto WY, Leonetti DL, Newell-Morris L. Visceral adiposity
and risk of type 2 diabetes: a prospective study among Japanese men. Diabetes Care
2000; 23:465-471
116. Alvarez-Blasco F, Botella-Carretero JI, San Millan JL, Escobar-Morreale HF.
Prevalence and characteristics of the polycystic ovary syndrome in overweight and
obese women. Arch Intern Med 2006; 166:2081-2086
117. Kiddy DS, Hamilton-Fairley D, Bush A, Short F, Anyaoku V, Reed MJ,
Franks S. Improvement in endocrine and ovarian function during dietary treatment
of obese women with polycystic ovary syndrome. Clinical Endocrinology 1992;
36:105-111
118. Yildirim B, Sabir N, Kaleli B. Relation of intra-abdominal fat distribution to
metabolic disorders in nonobese patients with polycystic ovary syndrome. Fertil
Steril 2003; 79:1358-64
119. Barber TM, Golding SJ, Alvey C, Wass JA, Karpe F, Franks S, McCarthy
MI. Global adiposity rather than abnormal regional fat distribution characterizes

166
women with polycystic ovary syndrome. J Clin Endocrinol Metab 2008; 93:999-
1004
120. Cosar E, Ucok K, Akgun L, koken G, Sahin FK, Arioz DT, Bas O. Body fat
composition and distribution in women with polycystic ovary syndrome. Gynecol
Endocrinol 2008; 24:428-432
121. Svendsen PF, Nilas L, Norgaard K, Jensen JEB, Madsbad S. Obesity, body
composition and metabolic disturbances in polycystic ovary syndrome. Hum Reprod
2008; 23:2113-2121
122. Carmina E, Bucchieri S, Mansueto P, Rini G, Ferin M, Lobo RA.
Circulating levels of adipose products and differences in fat distribution in the
ovulatory and anovulatory phenotypes of polycystic ovary syndrome. Fertil Steril
2009; 91:1332-1335
123. Lord J, Thomas R, Fox B, Acharya U, Wilkin T. The central issue? Visceral
fat mass is a good marker of insulin resistance and metabolic disturbance in women
with polycystic ovary syndrome. BJOG 2006; 113:1203-1209
124. Gustafson B, Hammarstedt A, Andersson CX, Smith U. Inflammed adipose
tissue: a culprit underlying the metabolic syndrome and atherosclerosis. Arterioscler
Thromb Vas Bio 2007; 27:2276-2283
125. Park HS, Park JY, Yu R. Relationship of obesity and visceral adiposity with
serum concentrations of CRP, TNF-alpha and IL-6. Diabetes Res Clin Prac 2005;
69:29-35
126. Pearson TA, Mensah GA, Alexander RW, Anderson JL, Cannon RO III
Criqui M et al. Markers of inflammation and cardiovascular disease: application to
clinical and public health practice. A statement for health professionals from the

167
Center for Disease Control and Prevention and the American Heart Association.
Circulation 2003; 107:499-511
127. Kern PA, Ranganathan S, Li C, Wood L, Ranganathan G. Adipose tissue
necrosis factor and interleukin-6 expression in human obesity and insulin resistance.
Am J Physiol Endocrinol Metab 2001; 280:E745-751.
128. Hotamisligill GS, Budavari A, Murray D, Spiegelman BM. Reduced
tyrosine kinase activity of the insulin receptor in obesity-diabetes. Central role of
Tumour necrosis factor α. J Clin Invest 1994; 94:1543-1549
129. Rotter V, Nagaev I, Smith U. Interleukin-6 induces insulin resistance in 3T3-
L1 adipocytes and is, like IL-8 and tumour necrosis factor-alpha, overexpressed in
human fat cells from insulin resistant subjects. J Bio Chem 2003; 278:45777-45784
130. Escobar-Morreale hF, Luque-Ramirez M, Gonzalez F. Circulating
inflammatory markers in polycystic ovary syndrome: a systematic review and meta-
analysis. Fertil Steril 2011; 95:1048-1058
131. Shi Y, Cui Y, Sun X, Ma G, Ma Z, Gao Q, Chen ZJ. Hypertension in women
with polycystic ovary syndrome: prevalence and associated cardiovascular risk
factors. Eur J Obstet Gynecol Reprod Bio 2014; 173:66-70
132. Luque-Ramirez M, Marti D, Fernandez-Duran E, Alpanes M, Alvarez-Blasco
F, Escobar-Morreale HF. Office blood pressure, ambulatory blood pressure
monitoring, and echocardiographic abnormalities in women with polycystic ovary
syndrome: role of obesity and androgen excess. Hypertension 2014; 63:624-629
133. Chen MJ, Yang WS, Yang JH, Chen CL, Ho HN, Yang YS. Relationship
between androgen levels and blood pressure in young women with polycystic ovary
syndrome. Hypertension 2007; 49:1442-1447

168
134. Essah PA, Nestler JE, Carmina E. Differences in dyslipidaemia between
American and Italian women with polycystic ovary syndrome. J Endocrinol Invest
2008; 31:35-45
135. Valkenburg O, Steegers-Theunissen RP, Smedts HP, Dallinga-Thie GM,
Fauser BC, Westerveld EH, Laven JS. A more atherogenic serum lipoprotein profile
is present in women with polycystic ovary syndrome: a case control study. J Clin
Endocrinol Metab 2008; 93:470-476
136. Pau CT, Keefe CC, Welt CK. Cigarette smoking, nicotine levels and
increased risk for metabolic syndrome in women with polycystic ovary syndrome.
Gynecol Endocrinol 2013; 29:551-555
137. Glintborg D, Mumm H, Hougaard DM, Ravn P, Andersen M. Smoking is
associated with increased adrenal responsiveness, decreased prolactin levels and a
more adverse lipid profile in 650 white patients with polycystic ovary syndrome.
Gynecol Endocrinol 2012; 28:170-174
138. Cupisti S, Haberle L, Dittrich R, Oppelt PG, Reissmann C, Kronawitter D,
Beckmann MW, Mueller A. Smoking is associated with increased free testosterone
and fasting insulin levels in women with polycystic ovary syndrome, resulting in
aggravated insulin resistance. Fertil Steril 2010; 94:673-677
139. Morotti E, Battaglia B, Fabbri R, Paradisi R, Venturoli S, Battaglia C.
Cigarette smoking and cardiovascular risk in young women with polycystic ovary
syndrome. 2014; Int J Fertil Steril 7:301-312
140. Bhatia LS, Curzen NP, Calder PC, Byrne CD. Non-alcoholic fatty liver
disease: a new and important cardiovascular risk factor? Eur Heart J. 2012; 33:1190-
1200

169
141. Targher G, Day CP, Bonora E. Risk of cardiovascular disease in patients
with non-alcoholic fatty liver disease. New Engl J Med 2010; 363:1341-1350
142. Targher G, Bertolini L, Padovani R, Rodella S, Tessari R, Zenari L, Day C,
Arcaro G. Prevalence of non-alcoholic fatty liver disease and its association with
cardiovascular disease among type 2 diabetic patients. Diabetes Care 2007; 3-:1212-
1218
143. Byrne CD, Targher G. Ectopic Fat, Insulin Resistance and Nonalcoholic
Fatty Liver Disease: Implications for Cardiovascular Disease. Arterioscler Thromb
Vasc Biol 2014; 34:1155-1161
144. Dawson AJ, Sathyapalant T, Smithson JAJ, Vince RV, Coady A-M, Ajjan R,
Kilpatrick ES, Atkin SL. A comparison of cardiovascular risk indices in patients
with polycystic ovary syndrome with and without coexisting non-alcoholic fatty
liver disease. Clin Endocrinol 2014; 80:843-849
145. Sprung VS, Jones H, Pugh CJA, Aziz NF, Daousi C, Kemp GJ, Green DJ,
Cable NT, Cuthbertson DJ. Endothelial dysfunction in hyperandrogenic polycystic
ovary syndrome is not explained by either obesity or ectopic fat deposition. Clin
Science 2014; 126:67-74
146. Anderson SA, Barry JA, Hardiman PJ. Risk of coronary heart disease and
risk of stroke in women with polycystic ovary syndrome: A systematic review and
meta-analysis. Int J Cardiol 2014; 176:486-487
147. Iftikhar S, Collazo-Clavell ML, Roger VL, St Sauver J, Brown RD Jr, Cha S,
Rhodes DJ. Risk of cardiovascular events in patients with polycystic ovary
syndrome. Neth J Med 2012; 70:74-80
148. Mani H, Levy MJ, Davies MJ, Morris DH, Gray LJ, Bankart J, Blackledge
H, Khunti K, Howlett TA. Diabetes and cardiovascular events in women with

170
polycystic ovary syndrome: a 20 year retrospective cohort study. Clin Endocrinol
2013; 78:926-934
149. McNamara JJ, Molot MA, Stremple JF et al. Coronary artery disease in
combat casualties in Vietnam. JAMA 1971; 216:1185-1187
150. Toth PP. Subclinical atherosclerosis: what it is, what it means and what we
can do about it. International Journal of Clinical Practice 2008; 62:1246-1254
151. Santos RD, Nasir K. Insights into atherosclerosis from invasive and non-
invasive imaging studies: Should we treat subclinical atherosclerosis?
Atherosclerosis 2009; 205:349-356
152. Flammer AJ, Anderson T, Celermajer DS, Creager MA, Deanfield J, Ganz P,
Hamburg N, Luscher TF, Shechter M, Taddei S, Vita JA, Lerman A. The
assessment of endothelial function – from research into clinical practice. Circulation
2012; 126:753-767
153. Mamudu HM, Paul TK, Veeranki SP, Budoff M. The effects of coronary
artery calcium screening on behavioural modification, risk perception, and
medication adherence among asymptomatic adults: A systematic review.
Atherosclerosis 2014; 236:338-350
154. Schmermund A, Mohlenkamp S, Erbel R. Coronary artery calcium and its
relationship to coronary artery disease. Cardiol Clin 2003; 21:521-34
155. Hirai T, Sasayama S, Kawasaki T, Yagi S. Stiffness of systemic arteries in
patients with myocardial infarction. A noninvasive method to predict severity of
coronary atherosclerosis. Circulation 1989; 80:78-86
156. Van Popele NM, Grobbee DE, Bots ML, Asmar R, Topouchian J, Reneman
RS et al. Association between arterial stiffness and atherosclerosis: The Rotterdam
Study. Stroke 2001; 32:454-460

171
157. Benetos A, Laurent S, Hoeks AP, Boutouyrie PH, Safar ME. Arterial
alterations with ageing and high blood pressure. Arterioscler Thromb 1993; 13:90-97
158. Glagov S, Vito R, Giddens DP, Zarins CK. Microarchitecture and
composition of artery walls; relationship to location, diameter and the distrirbution
of mechanical stress. J Hypertens 1992; 10: S101-104
159. Heintz B, Dorr R, Gillessen T, Walkenhorst F, Krebs W, Hanrath P et al. Do
arterial endothelin 1 levels affect local arterial stiffness? Am Heart J 1993; 126:987-
999
160. Airaksinen KE, Salmela Pl, Linnaluoto MK, Ikaheimo MJ, Ahola K,
Ryhanen LJ. Diminished arterial elasticity in diabetes: association with fluorescent
advanced glycosylation end products in collagen. Cardiovasc Res 1993; 27:942-945
161. Von Bibra H, Sutton MS. Diastolic dysfunction in diabetes and the
metabolic syndrome: promising potential for diagnosis and prognosis. Diabetologia
2010; 53:1033-1045
162. Anderson TJ, Uehata A, Gerhard MD, Meredith IT, Knab S, Delagrage D,
Lieberman EH, Ganz P, Creager MA, Yeung AC, Selwyn AP. Close relation of
endothelial function in the human coronary and peripheral circulation. Journal of the
American College of Cardiology 1995; 26:1235-1241
163. Mutlu B, Tigen K, Gurrel E et al The predictive value of flow-mediated
dilatation and carotid artery intima-thickness for occult coronary artery disease.
Echocardiography 2011; 28:1141-1147
164. Meyer C, McGrath BP, Teede HJ. Overweight women with polycystic ovary
syndrome have evidence of subclinical cardiovascular disease. The Journal of
Clinical Endocrinology and Metabolism 2005; 90:5711-5716
172
165. El-Kannishy G, Kamal S, Mousa A et al. Endothelial function in young
women with polycystic ovary syndrome (PCOS): implications of body mass index
(BMI) and insulin resistance. Obesity Research and Clinical Practice 2010; 4:e49-
e56
166. Soares GM, Vieira CS, Martins WP et al. Increased arterial stiffness in
nonobese women with polycystic ovary syndrome (PCOS) without comorbidities:
one more characteristic inherent to the syndrome? Clinical Endocrinology 2009;
71:406-411
167. Moran LJ, Hutchinson SK. Meyer C et al. A comprehensive assessment of
endothelial function in overweight women with and without polycystic ovary
syndrome. Clinical Science 2009; 116:761-770
168. Sprung VS, Atkinson G, Cuthbertson DJ, Pugh CJA, Aziz N, Green DJ,
Cable NT, Jones H. Endothelial function measured using flow-mediated dilatation
in polycystic ovary syndrome: a meta-analysis of the observational studies. Clinical
Endocrinology 2013; 78:438-446
169. Nacul AP, Andrade CD, Schwarz P, De Bittencourt Pl Jr, Spritizer PM.
Nitric oxide and fibrinogen in polycystic ovary syndrome: associations with insulin
resistance and obesity. Eur J Obstet Gynaecol Reprod Biol 2007; 133:191-6
170. Turkcuoglu I, Engin-Ustun Y, Turan F, Kali Z, Karabulut AB, Meydanli M
et al. Evaluation of asymmetric dimethylarginine, nitric oxide levels and associated
independent variables in obese and lean patients with polycystic ovarian syndrome.
Gynecol Endocrinol 2011; 27:609-614
171. Willis GR, Udiawar M, Evans WD, Blundell HL, James PE, Rees DA.
Detailed characterisation of circulatory nitric oxide and free radical indices – is there

173
evidence for abnormal cardiovascular haemostasis in young women with polycystic
ovary syndrome. BJOG 2014; DOI: 10.1111/1471-0528.12834
172. Rennenberg RJ, Kessels AG, Schurgers LJ, van Engelshoven JM, de Leeuw
PW, Kroon AA. Vascular calcifications as a marker of increased cardiovascular
risk: a meta-analysis. Vasc Health Risk Manag 2009; 5:185-197
173. Greenland P, Bonow RO, Brundage BH et al. ACCF/AHA 2007 clinical
expert consensus document on coronary artery calcification scoring by computerised
tomography in global cardiovascular risk assessment and in evaluation of patients
with chest pain: a report of the American College of Cardiology Foundation Clinical
Expert Consensus Task Force developed in collaboration with the Society of
Cardiovascular Computed Tomography. J Am Coll Cardiol 2007; 49:378-402
174. Chang AY, Ayers C, Minhajuddin A, Jain T, Nurenberg P, de Lomas JA,
Wild RA, Auchus RJ. Polycystic ovarian syndrome and subclinical atherosclerosis
among women of reproductive age in the Dallas heart study. Clin Endocrinol 2011;
74:89-96
175. Christian RC, Dumesic DA, Behrenbeck T, Olberg AL, Sheedy PF 2nd,
Fitzpatrick LA. Prevalence and predictors of coronary artery calcification in women
with polycystic ovary syndrome. J Clin Endocrinol Metab 2003; 88:2562-2568
176. Talbott EO, Zborowski JV, Rager JR, Boudreaux MY, Edmundowicz DA,
Guzick DS. Evidence for an association between metabolic cardiovascular
syndrome and coronary and artery calcification among women with polycystic ovary
syndrome. J Clin Endocrinol Metab 2004; 89:5454-5461
177. Shroff R, Kerchner A, Maifeld M, Van Beek EJ, JJagasia D, Dokras A.
Young obese women with polycystic ovary syndrome have evidence of early
coronary atherosclerosis. J Clin Endocrinol Metab 2007; 92:4609-4614

174
178. Talbott EO, Zborowski J, Rager J, Stragand JR. Is there an independent
effect of polycystic ovary syndrome (PCOS) and menopause on the prevalence of
subclinical atherosclerosis in middle aged women? Vasc Health Risk Manag 2008;
4:453-462
179. Lorenz MW, Markus HS, Bots ML, Rosvall M, Sitzer M. Prediction of
clinical cardiovascular events with carotid intima-media thickness: a systematic
review and meta-analysis. Circulation 2007; 115:459-467
180. Orio F, Palomba S, Spinelli L, Cascella T, Tauchmanova L, Zullo F,
Lombardi G, Colao A. The cardiovascular risk of young women with polycystic
ovary syndrome: an observational, analytical, prospective case-control study. J Clin
Endocrinol Metab 2004; 89:3696-3701
181. Carmina E, Orio F, Palomba S, Longo RA, Cascella T, Colao A, Lombardi
G, Rini GB, Lobdo RA. Endothelial dysfunction in PCOS: role of obesity and
adipose hormones. Am J Med 2006; 119:356.e1-356.e6
182. Cascella T, Palomba S, De Sio I, Manguso F, Gialluria F, De Simone B,
Tafuri S, Lombardi G, Colao A, Orio F. Visceral fat is associated with
cardiovascular risk in women with polycystic ovary syndrome. Hum Reprod 2008;
23:153-159
183. Lakhani K, Hardiman P, Seifalian AM. Intima-media thickness of elastic and
muscular arteries of young women with polycystic ovaries. Atherosclerosis 2004;
175:353-359
184. Vryonidou A, Papatheodorou A, Tavridou A, Terzi T, Loi V, Vatalas IA,
Batakis N, Phenekos C, Dionyssiou-Asteriou A. Association of hyperandrogenemic
and metabolic phenotype with carotid intima-media thickness in young women with
polycystic ovary syndrome. J Clin Endocrinol Metab 2005; 90:2740-2746

175
185. Luque-Ramirez M, Mendieta-Azcona C, Alvarez-Blasco F, Escobar-
Morreale HF. Androgen excess is associated with increased carotid intima-media
thickness observed in young women with polycystic ovary syndrome. Hum Reprod
2007; 22:3197-3203
186. Costa LO, dos Santos MP, Oliveira M, Viana A. Low-grade chronic
inflammation is not accompanied by structural arterial injury in polycystic ovary
syndrome. Diabetes Res Clin Pract 2008; 81:179-183
187. Talbott EO, Guzick DS, Sutton-Tyrrell K, McHugh-Pemu P, Zborowski J,
Remsberg K. Evidence for the association between polycystic ovary syndrome and
premature carotid atherosclerosis in middle-aged women. Arteriosler Thromb Vasc
Biol 2000; 20:2414-2421
188. Meyer LM, Malek AM, Wild RA, Korytkowski MT, Talbott EO. Carotid
artery intima-media thickness in polycystic ovary syndrome: a systematic review and
meta-analysis. Hum Reprod Update 2012; 18:112-126
189. Shokawa T, Imazu M, Yamamoto H, Toyofuku M, Tasaki N, Okimoto T,
Yamane K, Kohno N. Pulse wave velocity predicts cardiovascular mortality:
findings from the Hawaii-Los Angeles-Hiroshima study. Circ J 2005; 69:259-264
190. Willum-Hansen T, Staessen JA, Torp-Pedersen C, Ramussen S, Thijs L,
Ibsen H, Jeppesen J. Prognostic value of aortic pulse wave velocity as index of
arterial stiffness in the general population. Circulation 2006; 113:664-670
191. Meaume S, Benetos A, Henry OF, Rudnichi A, Safar ME. Aortic pulse wave
velocity predicts cardiovascular mortality in subjects >70 years of age. Arterioscler
Thromb Vasc Biol 2001; 21:2046-2050
192. Mattace-Raso FU, van der Cammen TJ, Hofman A, van Popele NM, Bos
ML, Schalekamp MA, Asmar R, Reneman RS, Hoeks AP, Breteler MM, Witteman

176
JC. Arterial stiffness and risk of coronary heart disease and stroke: the Rotterdan
Study. Circulation 2006; 113:657-663
193. Blacher J, Guerin AP, Pannier B, Marchais SJ, Safar M, London G. Impact of
aortic stiffness on survival in end-stage renal disease. Circulation 1999; 99:2434-
2439
194. Shoji T, Emoto M, Shinohara K, Kakiya R, Tsujimoto Y, Kishimoto H,
Ishimura E, Tabata T, Nishizawa Y. Diabetes Mellitus, aortic stiffness and
cardiovascular mortality in end-stage renal disease. Journal Am Soc Nephrol 2001;
12:2117-2124
195. Laurent S, Boutouyrie P, Asmar R, Gautier I, Laloux B, Guize L,
Ducimetiere P, Benetos A. Aortic stiffness is an independent predictor of all-cause
and cardiovascular mortality in hypertensive patients. Hypertension 2001; 37:1236-
1241
196. Boutouyrie P, Tropeano AI, Asmar R, Gautier I, Benetos A, Lacolley P,
Laurent S. Aortic stiffness is an independent predictor of primary coronary events in
hypertensive patients: a longitudinal study. Hypertension 2002; 39:10-15
197. Cruickshank K, Riste L, Anderson SG, Wright JS, Dunn G, Gosling RG.
Aortic pulse wave velocity and its relationship to mortality in diabetes and glucose
intolerance: an integrated index of vascular function? Circulation 2002; 106:2085-
2090
198. Wilkinson IB, Prasad K, Hall IR, Thomas A, MacCallum H, Webb DJ,
Cockcroft JR. Increased central pulse pressure and augmentation index in subjects
with hypercholesterolemia. J Am Coll Cardiol 2002; 39:1005-1011
199. Mahmud A, Feely J. Effect of smoking on arterial stiffness and pulse
pressure amplification. Hypertension 2003; 41: 183-187

177
200. Trakakis E, Balanika A, Baltas C, Loghis C, Simeonidis G, Vaggopoulos V,
Papakonstantinou O, Gouilamos A, Salamalekis G, Kassonos D. Haemodynamic
alterations and wall properties in large arteries of young, normotensive, and non-
obese women with polycystic ovary syndrome. J Endocrinol Invest 2008; 31:1001-
1007
201. Ketel IJ, Stehouwer CD, Henry RM, Serne EH, Hompes P, Homburg R,
Smulders YM, Lambalk CB. Greater arterial stiffness in polycystic ovary syndrome
(PCOS) is an obesity – but not a PCOS-associated phenomenon. J Clin Endocrinol
Metab 2010; 95:4566-4575
202. Muneyyirci-Delale O, Winer N, Oklander V, Joulak I, Dalloul N, Nacharaju
V, Dham S, von Gizycki H. Vascular compliance in women with polycystic ovary
syndrome and healthy women. J Cardiometab Syndr 2007; 2:40-44
203. Cussons AJ, Watts GF, Stuckey BG. Dissociation of endothelial function
and arterial stiffness in nonobese women with polycystic ovary syndrome (PCOS).
Clin Endocrinol 2009; 71:808-814
204. Kelly CJ, Spiers A, Gould GW, Petrie JR, Lyall H, Connell JM. Altered
vascular function in young women with polycystic ovary syndrome. J Clin
Endocrinol Metab 2002; 87:742-746
205. Wan SH, Vogel MW, Chen HH. Pre-clinical diastolic dysfunction. J Am
Coll Cardiol 2014; 63:407-416
206. Mogelvang R, Sogaard P, Pederson SA, Olsen NT, Marott JL, Schnohr P,
Goetze JP, Jensen JS. Cardiac dysfunction assessed by echocardiographic tissue
doppler imaging is an independent predictor of mortality in the general population.
Circulation 2009; 119:2679-2685

178
207. Redfield MM, Jacobsen SJ, Burnett JC Jr, Mahoney DW, Bailey KR,
Rodeheffer RJ. Burden of systolic and diastolic ventricular dysfunction in the
community: appreciating the scope of the heart failure epidemic. JAMA 2003;
289:194-202
208. Yarali H, Yildirir A, Aybar F, Kabakci G, Bukulmez O, Azgul E, Oto A.
Diastolic dysfunction and increased serum homocysteine concentrations may
contribute to increased cardiovascular risk in patients with polycystic ovary
syndrome. Fertil Steril 2001; 76:511-516
209. Tekin A, Tekin G, Colkesen Y, Kilicdag EB, Bashan I, Sezgin AT,
Muderrisoglu H. Left ventricular function in patients with polycystic ovary
syndrome: a Doppler echocardiographic study. Exp Clin Endocrinol Diabetes 2009;
117:165-169
210. Trujillo ME, Scherer PE. Adipose tissue-derived factors: impact on health
and disease. Endocrine Reviews 2006; 27:762-778
211. Lau DC, Dhillon B, Yan H, Szmitko PE, Verma S. Adipokines: molecular
links between obesity and atherosclerosis. American Journal of Physiology. Heart
and Circulatory Physiology 2005; 288: H2031-H2041
212. Calori G et al. Prevalence, metabolic features, and prognosis of
metabolically healthy obese Italian individuals: the Cremona Study. Diabetes Care
2011; 34:210-215
213. Hamer M, Stamatakis E. Metabolically healthy obesity and risk of all-cause
and cardiovascular disease mortality. J Clin Endocrinol Metab 2012; 97:2482-2488
214. Pischon T, Boeing H, Hoffmann K, Bergmann M, Schulze MB, OOvervad K,
van der Schouw YT, Spencer E, Moons KGM, Tjonneland A, Halkajer J, Jensen
MK, Stegger J, Clavel-Chapelon F, Boutron-Ruault MC, Chajes V, Linseisen J,

179
Kaaks R, Trichopoulou A, Trichopoulos D, Bamia C, Sieri S, Palli D, Tumino R,
Vineis P, Panico S, Peeters PHM, May AM, Bueno-de-Mesquita HB, van
Duijnhoven FJB, Hallmans G, Weinehall L, Manjer J, Hedbald B, Lund E, Agudo A,
Arriola L, Barricarte A, Navarro C, Martinez C, Quiros JR, Key T, Bingham S,
Khaw KT, Boffetta P, Jenab M, Ferrari P, Riboli E. General and abdominal adiposity
and the risk of death in Europe. N Engl J Med 2008; 359:2105-2120
215. Manson JE et al. Body weight and mortality among women. N Engl J Med
1995; 333:677-685
216. Rankinen T, Kim SY, Peruse L, Despres JP, Bouchard C. The prediction of
abdominal visceral fat level from body composition and anthropometry: ROC
analysis. Int J Obes; 23:801-809
217. Vague J. Sexual differentiation, a factor affecting the forms of obesity.
Presse Med 1947; 55:339 in Morelli M, Gaggini M, Daniele G, Marraccini P, Sicari
R, Gastaldelli A. Ectopic fat: the true culprit linking obesity and cardiovascular
disease? Thrombosis and Haemostasis 2013; 110:651-660
218. Pou KM et al. Patterns of abdominal fat distribution: the Framingham Heart
Study. Diabetes Care 2009; 32:481-485
219. Alliger M et al. Subcutaneous adipose tissue remodelling during the initial
phase of weight gain induced by overfeeding in humans. J Clin Endocrinol Metabol
2012; 97: E183-192
220. Mattu HS, Randeva HS. Role of adipokines in cardiovascular disease.
Journal of Endocrinology 2013; 216:T17-36
221. Kadowaki T, Yamauchi T. Adiopnectin and adiponectin receptors.
Endocrine Reviews 2005; 26: 439-451

180
222. Lago F, Dieguez C, Gomez-Reino J, Gualillo O. The emerging role of
adipokines as mediators of inflammation and immune responses. Cytokine and
Growth Factor Reviews 2007; 18:313-325
223. Cesari M, Pessina AC, Zanchetta M, De Toni R, Avogaro A, Pedon L,
Dorigatti F, Maiolino G, Rossi GP. Low plasma adiponectin is associated with
coronary artery disease but not with hypertension in high-risk nondiabetic patients.
Journal of Internal Medicine 2006; 260:474-483
224. Toulis KA, Goulis DG, Farmakiotis D, Georgopoulos NA, Katsikis I,
Tarlatzis BC, Papadimas I, Panidis D. Adiponectin levels in women with polycystic
ovary syndrome: a systematic review and meta-analysis. Human Reproduction
Update 2009; 15:297-307
225. Trolle B, Lauszus FF, Frystyk J, Flyvberg A. Adiponectin levels in women
with polycystic ovary syndrome: impact of metformin treatment in a randomised
controlled study. Fertility Sterility 2010; 94:2234-2238
226. Sattar N, Wannamethee G, Sarwar N, Chernova J, Lawlor DA, Kelly A,
Wallace AM, Danesh J, Whincup PH. Leptin and coronary heart disease:
prospective study and systematic review. J Am Coll Cardiol 2009; 53: 167-175
227. Pirwany IR, Fleming R, Sattar N, Greer IA, Wallace AM. Circulating leptin
concentrations and ovarian function in polycystic ovary syndrome. European
Journal of Endocrinology 2001; 145:289-294
228. Telli MH, Yildirim M, Noyan V. Serum leptin levels in patients with
polycystic ovary syndrome. Fertility Sterility 2002; 77:932-935
229. Pusalkar M, Meherji P, Gokral J, Savardekar L, Chinnaraj S, Maitra A.
Obesity and polycystic ovary syndrome: association with androgens, leptin and its
genotypes. Gynecol Endocrinol 2010; 26:874-882

181
230. Yildizhan R, Ilhan GA, Yildizhan B, Kolusari A, Adali E, Bugdayci G.
Serum retinol-binding protein 4, leptin and plasma asymmetric dimethylarginine
levels in obese and non-obese young women with polycystic ovary syndrome. Fertil
Steril 2011; 96:246-250
231. Iuorno MJ, Islam LZ, Veldhuis PP, Boyd DG, Farhy LS, Johnson ML,
Nestler JE, Evans WS. Leptin secretory burst mass correlates with body mass index
and insulin in normal women but not in women with polycystic ovary syndrome.
Metabolism 2007; 56:1561-1565
232. Sethi JK, Vidal-Puig A. Visfatin: the missing link between intra-abdominal
obesity and diabetes? Trends in Molecular Medicine 2005; 11:344-347
233. Kloting N, Kloting I. Visfatin: gene expression in isolated adipocytes and
sequence analysis in obese WOKW rats compared with lean control rats.
Biochemical and Biophysical Research Communications 2005; 332:1070-1072
234. Berndt J, Kloting N, Kralisch S, Kovacs P, Fasshauer M, Schon MR,
Stumvoll M, Bluher M. Plasma visfatin concentrations and fat depot-specific
mRNA expression in humans. Diabetes 2005; 54:2911-2916
235. Brown JE, Onyango DJ, Ramanjaneya M, Conner AC, Patel ST, Dunmore
SJ, Randeva HS. Visfatin regulates insulin secretion, insulin signalling and mRNA
expression of diabetes-related genes in mouse pancreatic β-cells. Journal of
Molecular Endocrinology 2010; 44:171-178
236. Lopez-Bermejo A, Chico-Julia B, Fernandez-Balsells M, Recasens M, Esteve
E, Casanitjana R, Ricart W, Fernandez-Real JM. Serum visfatin increases with
progressive β-cell deterioration. Diabetes 2006; 55:2871-2875

182
237. Chan TF, Chen YL, Chen HH, Lee CH, Jong SB, Tsai EM. Increased
plasma visfatin concentrations in women with polycystic ovary syndrome. Fertil
Steril 2007; 88:401-405
238. Jongwutiwes T, Lertvikool S, Leelaphiwat S, Rattanasiri S, Jultanmas R,
Weerakiet S. Serum visfatin in Asian women with polycystic ovary syndrome.
Gynecol Endocrinol 2009; 25:536-542
239. Tan BK, Chen J, Digby JE, Keay SD, Kennedy CR, Randeva HS. Increased
visfatin messenger ribonucleic acid and protein levels in adipose tissue and
adipocytes in women with polycystic ovary syndrome: parallel increase in plasma
visfatin. J Clin Endocrinol Metab 2006; 91:5022-5028
240. Altinkaya SO, Nergiz S, Kucuk M, Yuksel H. Apelin levels in relation with
hormonal and metabolic profile in patients with polycystic ovary syndrome. Eur J
Obstet Gynecol Reprod Biol 2014; 176:168-172
241. Choi YS, Yang HI, Cho S, Jung JA, Jeon YE, Kim HY, Seo SK, Lee BS.
Serum asymmetric dimethylarginine, apelin and tumor necrosis factor-α levels in
non-obese women with polycystic ovary syndrome. Steroids 2012; 77:1352-1358
242. Roh SG, Song SH, Choi KC, Katoh K, Wittamer V, Parmentier M, Sasaki S.
Chemerin – a new adipokine that modulates adipogenesis via its own receptor.
Biochem Biophys Res Commun 2007; 362:1013-1018
243. Bozaoglu K, Bolton K, McMillan J, Zimmet P, Jowett J, Collier G, Walder
K, Segal D. Chemrin is a novel adipocytokine associated with obesity and metabolic
syndrome. Endocrinology 2007; 148: 4687-4694
244. Yoo HJ, Choi HY, Yang SJ, Kim HY, Seo JA, Kim SG, Kim NH, Choi KM,
Choi DS, Balik SH. Circulating chemerin level is independently correlated with
arterial stiffness. Journal of Atherosclerosis and Thrombosis 2012; 19:59-66

183
245. Lehrke M, Becker A, Greif M, Stark R, Laubender RP, von Zielgler F,
Lebherz C, Tittus J, Reiser M, Becker C et al. Chemerin is associated with markers
of inflammation and components of the metabolic syndrome but does not predict
coronary atherosclerosis. European Journal of Endocrinology 2009; 161:339-344
246. Tan BK, Chen J, Farhatullah S, Adya R, Kaur J, Heutling D, Lewandowski
KC, O’Hare JP, Lehnert H, Randeva HS. Insulin and metformin regulate circulating
and adipose tissue chemerin. Diabetes 2009; 58:1971-1977
247. Tan BK, Adya R, Shan X, Aghilla M, Lehnert H, Keay SD, Randeva HS.
The anti-atherogenic aspect of metformin treatment in insulin resistant women with
the polycystic ovary syndrome: role of the newly established pro-inflammatory
adipokine acute-phase serum amyloid A; evidence of an adipose tissue-monocyte
axis. Atheroscelerosis 2011; 216:402-408
248. Efstathiou SP, Tsiakou AG, Tsioulos DI, Panagiotou TN, Pefanis AV,
Achimastos AD, Mountokalakis TD. Prognostic significance of plasma resistin
levels in patient with atherothrombotic ischaemic stroke. Clinica Chimica Acta 2007;
378:78-85
249. Seow KM, Juan CC, Wu LY, Hsu YP, Yang WM, Tsai YL, Hwang JL, Ho
LT. Serum and adipocyte resistin in polycystic ovary syndrome with insulin
resistance. Hum Reprod 2004; 19:48-53
250. DeFronzo RA. Insulin reistance, lipotoxicity, type 2 diabetes and
atherosclerosis: the missing links. The Claude Bernard Lecture 2009. Diabetologia
2010; 53:1270-1287
251. Rask-Madsen C, Li Q, Freund B, Feather D, Abramov R, Wu IH, Chen K,
Yamamoto-Hiraoka J, Goldenberg J, Sotiropoulos KB, Clermont A, Geraldes P,
Dall’Osso C, Wagers AJ, Huang PL, Rekhter M, Scalia R, Khan CR, King GL. Loss

184
of insulin signalling in vascular endothelial cells accelerates atherosclerosis in
apolipoprotein E null mice. Cell Metab 2010; 11:379-389
252. Kim JA, Montagnani M, Koh KK, Quon MJ. Reciprocal relationships
between insulin resistance and endothelial dysfunction: molecular and
pathophysiological mechanisms. Circulation 2006; 113:1888-1904
253. Giltay EJ, Lambert J, Elbers JM, Gooren LJ, Asscheman H, Stehouwer CDA.
Arterial compliance and distensibility are modulated by body composition in both
men and women but by insulin sensitivity only in women. Diabetologia 1999;
42:214-221
254. Cleland SJ, Petrie JR, Small M, Elliott HL, Connell JM. Insulin action is
associated with endothelial function in hypertension and type 2 diabetes.
Hypertension 2000; 35:507-511
255. Westerbacka J, Vehkavaara S, Bergholm R, Wilkinson I, Cockcroft J, Yki-
Jarvinen H. Marked resistance of the ability of insulin to decrease arterial stiffness
characterises human obesity. Diabetes 1999; 48:821-827
256. Nathan DM, Cleary PA, Backlund JY, Genuth SM, Lachin JM, Orchard TJ,
Raskin P, Zinman B. Intensive diabetes treatment and cardiovascular disease in
patients with Type 1 Diabetes. N Engl J Med 2005; 353:3643-2653
257. Holmann RR, Paul SK, Bethel MA, Matthews DR, Neil HA. 10-year follow-
up of intensive glucose control in type 2 diabetes. N Eng J Med 2008; 359:1577-
1589
258. Mazzone T. Intensive glucose lowering and cardiovascular disease
prevention in diabetes: reconciling the recent clinical trial data. Circulation 2010;
122:2201-2211

185
259. Coutinho M, Gerstein HC, Wang Y et al. The relationship between glucose
and incident cardiovascular events. A metaregression analysis of published data
from 20 studies of 95,783 individuals followed for 12.4 years. Diabetes Care 1999;
22:233-240
260. DECODE study group. Glucose tolerance and mortality: comparison of
WHO and American Diabetes Association diagnostic criteria. European Diabetes
Epidemiology Group, Diabetes Epidemiology: Collaborative analysis of Diagnostic
criteria in Europe. Lancet 1999; 354:617-621
261. Booth G, Stalker TJ, Lefer AM, Scalia R. Mechanisms of amelioration of
glucose-induced endothelial dysfunction following inhibition of protein kinase C in
vivo. Diabetes 2002; 51:1556-1564
262. Giacco F, Brownlee M. Oxidative stress and diabetic complications. Circ
Res 2010; 107:1058-1070
263. Harja E, Bu DX, Hudson BI, Chang JS, Shen X, Hallam K, Kalea AZ, Lu Y,
Rosario RH, Oruganti S, Nikolla Z, Belov D, Lalla E, Ramassamy R, Yan SF,
Schmidt AM. Vascular and inflammatory stresses mediate atherosclerosis via
RAGE and its ligands in apoE-/- mice. J Clin Invest 2008; 118:183-194
264. Inoguchi T, Li P, Umeda F, Yu HY, Kakimoto M, Imamura M, Aoki T, Etoh
T, Hashimoto T, Naruse M, Sano H, Utsumi H, Nawata H. High glucose level and
free fatty acid stimulate reactive oxygen species production through protein kinase
C-dependent activation of NAD(P)H oxidase in cultured vascular cells. Diabetes
2000; 49:1939-1945
265. Madamanchi NR, Vendrov A, Runge MS. Oxidative Stress and Vascular
Disease. Arterioslcer Thromb Vasc Biol 2005; 25:29-38

186
266. Valko M, Leibfritz D, Moncol J, Cronin MT, Mazur M, Telser J. Free
radicals and antioxidants in normal physiological functions and human disease. Int J
Biochem Cell Biol 2007; 39:44-84
267. Channon KM. Oxidative stress and coronary plaque stability. Arterioscler
Throm Vasc Biol 2002; 22:1751-1752
268. Spiekermann S, Landmesser U, Dikalov S, Bredt M, Gamez G, Tatge H,
Reepschlager N, Hornig B, Drexler H, Harrison D. Electron spin resonance
characterisation of vascular xanthine and NAD(P)H oxidase activity in patients with
coronary artery disease: relation to endothelium-dependent
269. Urakawa H, Katsuki A, Sumida Y, Gabazza EC, Murashima S, Morioka K.
Oxidative stress is associated with adiposity and insulin resistance in men. J Clin
Endocrinol Metab 2003; 88:4673-4676
270. Block G, Dietrich M, Norkus EP, Morrow JD, Hudes M, Caan B. Factors
associated with oxidative stress in human populations. Am J Epidemiol 2002;
156:274-285
271. Murri M, Garcia-Fuentes E, Garcia-Almeida JM, Garrido-Sanchez L, Mayas
MD, Bernal R, Tinahones FJ. Changes in oxidative stress and insulin resistance in
morbidly obese patients after bariatric surgery. Obes Surg 2010; 20:363-368
272. Vincent HK, Taylor AG. Biomarkers and potential mechanisms of obesity-
induced oxidant stress in humans. Int J Obes 2005; 30:400-418
273. Murri M, Luque-Ramirez M, Insenser M, Ojeda-Ojeda M, Escobar-Morreale
HF. Circulating markers of oxidative stress and polycystic ovary syndrome (PCOS):
a systematic review and meta-analysis. Human Reproduction Update 2013; 19:268-
288

187
274. Harshfield GA, Alpert BS, Pulliman DA, Soames GW, Wilson DK.
Ambulatory blood pressure recordings in children and adolescents. Pediatrics 1994;
94:180-184
275. Reckelhoff JF, Zhang H, Srivastava K, Granger JP. Gender differences in
hypertension in spontaneously hypertensive rats: role of androgens and androgen
receptor. Hypertension 1999; 34:920-923
276. Reckelhoff JF. Gender Differences in the Regulation of Blood Pressure.
Hypertension 2001; 37:1199-1208
277. English KM, Mandour O, Steeds RP, Diver MJ, Jones TH, Channer KS.
Men with coronary artery disease have lower level of androgens than men with
normal coronary angiograms. Eur Heart J 2000; 21:890-894
278. Akishita M, Hashimoto M, Ohike Y, Ogawa S, Iijima K, Eto M, Ouchi Y.
Low testosterone level as a predictor of cardiovascular events in Japanese men with
coronary risk factors. Atherosclerosis 2010; 210:232-236
279. Vikan T, Schirmer H, Njolstad I, Svartberg J. Endogenous sex hormones and
the prospective association with cardiovascular disease and mortality in men: The
Tromso Study. Euro J Endocrinol 2009; 161:435-442
280. Araujo AB, Dixon JM, Suarez EA, Murad MH, Guey LT, Wittert GA.
Endogenous testosterone and mortality in men: a systematic review and meta-
analysis. J Clin Endocrinol Metab 2011; 96:3007-3019
281. Gooren LJ, Wierckx K, Giltay EJ. Cardiovascular disease in transsexual
persons treated with cross-sex hormones: reversal of the traditional sex difference in
cardiovascular disease pattern. European Journal of Endocrinology 2014; 170:809-
819

188
282. Jones TH, Saad F. The effects of testosterone on risk factors for, and the
mediators of, the atherosclerotic process. Atherosclerosis 2009; 207:318-327
283. Nettleship JE, Jones TH, Chammer KS, Jones RD. Physiological testosterone
replacement therapy attenuates fatty streak formation and improves high-density
lipoprotein cholesterol in the Tfm mouse: an effect that is independent of the classic
androgen receptor. Circulation 2007; 116:2427-2434
284. Kelly DM, Jones TH. Testosterone: a vascular hormone in health and
disease. J Endocrinol 2013; 217:R47-R71
285. Studen KB, Sebestjen M, Pfeifer M, Prezeli J. Influence of spironolactone
treatment on endothelial function in non-obese women with polycystic ovary
syndrome. Eur J Endocrinol 2011; 164:389-395
286. DeFronzo RA, Tobin JD, Andres R. Glucose clamp technique: a method for
quantifying insulin secretion and resistance. American Journal of Physiol
Endocrinol Metab Gastroinest Physio 1979; 237:E214-223
287. Tam CS, Xu W, Johnson WD, Cefalu WT, Redman LM, Ravussin. Defining
insulin resistance from hyperinsulinemic-euglycemic clamps. Diabetes Care 2012;
35:1605-1610
288. Matthews DR, Hosker JP, Rudenski AS, Naylor BA, Treacher DF, Turner
RC. Homeostasis model assessment: insulin resistance and beta-cell function from
fasting plasma glucose and insulin concentration in man. Diabetalogia 1985; 28:412-
419
289. Katz A, Nambi SS, Mather K, Baron AD, Follmann DA, Sullivan G, Quon
MJ. Quantitative insulin sensitivity check index: a simple accurate method for
assessing insulin sensitivity in humans. Journal of Clinical Endocrinology and
Metabolism 2000; 85:2402-2410

189
290. Pyorala M, Miettinen H, Laakso M, Pyorala K. Plasma insulin and all-cause
cardiovascular, and noncardiovascular mortality. Diabetes Care 2000; 23:1097-1102
291. Ribeiro-Filho FF, Faria AN, Kohlmann NEB, Zanella MT, Ferreira SRG.
Two-hour insulin determination improves the ability of abdominal fat measurement
to identify risk for the metabolic syndrome. Diabetes Care 2003; 26:1725-1730
292. De Vegt F, Dekker JM, Ruhe HG, Stehouwer CD, Nijpels G, Bouter LM,
Heine RJ. Hyperglycaemia is associated with all-cause and cardiovascular mortality
in the Hoorn population: the Hoorn Study. Diabetologia 1999; 42:926-31
293. Balkau B, Shipley M, Jarrett RJ, Pyorala K, Pyorala M, Forhan A, Eschwege
E. High blood glucose concentrations is a risk factor for mortality in middle aged
non-diabetic men. 20 year follow-up to the Whitehall study, the Paris Prospective
study and the Helsinki Policeman study. Diabetes Care 1998; 21:360-367
294. Watson S, Blundell HL, Evans WD, Griffiths H, Newcombe RG, Rees DA.
Can abdominal bioelectrical impedance refine the determination of visceral fat from
waist circumference? Physiol Meas 2009; 30:N53-58
295. Oliver JJ, Webb DJ. Noninvasive assessment of arterial stiffness and risk of
atherosclerotic events. Arteriosclerosis, Thrombosis and Vascular Biology 2003;
23:554-556
296. Chen C-H, Nevo E, Fetic B, Pak PH, Yin FC, Maugham WL, Kass DA.
Estimation of central aortic pressure waveform by mathematical transformation of
radial tonometry pressure: validation of generalized transfer function. Circulation
1997; 95:1827-1836
297. Van Bortel LM, Duprez D, Starmans-Kool MJ, Safar ME, Giannattasio C,
Cockcroft J, Kaiser DR, Thuillez C. Clinical Applications of arterial stiffness. Task

190
Force III: recommendations for user procedures. American Journal of Hypertension
2002; 15:445-452
298. Wilkinson IB, Fuchs SA, Jansen IM, Spratt JC, Murray GD, Cockcroft JR,
Webb DJ. Reproducibility of pulse wave velocity and augmentation index measured
by pulse wave analysis. J Hypertension 1998; 16:2079-2084
299. Lang RM, Bierig M, Devereux RB, Flachskampf FA, Foster E, Pellikka PA,
Picard MH, Roman MJ, Seward J, Shanewise J, Solomon S, Spencer KT, St John
Sutton M, Stewart W; American Society of Echocardiography’s Nomenclature and
Standards Committee; Task Force on Chamber Quantification; American College of
Cardiology Echocardiography Committee; American Heart Association; European
Association of Echocardiography; European Society of Cardiology.
Recommendations for chamber quantification. European Journal of
Echocardiography 2006; 7:79-108
300. Sohn DW, Chai IH, Lee DJ, Kim HC, Kim HS, Oh BH, Lee MM, Park YB,
Choi YS, Seo JD et al. Assessment of mitral annulus velocity by Doppler tissue
imaging in the evaluation of left ventricular dysfunction. J Am Coll Cardiol 1997;
30:474-480
301. Moran L, Teede H. Metabolic features of the reproductive phenotypes of
polycystic ovary syndrome. Hum Reprod Update 2009; 15:477-488
302. Moran LJ, Cameron JD, Strauss BJ, Teede HJ. Vascular function in the
diagnostic criteria of polycystic ovary syndrome. Hum Reprod 2011; 26: 2192-2199
303. Watanabe RM, Azen CG, Roy S, Perlman JA, Bergman RN. Defects in
carbohydrate metabolism in oral contraceptive users without apparent metabolic risk
factors. J Clin Endocrinol Metab 1994; 79:1277-1283

191
304. Hannaford P. Cardiovascular events associated with different combined oral
contraceptives: a review of current data. Drug Saf 2000; 22:361-371
305. Halperin IJ, Kumar SS, Stroup DF, Laredo SE. The association between the
combined oral contraceptive pill and insulin resistance, dysgylcaemia and
dyslipidaemia in women with polycystic ovary syndrome: a systematic review and
meta-analysis of observational studies. Hum Reprod 2010 26; 191-201
306. Barber TM, Hazell M, Christodoulides C, Golding SJ, Alvey C, Burling K,
Vidal-Puig A, Groome NP, Wass JAH, Franks S et al. Serum levels of retinol-
binding protein 4 and adiponectin in women with polycystic ovary syndrome:
associations with visceral fat but no evidence for fat mass-independent effects on
pathogenesis in this condition. J Clin Endocrinol Metab 2008; 93:2859-2865
307. Orio F Jr, Palomba S, Cascella T, Milan G, Mioni R, Pagano C, Zullo F,
Colao A, Lombardi G, Vettor R. Adiponectin levels in women with polycystic ovary
syndrome. J Clin Endocrinol Metab 2003; 88:2619-2623
308. Meyer LM, Ciaraldi TP, Henry RR, Wittgrove AC, Phillips SA. Adipose
tissue depot and cell size dependency of adiponectin synthesis and secretion in
human obesity. Adipocyte 2013; 2:217-226
309. Saranya K, Pal GK, Habeebullah S, Pal P. Assessment of cardiovascular
autonomic function in patients with polycystic ovary syndrome. Journal of
Obstetrics and Gynaecology Research. 2014; 40:192-199
310. Vaněčková I, Maletínská L, Behuliak M, Nagelová V, Zicha J, Kuneš J.
Obesity-related hypertension: possible pathophysiological mechanisms. J
Endocrinol 2014; 223: R63-R78
192
311. The Reference Values for Arterial Stiffness’ Collaboration. Determinants of
pulse wave velocity in healthy people and in presence of cardiovascular risk factors;
‘establishing normal and reference values’. Eur Heart J 2010; 31:2338-2350
312. Kosmala W, O’Moore-Sullivan TM, Plaksej R, Kuliczkowska-Plaksej J,
Przewlocka-Kosmala M, Marwick TH. Subclinical impairment of left ventricular
function in young obese women; contributions of polycystic ovary disease and
insulin resistance. J Clin Endocrinol Metab 2008; 93: 3748-3754
313. Tyrrell-Sutton K, Newman A, Simonsick EM, Havlik R, Pahor M, Lakatta E,
Spurgeon H, Vaitkevicius P for the Health ABC Invesitgators. Aortic Stiffness is
associated with visceral adiposity in older adults enrolled in the study of health,
aging and body composition. Hypertension 2001; 38:429-433
314. Sakuragi S, Abhayaratna K, Gravenmaker KJ, O’Reilly C, Srikusalanukul W,
Budge MM, Teford RD, Abhayaratna WP. Influence of adiposity ad physical
activity on arterial stiffness in healthy children. The lifestyle of our kids survey.
Hypertension 2009; 53:611-616
315. Stehouwer CD, Henry RM, Ferreira I. Arterial stiffness in diabetes and the
metabolic syndrome: a pathway to cardiovascular disease. Diabetologia 2008;
51:527-539
316. Wild RA, Carmina E, Diamanti-Kandarakis E, et al. Assessment of
cardiovascular risk and prevention of cardiovascular disease in women with the
polycystic ovary syndrome: a consensus statement by the Androgen Excess and
Polycystic Ovary Syndrome (AE-PCOS) Society. J Clin Endocrinol Metabol 2010;
95:2038–49
317. Moran LJ, Noakes M, Clifton PM, Tomlinson L, Galletly C, Norman RJ.
Dietary composition in restoring reproductive and metabolic physiology in

193
overweight women with polycystic ovary syndrome. J Clin Endocrinol Metab 2003;
88:812-9.
318. Mehrabani HH, Salehpour S, Amiri Z, Farahani SJ, Meyer BJ, Tahbaz F.
Beneficial effects of a high-protein, low-glycemic-load hypocaloric diet in
overweight and obese women with polycystic ovary syndrome: a randomized
controlled intervention study. J Am Coll Nutr 2012; 31:117-25
319. Palomba S, Giallauria F, Falbo A, Russo T, Oppedisano R, Tolino A, Colao
A, Vigorito C, Zullo F, Orio F. Structured exercise training programme versus
hypocaloric hyperproteic diet in obese polycystic ovary syndrome patients with
anovulatory infertility: a 24 week pilot. Hum Reprod 2008; 23:642-650
320. Hutchinson SK, Stepto NK, Harrison C, Moran LJ, Strauss BJ, Teede HJ.
Effects of exercise on insulin resistance and body composition in overweight and
obese women with and without polycystic ovary syndrome. J Clin Endocrinol
Metab 2011; 96:E48-E56
321. Moran LJ, Hutchison SK, Norman RJ, Teede HJ. Lifestyle changes in
women with polycystic ovary syndrome. Cochrane Database Syst Rev. 2011; Jul
6:CD007506. doi: 10.1002/14651858.CD007506.pub3.
322. Haqq L, McFarlane J, Dieberg G, Smart N. The Effect of Lifestyle
Intervention on Body Composition, Glycaemic Control and Cardio-Respiratory
Fitness in Women With Polycystic Ovarian Syndrome: A Systematic Review and
Meta-Analysis. Int J Sport Nutr Exerc Metab 2014 Mar 25.
323. Sprung VS, Cuthbertson DJ, Pugh CJ, Aziz N, Kemp GJ, Daousi C,
Green DJ, Cable NT, Jones H. Exercise training in polycystic ovarian
syndrome enhances flow-mediated dilation in the absence of changes in
fatness. Med Sci Sports Exerc. 2013; 45:2234-42.

194
324. Sprung VS, Cuthbertson DJ, Pugh CJ, Azziz N, Kemp GJ, Daousi C,
Green DJ, Cable NT, Jones H. Nitric-oxide mediated cutaneous
microvascular function is impaired in polycystic ovary syndrome but can be
improved by exercise training. J Physiol 2013; 591: 1475-1487
325. Vigorito C, Giallauria F, Palomba S, et al. Beneficial effects of a
three-month structured exercise training program on cardiopulmonary
functional capacity in young women with polycystic ovary syndrome. J Clin
Endocrinol Metabol 2007; 92:1379–84
326. V. Jayagopal, E. S. Kilpatrick, S. Holding, P. E. Jennings, and S. L.
Atkin. Orlistat Is as Beneficial as Metformin in the Treatment of Polycystic
Ovarian Syndrome. J Clin Endocrinol Metab 2005; 90:729-733
327. Rasmussen CB, Lindenberg S. The effect of liraglutide on weight
loss in women with polycystic ovary syndrome: an observational study.
Frontiers in Endocrinology 2014; 5:1-6
328. Jensterle M, Kocjan T, Pfeifer M, Janez A. Short-term intervention
with liraglutide improved eating behaviour in obese women with polycystic
ovary syndrome. Endocr Res 2014; 20:1-6
329. Jensterle SM, Kocjan T, Pfeifer M, Kravos NA, Janez A. Short-term
combined treatment with liraglutide and metformin leads to significant
weight loss in obese women with polycystic ovary syndrome and previous
poor response to metformin. Eur J Endocrinol 2014; 170:451-459
330. Kahal H, Abouda G, Rigby AS, Coady AM, Kilpatrick ES, Atkin SL.
Glucagon-like peptide-1 analogue, liraglutide, improves liver fibrosis
markers in obese women with polycystic ovary syndrome and non-alcoholic
fatty liver disease. Clin Endocrinol 2014; 81:523-528

195
331. Elkind-Hirsch K, Marrioneaux O, Bhushan M, Vernor D, Bhushan R.
Comparison of Single and Combined Treatment with Exenatide and Metformin
on Menstrual Cyclicity in Overweight Women with Polycystic Ovary Syndrome.
J Clin Endocrinol Metab 2008; 93:2670-2678
332. Agarwal N, Rice SPL, Bolusani H, Luzio SD, Dunseath G, Ludgate
M, Rees DA. Metformin reduces arterial stiffness and improves endothelial
function in young women with polycystic ovary syndrome: a randomised,
placebo-controlled, crossover trial. J Clin Endocrinol Metab 2010; 95:722-
730
333. Glintborg D, Altinok ML, Mumm H, Hermann AP, Ravn P, Andersen
M. Body composition is improved during 12 months' treatment with
metformin alone or combined with oral contraceptives compared with
treatment with oral contraceptives in polycystic ovary syndrome. J Clin
Endocrinol Metab. 2014; 99:2584-91.
334. Lord J, Thomas R, Fox B, Acharya U, Wilkin T. The effect of
metformin on fat distribution and the metabolic syndrome in women with
polycystic ovary syndrome – a randomised, double-blind, placebo controlled
trial. BJOG 2006; 113:817-824
335. Diamanti-Kandarakis E, Alexandraki K, Protogerou A, Piperi C,
Papamichael C, Aessopos A, Lekakis J, Mavrikakis. Metformin
administration improves endothelial function in women with polycystic
ovary syndrome. Eur J Endocrinol 2005; 152:269-275

196
336. Sharma ST, Wickham 3rd
EP, Nestler JE. Changes in glucose
tolerance with metformin treatment in polycystic ovary syndrome: a
retrospective analyses. Endocr Pract 2007 13; 373-379
337. Morin-Papunen L, Rautio K, Ruokonen A, Hedberg P, Puukka M,
Tapanainen JS. Metformin reduces serum C-reactive protein levels in
women with polycystic ovary syndrome. J Clin Endocrinol Metb 2003;
88:4649-4654