cardinal ethanol, llc annual meeting - amazon...
TRANSCRIPT

Cardinal Ethanol, LLCAnnual MeetingFebruary 14, 2017

http://ethanolrfa.org/consumers/why-is-ethanol-important/
Why Ethanol Is Important

Welcome & Call to Order
Mr. Rob DavisChairman of the Board

This presentation contains forward-looking statements within themeaning of Section 27A of the Securities Act of 1933 and Section 21Eof the Securities Exchange Act of 1934. Such statements can beidentified by use of forward-looking terminology such as “project,”“may,” “expect,” “estimate,” “anticipate” or “continue” or thenegative thereof or other variations thereon or comparableterminology. You are cautioned that there are certain risks anduncertainties that could cause actual events or results to differmaterially from those referred to in such forward-looking statements.These risks and uncertainties are described in our filings with theSecurities and Exchange Commission.
Disclaimer

• In fairness to all participants and in the interest of an orderly and constructive meeting, the following rules of conduct will be followed:
• No cameras, audio or video recording equipment.• The meeting will follow the schedule set forth on the Agenda.• Only unit holders of record as of December 28, 2016 or their duly
authorized proxies are entitled to vote or to address the meeting.• No proposals or nominations were timely submitted.• You need not vote at this meeting if you have already voted by
proxy.• All questions and comments must be directed to the Chairman. • Each speaker is limited to a total of three (3) questions or comments
of no more than three (3) minutes each.
Rules of Conduct

Agenda Welcome, Call to Order, Why Ethanol is Important Rob Davis
Rules of Conduct, Introduce Guests Rob Davis
Minutes of February 2016 Annual Meeting (Needs Approval Vote) Tom Chronister
Election of Directors, Final Voting, Close Voting Rob Davis
Renewable Fuels Standard Rob Davis
Chairman Comments Rob Davis
Review of Financial Statements FY 2016 & Q1 2017 Bob Baker
CEO Comments Jeff Painter
Cardinal Q&A Rob Davis
Brian Jennings from ACE Jeff Painter
ACE Q&A Brian Jennings
Election Results Rob Davis
Adjourn Cardinal Business Meeting Rob Davis

Minutes of 2016 Annual Meeting
Mr. Tom ChronisterSecretary of the Board

Elections of Directors
Mr. Rob DavisChairman of the Board

Renewable Fuels Standard
https://www.youtube.com/watch?v=CWUpZDVSasM

Cardinal Ethanol Story2008 through 2016

0.00
20,000,000.00
40,000,000.00
60,000,000.00
80,000,000.00
100,000,000.00
120,000,000.00
140,000,000.00
2008 2009 2010 2011 2012 2013 2014 2015 2016
Ethanol Gallons Produced

0.00
100.00
200.00
300.00
400.00
500.00
600.00
700.00
800.00
900.00
1,000.00
2008 2009 2010 2011 2012 2013 2014 2015 2016
Cumulative Ethanol Gallons
Reach 1 Billion Gallons Sold in 2017

2.74
2.76
2.78
2.80
2.82
2.84
2.86
2.88
2.90
2010 2011 2012 2013 2014 2015 2016
Average Ethanol Yield Per Bushel Ground

0.00
500,000.00
1,000,000.00
1,500,000.00
2,000,000.00
2,500,000.00
3,000,000.00
3,500,000.00
4,000,000.00
4,500,000.00
5,000,000.00
2008 2009 2010 2011 2012 2013 2014 2015 2016
Corn Oil Galllons Produced

0.00
5,000,000.00
10,000,000.00
15,000,000.00
20,000,000.00
25,000,000.00
30,000,000.00
35,000,000.00
40,000,000.00
45,000,000.00
2008 2009 2010 2011 2012 2013 2014 2015 2016
Corn Bushels Ground

Capital Investments – Your $ at Work2008/2009 $169.0 million Built Plant 2010 $ 3.8 million 1st Grain Bin; Bin sweeps, Pavilion 2011 $ 0.7 million Misc Improvements2012 $ 1.2 million Corn Oil Tank; Alfa Laval Exch; CIP2013 $ 0.9 million Hammer Mill Upgrade2014 $ 4.0 million 1 Grain Bin2015 $ 10.5 million Grain Dryer, 2 Grain Bins, Pits2016 $ 6.9 million 2nd Boiler; Hammer Mills; Sieve Bottles; 2017 proj $ 15.0 million Soybeans; 4th Rail Loop; Fermenter
TOTAL $212 million

0.00
2,000.00
4,000.00
6,000.00
8,000.00
10,000.00
12,000.00
14,000.00
16,000.00
2008 2009 2010 2011 2012 2013 2014 2015 2016
Unit Value
Book
Average value traded on FNC Agstock

0.00
2,000.00
4,000.00
6,000.00
8,000.00
10,000.00
12,000.00
2008 2009 2010 2011 2012 2013 2014 2015 2016
Cumulative Distributions
Total
Net
$11,149
$6,865

Mr. Robert Baker, CPAFinance Committee Chairman
FY16 & 1st Qrt FY 17 Results
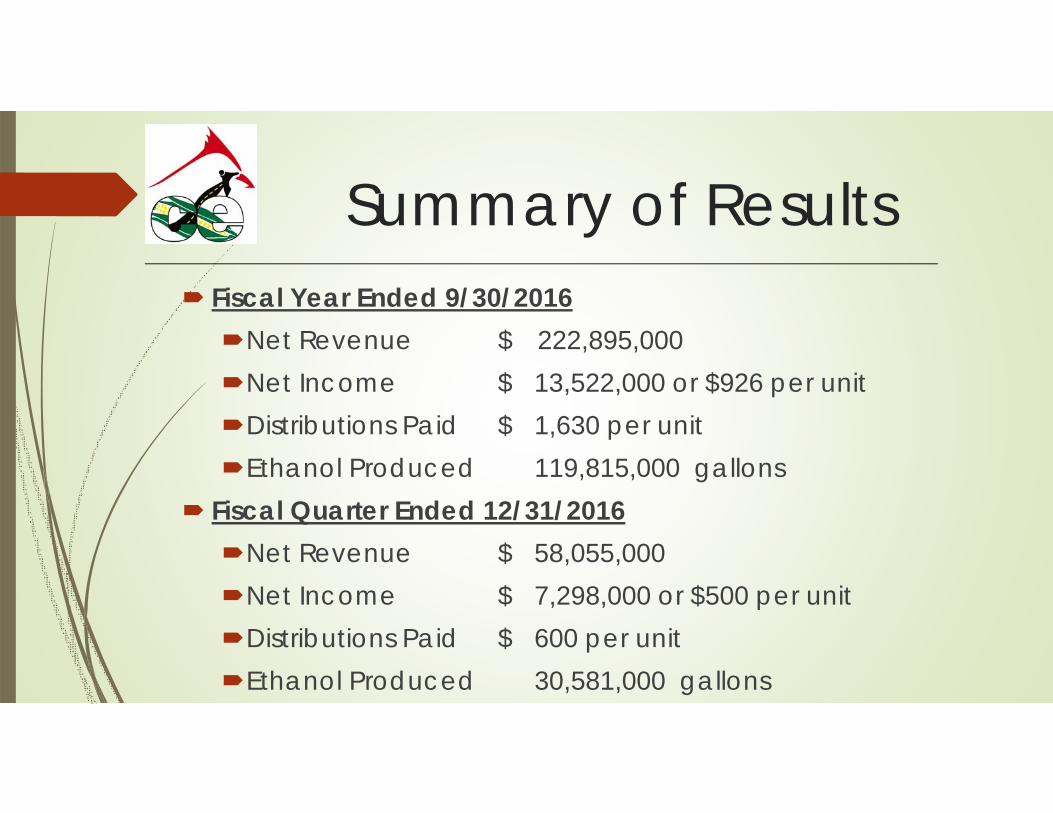
Fiscal Year Ended 9/30/2016Net Revenue $ 222,895,000Net Income $ 13,522,000 or $926 per unitDistributions Paid $ 1,630 per unitEthanol Produced 119,815,000 gallons
Fiscal Quarter Ended 12/31/2016Net Revenue $ 58,055,000Net Income $ 7,298,000 or $500 per unitDistributions Paid $ 600 per unitEthanol Produced 30,581,000 gallons
Summary of Results
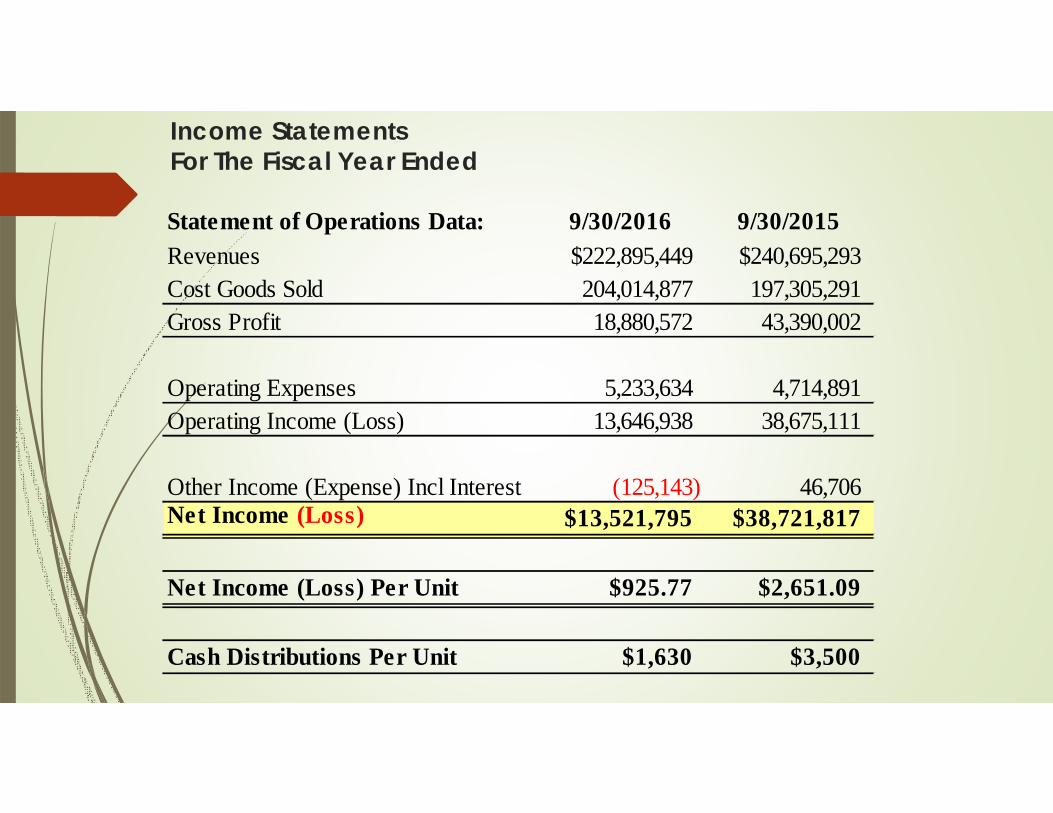
Income StatementsFor The Fiscal Year Ended
Statement of Operations Data: 9/30/2016 9/30/2015Revenues $222,895,449 $240,695,293Cost Goods Sold 204,014,877 197,305,291Gross Profit 18,880,572 43,390,002
Operating Expenses 5,233,634 4,714,891Operating Income (Loss) 13,646,938 38,675,111
Other Income (Expense) Incl Interest (125,143) 46,706Net Income (Loss) $13,521,795 $38,721,817
Net Income (Loss) Per Unit $925.77 $2,651.09
Cash Distributions Per Unit $1,630 $3,500
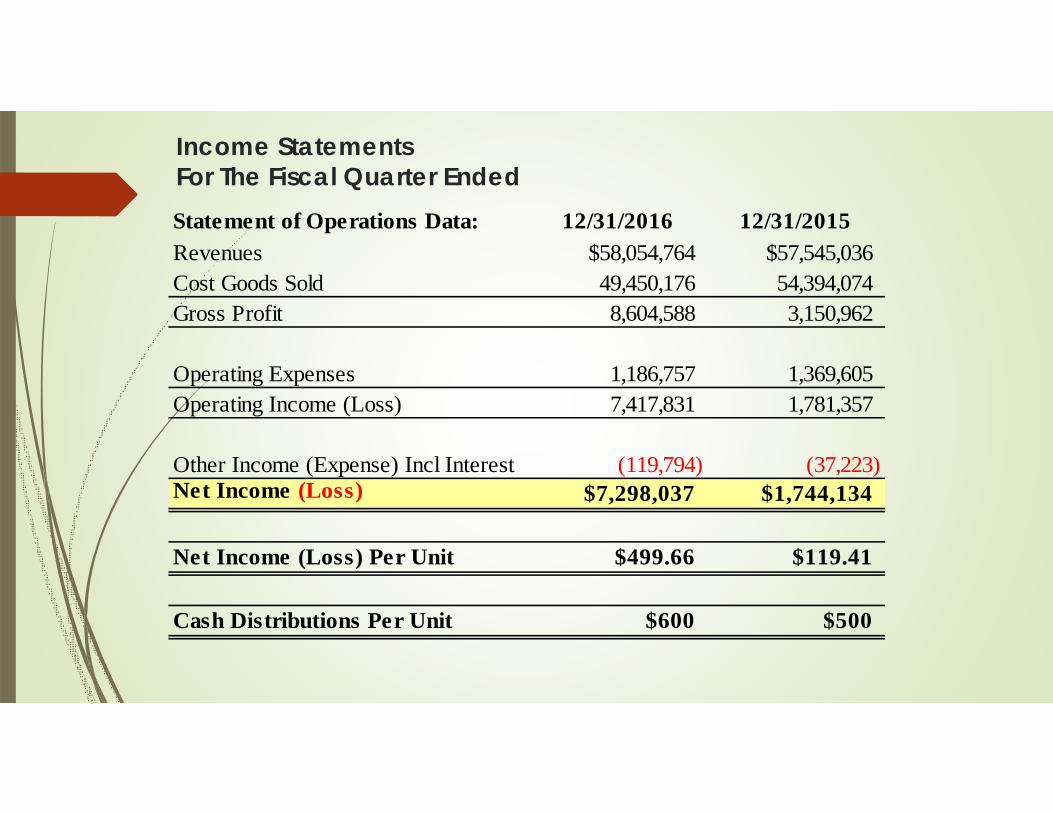
Income StatementsFor The Fiscal Quarter EndedStatement of Operations Data: 12/31/2016 12/31/2015Revenues $58,054,764 $57,545,036Cost Goods Sold 49,450,176 54,394,074Gross Profit 8,604,588 3,150,962
Operating Expenses 1,186,757 1,369,605Operating Income (Loss) 7,417,831 1,781,357
Other Income (Expense) Incl Interest (119,794) (37,223)Net Income (Loss) $7,298,037 $1,744,134
Net Income (Loss) Per Unit $499.66 $119.41
Cash Distributions Per Unit $600 $500

How Does This Affect The Members’ Taxes?
Quarter ended 12/31/13 (1,744,134)Book net income 1/1/15-12/31/15 $19,075,698 $1,306
Total Permanent Differences 61,758 $4
Temporary Differences Depreciation/Recapture (593,152) Unrealized Loss on Hedging 637,155 Other Temporary Differences (8,318)Total Temporary Differences 35,685 $2Taxable Income $19,173,141 $1,313
Taxable (Income) Deductions Passed Thru Separately Interest Income (250) Rental Real Estate Income (10,300) ($1) Other 0 $0 Total Taxable (Income) Deductions Passed Thru Sep (10,550)Ordinary Income Passed Through on K-1's $19,162,591 $1,312
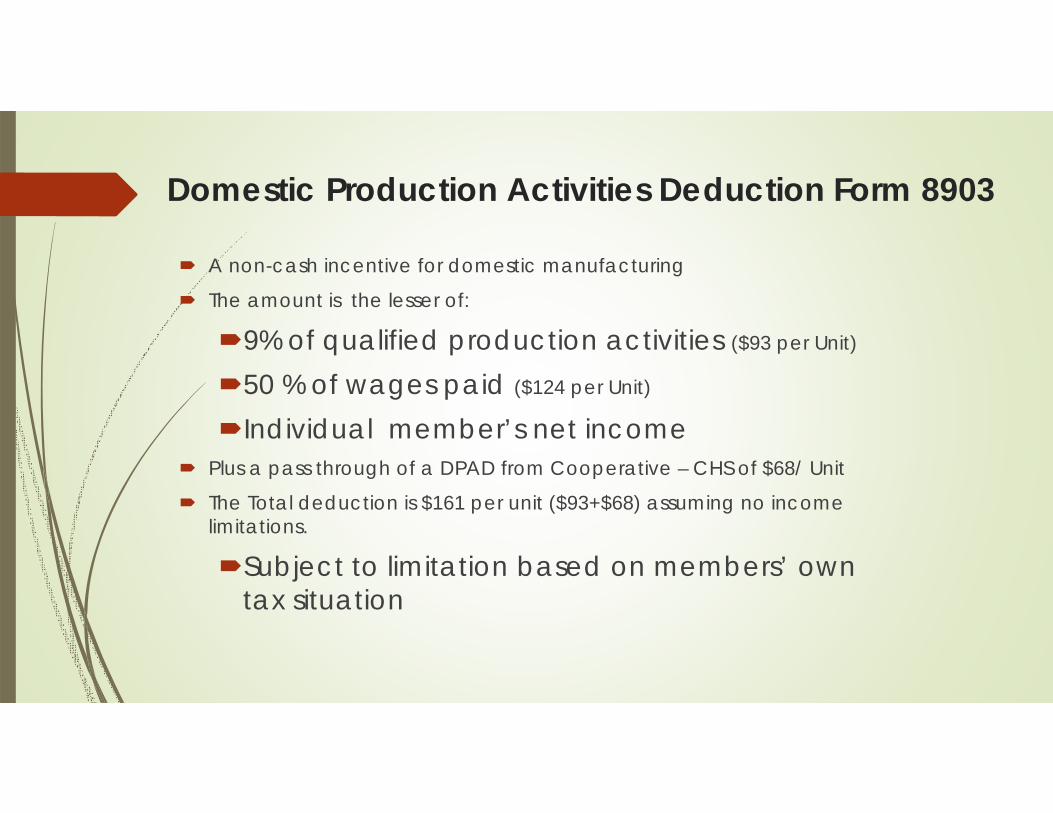
Domestic Production Activities Deduction Form 8903
A non-cash incentive for domestic manufacturing
The amount is the lesser of:
9% of qualified production activities ($93 per Unit)
50 % of wages paid ($124 per Unit)
Individual member’s net income Plus a pass through of a DPAD from Cooperative – CHS of $68/ Unit
The Total deduction is $161 per unit ($93+$68) assuming no income limitations.
Subject to limitation based on members’ own tax situation


Revenue Sources As A Percent of Total Revenues

Balance SheetsAs Of
9/30/2016 9/30/2015
Current Assets $48,530,000 $48,647,000
Net Property and Equipment 104,461,000 107,998,000
Other Assets 938,000 823,000
$153,929,000 $157,468,000
Current Liabilities 11,677,000 $11,997,000
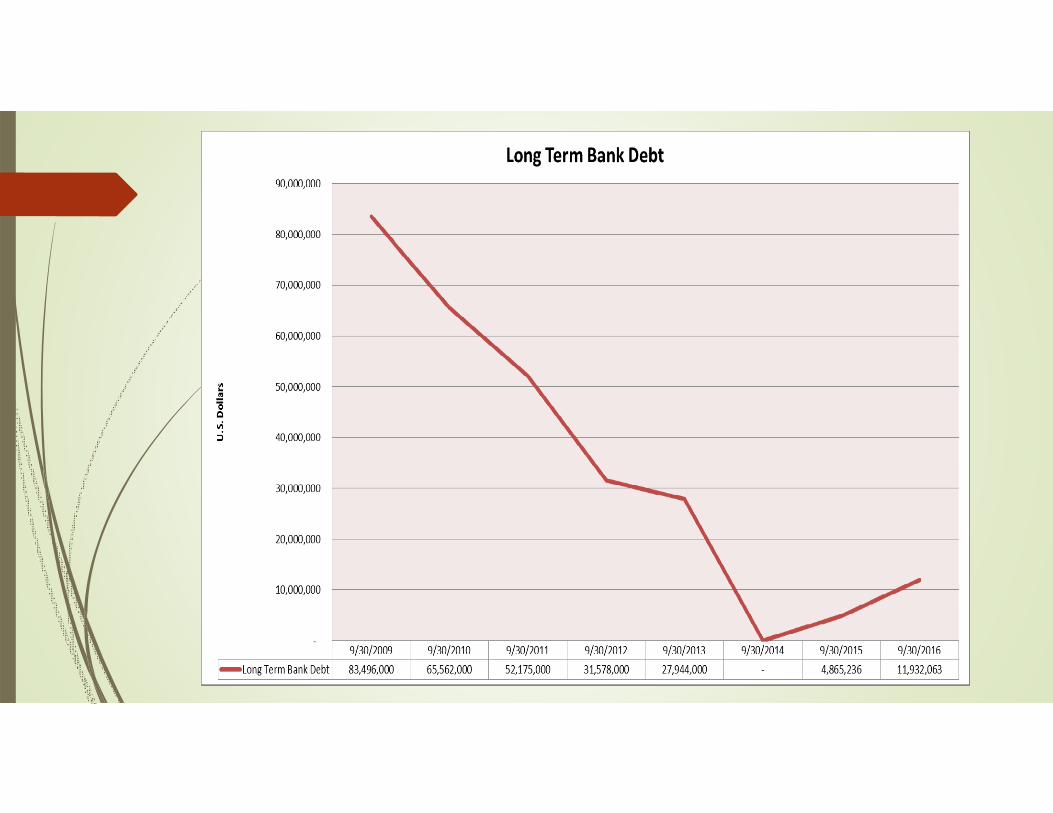
Long-Term Debt 11,932,000 4,865,000
Other Liabilities 0 0
Members' Equity 130,320,000 $140,606,000
$153,929,000 $157,468,000
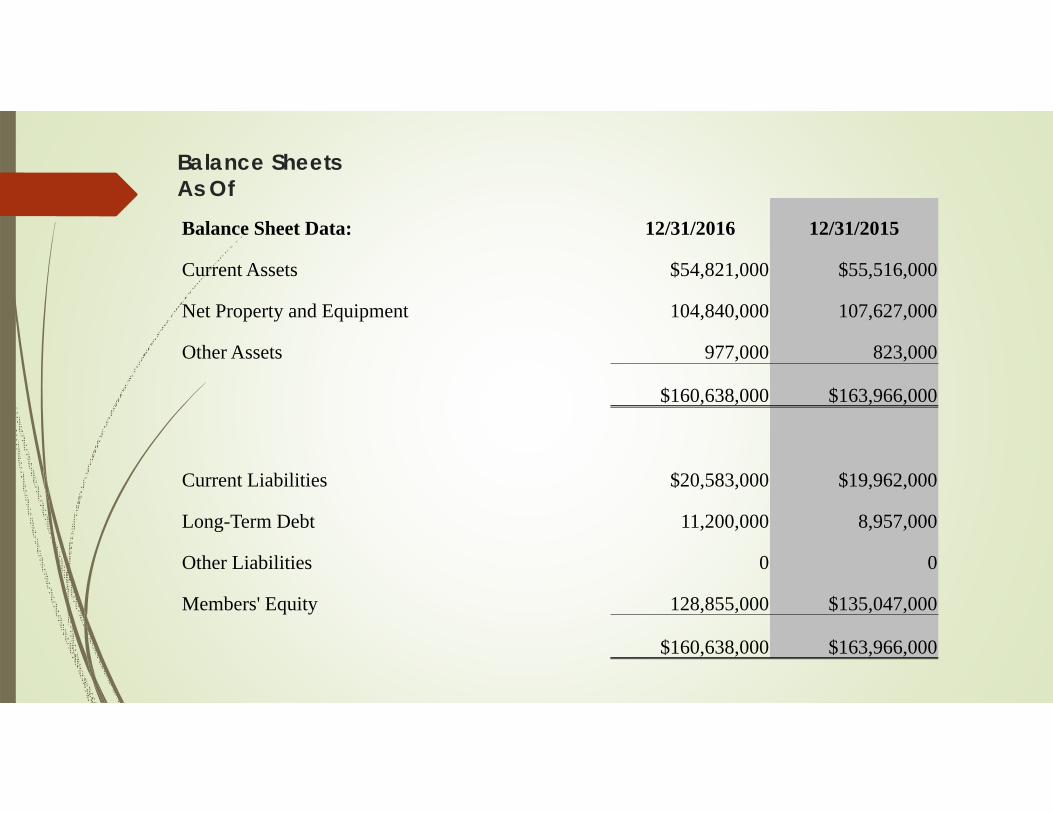
Balance SheetsAs OfBalance Sheet Data: 12/31/2016 12/31/2015
Current Assets $54,821,000 $55,516,000
Net Property and Equipment 104,840,000 107,627,000
Other Assets 977,000 823,000
$160,638,000 $163,966,000
Current Liabilities $20,583,000 $19,962,000
Long-Term Debt 11,200,000 8,957,000
Other Liabilities 0 0
Members' Equity 128,855,000 $135,047,000
$160,638,000 $163,966,000

$4,559
$5,864
$7,690 $7,483
$9,002
$10,061
$9,627
$8,922
$0 $60 $60
$490 $872
$5,419
$8,919
$10,549
$0
$2,000
$4,000
$6,000
$8,000
$10,000
$12,000
9/30/2009 9/30/2010 9/30/2011 9/30/2012 9/30/2013 9/30/2014 9/30/2015 9/30/2016
Members Equity ‐ Book Value Per UnitInvestors (Equity) Cumulative Cash Distributions Per Unit


Statements of Cash FlowsFYE 9/30/2016 FQE 12/31/16
Net cash provided (used) by operations 22,958,196$ 11,576,814$
Investing ActivitiesPurchases of Property & Equipment (6,931,007)$ (2,356,378)$ Net cash provided (used) by investing activities (6,931,007)$ (2,356,378)$
Financing ActivitiesProceeds From Long Term Debt 10,134,764$ -$ Payments on Long TermDebt (179,647)$ (713,897)$ Distributions To Members (23,807,781)$ (8,763,600)$ Net cash provided (used) by financing activities (13,852,664)$ (9,477,497)$
Net increase/(decrease) in cash 2,174,525$ (257,061)$ Cash at beginning of period 20,827,614$ 23,002,139$ Cash at end of period 23,002,139$ 22,745,078$

How Was Cash Flow Used?Fiscal Year Ended 9/30/2016Cash At Start Of Year $ 20,828,000Operating Cash Flow $ 22,958,000 Long Term Borrowing $ 10,135,000Total Available For Use $ 53,921,000
12.85%
44.15%
42.66%
Capital Expenditures Distributions to Members Retained Cash

How Was Cash Flow Used?Fiscal Quarter Ended 12/31/2016Cash At Start Of Quarter $23,002,000Operating Cash Flow $11,577,000Total Available For Use $34,579,000
Approx. $7 Million was retained to pay deferred payments to farmers on January 3, 2017
6.81%
25.34%
65.78%
Capital Expenditures Distributions to Members Retained Cash
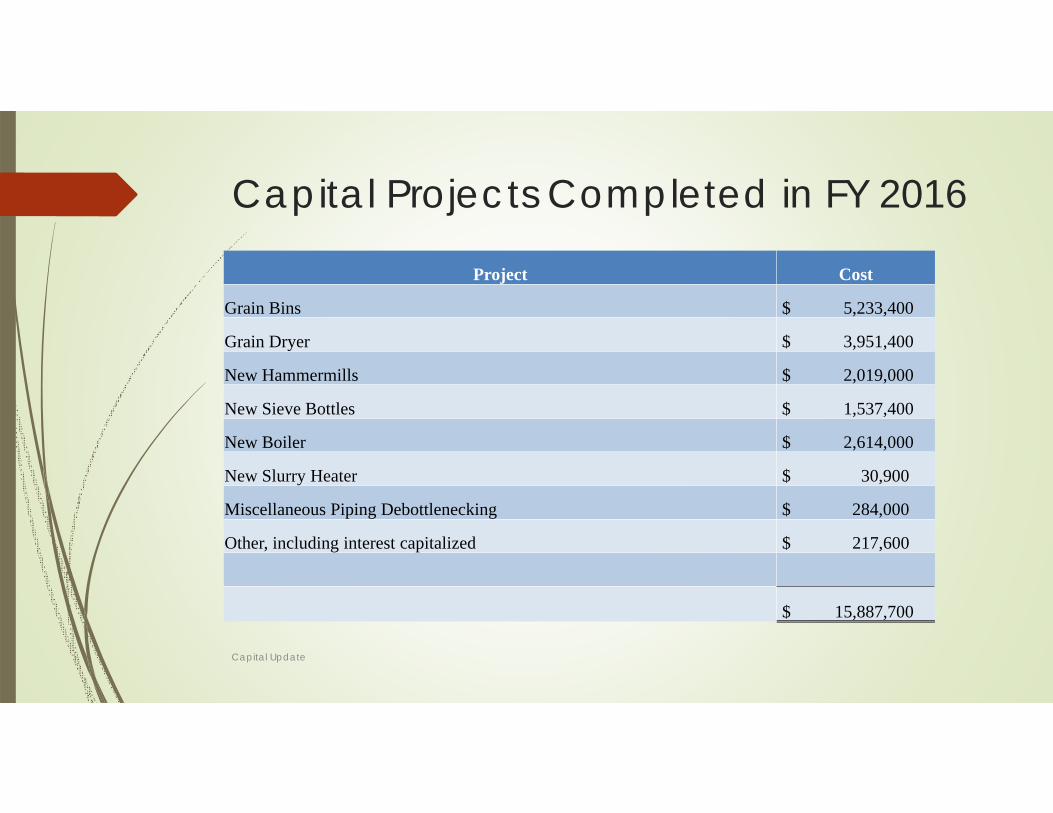
Capital Projects Completed in FY 2016
Capital Update
Project Cost
Grain Bins $ 5,233,400
Grain Dryer $ 3,951,400
New Hammermills $ 2,019,000
New Sieve Bottles $ 1,537,400
New Boiler $ 2,614,000
New Slurry Heater $ 30,900
Miscellaneous Piping Debottlenecking $ 284,000
Other, including interest capitalized $ 217,600
$ 15,887,700

Major Capital Projects Planned For FY 2017
Capital Update
Project Cost
Grain Load Out Facility $ 9,274,000
New Fermenter $ 2,855,400
Additional Cooling Tower Cell $ 1,045,000
DDGS Dryer Reinforcement $ 600,000
Beer Degasser $ 455,400
Roadway Extension $ 500,000
Other Piping and Conveyor Improvements $ 240,000
(Grain Load Out Facility will be financed with long term debt.)
$ 14,969,800

$XXX per unit for members of record today.
February 2017 Distribution

CEO Comments
Mr. Jeff PainterCEO

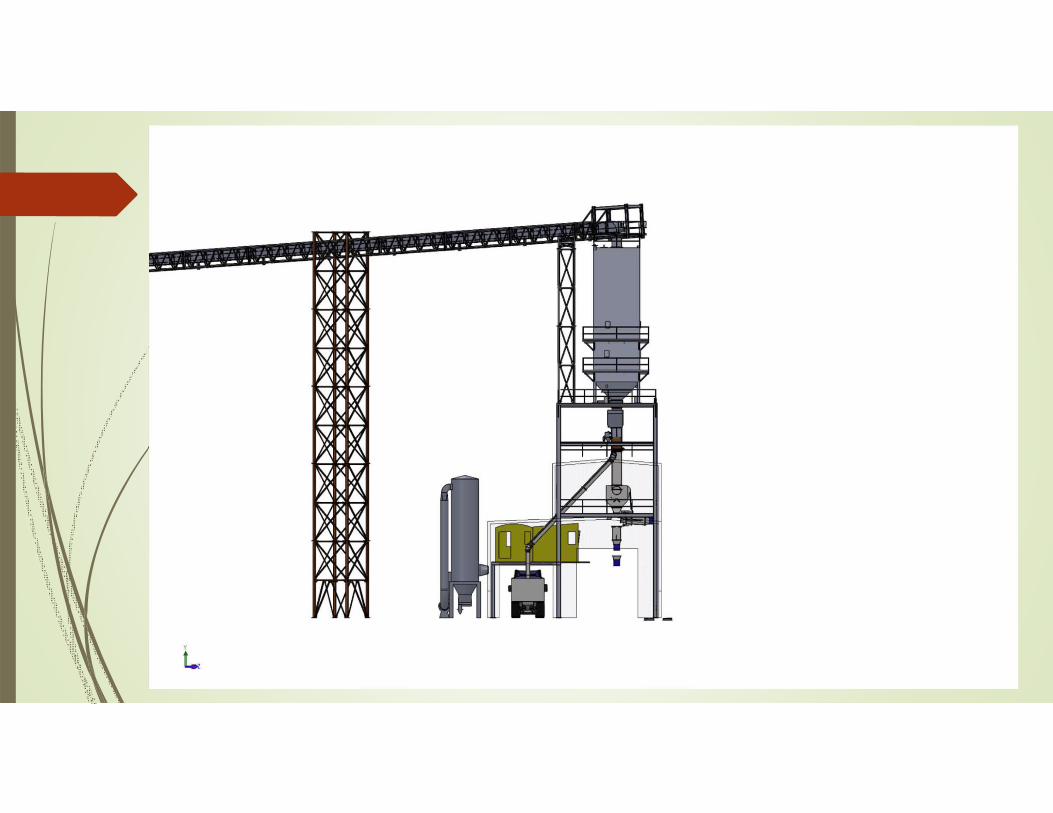
Bins

Hammermills and Sieves


Cardinal Q&A
Mr. Rob DavisChairman of the Board

Guest Speaker
Mr. Brian JenningsACE
https://ethanol.org/people/video-gallery
Election Results
Mr. Rob DavisChairman of the Board