cardiac monitoring and electrocardiography essentials€¦ · a. positive wide-qrs . of 0.011 sec....
TRANSCRIPT

Cardiac Monitoring and
Electrocardiography
Essentials
Joseph Ponce De Leon, ECGI-BC, ECG-BC, CMT-BC
Copyright © 2019 ABCM All rights
reserved

5 Lead Electrode Placement
• RA
Right infraclavicular fossa medial to the border of
the deltoid muscle and 2 cm below the lower
border of the clavicle
• LA
Left infraclavicular fossa medial to the border of
the deltoid muscle and 2 cm below the lower
border of the clavicle
• C
Right 4th
intercostal space at the sternal border
• RL
Right anterior axillary line, halfway between the
costal margin and the crest of the ilium.
• LL
Left anterior axillary line, halfway between the
costal margin and the crest of the ilium.
Copyright © 2019 ABCM All rights reserved

Chest Lead Placement
V1 4th Intercostal Space, Right Sternal Border
(abbreviated 4th ICS at RSB)
V2 4th Intercostal Space, Left Sternal Border
(abbreviated 4th ICS at LSB)
V3 ½ of the distance between V2 and V4
V4 5th Intercostal space, Midclavicular Line
V5 Same horizontal plane as V4, in the anterior
axillary line
V6 Same horizontal plane as V4, in the
midaxillary line
1st
2nd
3rd
4th
5th
Intercostal
space
Copyright © 2019 ABCM All rights reserved

Move V1 to V4R Move V2 to V5R Move V3 to V6R
B
Using a standard 12-lead ECG machine, record a 12-lead ECG, then re-arrange the precordial leads
as seen in the diagrams below: A) to record the right ventricular (RV) surface, and B) to record the
posterior surface. Run the 12-lead again with the leads in these positions and remember to re-label
leads V1-V3 as V4R, V5R, and V6R. Also be sure to re-label V4-V6 as V7, V8, and V9.
A) Right Ventricular Leads B) Posterior Leads
Move V4 to V7 Move V5 to V8 Move V6 to V9
36. Obtaining the 18-Lead ECG
V5RV6R V4R
Copyright © 2019 ABCM All rights reserved

Lateral wall (I, aVL, & V5 & 6) Septum (V1 &2 )
Inferior wall (II, III & aVF) Anterior wall (V3 & 4)
Contiguous Leads
Copyright © 2019 ABCM All rights reserved

Correct Lead Placement
V1 V2 V3 V4 V5 V6
Copyright © 2019 ABCM All rights reserved

Incorrect Lead Placement
V1 V2 V3 V4 V5 V6
Copyright © 2019 ABCM All rights reserved

Onset of wide QRS complex
tachycardia shows a taller right
peak pattern in lead V1, unhelpful
in distinguishing between
ventricular tachycardia and
supraventricular tachycardia with
aberrant conduction.
Examination of the patient
revealed V1 electrode misplaced
to 5th rather than the 4th intercostal
space
After lead placement corrected,
another episode of wide QRS
complex tachycardia showed a
taller left peak pattern in lead V1,
strongly suggestive of ventricular
tachycardia.
Subsequently, invasive cardiac
electrophysiological study
confirmed patient had ventricular
tachycardia.
Correct Lead Placement
Copyright © 2019 ABCM All rights reserved

Normal shape of V1
1st gold standard lead for identifying wide QRS patternsPrecordial Chest Leads
+
Lead V1 Normal Shapes
P Waves: inverted, upright or diphasicQRS Complexes: inverted rST Waves: gently inverted U Waves: upright
+
Diagnostic Yield:
1. Disturbances of rhythm with wide-QRS complex patterns
2. Sinus, atrial, & junctional rhythms
3. Pacemaker troubleshooting f or lead perf oration
4. Indicativ e changes f or Anterior and Septal wall of LV
5. Indicativ e changes f or right v entricular MI (pref er V3R, V4R, V5R)
6. Reciprocal changes for posterior wall MI (pref er V7, V8, V9)
7. Suggestiv e in v entricular hy pertrophy
1st Gold
Standard Lead
for Identification
of Wide-QRS
Patterns
•P waves: inverted, upright or biphasic
•QRS complex: inverted rS
•T waves: gently inverted
Lead V1
1
V1 Standard
Copyright © 2019 ABCM All rights reserved

Normal shape of V6
2nd gold standard lead for identifying wide QRS patterns
•P waves: upright
•QRS complex: upright qRs
•T waves: upright
6
Lead V6
V6 Standard
Copyright © 2019 ABCM All rights reserved

BBB Summary
V1 V6
Normal
RBBB
LBBB
Copyright © 2019 ABCM All rights reserved

❖ Incomplete bundle branch block begins when the QRS measures 0.10-0.11 sec. (the normal QRS width is between 0.05-0.09 sec).
Bundle Branch Block may be Complete or Incomplete:
❖ Complete right bundle branch block measures slightly less than complete left bundle branch
block and begins when the QRS measures 0.11 sec. or greater, whereas complete left bundle
branch block begins when the QRS measures 0.12 sec. or greater.
0.13 secLBBBV1
RBBB
V1 0.10 sec
LBBBV1
0.10 sec
RBBB V1 0.12 sec
Copyright © 2019 ABCM All rights reserved

Summary of the 3 Causes of Positive Wide-QRS in V1 (Remember to employ V6 for help)
Right Bundle Branch Block Lt. Ventricular Ectopy Wolff-Parkinson-White
V1 V1
V6 V6
V1
V6
rsR’
qRs
R
Q
Rs
“Short P-
R,
Slur of
Initial part
of R wave”
qRs
Copyright © 2019 ABCM All rights reserved

Right Bundle Branch Block Morphology in V6 and Lead 1
V6 or her near equivalent MCL6, and lead I
A. Positive wide-qRs of 0.011 sec. or greater,
creating a triphasic pattern with the telltale
wide s wave (normal s waves are very
narrow and shallow).
B. Standard lead I will look similar to V6
because the positive electrode for both
leads is on the left side of the body creating
a qRs complex, with a widened “s” wave
like we see in V6.
C. The mimic of right bundle branch block is left
ventricular rhythms. Note: it is easy to tell
the difference in the positive triphasic
pattern created by RBBB in the first 2 beats
of V1, and the monophasic R with its left
peak taller in V1 (a common pattern seen in
many left ventricular rhythms); and
furthermore it is very easy to differentiate
the positive triphasic qRs pattern of RBBB
in the first 2 beats of V6, and the negative
wide-rS pattern of a left ventricular rhythm
in V6. Note: In the ventricular rhythm
there is opposite polarity of the QRS from
the normal shapes in V1 and V6: V1 should
be down and V6 should be up.
A
q
R
S
C
q
R
srS
Left VentricularRight BBB
R
q
R
s
IB
Copyright © 2019 ABCM All rights reserved

Right Bundle Branch Block Morphology
Seen in V1; there are three common patterns,
though slight variations in shape may occur:
A. Positive wide-rsR’ with late right peak,measures from 0.11 sec. and greater (most common pattern)
B. Positive monophasic R’ without the classic rsR’ pattern (keep in mind if there is a P wave in front of this positive wide-QRS it must be right bundle branch block. Note: you have your P and it is positive and wide).
C. Positive wide-qR pattern (initial “r” missing due to old anteroseptal injury wiping it out from death of the septal tissue, leaving the patient of a “q” wave from necrosis of tissue, followed by an R’ wave with a delayed right peak.
FYI: What all three patterns have in common is that they are allpositive and wide and can therefore mimic left ventricular rhythms(V6 and lead I are now needed to differentiate between supraVentricular rhythms with right bundle branch block and leftventricular rhythms before drug therapy can be considered (if adifferential diagnosis cannot be made, it is always safer tocardiovert a patient if the rhythm with this pattern is going fastenough to drop the blood pressure).
0.12 sec
q
R0.13 sec
q
R’
r
s
R’A
B
C
0.12 sec
R’
Copyright © 2019 ABCM All rights reserved

6 - Right Bundle Branch Block
1. Wide QRS
2. rsR’ in V1
3. qRs in V6 and lead I
Evidence:
Copyright © 2019 ABCM All rights reserved

6 - Supraventricular Tachycardia (SVT) with
Right Bundle Branch Block Aberration
1. QRS wide
2. rsR’ in V1
3. Rs (deep wide “s” wave) in V6 (often has
qRs)
4. rS in lead 1 (note the deep wide S wave)
Management: If unstable, administer
adenosine
rS rsR’
Rs
Evidence:
rSR’ in V1 and Rs in V6 & I
V1 V6 I
Copyright © 2019 ABCM All rights reserved

Try your hand at identifying the next few rhythms, you
should be able to easily identify each one.
Copyright © 2019 ABCM All rights reserved

Left Bundle Branch Block Morphology
V1 or MCL 1
A. QS pattern with slick down-stroke reaching
an early nadir (deepest point of the QRS) within
0.06 sec. (to measure the nadir, begin at the
beginning of QRS where it falls off the baseline,
and go straight down to its deepest point and
count the number of tiny boxes to this point).
One and a half tiny boxes = 0.06 sec. This is an
example of a premature atrial beat producing a
LBBB pattern which is often mistaken for a
ventricular rhythm; the ST elevation is probably
secondary to the deep QRS complex. The QS
pattern occurs in about 70-75% of LBBBs.
B. Negative wide rS pattern with slick down-
stroke reaching an early nadir within 0.06 sec.
The rS pattern occurs in about 25-30% of
LBBBs.
FYI: A minority of LBBB patterns will show a
slurring and or notching on the way down to the
deepest point and therefore which may be
confused with her mimic, right ventricular
rhythms, however this only happens in about
2-5% of LBBB patterns.
V1
Reached Nadir within 0.04 sec.
QRS interval0.13 sec.B
AQRS interval 0.12 sec.
Reached Nadir within 0.04 sec.
APBV1
Copyright © 2019 ABCM All rights reserved

8 - LBBB1
1. Wide QRS
2. QS in V1 with slick down-stroke to an early nadir within 0.06
sec.
3. R in V6 with a quick up-stroke to an early apex within 0.07 sec.
(seen in 75% of LBBB)
5. Has r in V1 indicating the RV was depolarized slightly before the
septum
6. Q in lead 1 and aVL indicating an old lateral wall MI
7. Deep QRS in V1-V3 with LBBB can produce a lift off the
baseline in the opposite direction mimicking an injury pattern.
8. Normal upward concavity of ST, with elevation in V1-V3 classic
of LBBB with deep QRS in V1-V3
Evidence:V1 V6
Copyright © 2019 ABCM All rights reserved

21
V6V1
RVE typically produces a negative wide QRS
in V1 with a delayed downstroke (often
slurred and notched) to a delayed nadir
(bottom peak) in V1 greater than 0.06 sec. If
there is an initial R wave be sure include it in
your measurement.
RVE: most of the time it produces a positive complex
in V6 as seen in example A above, and when it does,
it will have a delay up to the apex of greater than
0.07 seconds. Occassionally, RVE will have a
negative wide QRS in V6 like you see in example B
above, and when it does, don’t try to differentiate
anything, just assume it is ventricular.
0.10 sec.
11 - Morphologic Features of Right Ventricular Ectopy
rS
QSV6
A – Delay to apex
0.12 sec B
If V1 and V6 both have negative
complexes, this is known as
negative concordancy and almost
always indicates a ventricular
origin.
Copyright © 2019 ABCM All rights reserved

Copyright © 2019 ABCM All rights reserved
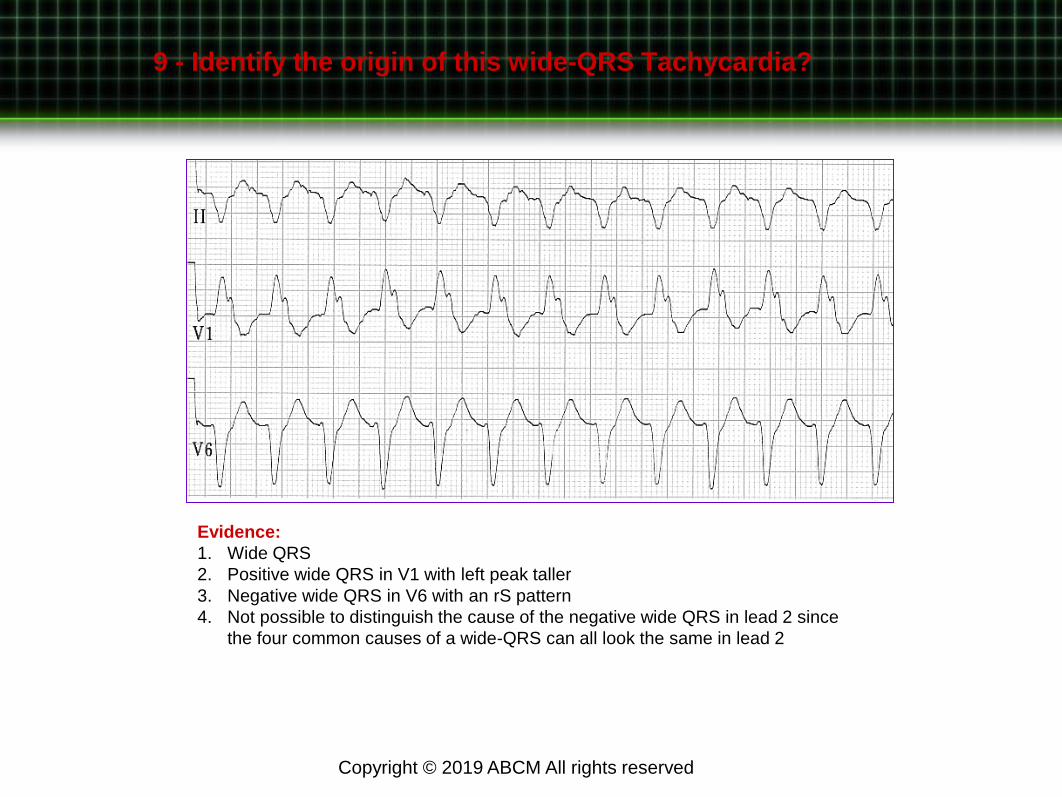
9 - Identify the origin of this wide-QRS Tachycardia?
Evidence:
1. Wide QRS
2. Positive wide QRS in V1 with left peak taller
3. Negative wide QRS in V6 with an rS pattern
4. Not possible to distinguish the cause of the negative wide QRS in lead 2 since
the four common causes of a wide-QRS can all look the same in lead 2
Copyright © 2019 ABCM All rights reserved

24
+V1
LVT +V6
The left ventricular
premature stimulus is traveling toward the positive pole of
V1 making a positive
wide-QRS complex.
The left ventricular premature stimulus is
traveling away from the positive pole of V6 making a negative
wide-QRS complex.
9 - Left Ventricular (LV) Beats or Rhythms
Left Ventricular Beats or Rhythm is one of Three Causes of a Positive Wide-QRS Complex in V1
Remember the basic principles of electricity: as current travels toward a positive electrode, a
positive waveform is inscribed on the graph paper, and likewise, when current travels away
from a positive electrode, a negative waveform is inscribed on the graph paper. A complete
reversal of polarity in V1 and V6 have occurred. Management: Administer Amiodarone or
cardiovert.
V6
Copyright © 2019 ABCM All rights reserved

Atrial Tachycardia
1. Three atrial premature beats (APBs or PACs) occur in a row, two with fairly normal conduction, while the third one is not conducted.
2. After another sinus conducted beat there is another run of three APBs or PACs (atrial tachycardia since there are three conduced in a row faster than 100 bpm)—although atrial tachycardia is generally much faster up to 240 bpm.
3. Note that these APBs or PACs are conduct with left bundle branch block aberration, and finally, one lone APB or PAC occurs at the end of the strip.
Don’t mistake the negative wide-QRSs as right ventricular tachycardia just because they are wide; look at the early P’ wave thatstarted the run, and the early nadir of the wide QRS measuring within 0.06 sec in a V1 lead.
V1
P’P’ P’ not conducted
Early nadir measuring 0.04 sec.
Copyright © 2019 ABCM All rights reserved

I. First degree AV block
A. All impulses are conducted
B. PR interval is prolonged to more than
0.20 second
C. Constant PR
PR interval 0.32 second
First Degree
II
Copyright © 2019 ABCM All rights reserved

Second Degree
– Type I (Mobitz type I or Wenckebach)
• Each Impulse generated from the SA node has a more difficult
time passing through the AV junction.
• Finally the stimulus is not conducted at all.
• The blocked beat is followed by relative recovery of the AV
junction.
• The PR interval after the non-conducted P is shorter than the PR
interval of the beat before the non-conducted P wave.
• The whole cycle starts again
Copyright © 2019 ABCM All rights reserved

The PR interval lengthens progressively with
successive beats until one sinus P wave is not
conducted at all.
Then the cycle repeats itself.
Notice that the PR interval after the non-conducted P
wave is shorter than the PR interval of the beat just
before it.
Second Degree Type I
II
Copyright © 2019 ABCM All rights reserved

“Footprints” of Wenckebach.
1. Small groups of beats, especially pairs, trios, etc.
2. As the PR interval lengthens, the R-R interval
shortens in succeeding cycles.
3. The longest cycle (of the dropped beat) is less than
twice the shortest cycle.
Marriott, H. J. L. (1988). Practical electrocardiography. (8th ed.). Baltimore, MD: Williams & Wilkins.
Second Degree Type I
II
Copyright © 2019 ABCM All rights reserved

Goldberger, A. L. (2006). Clinical electrocardiography: A simplified approach. (7th ed.). Mosby Inc.
Type I vs. Type II
Copyright © 2019 ABCM All rights reserved

Second Degree 2:1
• 2:1 second degree AV block (consistent).
• Unable to tell if the mechanism is from Mobitz I or II.
• Constant 2:1 ratio
P P P P P P P P P P P P P
Ratio: 2:1 2:1 2:1 2:1 2:1
Goldberger, A. L. (2006). Clinical electrocardiography: A simplified approach. (7th ed.). Mosby Inc.
II
Copyright © 2019 ABCM All rights reserved

Second Degree Type II Advanced
• Refers to the specific ECG findings when you have
CONSTANTLY more than 2:1 P waves for each
QRS complex.
• Lethal Rhythm and Permanent Pacing is the only
thing that this patient will get (Temporary Pacing at
minimum).
II
Copyright © 2019 ABCM All rights reserved

1
Copyright © 2019 ABCM All rights reserved

Complete heart block with underlying sinus rhythm is characterized by
independent atrial (P) and ventricular (QRS complex) activity. The atrial rate
is almost always faster than the ventricular rate. The PR intervals are
completely variable. Some sinus P waves fall on the T wave, distorting its
shape. Others may fall in the QRS complex and be “lost.” Notice that the
QRS complexes are of normal width, indicating that the ventricles are being
paced from the atrioventricular junction.
P P P P P P P P P
This example of complete heart block shows a very slow idioventricular
rhythm and a faster independent atrial (sinus) rhythm.
P P P P P P P P P P P
Third Degree Heart Block
II
II
Copyright © 2019 ABCM All rights reserved

2
V1
V6
Copyright © 2019 ABCM All rights reserved

Electrolyte Practice
Try your hand at identifying the next few electrolyte patterns, you should be
able to easily identify each one.
1
a. Hyperkalemia
b. Hypokalemia
c. Hypercalcemia
d. Hypocalcemia Copyright © 2019 ABCM All rights reserved

2
a. Hyperkalemia
b. Hypokalemia
c. Hypercalcemia
d. Hypocalcemia
Copyright © 2019 ABCM All rights reserved

3
a. Hyperkalemia
b. Hypokalemia
c. Hypercalcemia
d. Hypocalcemia Copyright © 2019 ABCM All rights reserved

4
a. Hyperkalemia
b. Hypokalemia
c. Hypercalcemia
d. Hypocalcemia Copyright © 2019 ABCM All rights reserved

T wave
V1 Taller
T wave
V6
J
1 2 3 4 5
6 7 8 9 10
Patterns Suggestive of Myocardial Ischemia
Horizontal
ST-T depression
Down sloping ST-T Symmetrical
T wave inversion
ST-T angles
upward and elevatesLong ST segment
greater than 0.12
Sharp ST-T
angle producing
symmetrical T
Inverted U wave Low voltage T wave
with normal sized QRS
Swinging T waves
in V1-V3
(up-down T waves)
TV1 taller TV6
ST = 0.12 sec.
Patients may have more than one of these patterns at the same time.
Copyright © 2019 ABCM All rights reserved

Myocardial Ischemia Practice
Try your hand at identifying the next few ischemic patterns,
you should be able to easily identify each one.
Copyright © 2019 ABCM All rights reserved

3
Copyright © 2019 ABCM All rights reserved

ST-T, and
J-point
elevation
Severe up-sloping of
ST-T with broad
based T wave
Up-sloping of ST
segment in any
group of leads
Severe up-sloping of
ST-T without
perceptible
J-point, resulting in
broad based T wave
Symmetrical T wave
inversion may indicate
a transmural
infarction
18. Patterns Suggestive of Acute
Myocardial Infarction
1 2 3 4 5
St Elevation
T wide 0.20
Cannot see angle betweenQRS and ST segment
Copyright © 2019 ABCM All rights reserved

Various Criteria to Diagnose LBBB with Acute Antero-septal MI
Marriott’s Criteria – The only infarction the is difficult in the Face of LBBB is Anterior
1) ST elevation with upward concavity to the ST segment in V1-V4 – Anteroseptal MI
Sgarbossa’s Criteria - Three criteria are included:
1) ST elevation ≥1 mm in a lead with a positive QRS complex (ie: concordance) = 5 points
2) ST depression ≥1 mm in lead V1, V2, or V3 = 3 points
3) ST elevation ≥5 mm in a lead with a negative (discordant) QRS complex = 2 points
≥3 points = 90% specificity of STEMI (sensitivity of 36%)
Cabrera’s Sign 1) Notching at 40 milliseconds in the upslope of the S wave in lead V3 and V4.
This has a poor sensitivity of 27% for myocardial infarction.
Chapman’s Sign1) The presence of a notch in the ascending limb of the leads I, aVL or V6.
Smith’s Sign – Modified the Third Criteria from Sgarbossa’s Criteria
≥ 1 lead with ≥1 mm of concordant ST elevation
≥ 1 lead of V1-V3 with ≥ 1 mm of concordant ST depression
≥ 1 lead anywhere with ≥ 1 mm STE and proportionally excessive discordant STE,
as defined by ≥ 25% of the depth of the preceding S-wave.
Copyright © 2019 ABCM All rights reserved

8 - LBBB1
1. Wide QRS
2. QS in V1 with slick down-stroke to an early nadir within 0.06
sec.
3. R in V6 with a quick up-stroke to an early apex within 0.07 sec.
(seen in 75% of LBBB)
5. Has r in V1 indicating the RV was depolarized slightly before the
septum
6. Q in lead 1 and aVL indicating an old lateral wall MI
7. Deep QRS in V1-V3 with LBBB can produce a lift off the
baseline in the opposite direction mimicking an injury pattern.
8. Normal upward concavity of ST, with elevation in V1-V3 classic
of LBBB with deep QRS in V1-V3
Evidence:V1 V6
Copyright © 2019 ABCM All rights reserved

8 - LBBB2
1. Wide QRS
2. rS in V1 with slick down-stroke to an early nadir
within 0.06 sec.
3. R in V6 with a delayed up-stroke to a delayed apex
greater than 0.07 sec. (seen in approximately 25%
of LBBB)
5. Loss of septal q in lead I and V6
6. Dome shape ST elevation in V2-V5 due to
myocardial infarction – loss of normal upward
concavity seen in LBBB.
Evidence:
QRS of LBBB in V1 & V6
V1 V6
Copyright © 2019 ABCM All rights reserved

23. Anteroseptal Infarction: V1-V4
V1-V4 show ST-T elevation with no real perceptible J-point (red arrows). There are reciprocal depressions seen in leads I, II, aVL, and V5-V6 (black arrows). This anterior infarction is complicated by a left bundle branch block (note the wide QRS complex with the slick down-stroke in V1 and early upstroke in V6 with loss of septal Q waves in V5-V6 and lead 1 and aVL. Anticipate arrhythmias and further serious conduction disturbances to appear.
Copyright © 2019 ABCM All rights reserved

24. Anterolateral Infarction: V1-V6
V1-V6, leads I and aVL show ST-T elevation. This is an extensive antero-lateral infarction complicated by a right bundle branch block (note the wide rsR’ pattern in V1, and the qRs pattern in leads I and V6 (with wide “s” wave). Anticipate arrhythmias and further serious conduction disturbances.
Copyright © 2019 ABCM All rights reserved

24. Anterolateral Infarction: V1-V6, I & aVL
V1-V6 and leads I and aVL show ST-T elevation while leads II, III, and aVF show reciprocal depressions. This is an extensive anterolateralinfarction. Anticipate arrhythmias and serious conduction disturbances.
Copyright © 2019 ABCM All rights reserved

Case Study: In 1997 a 63 year old woman was concerned enough about herself to
drive to an emergency department for help. Upon admission her complaints were GI
upset after meals, general exhaustion lately, and shortness of breath with minimal
exertion.
Pattern 8: Low Voltage T Wave With Normal Sized QRS
TV1 is flat; should be gently inverted and is on the way up.
Note the low voltage in the inferior and lateral leads indicating a RCA lesion and possibly a circumflex
vessel.
Copyright © 2019 ABCM All rights reserved

Same patient as in the previous image 24 hours later while complaining of scapular pain. The patient
coded and died right after this ECG. Her autopsy revealed acute myocardial Injury and a left
ventricular rupture. This patient lost her life due to our ignorance of the “subtle” or “less obvious
patterns suggestive of ischemia.
Pattern 8: Low Voltage T Wave With Normal Sized QRS
Remember the T wave that was flat, It is now upright as anticipated.
Copyright © 2019 ABCM All rights reserved