carbonizing valuation: on valuing value of co2
TRANSCRIPT

SustainBjørn Tore UrdalSenior Equity AnalystEnergy
Seefeldstrasse 215
8008 Zurich
Tel. +41 44 397 10 65
Fax +41 44 397 10 80
www.sam-group.com
Carbonizing ValuationOn valuing value of CO2

2
„When one admits that nothing is certain one must, I think, also admit that some things are much more nearly certain than others“
Bertrand Russell

3
Study Settings 1 – the german utility sector• Approaching the next generation:
• Coal & lignite represents 2/3 of german fuel basis
• By 2030 57% of coal and 49% of lignite needs to be replaced
0
100
200
300
400
500
600
2000 2005 2010 2015 2020 2025 2030
OilNatural GasNuclearLigniteHard-coalDemanded Capacity
TWh
Required replacement
Source: öeko-institute, WWF
Growth y/y 0.4%

4
Study Settings 2 – Long-term NAP framework• What if politics truly reflects scientific advice? Facing a tough future
• IPCC needed reduction profile – 2050: 80% CO2 reduction compared to current – dictates future of EU National Allocation Plans (NAP)
• NAP follow 5-year periods with step reductions until Germany reaches 100mt by 2050
Source: WWF, SAM
0
100
200
300
400
500
600
2005200820112014201720202023202620292032203520382041204420472050
Mill. tCO2/yReduction path – securing a sustainable atmospheric carbon level of 400 ppm – the german path
Ful
l ger
man
CO
2 em
issi
on p
ath

5
Study Settings 3 – EU-ETS framework• Existing: Current allowances, post NAP2 benchmark allowance
• Replacements: Allowance based on universal benchmark
0
100
200
300
400
500
600
2006 2010 2014 2018 2022 2026 2030 2034 2038 2042 2046 2050
200
300
400
500
600
700
800
German NAP AllowancesUniversal BenchmarkBenchmark existing coal & lignite
Mill. tCO2/year gCO2/KWh
Source: WWF, SAM
Post NAP2 benchmark allowance of existing plants
Benchmark all new plants & existing natural gas plants
Fue
l allw
ance
ben
chm
ark
Ful
l ger
man
CO
2 em
issi
on p
ath

6
RWE Case Study – generation portfolio
• RWE single largest privately owned CO2 emitter in europe
• RWE‘s expiering lifetime curve: need for generation replacement
• RWE and its owners face long-term investment decisions – now..
0
20
40
60
80
100
120
140
160
180
200
220
2006 2008 2010 2012 2014 2016 2018 2020 2022 2024 2026 2028 2030
NuclearNatural GasHard-coalLigniteGeneration capacity
TWh
Required replacement
Source: WWF, SAM
7
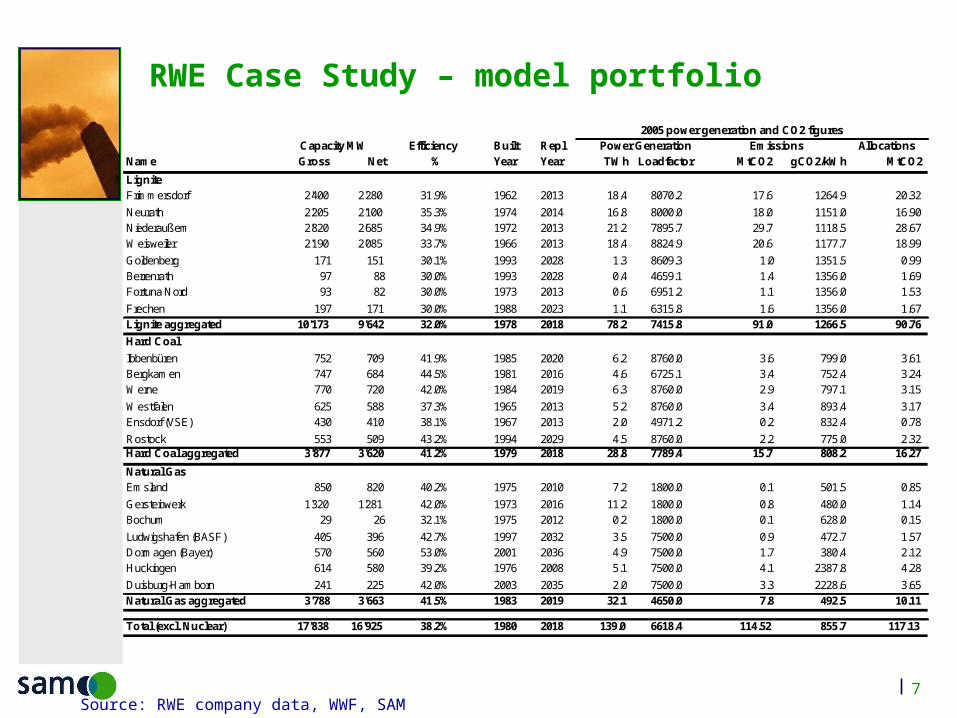
RWE Case Study – model portfolio
Efficiency Built Repl AllocationsName Gross Net % Year Year TWh Loadfactor MtCO2 gCO2/kWh MtCO2
LigniteFrimmersdorf 2'400 2'280 31.9% 1962 2013 18.4 8070.2 17.6 1264.9 20.32
Neurath 2'205 2'100 35.3% 1974 2014 16.8 8000.0 18.0 1151.0 16.90Niederaußem 2'820 2'685 34.9% 1972 2013 21.2 7895.7 29.7 1118.5 28.67Weisweiler 2'190 2'085 33.7% 1966 2013 18.4 8824.9 20.6 1177.7 18.99
Goldenberg 171 151 30.1% 1993 2028 1.3 8609.3 1.0 1351.5 0.99Berrenrath 97 88 30.0% 1993 2028 0.4 4659.1 1.4 1356.0 1.69Fortuna Nord 93 82 30.0% 1973 2013 0.6 6951.2 1.1 1356.0 1.53
Frechen 197 171 30.0% 1988 2023 1.1 6315.8 1.6 1356.0 1.67Lignite aggregated 10'173 9'642 32.0% 1978 2018 78.2 7415.8 91.0 1266.5 90.76
Hard Coal
Ibbenbüren 752 709 41.9% 1985 2020 6.2 8760.0 3.6 799.0 3.61Bergkamen 747 684 44.5% 1981 2016 4.6 6725.1 3.4 752.4 3.24Werne 770 720 42.0% 1984 2019 6.3 8760.0 2.9 797.1 3.15
Westfalen 625 588 37.3% 1965 2013 5.2 8760.0 3.4 893.4 3.17Ensdorf (VSE) 430 410 38.1% 1967 2013 2.0 4971.2 0.2 832.4 0.78
Rostock 553 509 43.2% 1994 2029 4.5 8760.0 2.2 775.0 2.32Hard Coal aggregated 3'877 3'620 41.2% 1979 2018 28.8 7789.4 15.7 808.2 16.27
Natural GasEmsland 850 820 40.2% 1975 2010 7.2 1800.0 0.1 501.5 0.85
Gersteinwerk 1'320 1'281 42.0% 1973 2016 11.2 1800.0 0.8 480.0 1.14Bochum 29 26 32.1% 1975 2012 0.2 1800.0 0.1 628.0 0.15
Ludwigshafen (BASF) 405 396 42.7% 1997 2032 3.5 7500.0 0.9 472.7 1.57Dormagen (Bayer) 570 560 53.0% 2001 2036 4.9 7500.0 1.7 380.4 2.12Huckingen 614 580 39.2% 1976 2008 5.1 7500.0 4.1 2387.8 4.28
Duisburg-Hamborn 241 225 42.0% 2003 2035 2.0 7500.0 3.3 2228.6 3.65Natural Gas aggregated 3'788 3'663 41.5% 1983 2019 32.1 4650.0 7.8 492.5 10.11
Total (excl. Nuclear) 17'838 16'925 38.2% 1980 2018 139.0 6618.4 114.52 855.7 117.13
2005 power generation and CO2 figuresCapacity MW Power Generation Emissions
Source: RWE company data, WWF, SAM

8
RWE Case Study – model portfolio
Efficiency Built ReplNuclear Plants Gross Net % Year Year TWh Loadfactor
Biblis A 1'255 1'167 50% 1975 2007 6.2 8000.0Biblis B 1'300 1'240 50% 1977 2009 10.1 8000.0Gundremmingen B 1'344 1'284 50% 1984 2016 10.0 8000.0Gundremmingen C 1'344 1'288 50% 1985 2017 10.3 8000.0
Emsland 1'400 1'329 50% 1988 2020 11.2 8000.0Nuclear Agregated 6'643 6'308 50.0% 1982 2014 47.9 8000.0
Capacity MW Power Generation
Source: RWE company data, WWF, SAM

9
RWE Case Study – model portfolio (2005 fig.)
• 26 plants (23,651 MW) representing 88.5% of total gen. capacity
• 114mt CO2, representing 95.3% of total 120mt of CO2 emission.
• 116mt CO2 allowances, representing 96.8% allowances
Lignite 42%
Hard-coal 15%
Natural Gas 17%
Nuclear 26%
Lignite 79%
Hard-coal 14%
Natural Gas 7%
Share of el. generation Share of CO2 emissions
Source: RWE company data, WWF, SAM
10
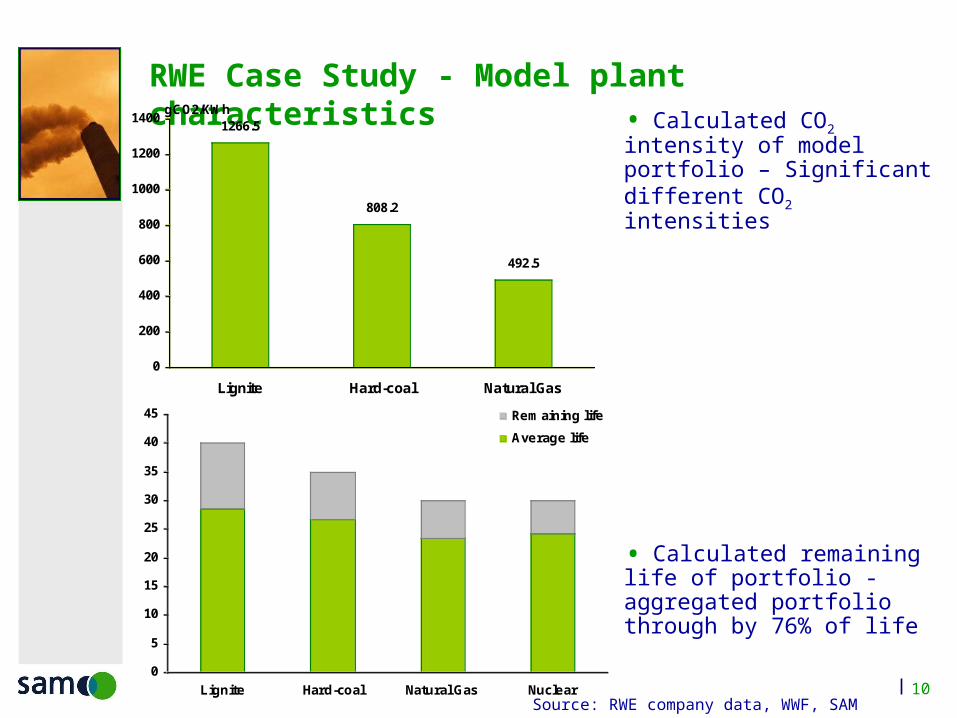
RWE Case Study - Model plant characteristics
• Calculated CO2 intensity of model portfolio – Significant different CO2 intensities
• Calculated remaining life of portfolio - aggregated portfolio through by 76% of life
1266.5
808.2
492.5
0
200
400
600
800
1000
1200
1400
Lignite Hard-coal Natural Gas
gCO2/KWh
0
5
10
15
20
25
30
35
40
45
Lignite Hard-coal Natural Gas Nuclear
Remaining life
Average life
Source: RWE company data, WWF, SAM

11
Methodology – NAV and DCCF calculation
• Asset data: existing plant and repalcement plant
• Valuation: NAV and DCCF of existing and replacement RWE Ownership
Frimmersdorf 100% Current Rep. Invest.Commissioned: 1962 2014Expected life time: 51 30Life remaining: 7 30Replacement year: 2013 2044Fuel type: Lignite CCGTCapacity Gross (MW): 2'400 2400Efficiency rate: 31.9% 60.0%Utilisation rate: 95% 95%Fixed OPEX EUR/MWh 0.51 0.18Variable OPEX EUR/MWh (excl.fuel) 2.15 2.30Load fatcor 8070.2 8070.2NAP Allowance volume NAP1 TRANSFER RULE:Million Metric NAP1 Tonne 20.3 NOCO2 emission tCO2/GJ 0.099 0.056 Decommissioning costs (EURm/MW): 218.75 100Replacement Investment Option 21 2 3Capex EUR/Kw 500 Tax rate 20% 20%
Total Existing New Existing ReplacementNAV WACC NAV NAV
2085.7 8% 1527.4 558.3IRR Replacement Investments= 16.2% IRR-WACC = 8.2%
DCCF WACC DCCF DCCF-211.6 8% -279.6 68.1
Source: SAM

12
Methodology – NAV and DCCF calculation
• CO2 cash flow – being long or short is a value game...P&L 2006 2007 2008Capacity Gross (MW) 2400 2400 2400Utilisation rate of plant 95% 95% 95%Capacity Net (MW) 2280 2280 2280Power Generation (TWh) 18.4 18.4 18.4Electricity price (EUR/MWh) 45.0 45.0 45.0Sales EURm 828.0 828.0 828.0Fuel consumption (TWh) 57.7 57.7 57.7 Fuel consumption in energy equivalent (mill GJ) 207.79 207.79 207.79 Efficiency rate 32% 32% 32%Fuel Price (EUR/MWh) 5.76 5.76 5.76Fuel costs (EURm) 332.5 332.5 332.5Fixed OPEX (EURm) 1.2 1.2 1.2Variable OPEX (excl. Fuel) EURm 39.6 39.6 39.6CO2 Emissions (Mill. Metric Tonne) 20.6 20.6 20.6Allowances for existing plant (Mill. Metric Tonne) 20.3 20.3 17.3Allowances for new plant (Mill. Metric Tonne) 0.0 0.0 0.0Allowances for continued Asset (Exc. Auct.) 20.3 20.3 17.3Allowances for continued Asset (Incl. Auct.) 20.3 20.3 17.3(Carbon Budget) Allowances for Asset on NAP 20.3 20.3 19.8CO2 Allowances Surplus/(Deficit) (Metric Tonne) -0.3 -0.3 -3.3CO2 ETS prices (EUR/Tonne) 25.0 25.0 25.0CO2 ETS costs/(revenue) EURm -6.3 -6.3 -82.5Total cost -379.6 -379.6 -455.8EBITDA 448.4 448.4 372.2Tax rate 20% 20% 20%
Tax (EURm) 89.7 89.7 74.4NOPLAT 358.7 358.7 297.8
Source: SAM
13
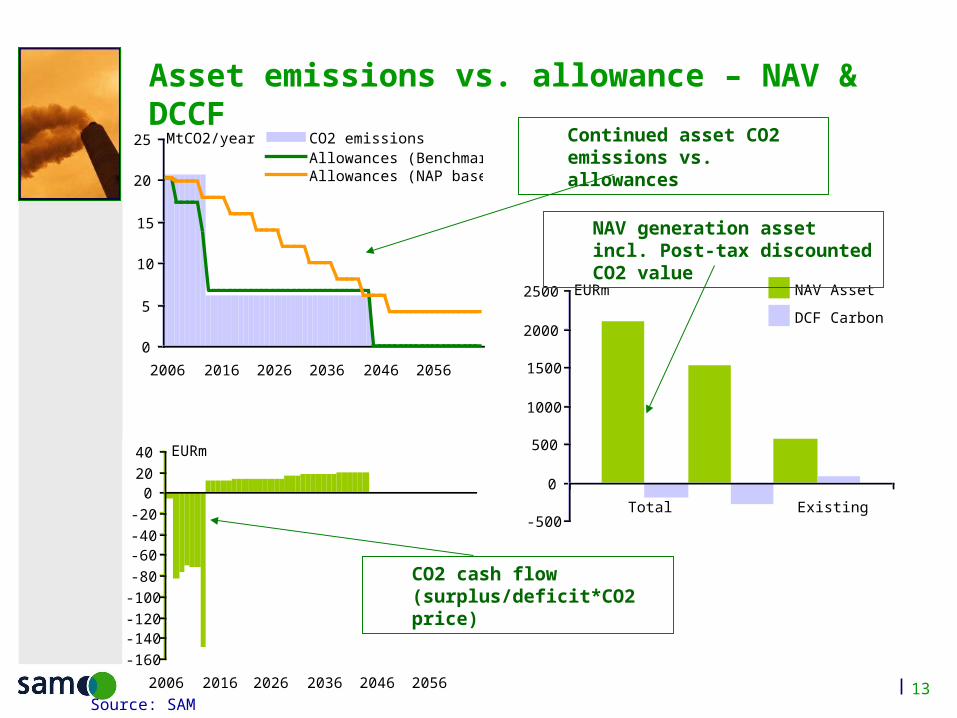
Asset emissions vs. allowance – NAV & DCCF
-500
0
500
1000
1500
2000
2500
Total Existing New
EURm NAV Asset
DCF Carbon
0
5
10
15
20
25
2006 2016 2026 2036 2046 2056
CO2 emissionsAllowances (Benchmark)Allowances (NAP based)
MtCO2/year
-160-140-120-100-80-60-40-20
02040
2006 2016 2026 2036 2046 2056
EURm
Continued asset CO2 emissions vs. allowances
CO2 cash flow (surplus/deficit*CO2 price)
NAV generation asset incl. Post-tax discounted CO2 value
Source: SAM

14
Running the accumulated portfolio
• replacing plants fuel by fuel, base scenario
0
20
40
60
80
100
120
140
2006 2012201820242030 20362042 20482054 2060
CO2 emissionsAllowances (Benchmark)Allowances (NAP based)
MtCO2/year
-70-60-50-40-30-20-10
01020
2006 201220182024203020362042204820542060
MtCO2/year
-2500
-2000
-1500
-1000
-500
0
500
2006201220182024203020362042204820542060
EURm
-15000
-10000
-5000
0
5000
10000
15000
20000
Total Existing New
EURm NAV Asset
DCF Carbon
Discounted cash flow valuesEmission vs. allowance
Carbon cash flowLong/short emissions
Source: SAM

15
Running the accumulated portfolio
• replacing plants with CCGT, base scenario
Discounted cash flow valuesEmission vs. allowance
Carbon cash flowLong/short emissions
0
20
40
60
80
100
120
140
2006 2012201820242030 20362042 20482054 2060
CO2 emissionsAllowances (Benchmark)Allowances (NAP based)
MtCO2/year
-30
-25
-20
-15
-10
-5
0
5
10
2006 201220182024203020362042204820542060
MtCO2/year
-700-600-500-400-300-200-100
0100200300
2006201220182024203020362042204820542060
EURm
-5000
0
5000
10000
15000
20000
25000
Total Existing New
EURm NAV Asset
DCF Carbon
Source: SAM

16
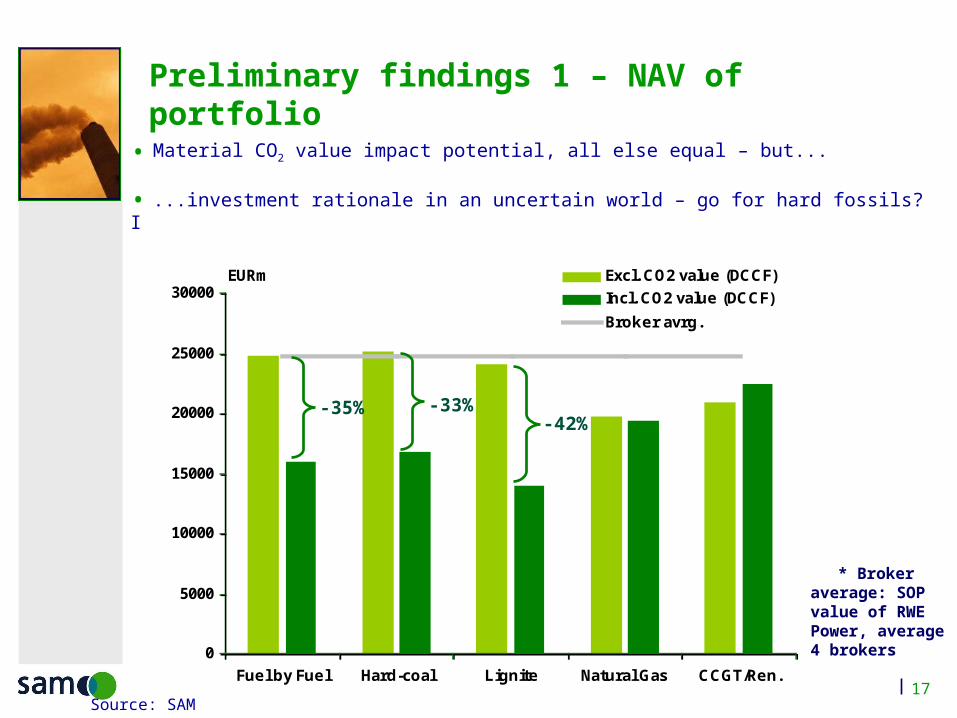
What are we & are we not trying to assess?
• What are we not assessing - CO2 matters, all else equals:
• Not assessing optimal fuel mix of portfolio
• Not modelling CO2 and commodity price interlinkage
• What are we assessing – all else equal, CO2 value matters
• Calculate CO2 value impact on accumulated portfolio NAV
• CO2 impact on plant-by-plant replacement options, by fuel and in time
17
0
5000
10000
15000
20000
25000
30000
Fuel by Fuel Hard-coal Lignite Natural Gas CCGT/Ren.
Excl. CO2 value (DCCF)
Incl. CO2 value (DCCF)
Broker avrg.
EURm
Preliminary findings 1 – NAV of portfolio
• Material CO2 value impact potential, all else equal – but...
• ...investment rationale in an uncertain world – go for hard fossils? I
-35% -33%-42%
* Broker average: SOP value of RWE Power, average 4 brokers
Source: SAM

18
Carbon impact on RWE‘s SOP value
• Broker avrg. Sum-of-the-parts value of RWE
• RWE Power 31% of Total Gross Assets – CO2 imapct: 11%
0
10'000
20'000
30'000
40'000
50'000
60'000
70'000
80'000
RWE Thames Water
RWE nPower
RWE Energy
RWE Power (Generation)
EURm
31%

19
Theoretical impact on RWE‘s Equity Value
0
5'000
10'000
15'000
20'000
25'000
30'000
35'000
40'000
45'000
Excl. CO2 Incl. CO2
EURm
-20%

20
Preliminary findings 2 – Hurdle rate assessment*
• Value creation vs. destruction plant-by-plant: fuel choice
• Building quality perception of mgmt‘s strategy – are they creating or destroying long-term value
-10%
-5%
0%
5%
10%
15%
IRR-WACC
Average 2.3%
Lignite NuclearNatural gasHard-coal
• * Hurdle rate: IRR (Internal rate of Return) – WACC (Weighted Average Cost of Capital).
• IRR: is the discount rate that delivers a NPV of zero for the cash flow of the replacement asset (true interest yield from a project and dictates a discount rate below which creates value.
Hurdle rate appraisal, replacing plants like-for-like
Source: SAM

21
Preliminary findings 3 – Hurdle rate assessment
• Value of replacement along a time dimension
• Demonstrating investors‘ need for understanding the CO2 regulatory framework – the time value is significant
30%
35%
40%
45%
50%
55%
60%
2006-2012 >2012
IRR-WACC
Post NAP2NAP1 - NAP2
Loosing out on the transfer rule
Source: SAM

22
Conclusions
1. In a „what if politics follows science“, in a „not too far distant future“ setting – CO2 can have significant impact on long-term corporate values. Is it probable? It is not unrealistic.
2. Political shortsightedness creates huge future uncertainty – and companies tries to act with rationale based on knowledge today. Are they correct? often not.
3. In a capital intensive industy with high longevity of assets and no second fuel technology choice – being wrong on carbon hurts society and potentially share-holders‘ value.
Requires comprehensive analysis by investors and analysts

23
Disclaimer
No Offer The information and opinions contained in this publication constitutes neither a solicitation, nor a recommendation, nor an offer to buy or sell investment instruments or other services, or to engage in any other kind of transaction. The information described in this publication is not directed to persons in any jurisdiction where the provision of such information would run counter to local laws and regulation.
No warranty This publication is derived from sources believed to be accurate and reliable, but neither its accuracy nor completeness is guaranteed. The material and information in this publication are provided "as is" and without warranties of any kind, either expressed or implied. SAM Group Holding AG and its related, affiliated and subsidiary companies disclaim all warranties, expressed or implied, including, but not limited to, implied warranties of merchantability and fitness for a particular purpose. Any opinions and views in this publication reflect the current judgment of the authors and may change without notice. It is each reader's responsibility to evaluate the accuracy, completeness and usefulness of any opinions, advice, services or other information provided in this publication.
Limitation of liability All information contained in this publication is distributed with the understanding that the authors, publishers and distributors are not rendering legal, accounting or other professional advice or opinions on specific facts or matters and accordingly assume no liability whatsoever in connection with its use. In no event shall SAM Group Holding AG and its related, affiliated and subsidiary companies be liable for any direct, indirect, special, incidental or consequential damages arising out of the use of any opinion or information expressly or implicitly contained in this publication.
Copyright Unless otherwise noted, text, images and layout of this publication are the exclusive property of SAM Group Holding AG and/or its related, affiliated and subsidiary companies and may not be copied or distributed, in whole or in part, without the express written consent of SAM Group Holding AG or its related, affiliated and subsidiary companies.
© 2006 SAM Group Holding AG

24
is Carbon Neutral®
Björn Tore Urdal
+41 (0)44 397 10 65
www.sam-group.com
www.sustainability-indexes.com