carbon markets an international tool for cost-effective ghg mitigation
TRANSCRIPT

Carbon marketsAn international tool for cost-effective GHG
mitigation
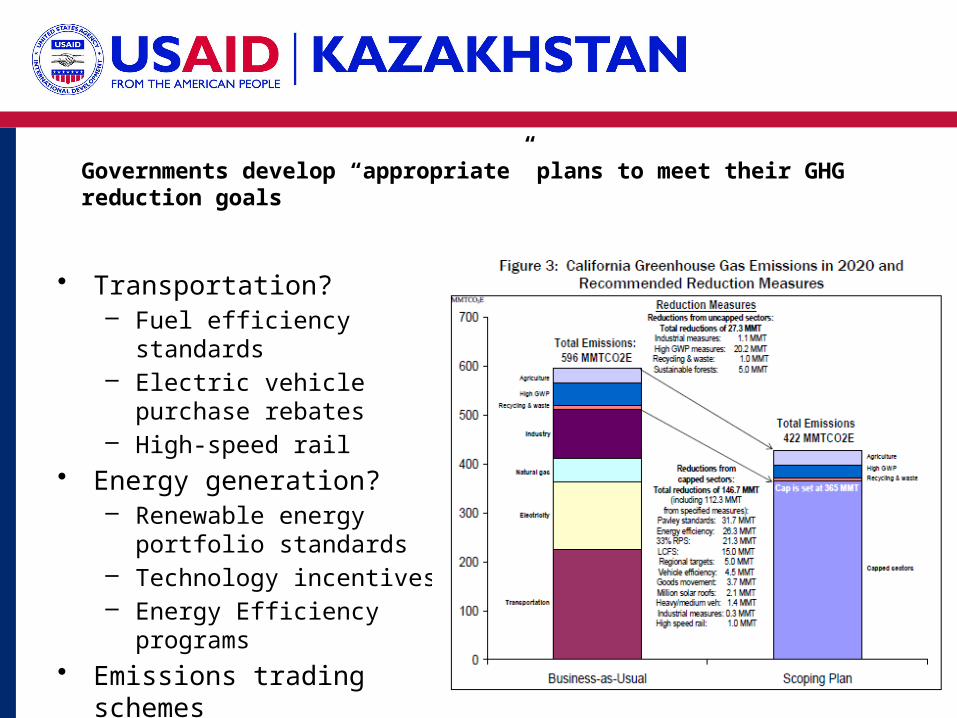
Governments develop “appropriate” plans to meet their GHG reduction goals
• Transportation? – Fuel efficiency standards– Electric vehicle purchase
rebates– High-speed rail
• Energy generation?– Renewable energy portfolio
standards – Technology incentives– Energy Efficiency programs
• Emissions trading schemes• And more…

Market elements are adapted to local conditions
– Coverage and Scope– Cap and allocations– Requirements and systems for monitoring, reporting,
verification and compliance– Trading and stability– Institutional arrangements – Use of offsets and linking
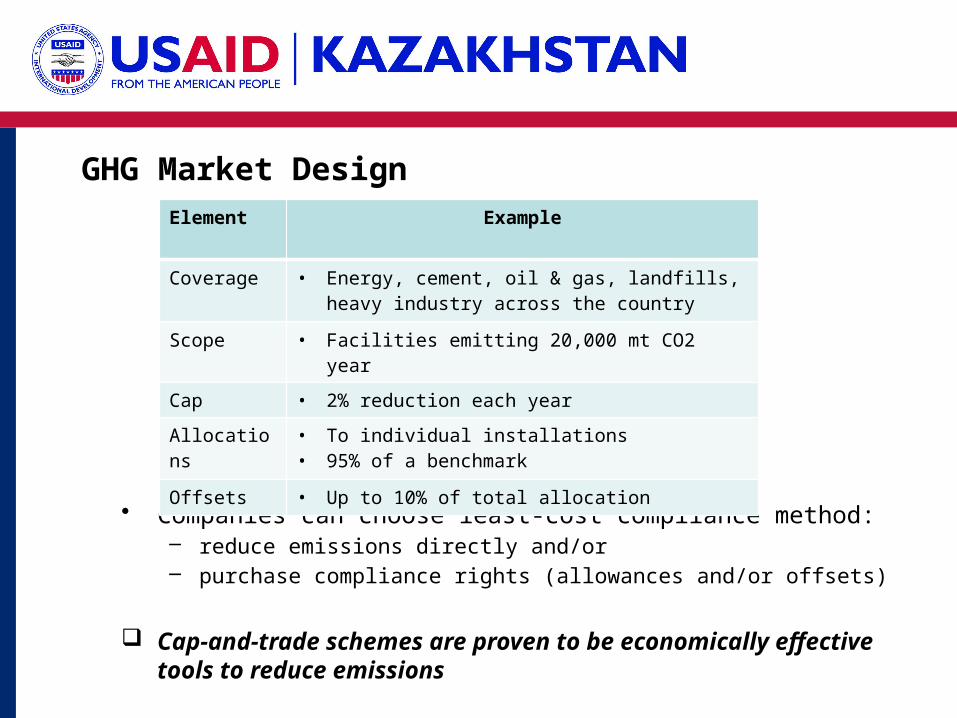
GHG Market Design
• Companies can choose least-cost compliance method:– reduce emissions directly and/or– purchase compliance rights (allowances and/or offsets)
Cap-and-trade schemes are proven to be economically effective tools to reduce emissions
Element Example
Coverage • Energy, cement, oil & gas, landfills, heavy industry across the country
Scope • Facilities emitting 20,000 mt CO2 year
Cap • 2% reduction each year
Allocations • To individual installations• 95% of a benchmark
Offsets • Up to 10% of total allocation

Existing and emerging emissions trading schemes
Source: World Bank, 2013, Mapping Carbon Pricing Initiatives.
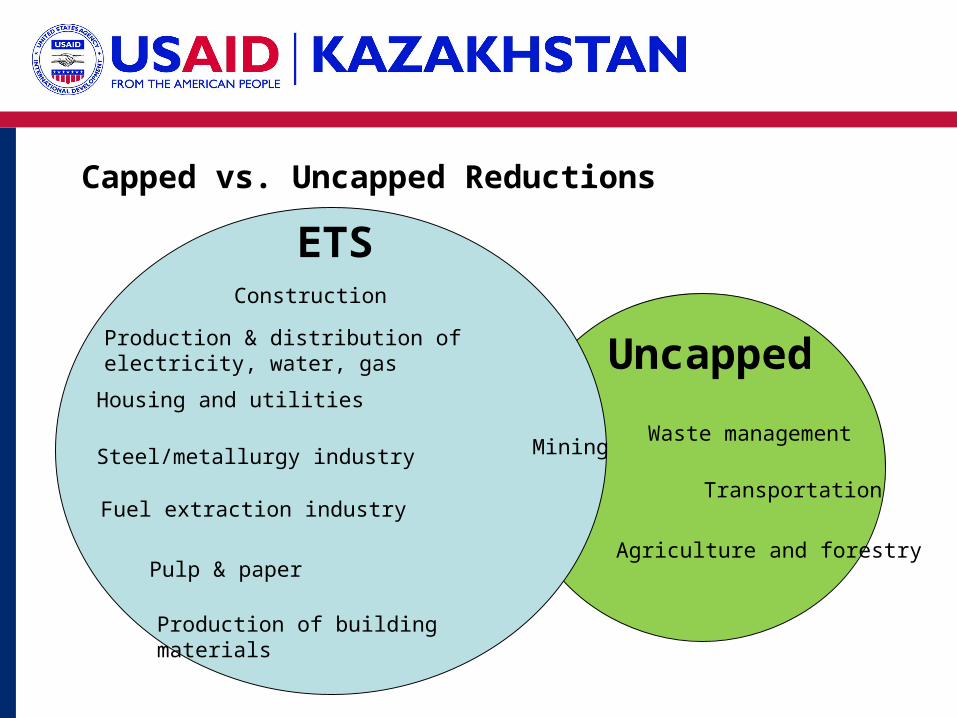
Capped vs. Uncapped Reductions
Housing and utilities
ETSConstruction
Steel/metallurgy industry
Production of building materials
Mining
Pulp & paper
Fuel extraction industry
Production & distribution of electricity, water, gas
Agriculture and forestry
Waste management
Transportation
Uncapped

Two Pathways for GHG Reduction Projects
Capped Sector Projects
• Example: renewable electricity and energy efficiency projects
• Can use streamlined standards and proceduresProjects are given quota allocations based on GHG reductions achieved
Uncapped Sector Projects
• Example: Coal mine methane reductions
• Quantified using carbon offset methodologiesProjects are issuedcarbon offset credits based on GHG reductions achieved

ENVIRONMENTAL MARKETS IN OPERATION
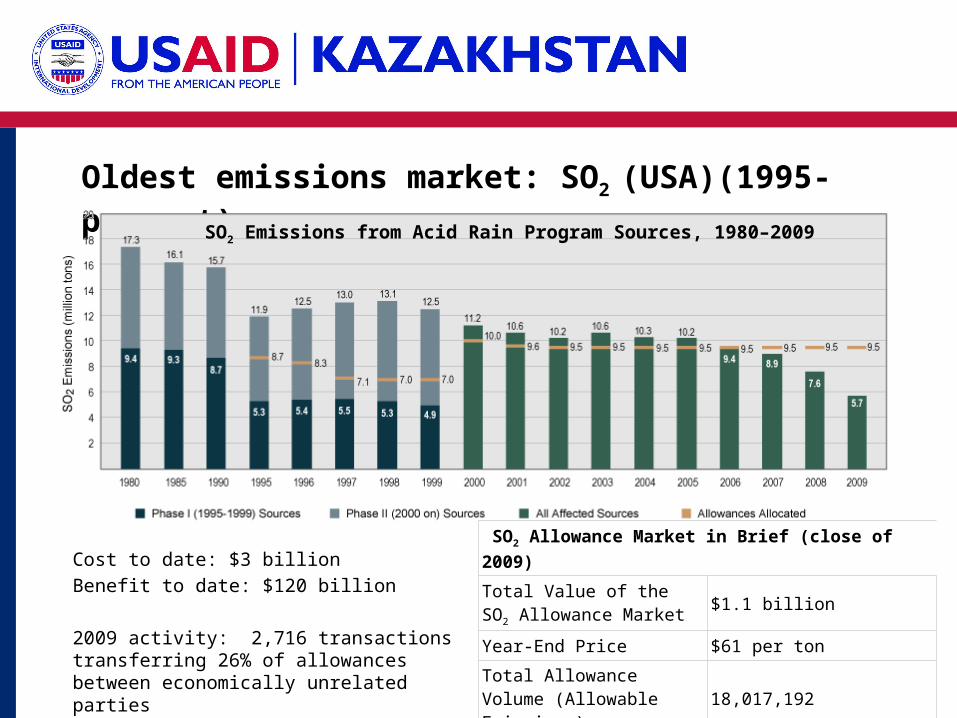
Oldest emissions market: SO2 (USA)(1995-present)
Cost to date: $3 billion
Benefit to date: $120 billion
2009 activity: 2,716 transactions transferring 26% of allowances between economically unrelated parties
SO2 Allowance Market in Brief (close of 2009)
Total Value of the SO2 Allowance Market $1.1 billion
Year-End Price $61 per ton
Total Allowance Volume (Allowable Emissions) 18,017,192
SO2 Emissions from Acid Rain Program Sources, 1980–2009

GHG Market: Kyoto Protocol (1997)
• Countries committed to binding national reduction targets
• Allows use of “Flexibility Mechanisms” to meet reduction targets– Emissions trading– Clean Development Mechanism– Joint Implementation

European Union: Emissions Trading Scheme (ETS)
• First GHG ETS to launch (2005)
• Today 28 member countries participating + Iceland, Liechtenstein, Norway– Cap decreases annually 1.74%
across EU– Has grown as the EU has grown
during the same period– Covers 45% of total emissions– 11,000 installations

EU ETSPhase 1: 2005-2007 (pilot)
Phase 2: 2008-2012 – CO2 emissions from fuel combustion + 5 industrial
sectors– National caps– Mostly free allocation
Phase 3: 2013-2020 – aviation + other activities + N2O (some activities) + PFCs (aluminum)
– Greater harmonization; one EU-wide cap– Increased auctioning of allowances (40% in 2013
with the % increasing each year– Benchmark-based allocations – 300 million allowances reserved for renewable
energy + CCS

EU ETS: Reductions/allocations
– Allocations have tightened over time• Backloading auction of some allowances
– 49% offsets possible across EU• Each country sets own limits within national scheme• CDM units can be converted to offsets, but now only from LDCs

CO2
EU ETS
(2005)
New Zealand (2008)
Economy-wide + forestry
Electric power
RGGI (USA) (2009)
California (Jan 2012)
Economy-wide
Standard-ized offsets
CO2 from Industrial sources + buildings
Tokyo
(April 2012)
Aus-tralia (July 2012)
Carbon Pricing Mech-anism
Link to EU ETS
Economy-wide
(First in Asia)
Kazakhstan
(2013)
China Pilot ETS
(2013)
Voluntary ETS (2012)
carbon tax or offsets
(2014)
Mexico
South Korea (2015)
Learning from the EU ETS

Markets reflect local circumstances
South Africa: one company @ 90% of national industrial emissions so prefer carbon tax
Tokyo – electricity consumption in buildings
New Zealand – include protection of forests
California – 8% limit on offsets to reflect desired level of in-state reductions

One global carbon market?
• Learning by doing• Minimum requirements are necessary to one day link
carbon markets• Provides investment in clean, green technology
Source: World Bank, 2013, Mapping Carbon Pricing Initiatives.