carbon market some reflections
TRANSCRIPT

8/2/2019 Carbon Market Some Reflections
http://slidepdf.com/reader/full/carbon-market-some-reflections 1/15
Public transport and Carbon Trading – some
reflections
Prepared byHeather Allen
Senior
Manager
SustainableDevelopment

8/2/2019 Carbon Market Some Reflections
http://slidepdf.com/reader/full/carbon-market-some-reflections 2/15
Overview
1 An overview of GHG and the Kyoto Mechanisms
2 EUTS and other cap and trade emission tradingsystems – a global approach?
3 UITP activities in this field
4 Potential for Public Transport actors
5 Debate

8/2/2019 Carbon Market Some Reflections
http://slidepdf.com/reader/full/carbon-market-some-reflections 3/15
An overview of GHG and the KyotoMechanisms
- 7 Gases covered – Methane and Carbon dioxide most important to thetransport sector
-The Kyoto protocol came into force in Feb 2005 and will run out in 2012and the next agreement period will be a key output of the UNFCCC meetingin December in Copenhagen.
-Three main financing mechanisms within the protocol are:
- Clean Development Mechanism (CDM)- Joint Implementation (JI)- Emissions trading such as the EUTS
-The difference between the Kyoto mechanisms and the EUTS is- Kyoto is a based on offsetting (financing an equivalent of emission reductions withanother actor in another place)- EUTS is a cap and trade system based on setting the level of emissions allowed from a
particular sector-The voluntary market requires different verification such as ‘GoldStandard’
- Transactions and gains are usually higher from this market
8/2/2019 Carbon Market Some Reflections
http://slidepdf.com/reader/full/carbon-market-some-reflections 4/15
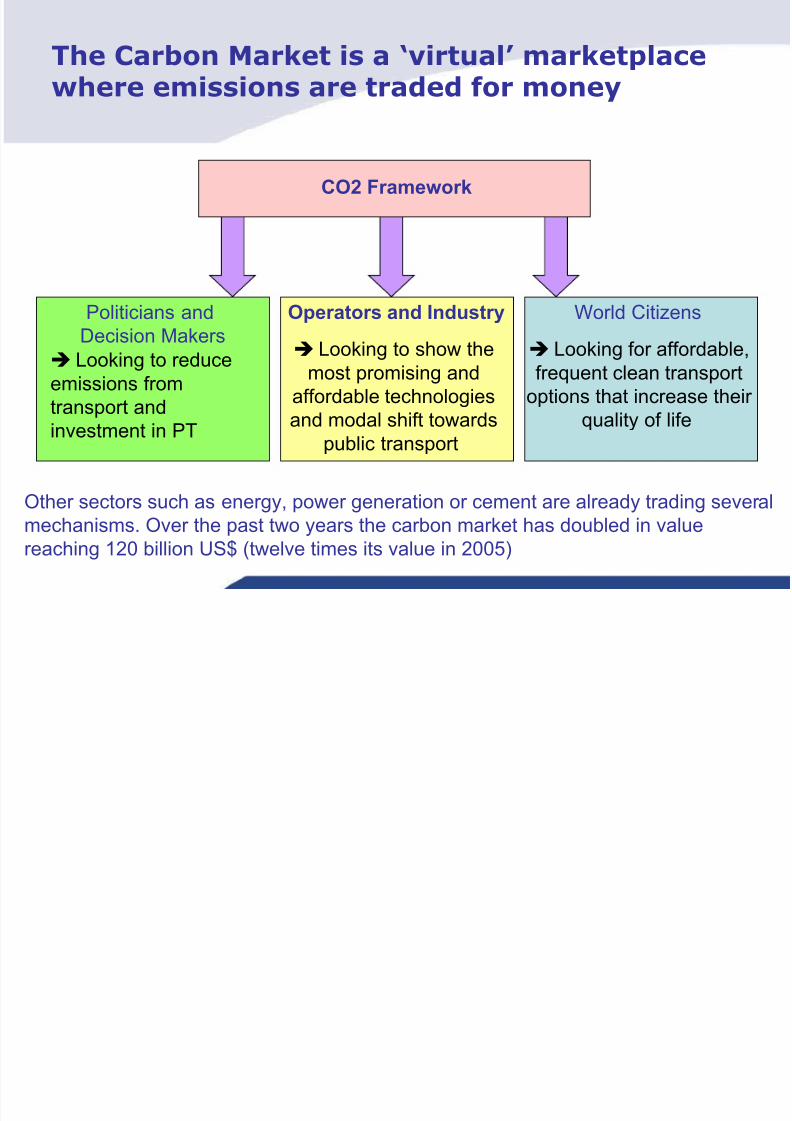
The Carbon Market is a ‘virtual’ marketplacewhere emissions are traded for money
Politicians andDecision Makers
Operators and Industry World Citizens
Looking to show themost promising and
affordable technologies
and modal shift towardspublic transport
Looking for affordable,frequent clean transport
options that increase their
quality of life
CO2 Framework
Looking to reduceemissions from
transport andinvestment in PT
Other sectors such as energy, power generation or cement are already trading severalmechanisms. Over the past two years the carbon market has doubled in value
reaching 120 billion US$ (twelve times its value in 2005)

8/2/2019 Carbon Market Some Reflections
http://slidepdf.com/reader/full/carbon-market-some-reflections 5/15
Usual priority initiatives for managing PT toreduce future GHG emissions
Strategies generally fall into two categories: technical solutions (e.g. vehicleefficiencies) and behavioural change solutions (e.g. mode shift).
Technical Behaviour change
Running
environment
Fuel
efficiency
Fleet
compositionPricing Land use Education
C
A
T
E
G
O
R
Y
A
C
T
I
O
N
Source of
electrical power
e.g.Hybrid
buses
Segregated
ROWZoning &
Implementation
Off-peak PT
pricing
Congestion /road
pricing
‘Soft’ actions
eg travel smart
Public
Information/
communication campaigns
Run more PT services to
engender a mode shift
Transport
supply
CNG
Bio gas

8/2/2019 Carbon Market Some Reflections
http://slidepdf.com/reader/full/carbon-market-some-reflections 6/15
Examples of Carbon Schemes
- Voluntary offset schemes – covers a wide range of schemes (note: theKyoto mechanisms of JI, CDM and trading are also a sort of offset) andoccur mainly at organisational/company levele.g. Selling/ auctioning credits or offsetting carbon from air travel
- Carbon exchanges – Bluenext; Chicago Climate Exchange CCX usuallyat a county or provincial level (eg King County USA)
- National Schemes – Switzerland - CO2 tax (+/- 7.6€) applicable if
CO2 reductions are not achieved or companies can opt to join a C&Tscheme
Canada – covering large stationary emitters (power-thermal electricity; oiland gas; mining and manufacturing) a mandatory credit and baselinesystem with relative targets at an entity level or the recent revenue neutralcarbon tax introduced in British Columbia
Japan – small voluntary trading scheme have been introduced but hugeopposition from industry
USA – not ratified Kyoto but will certainly play a major role in the post2012 regime and already there are a variety of voluntary or mandatorylocal and regional schemes (Regional GHG Initiative RGGI and the Climate
Action Registry)… Australia, New Zealand, UK and France all at various stages ….

8/2/2019 Carbon Market Some Reflections
http://slidepdf.com/reader/full/carbon-market-some-reflections 7/15
Main type of ‘credits’ available dependingon the scheme
Name Central Authority
ER Emissions Reduction None
VER Verified EmissionsReduction
Verification by a third party
REC Renewable EnergyCertificate
Various voluntary or mandatoryusually US or Australia based
CFI Carbon Financial
Instrument
Chicago climate exchange
CER Certified Emissions
Reduction
United Nations within scope of CDM
ERU Emissions ReductionUnit
United Nations within scope of JI
NGAC New South WalesGreenhouse Credit
New South Wales Greenhouse GasAbatement Scheme
R e l a t e d t o
m a n d a t o r y ‘ C &
T ’
m e c h a n i s m s

8/2/2019 Carbon Market Some Reflections
http://slidepdf.com/reader/full/carbon-market-some-reflections 8/15
Public transport and carbon trading
In general transport is ‘excluded’ and urban public transport in
particular, however:- Aviation will be included into the EUTS (2011)
- Almost no JI projects from transport and only 2 in CDM
- Both the CDM and the JI projects need support at national governmentallevel but the ‘The Bali Road Map’ approved in Dec 2007 opened the way for asectorial approach.
- Stationary transport infrastructure will most likely be included in somenational schemes (e.g. UK).
- Major hurdles on setting the base line and agreeing the boundaries of
calculating the emissions (only ‘tailpipe’ or scope 1 based on energy use foroperations, or to include stationary facilities or should co benefits be includedsuch as displaced trips, health, air quality etc).
- Main focus is on technology based reductions and there is limitedmethodologies available to monitor, measure and report long term behaviourchange such as ‘eco driving’.

8/2/2019 Carbon Market Some Reflections
http://slidepdf.com/reader/full/carbon-market-some-reflections 9/15
What are the stumbling blocks fortransport and PT in particular?
- Calculation of CO2 emissions – in absolute terms or for offsetting
- Difficulties in setting the baseline and in showing additionality to apply forUNFCCC approved projects
- Verification and costs of registration (range for a CDM project is 5 000 –
30 000€ just for registration and sometimes if it is verified by the UNFCCCit can cost more to verify than the credits generated…making smallerprojects more attractive as costs are lower) often accompanied by a twoyear wait in the ‘pipeline’.
- At present the amount of money generated is minimal
- The issue of permanence of emission reductions is not resolved
- Guarantee of single sale of emission reductions (reductions should not bedouble counted i.e. in voluntary market and at a national level – is notresolved (not only for transport)

8/2/2019 Carbon Market Some Reflections
http://slidepdf.com/reader/full/carbon-market-some-reflections 10/15
Barriers to setting the base line and
comparing CO2 emissions
Occupancy Rate/Load Factor: As emissions are generally calculated as g/pkm,overestimating the occupancy rate can radically reduce the emissions per passenger. Accurate occupancy rates are therefore required to give a realistic estimations of tonnes of CO2 avoided but there are difficulties in collecting actual occupancy/load data.
Vehicle Fleet Composition and Characteristics: Even within modes, the many variablesultimately affect the amount of CO2 emitted. These variables include engine size, fuel type, tyre pressure etc. As a wide variety of vehicle makes and models are often used by an operator, making collecting and managing data a resource intensive job. Using averageemissions over a fleet means that this cannot be correlated with the driving routes for ahigh or lower emitting vehicle leading to inaccuracies.
Driver Characteristics: The way in which a vehicle affects the fuel consumption, and therefore CO2 emissions. This includes driving speed, speed variations, accelerating and decelerating, cruising and breaking sometimes to do with driving style or traffic conditions.
Whole Life Costs: Full life cycle analysis can includeCO2 emissions including vehiclemanufacture, operation, maintenance, the manufacture of raw materials and energy generation. It is often easier to calculate and then compare the emissions that are created during operation. However, this will have implications when comparing modes where onehas little or no direct emissions (see ‘energy generation’ below). It should be clear whichof these elements are included within a comparison.
Energy Generation: The energy generation element is extremely important in inter-modal comparisons of emissions, particularly for modes with little or no direct emissions duringthe operation stage (e.g. rail). Electricity sources may also vary greatly, includinghydroelectric (low CO2), nuclear (low CO2) and coal-fired (high CO2). Public transport operators do not necessarily have any influence over power generation.
CO2 versus Greenhouse Gases: CO2 makes up a large proportion of the greenhouse gases
emitted from transport. Care that the larger impact of other greenhouse gas emissions arenot neglected (methane).

8/2/2019 Carbon Market Some Reflections
http://slidepdf.com/reader/full/carbon-market-some-reflections 11/15
Risks and opportunities for the PublicTransport sector
RISKS
- As an actor in the transport sector we may be penalised due to the poorperformance of others (road, air, maritime) so we should be wellprepared so we do not end up ‘paying for others’….
- We don’t have the proper information to influence….- Urban transport does not yet benefit from the Carbon funds…..
- We need to better understand the risks or opportunities in this complexbut emerging market ……
- There seems widespread agreement that there will be a price on carbon, itis a matter of when and how much….

8/2/2019 Carbon Market Some Reflections
http://slidepdf.com/reader/full/carbon-market-some-reflections 12/15
Risks and opportunities for the PublicTransport sector
OPPORTUNITIES
-The market is immature giving an opportunity to influence …..
-The Bali Road Map opens the door to sector/ programmaticpossibilities and “First in kind’ approaches. Urban transport couldbenefit from city wide measures ….
- The developing world sets to gain most as …
- We need to leverage arguments to gather statistics following acommon methodology ‘bundling’ similar projects to gaineconomies of scale …..(Call for action to UITP members)
- Opportunity to engage with the carbon funds, the voluntarymarket and other actors ….
- The voluntary market is growing faster than the primary marketand may provide the most interesting opportunities …
8/2/2019 Carbon Market Some Reflections
http://slidepdf.com/reader/full/carbon-market-some-reflections 13/15
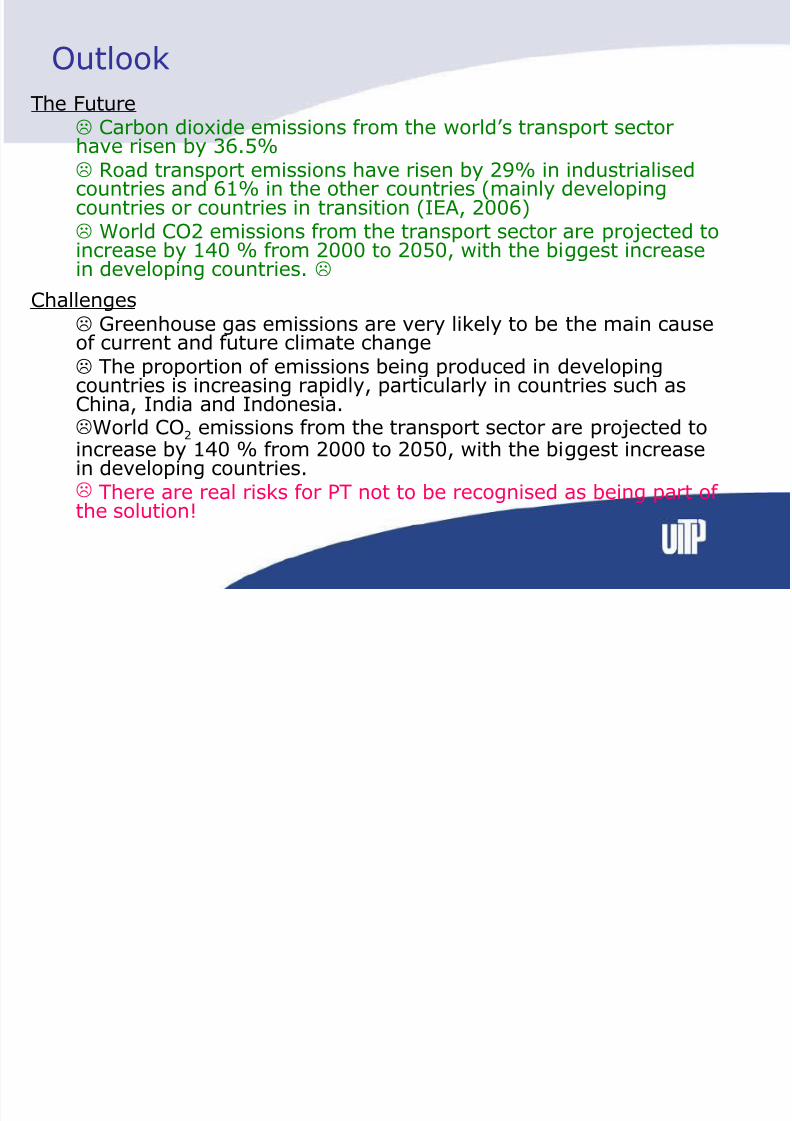
Outlook
The Future Carbon dioxide emissions from the world’s transport sectorhave risen by 36.5% Road transport emissions have risen by 29% in industrialisedcountries and 61% in the other countries (mainly developingcountries or countries in transition (IEA, 2006) World CO2 emissions from the transport sector are projected toincrease by 140 % from 2000 to 2050, with the biggest increase
in developing countries.
Challenges Greenhouse gas emissions are very likely to be the main causeof current and future climate change The proportion of emissions being produced in developingcountries is increasing rapidly, particularly in countries such asChina, India and Indonesia.World CO2 emissions from the transport sector are projected toincrease by 140 % from 2000 to 2050, with the biggest increasein developing countries. There are real risks for PT not to be recognised as being part of the solution!

8/2/2019 Carbon Market Some Reflections
http://slidepdf.com/reader/full/carbon-market-some-reflections 14/15
UITP playing a role in the climatechange debate
- Attended the UNFCCC meetings ( exhibition stand and sideevents) COPs 2002 - 2007… present active partnership Bridgingthe Gap (see presentation on Climate Change)
- Focus Paper – a Low Carbon Future with Public Transport (Oct2006)
- UITP working group on Communications and Climate Change (SDCommission) and the Climate Change Communications Gallery
- A climate change inventory in preparation – linking city ormetropolitan climate change action plans with transport measures
- European Activities … Priority 2 of response to the Green Paper onUrban Transport ‘Binding requirement to regulary measure CO2 emissionsin agglomerations (job-catchment areas)
-Creating a partnership with the EU Covenant of Mayors
- Ongoing ..

8/2/2019 Carbon Market Some Reflections
http://slidepdf.com/reader/full/carbon-market-some-reflections 15/15
Join us!
For more information contact