carbon foot printing workshop in helsinki on 17 june 2015
TRANSCRIPT

Carbon foot printing workshop Helsinki
17th June 2015

Agenda
8:30 Welcome – Jouni Keronen, CEO, Climate Leadership Council (CLC)
8:35 Introduction – Stephanie Pfeifer, IIGCC CEO
• Global Investor Platform on Climate Action – background to workshops
8:45 Presentations from carbon foot print service providers
• Maximilian Horster – South Pole Group
• Véronique Menou - MSCI ESG
• Lauren Smart - Trucost
9:40 The Montreal Carbon Pledge and trends in investor actions – Yulia
Sofronova and Sagarika Chatterjee, PRI
9:50 Discussion with asset owners and managers
• Tiina Landau - Ilmarinen Mutual Pension Insurance Company
• Mika Leskinen – OP Group
• Aila Aho – Nordea
• Sagarika Chatterjee – PRI
10:30 Close
PwC CEO Survey Launch, February 25, 2013
3
”In economics, things take longer to happen than you think they will, and they happen faster than you thought they could.”
Rudiger Dornbusch
4
‖
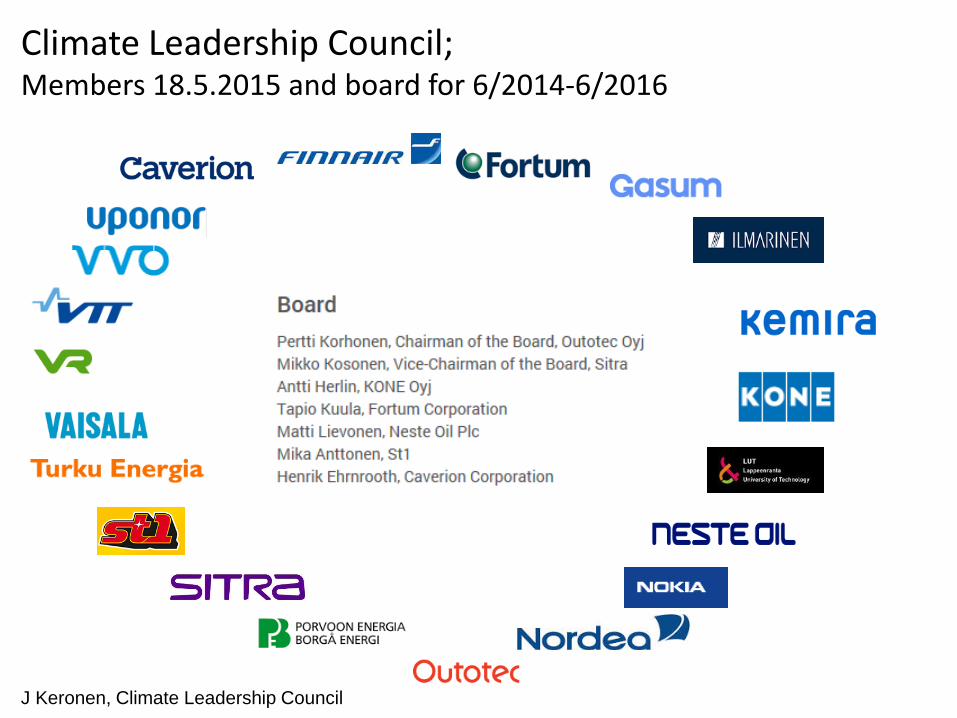
Climate Leadership Council; Members 18.5.2015 and board for 6/2014-6/2016
J Keronen, Climate Leadership Council

7
“We’re the first generation to feel the impact of climate
change and the last generation that can do something
about it.” Gov. Jay Inslee
Thank You!
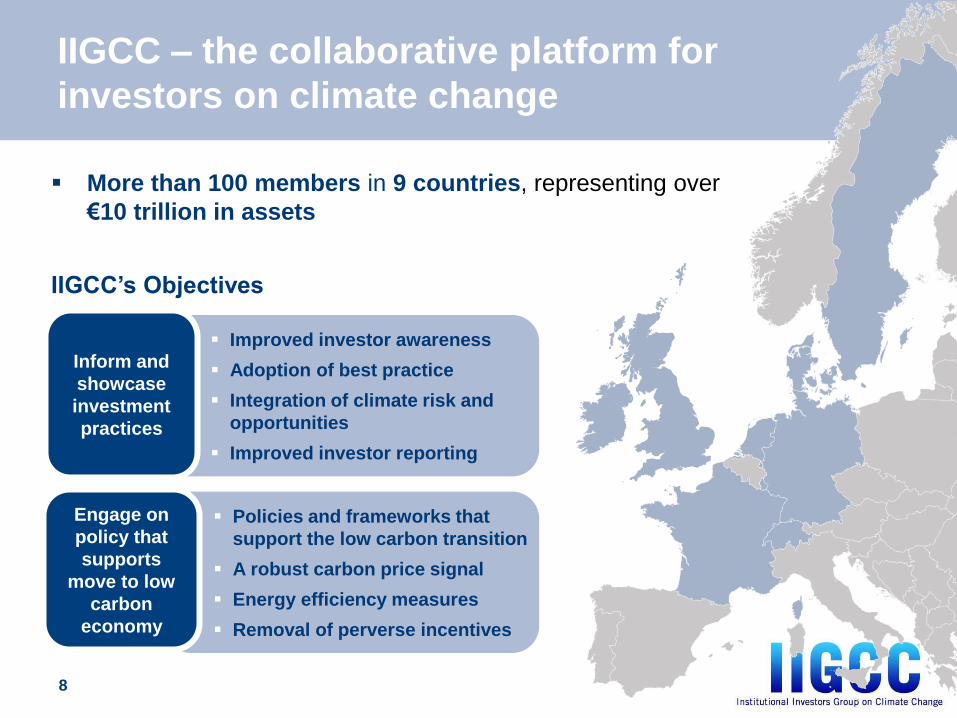
IIGCC – the collaborative platform for
investors on climate change
More than 100 members in 9 countries, representing over
€10 trillion in assets
IIGCC’s Objectives
Policies and frameworks that
support the low carbon transition
A robust carbon price signal
Energy efficiency measures
Removal of perverse incentives
Improved investor awareness
Adoption of best practice
Integration of climate risk and
opportunities
Improved investor reporting
Engage on
policy that
supports
move to low
carbon
economy
Inform and
showcase
investment
practices
8

Climate Change Investment Solutions:
A Guide for Asset Owners – How to use it
Further engage with investment committees and trustee boards about climate change through:
Distributing the guide to investment committee and board members, holding in-house workshops, incorporating the actions into investment and/or board offsite meetings
Share with investment consultants and fund managers (across asset classes) to foster dialogue and action
Bring everyone up to the same level of understanding
Identify where your fund is strong and where it might consider taking further action
Prioritize actions and set objectives, targets, and milestones
Find the Guide here:
www.iigcc.org
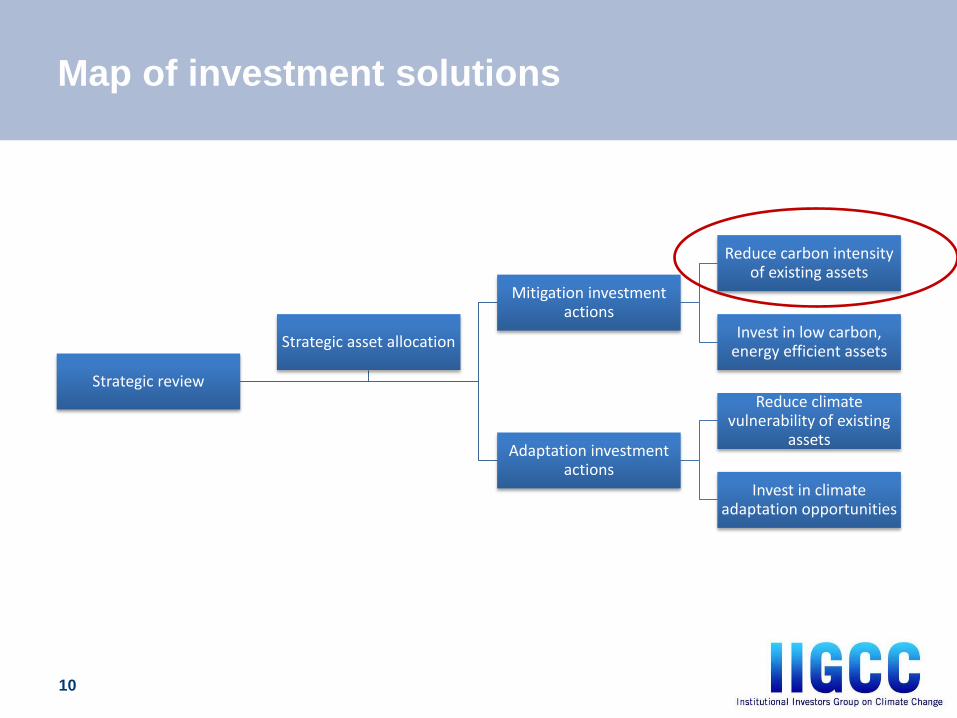
Map of investment solutions
10
Strategic review
Mitigation investment actions
Reduce carbon intensity of existing assets
Invest in low carbon, energy efficient assets
Adaptation investment actions
Reduce climate vulnerability of existing
assets
Invest in climate adaptation opportunities
Strategic asset allocation
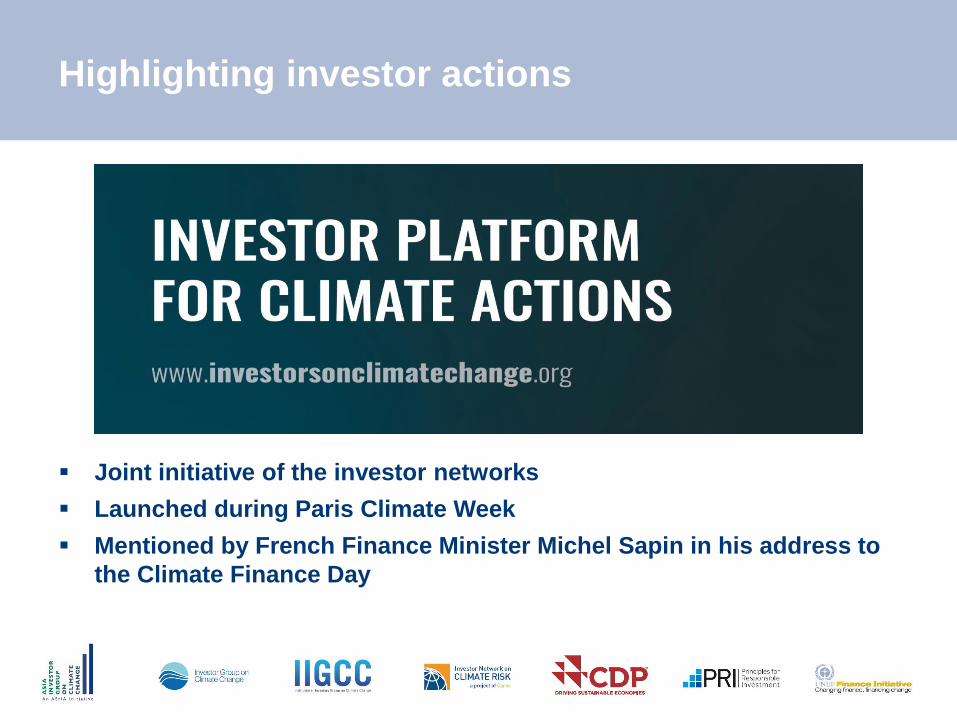
Joint initiative of the investor networks
Launched during Paris Climate Week
Mentioned by French Finance Minister Michel Sapin in his address to
the Climate Finance Day
Highlighting investor actions
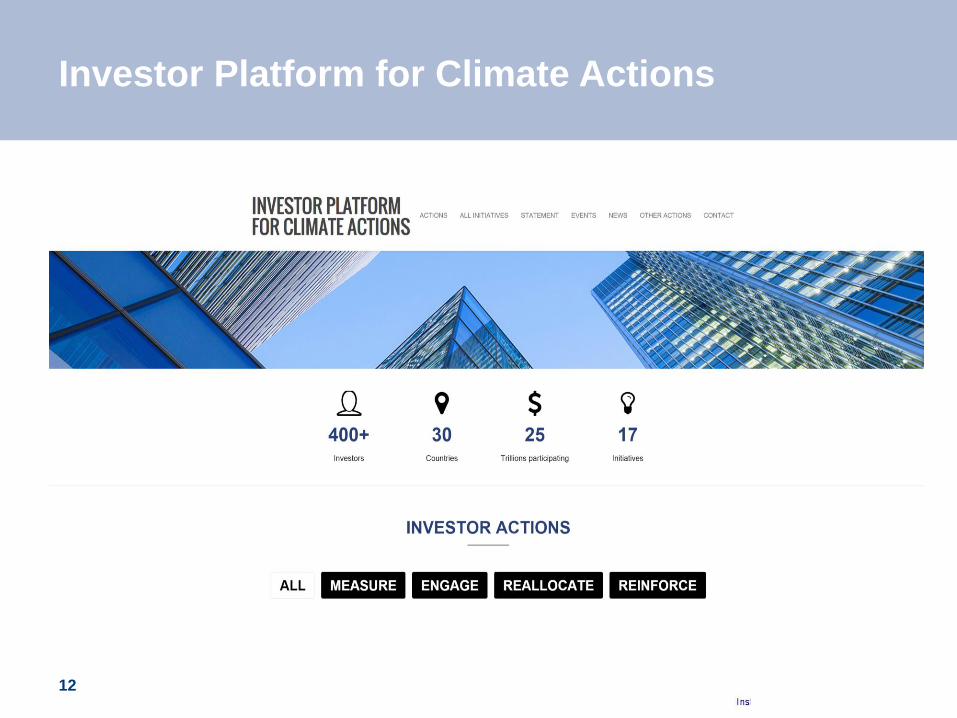
Investor Platform for Climate Actions
12
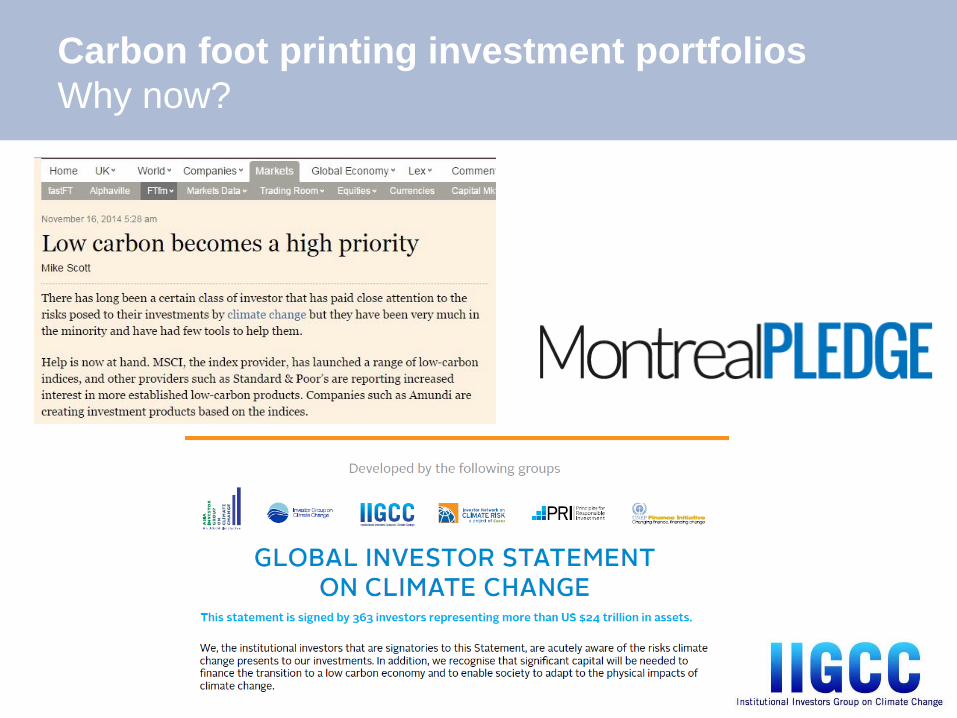
Carbon foot printing investment portfolios
Why now?
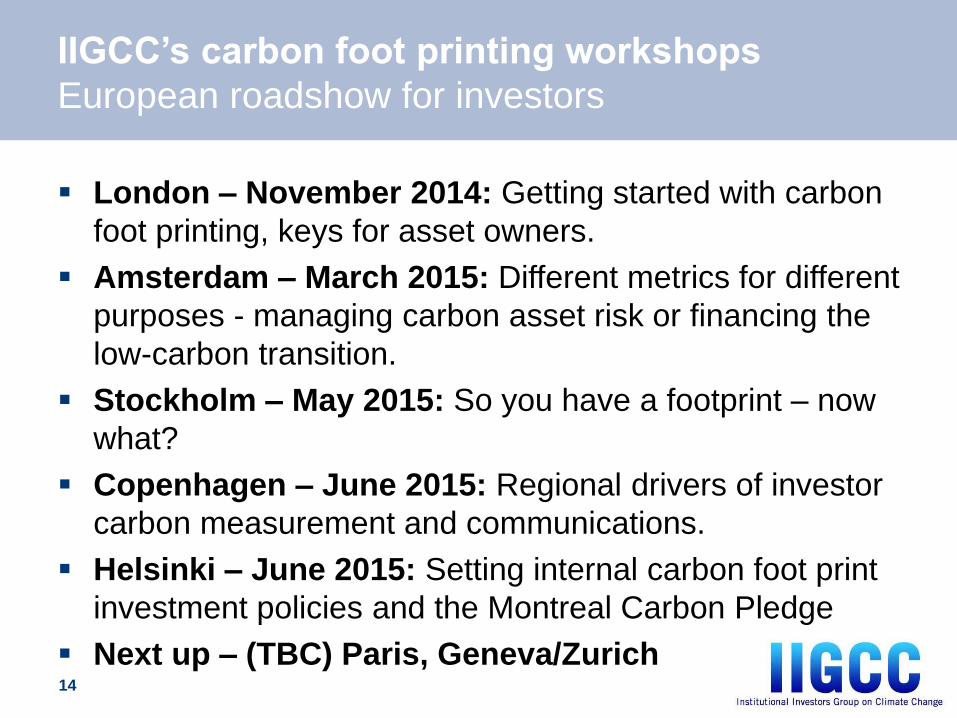
IIGCC’s carbon foot printing workshops
European roadshow for investors
London – November 2014: Getting started with carbon
foot printing, keys for asset owners.
Amsterdam – March 2015: Different metrics for different
purposes - managing carbon asset risk or financing the
low-carbon transition.
Stockholm – May 2015: So you have a footprint – now
what?
Copenhagen – June 2015: Regional drivers of investor
carbon measurement and communications.
Helsinki – June 2015: Setting internal carbon foot print
investment policies and the Montreal Carbon Pledge
Next up – (TBC) Paris, Geneva/Zurich 14

IIGCC Sample portfolio
Top overweight and underweight holdings
15
Company name Portfolio Weight
Benchmark Weight Over weight
SAP SE 4.01% 0.1828% 3.83%
QUALCOMM, Inc. 3.62% 0.3471% 3.28%
Visa, Inc. 2.60% 0.2930% 2.30%
Royal Bk Scot Grp 2.25% 0.0412% 2.21%
Grainger W W Inc 2.05% 0.0426% 2.01%
Axa 2.07% 0.1231% 1.95%
Standard Chartered Plc 2.07% 0.1255% 1.94%
Sumitomo Mitsui Fg 1.96% 0.1426% 1.81%
Hong Kong Exchange 1.69% 0.0656% 1.62%
Bayer Motoren Werk 1.72% 0.1099% 1.61%
Company name
Portfolio
Weight
Benchmark
Weight Under weight
Apple, Inc. 1.7% -1.7%
Johnson & Johnson 0.8% -0.8%
Wells Fargo & Co New 0.7% -0.7%
General Electric Co 0.7% -0.7%
Nestle SA 0.7% -0.7%
Jpmorgan Chase & Co 0.6% -0.6%
Procter & Gamble Co 0.6% -0.6%
Exxon Mobil Corp 0.5% 1.1% -0.6%
Novartis Ag 0.6% -0.6%
Verizon Communications, Inc. 0.6% -0.6%
TOP 10 OVERWEIGHT TOP 10 UNDERWEIGHT
IIGCC developed a sample global equities portfolio with 100 companies.* The
portfolio was not designed to be low-carbon - it could be anyone’s portfolio.
*Copies of the full portfolio were distributed during the event. Contact Morgan LaManna
at IIGCC for a copy or visit the Members’ Area of IIGCC’s website for more resources.
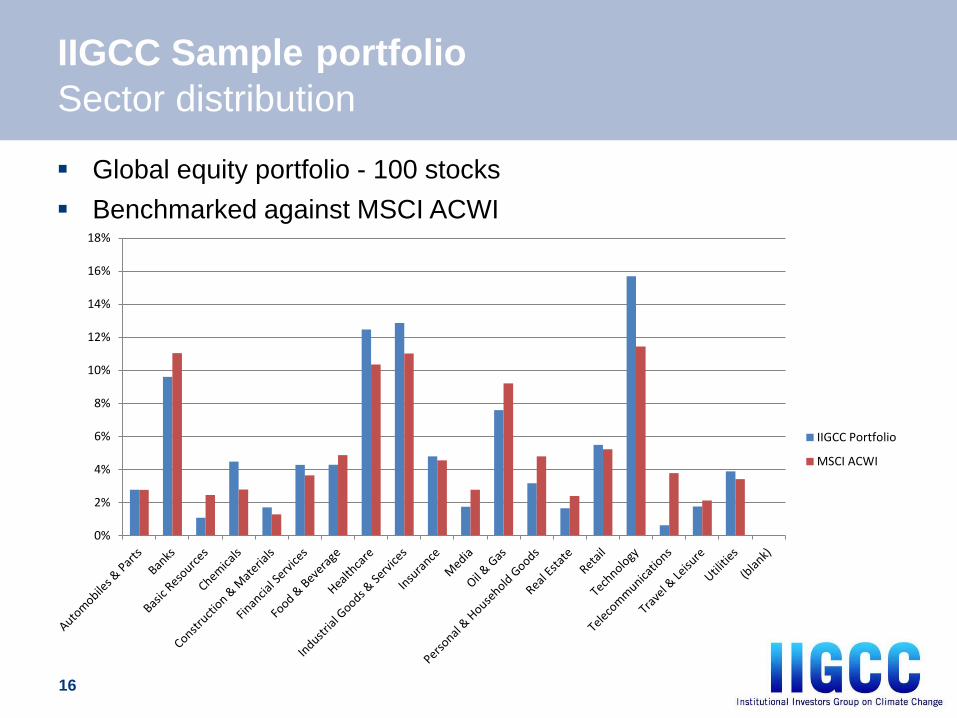
IIGCC Sample portfolio
Sector distribution
16
0%
2%
4%
6%
8%
10%
12%
14%
16%
18%
IIGCC Portfolio
MSCI ACWI
Global equity portfolio - 100 stocks
Benchmarked against MSCI ACWI
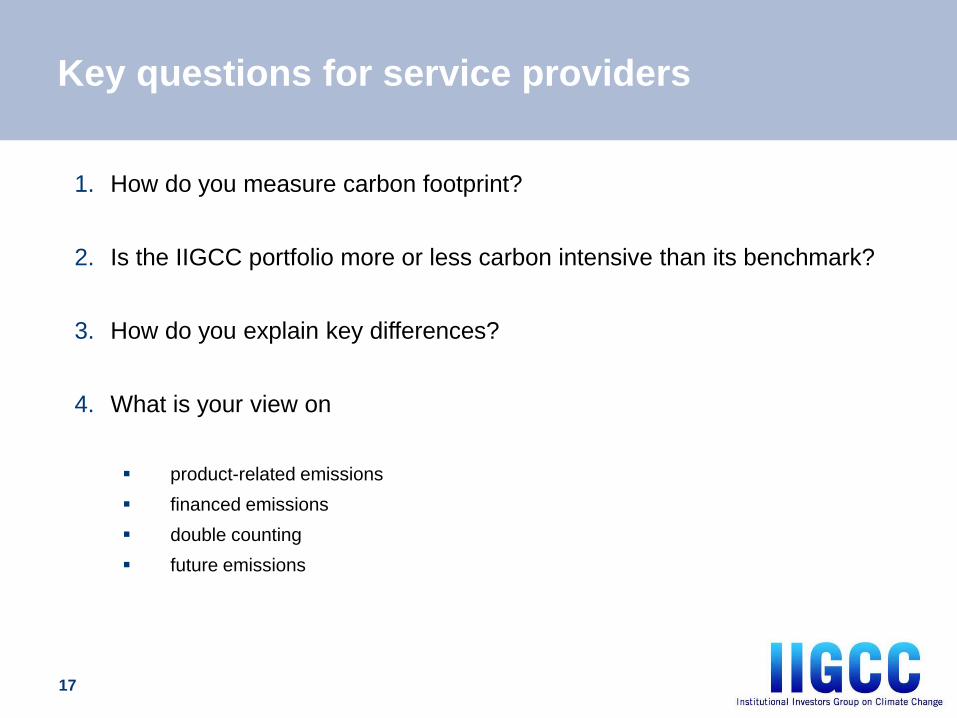
Key questions for service providers
17
1. How do you measure carbon footprint?
2. Is the IIGCC portfolio more or less carbon intensive than its benchmark?
3. How do you explain key differences?
4. What is your view on
product-related emissions
financed emissions
double counting
future emissions

The Climate Impact of Investments An Introduction Dr. Maximilian Horster – Partner, South Pole Group
South Pole Group · June 2015 Page 18
About South Pole Group South Pole Group · June 2015
We measure and reduce environmental
and social impact for 1’000+ clients.
We enable our customers to create value
from sustainability-related activities.
Our staff of 130 employees in 17 offices
worldwide are passionate to fight climate
change.
Page 19
Financial industry reference South Pole Group · June 2015 Page 20
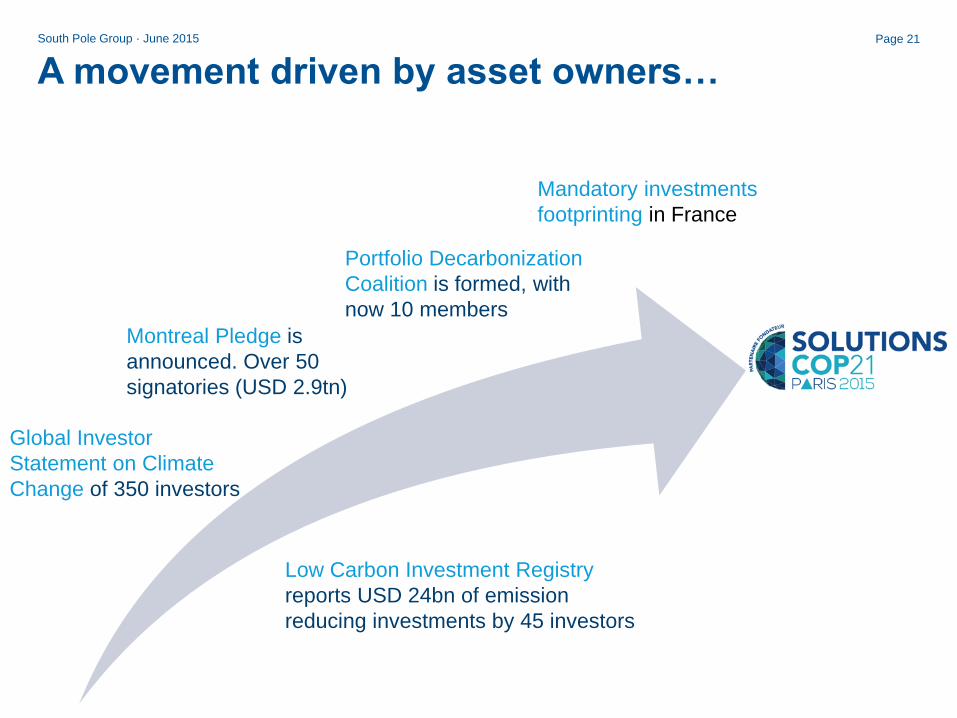
A movement driven by asset owners…
South Pole Group · June 2015 Page 21
Global Investor
Statement on Climate
Change of 350 investors
Portfolio Decarbonization
Coalition is formed, with
now 10 members
Montreal Pledge is
announced. Over 50
signatories (USD 2.9tn)
Mandatory investments
footprinting in France
Low Carbon Investment Registry
reports USD 24bn of emission
reducing investments by 45 investors
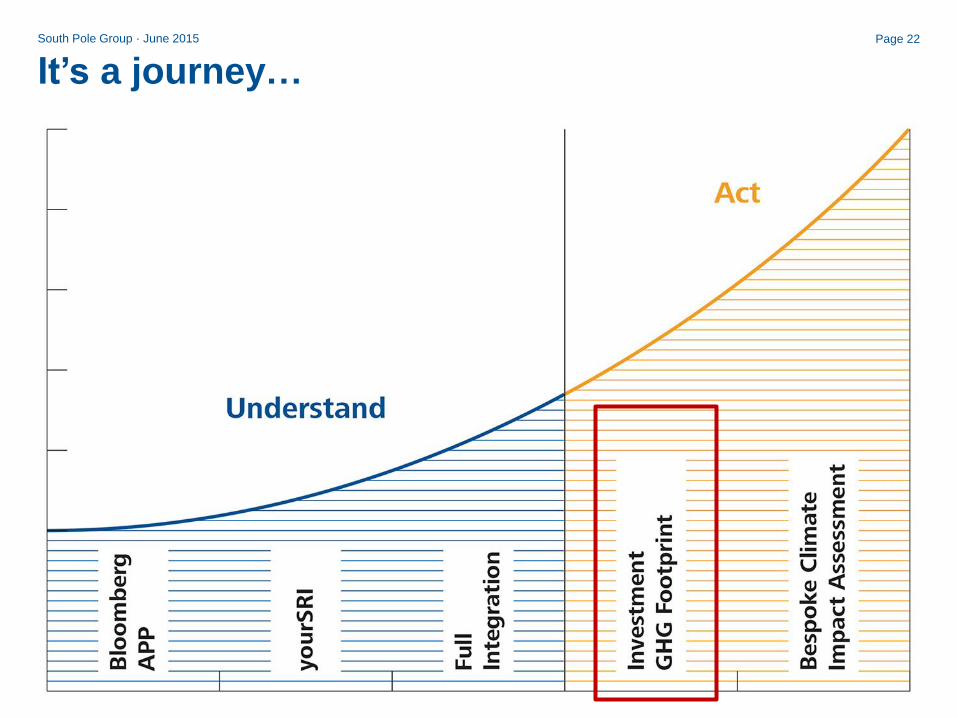
It’s a journey… South Pole Group · June 2015 Page 22
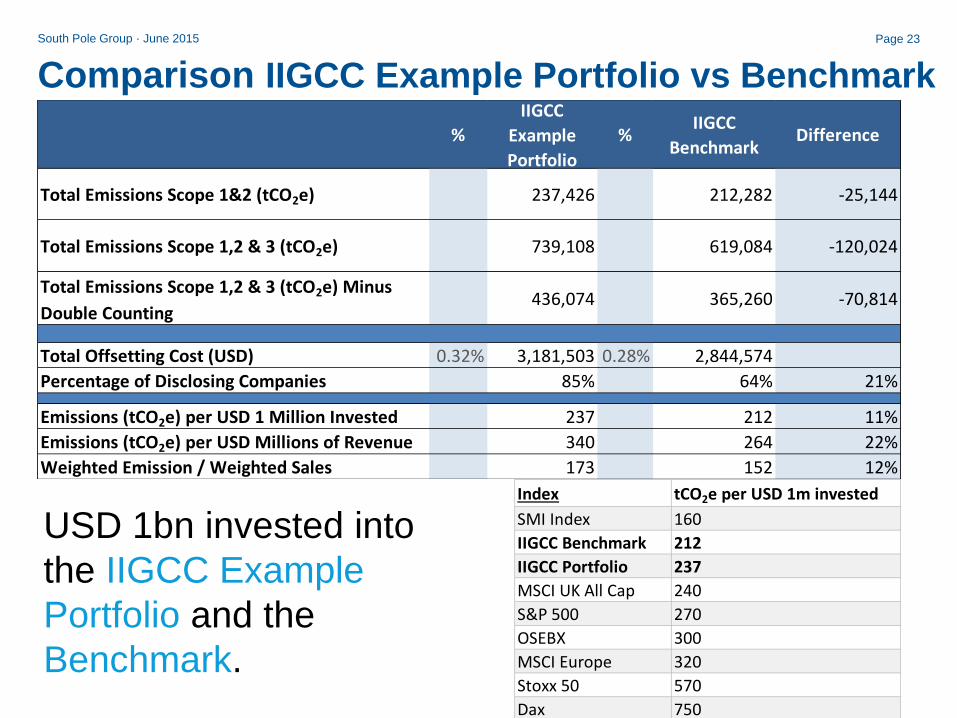
Comparison IIGCC Example Portfolio vs Benchmark
South Pole Group · June 2015 Page 23
USD 1bn invested into
the IIGCC Example
Portfolio and the
Benchmark.
%
IIGCC
Example
Portfolio
%IIGCC
BenchmarkDifference
237,426 212,282 -25,144
739,108 619,084 -120,024
436,074 365,260 -70,814
0.32% 3,181,503 0.28% 2,844,574
85% 64% 21%
237 212 11%
340 264 22%
173 152 12%
Emissions (tCO2e) per USD Millions of Revenue
Weighted Emission / Weighted Sales
Total Emissions Scope 1&2 (tCO2e)
Total Emissions Scope 1,2 & 3 (tCO2e)
Total Emissions Scope 1,2 & 3 (tCO2e) Minus
Double Counting
Total Offsetting Cost (USD)
Percentage of Disclosing Companies
Emissions (tCO2e) per USD 1 Million Invested
Index tCO2e per USD 1m invested
SMI Index 160
IIGCC Benchmark 212
IIGCC Portfolio 237
MSCI UK All Cap 240
S&P 500 270
OSEBX 300
MSCI Europe 320
Stoxx 50 570
Dax 750

Comparing Apples with Apples
South Pole Group · June 2015 Page 24
Investment
Carbon Intensity
(per $ invested)
Revenue
Carbon Intensity
(per $ revenue)
Investment
Carbon Footprint
(tCO2)
Currency
Exchange rate
Portfolio Composition
Market Cap
Revenue
GHG data
Scope
Approximations
U
N
I
T
D
A
T
E
G
H
G
Ceteris Paribus
Forward-looking vs. Snapshot South Pole Group · June 2015 Page 25
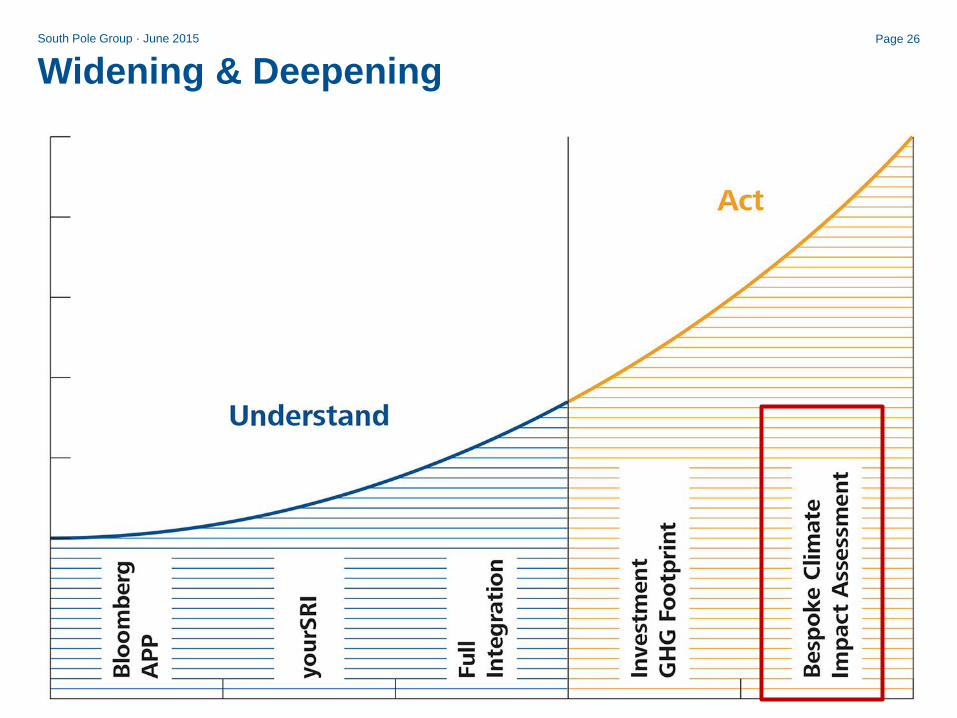
Widening & Deepening South Pole Group · June 2015 Page 26
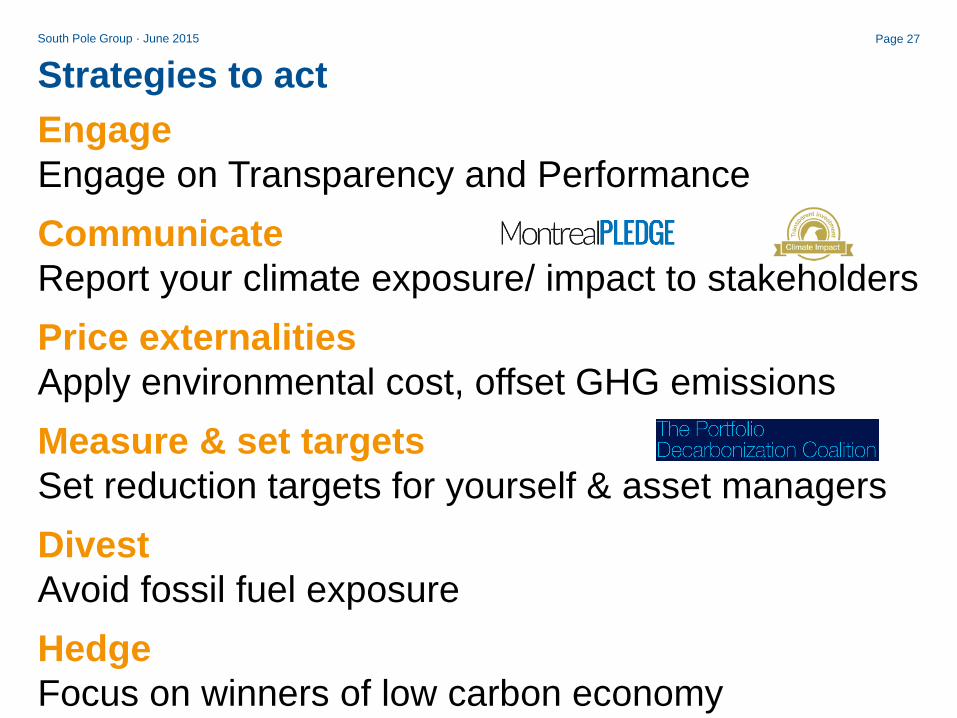
Strategies to act
Engage
Engage on Transparency and Performance
Communicate
Report your climate exposure/ impact to stakeholders
Price externalities
Apply environmental cost, offset GHG emissions
Measure & set targets
Set reduction targets for yourself & asset managers
Divest
Avoid fossil fuel exposure
Hedge
Focus on winners of low carbon economy
South Pole Group · June 2015 Page 27
© 2015 MSCI Inc. All rights reserved. Please refer to the disclaimer at the end of this document.
UNDERSTANDING AND MANAGING CARBON RISK IN INSTITUTIONAL PORTFOLIOS
IIGCC Event
June 2015
Paris
London
Frankfurt
Geneva
Beijing
Hong Kong
Manila
Sydney Cape Town
Mumbai
San Francisco Boston
New York
Rockville
Monterrey
Toronto Portland
Tokyo
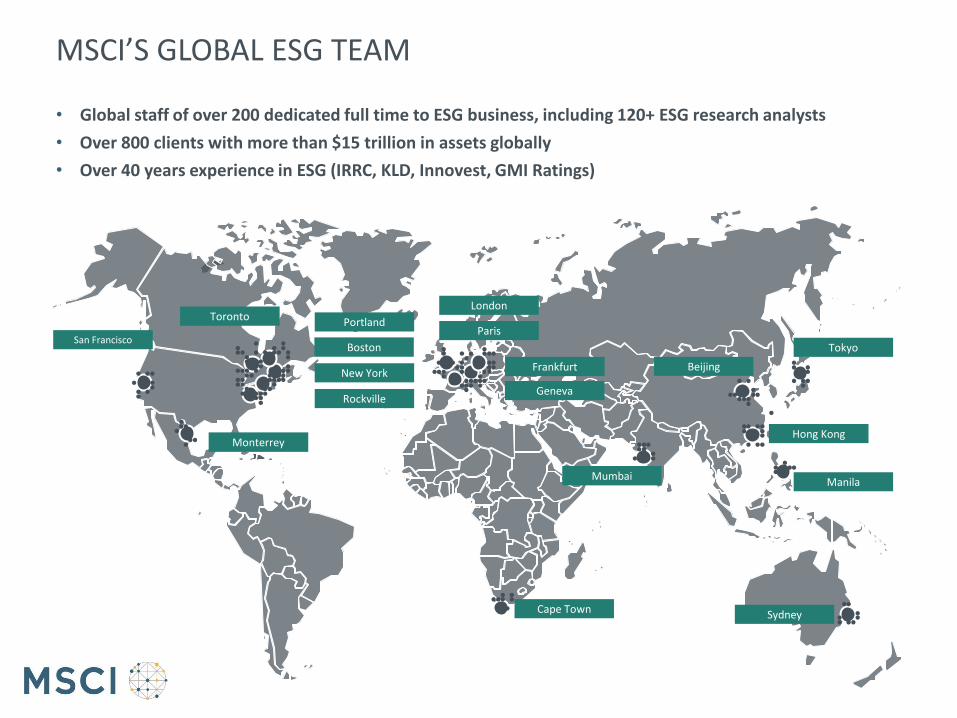
MSCI’S GLOBAL ESG TEAM • Global staff of over 200 dedicated full time to ESG business, including 120+ ESG research analysts
• Over 800 clients with more than $15 trillion in assets globally
• Over 40 years experience in ESG (IRRC, KLD, Innovest, GMI Ratings)
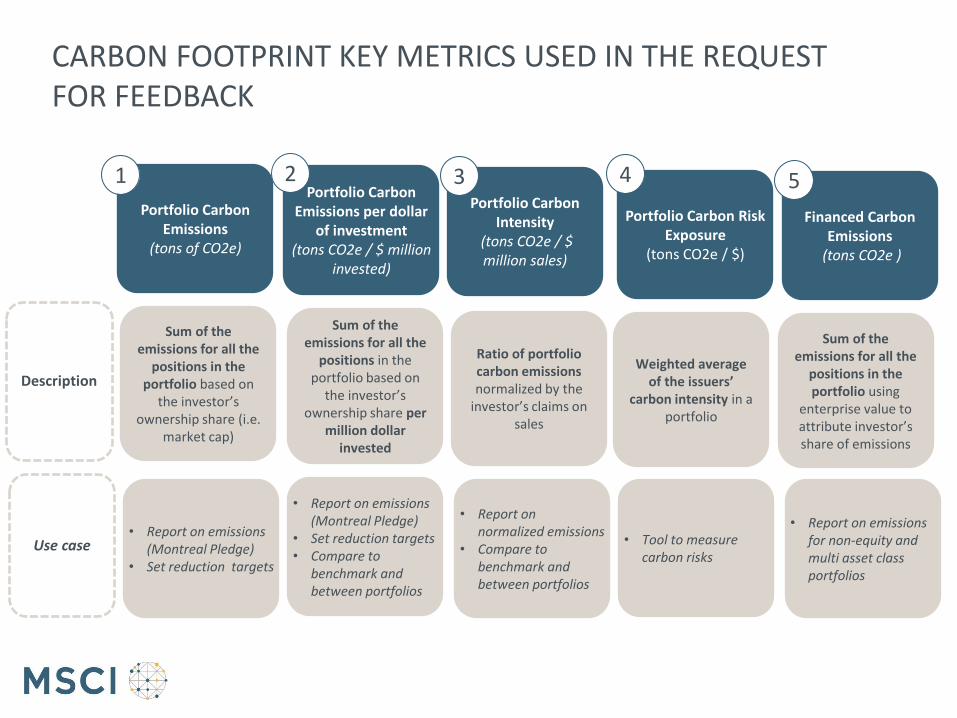
CARBON FOOTPRINT KEY METRICS USED IN THE REQUEST FOR FEEDBACK
Description
Portfolio Carbon Emissions
(tons of CO2e)
Use case
Portfolio Carbon Emissions per dollar
of investment (tons CO2e / $ million
invested)
Sum of the emissions for all the
positions in the portfolio based on
the investor’s ownership share per
million dollar invested
Sum of the emissions for all the
positions in the portfolio based on
the investor’s ownership share (i.e.
market cap)
• Report on emissions (Montreal Pledge)
• Set reduction targets
Portfolio Carbon Intensity
(tons CO2e / $ million sales)
Portfolio Carbon Risk Exposure
(tons CO2e / $)
Weighted average of the issuers’
carbon intensity in a portfolio
Ratio of portfolio carbon emissions normalized by the
investor’s claims on sales
1 2 3 4
Financed Carbon Emissions
(tons CO2e )
Sum of the emissions for all the
positions in the portfolio using
enterprise value to attribute investor’s share of emissions
5
• Report on emissions (Montreal Pledge)
• Set reduction targets • Compare to
benchmark and between portfolios
• Report on normalized emissions
• Compare to benchmark and between portfolios
• Tool to measure carbon risks
• Report on emissions for non-equity and multi asset class portfolios
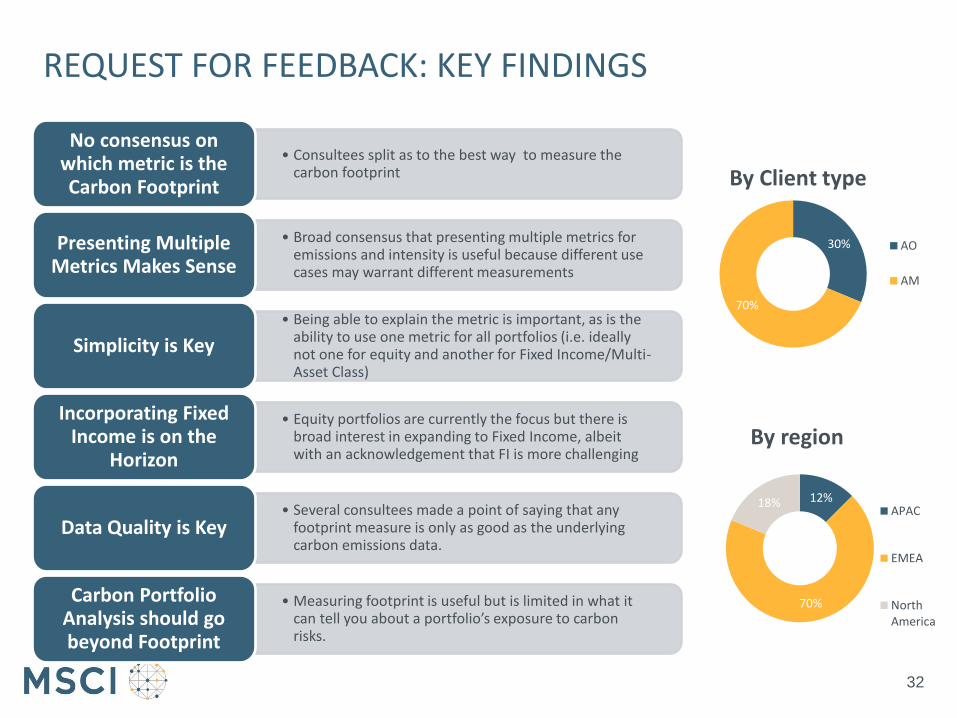
REQUEST FOR FEEDBACK: KEY FINDINGS
32
• Consultees split as to the best way to measure the carbon footprint
No consensus on which metric is the Carbon Footprint
• Broad consensus that presenting multiple metrics for emissions and intensity is useful because different use cases may warrant different measurements
Presenting Multiple Metrics Makes Sense
• Being able to explain the metric is important, as is the ability to use one metric for all portfolios (i.e. ideally not one for equity and another for Fixed Income/Multi-Asset Class)
Simplicity is Key
• Equity portfolios are currently the focus but there is broad interest in expanding to Fixed Income, albeit with an acknowledgement that FI is more challenging
Incorporating Fixed Income is on the
Horizon
• Several consultees made a point of saying that any footprint measure is only as good as the underlying carbon emissions data.
Data Quality is Key
• Measuring footprint is useful but is limited in what it can tell you about a portfolio’s exposure to carbon risks.
Carbon Portfolio Analysis should go beyond Footprint
30%
70%
By Client type
AO
AM
12%
70%
18%
By region
APAC
EMEA
NorthAmerica
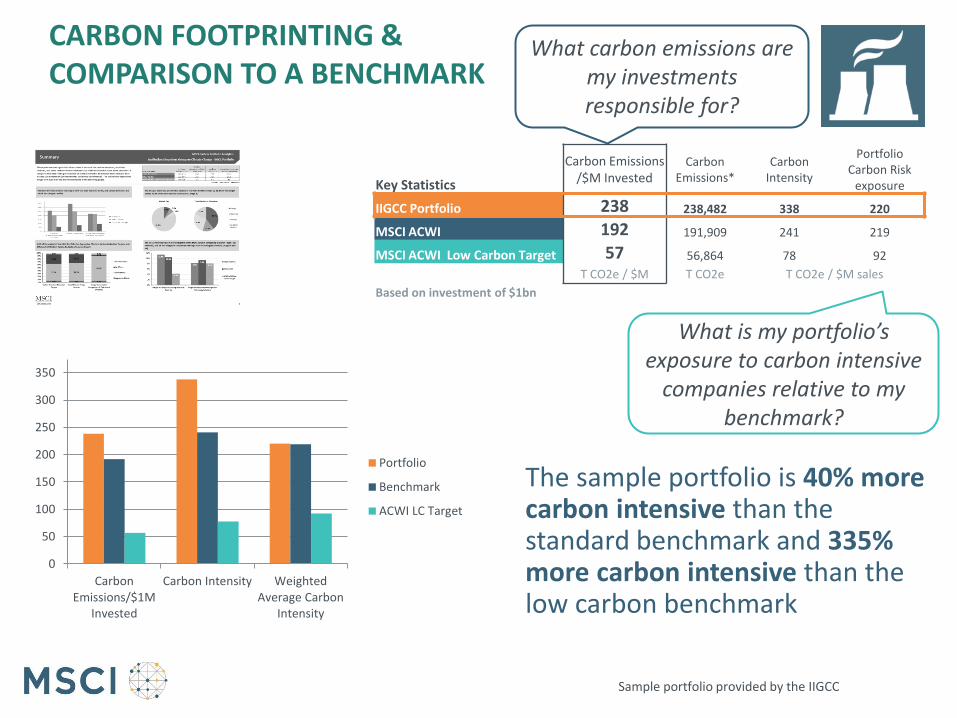
Key Statistics
Carbon Emissions /$M Invested
Carbon Emissions*
Carbon Intensity
Portfolio Carbon Risk
exposure
IIGCC Portfolio 238 238,482 338 220
MSCI ACWI 192 191,909 241 219
MSCI ACWI Low Carbon Target 57 56,864 78 92
T CO2e / $M T CO2e T CO2e / $M sales
Based on investment of $1bn
What is my portfolio’s exposure to carbon intensive
companies relative to my benchmark?
What carbon emissions are my investments responsible for?
The sample portfolio is 40% more carbon intensive than the standard benchmark and 335% more carbon intensive than the low carbon benchmark
Sample portfolio provided by the IIGCC
0
50
100
150
200
250
300
350
CarbonEmissions/$1M
Invested
Carbon Intensity WeightedAverage Carbon
Intensity
Portfolio
Benchmark
ACWI LC Target
CARBON FOOTPRINTING & COMPARISON TO A BENCHMARK
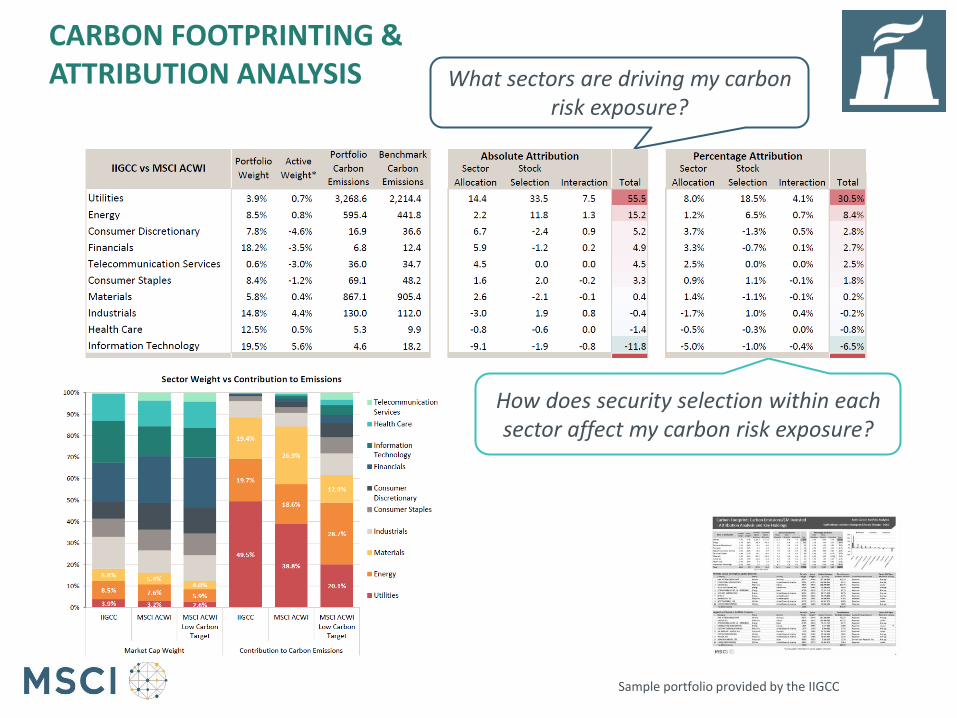
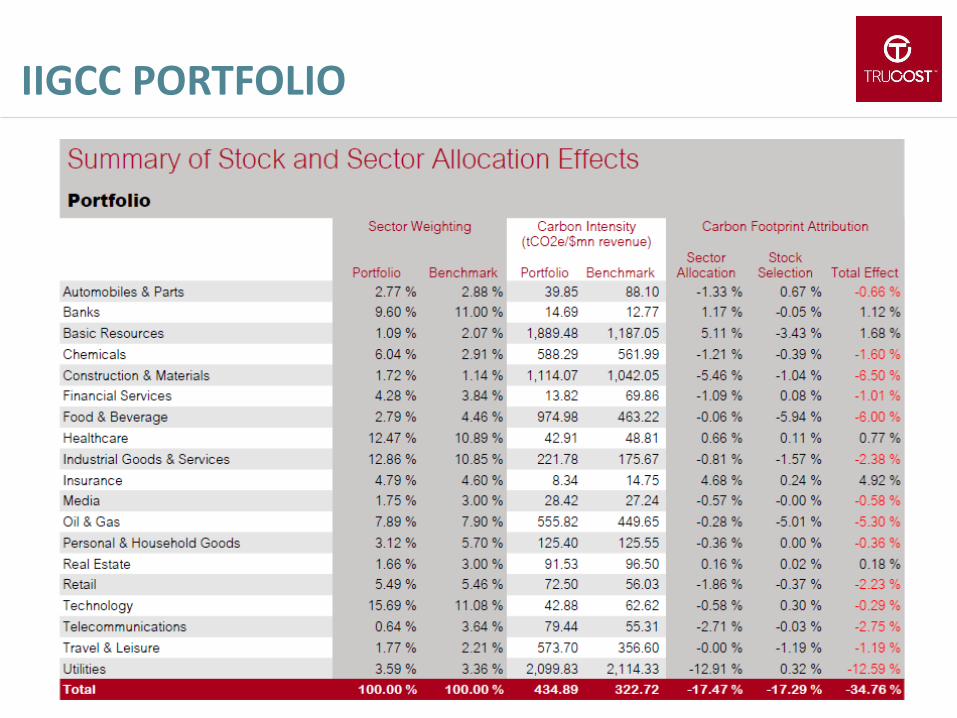
How does security selection within each sector affect my carbon risk exposure?
What sectors are driving my carbon risk exposure?
Sample portfolio provided by the IIGCC
CARBON FOOTPRINTING & ATTRIBUTION ANALYSIS

FORWARD-LOOKING ASSESSMENT: LARGEST CONTRIBUTORS TO EMISSIONS ASSESSED ON CARBON RISK MANAGEMENT PRACTICES
Lafarge contributed 12% to portfolio emissions but demonstrated strong commitment to carbon risk management, with aggressive reduction targets
Canadian Oil Sands is among the largest contributors and is considered a laggard in its industry in terms of carbon risk management Engagement opportunity?
*as of 31 October 2014. Past performance is not indicative of future returns or performance.
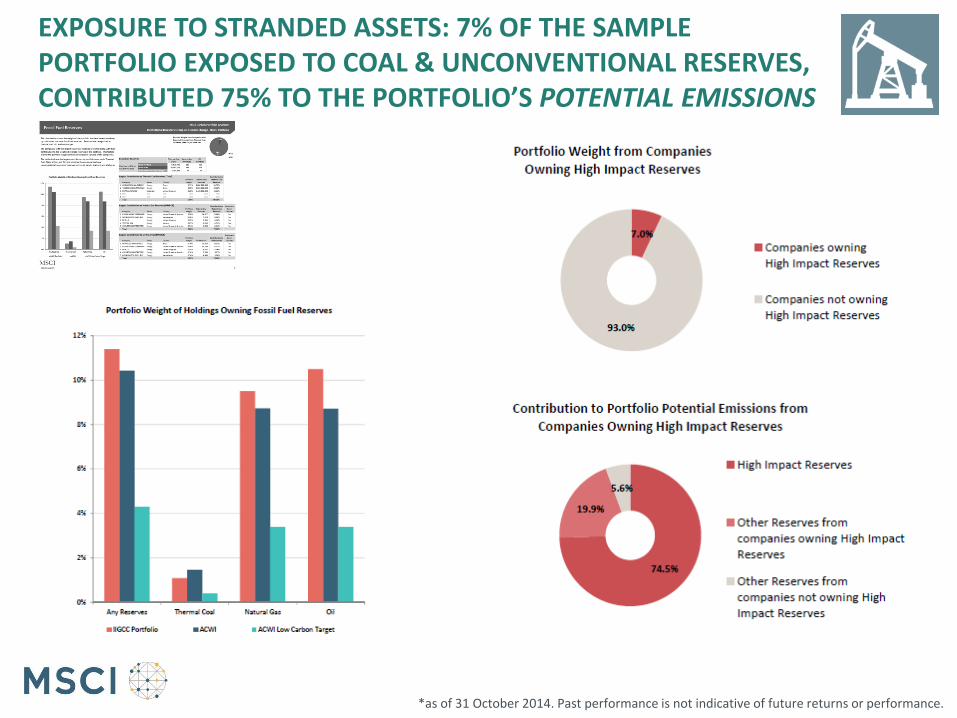
EXPOSURE TO STRANDED ASSETS: 7% OF THE SAMPLE PORTFOLIO EXPOSED TO COAL & UNCONVENTIONAL RESERVES, CONTRIBUTED 75% TO THE PORTFOLIO’S POTENTIAL EMISSIONS
*as of 31 October 2014. Past performance is not indicative of future returns or performance.
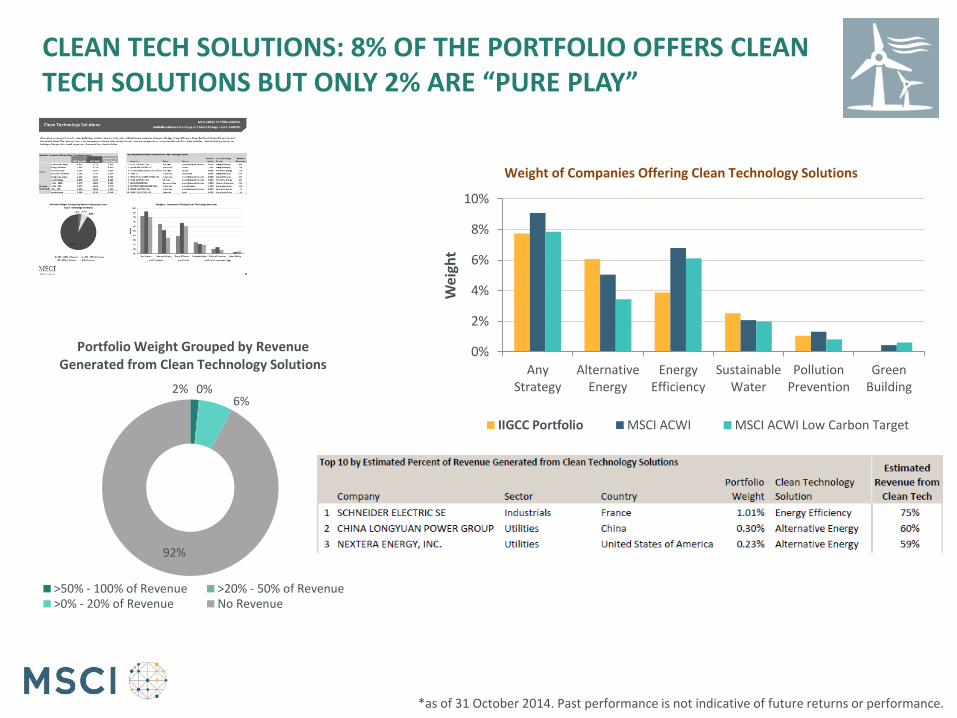
CLEAN TECH SOLUTIONS: 8% OF THE PORTFOLIO OFFERS CLEAN TECH SOLUTIONS BUT ONLY 2% ARE “PURE PLAY”
2% 0% 6%
92%
Portfolio Weight Grouped by Revenue Generated from Clean Technology Solutions
>50% - 100% of Revenue >20% - 50% of Revenue>0% - 20% of Revenue No Revenue
0%
2%
4%
6%
8%
10%
AnyStrategy
AlternativeEnergy
EnergyEfficiency
SustainableWater
PollutionPrevention
GreenBuilding
Wei
ght
Weight of Companies Offering Clean Technology Solutions
IIGCC Portfolio MSCI ACWI MSCI ACWI Low Carbon Target
*as of 31 October 2014. Past performance is not indicative of future returns or performance.
For more than 40 years, MSCI’s research-based indexes and analytics have helped the world’s
leading investors build and manage better portfolios. Clients rely on our offerings for deeper insights into the drivers of performance and risk in their portfolios, broad asset class coverage
and innovative research.
Our line of products and services includes indexes, analytical models, data, real estate benchmarks and ESG research.
MSCI serves 98 of the top 100 largest money managers, according to the most recent P&I
ranking.
For more information, visit us at www.msci.com.
ABOUT MSCI
38
AMERICAS
Americas 1 888 588 4567 *
Atlanta + 1 404 551 3212
Boston + 1 617 532 0920
Chicago + 1 312 675 0545
Monterrey + 52 81 1253 4020
New York + 1 212 804 3901
San Francisco + 1 415 836 8800
Sao Paulo + 55 11 3706 1360
Toronto + 1 416 628 1007
* = toll free
msci.com
CONTACT US
39
EUROPE, MIDDLE EAST & AFRICA
Cape Town + 27 21 673 0100
Frankfurt + 49 69 133 859 00
Geneva + 41 22 817 9777
London + 44 20 7618 2222
Milan + 39 02 5849 0415
Paris 0800 91 59 17 *
ASIA PACIFIC
China North 10800 852 1032 *
China South 10800 152 1032 *
Hong Kong + 852 2844 9333
Mumbai + 91 22 6784 9160
Seoul 00798 8521 3392 *
Singapore 800 852 3749 *
Sydney + 61 2 9033 9333
Taipei 008 0112 7513 *
Tokyo 81 3 5290 1555

This document and all of the information contained in it, including without limitation all text, data, graphs, charts (collectively, the “Information”) is the property of MSCI Inc. or its subsidiaries (collectively, “MSCI”), or MSCI’s licensors, direct or indirect suppliers or any third party involved in making or compiling any Information (collectively, with MSCI, the “Information Providers”) and is provided for informational purposes only. The Information may not be modified, reverse-engineered, reproduced or redisseminated in whole or in part without prior written permission from MSCI.
The Information may not be used to create derivative works or to verify or correct other data or information. For example (but without limitation), the Information may not be used to create indexes, databases, risk models, analytics, software, or in connection with the issuing, offering, sponsoring, managing or marketing of any securities, portfolios, financial products or other investment vehicles utilizing or based on, linked to, tracking or otherwise derived from the Information or any other MSCI data, information, products or services.
The user of the Information assumes the entire risk of any use it may make or permit to be made of the Information. NONE OF THE INFORMATION PROVIDERS MAKES ANY EXPRESS OR IMPLIED WARRANTIES OR REPRESENTATIONS WITH RESPECT TO THE INFORMATION (OR THE RESULTS TO BE OBTAINED BY THE USE THEREOF), AND TO THE MAXIMUM EXTENT PERMITTED BY APPLICABLE LAW, EACH INFORMATION PROVIDER EXPRESSLY DISCLAIMS ALL IMPLIED WARRANTIES (INCLUDING, WITHOUT LIMITATION, ANY IMPLIED WARRANTIES OF ORIGINALITY, ACCURACY, TIMELINESS, NON-INFRINGEMENT, COMPLETENESS, MERCHANTABILITY AND FITNESS FOR A PARTICULAR PURPOSE) WITH RESPECT TO ANY OF THE INFORMATION.
Without limiting any of the foregoing and to the maximum extent permitted by applicable law, in no event shall any Information Provider have any liability regarding any of the Information for any direct, indirect, special, punitive, consequential (including lost profits) or any other damages even if notified of the possibility of such damages. The foregoing shall not exclude or limit any liability that may not by applicable law be excluded or limited, including without limitation (as applicable), any liability for death or personal injury to the extent that such injury results from the negligence or willful default of itself, its servants, agents or sub-contractors.
Information containing any historical information, data or analysis should not be taken as an indication or guarantee of any future performance, analysis, forecast or prediction. Past performance does not guarantee future results.
The Information should not be relied on and is not a substitute for the skill, judgment and experience of the user, its management, employees, advisors and/or clients when making investment and other business decisions. All Information is impersonal and not tailored to the needs of any person, entity or group of persons.
None of the Information constitutes an offer to sell (or a solicitation of an offer to buy), any security, financial product or other investment vehicle or any trading strategy.
It is not possible to invest directly in an index. Exposure to an asset class or trading strategy or other category represented by an index is only available through third party investable instruments (if any) based on that index. MSCI does not issue, sponsor, endorse, market, offer, review or otherwise express any opinion regarding any fund, ETF, derivative or other security, investment, financial product or trading strategy that is based on, linked to or seeks to provide an investment return related to the performance of any MSCI index (collectively, “Index Linked Investments”). MSCI makes no assurance that any Index Linked Investments will accurately track index performance or provide positive investment returns. MSCI Inc. is not an investment adviser or fiduciary and MSCI makes no representation regarding the advisability of investing in any Index Linked Investments.
Index returns do not represent the results of actual trading of investible assets/securities. MSCI maintains and calculates indexes, but does not manage actual assets. Index returns do not reflect payment of any sales charges or fees an investor may pay to purchase the securities underlying the index or Index Linked Investments. The imposition of these fees and charges would cause the performance of an Index Linked Investment to be different than the MSCI index performance.
The Information may contain back tested data. Back-tested performance is not actual performance, but is hypothetical. There are frequently material differences between back tested performance results and actual results subsequently achieved by any investment strategy.
Constituents of MSCI equity indexes are listed companies, which are included in or excluded from the indexes according to the application of the relevant index methodologies. Accordingly, constituents in MSCI equity indexes may include MSCI Inc., clients of MSCI or suppliers to MSCI. Inclusion of a security within an MSCI index is not a recommendation by MSCI to buy, sell, or hold such security, nor is it considered to be investment advice.
Data and information produced by various affiliates of MSCI Inc., including MSCI ESG Research Inc. and Barra LLC, may be used in calculating certain MSCI indexes. More information can be found in the relevant index methodologies on www.msci.com.
MSCI receives compensation in connection with licensing its indexes to third parties. MSCI Inc.’s revenue includes fees based on assets in Index Linked Investments. Information can be found in MSCI Inc.’s company filings on the Investor Relations section of www.msci.com.
MSCI ESG Research Inc. is a Registered Investment Adviser under the Investment Advisers Act of 1940 and a subsidiary of MSCI Inc. Except with respect to any applicable products or services from MSCI ESG Research, neither MSCI nor any of its products or services recommends, endorses, approves or otherwise expresses any opinion regarding any issuer, securities, financial products or instruments or trading strategies and MSCI’s products or services are not intended to constitute investment advice or a recommendation to make (or refrain from making) any kind of investment decision and may not be relied on as such. Issuers mentioned or included in any MSCI ESG Research materials may include MSCI Inc., clients of MSCI or suppliers to MSCI, and may also purchase research or other products or services from MSCI ESG Research. MSCI ESG Research materials, including materials utilized in any MSCI ESG Indexes or other products, have not been submitted to, nor received approval from, the United States Securities and Exchange Commission or any other regulatory body.
Any use of or access to products, services or information of MSCI requires a license from MSCI. MSCI, Barra, RiskMetrics, IPD, FEA, InvestorForce, and other MSCI brands and product names are the trademarks, service marks, or registered trademarks of MSCI or its subsidiaries in the United States and other jurisdictions. The Global Industry Classification Standard (GICS) was developed by and is the exclusive property of MSCI and Standard & Poor’s. “Global Industry Classification Standard (GICS)” is a service mark of MSCI and Standard & Poor’s.
NOTICE AND DISCLAIMER
40
May 2015
Trucost presentation for
IIGCC Stockholm
Lauren Smart,
Executive Director
Carbon Audits: How, what, why?
IIGCC PORTFOLIO
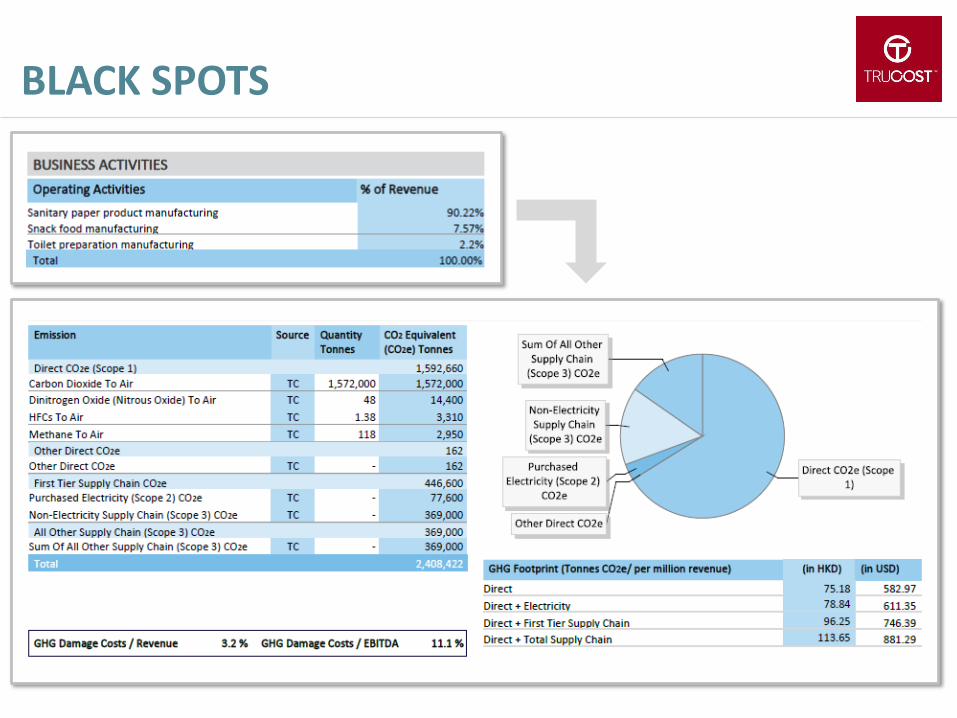
BLACK SPOTS
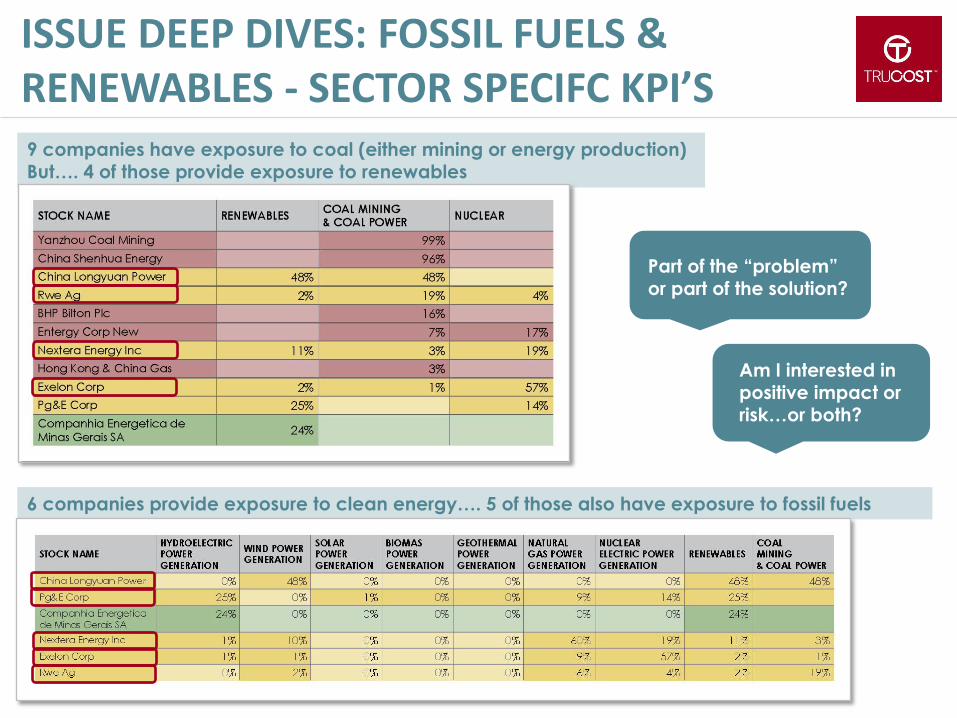
ISSUE DEEP DIVES: FOSSIL FUELS & RENEWABLES - SECTOR SPECIFC KPI’S
Part of the “problem” or part of the solution?
Am I interested in positive impact or risk…or both?
9 companies have exposure to coal (either mining or energy production) But…. 4 of those provide exposure to renewables
6 companies provide exposure to clean energy…. 5 of those also have exposure to fossil fuels
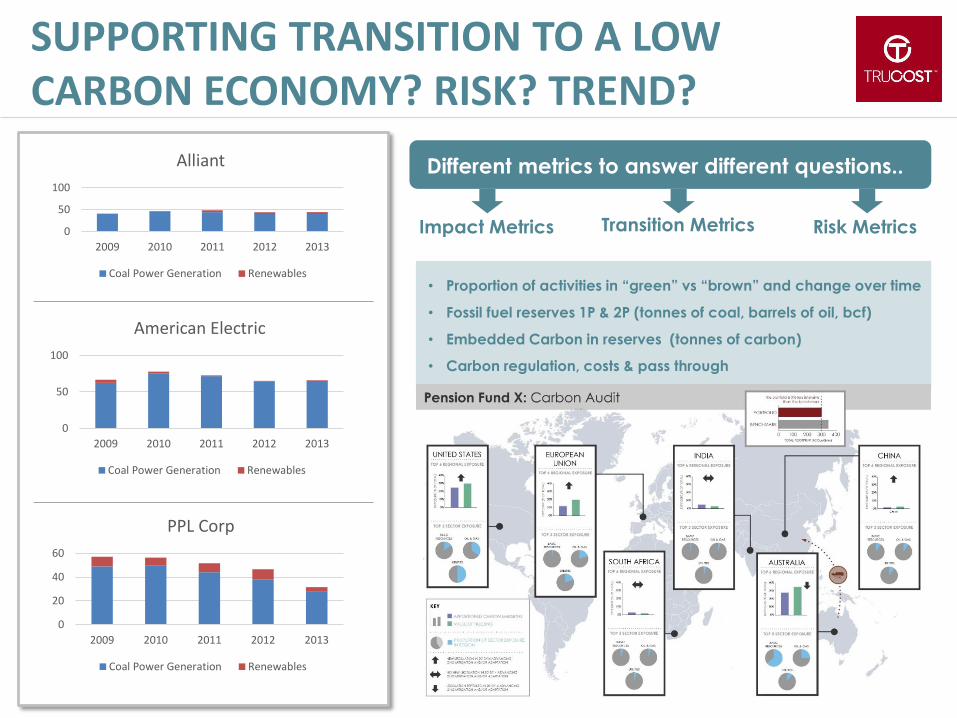
SUPPORTING TRANSITION TO A LOW CARBON ECONOMY? RISK? TREND?
Transition Metrics Risk Metrics Impact Metrics
Different metrics to answer different questions..
• Proportion of activities in “green” vs “brown” and change over time
• Fossil fuel reserves 1P & 2P (tonnes of coal, barrels of oil, bcf)
• Embedded Carbon in reserves (tonnes of carbon)
• Carbon regulation, costs & pass through
0
50
100
2009 2010 2011 2012 2013
Alliant
Coal Power Generation Renewables
0
50
100
2009 2010 2011 2012 2013
American Electric
Coal Power Generation Renewables
0
20
40
60
2009 2010 2011 2012 2013
PPL Corp
Coal Power Generation Renewables
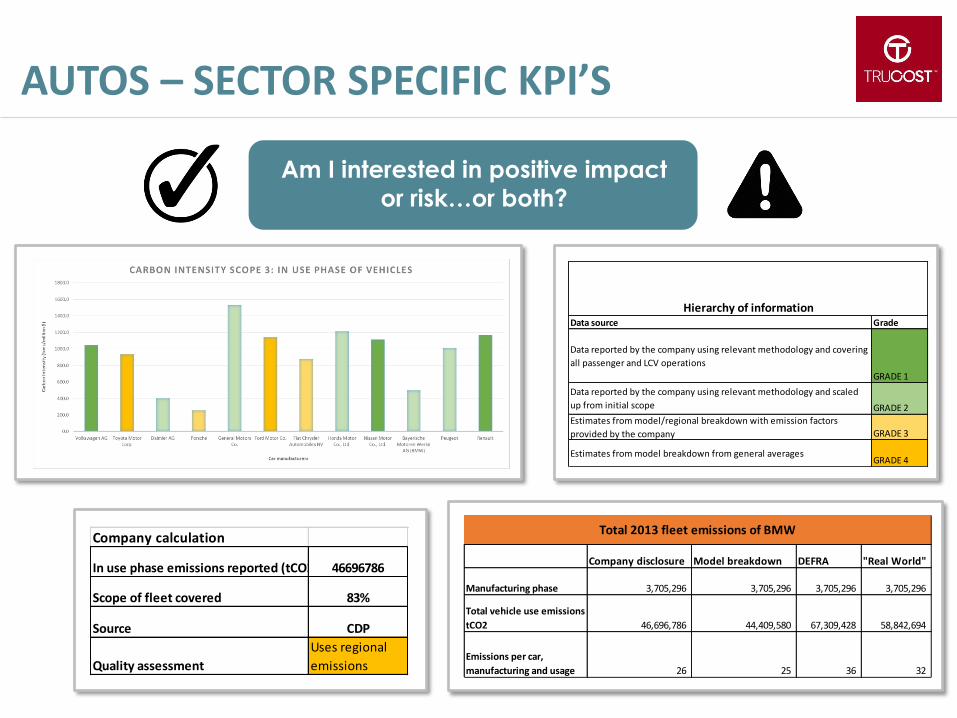
AUTOS – SECTOR SPECIFIC KPI’S
Company disclosure Model breakdown DEFRA "Real World"
Manufacturing phase 3,705,296 3,705,296 3,705,296 3,705,296
Total vehicle use emissions
tCO2 46,696,786 44,409,580 67,309,428 58,842,694
Emissions per car,
manufacturing and usage 26 25 36 32
Total 2013 fleet emissions of BMWCompany calculation
In use phase emissions reported (tCO2) 46696786
Scope of fleet covered 83%
Source CDP
Quality assessment
Uses regional
emissions
Data source Grade
Data reported by the company using relevant methodology and covering
all passenger and LCV operations
GRADE 1
Data reported by the company using relevant methodology and scaled
up from initial scope GRADE 2
Estimates from model/regional breakdown with emission factors
provided by the company GRADE 3
Estimates from model breakdown from general averagesGRADE 4
Hierarchy of information
Am I interested in positive impact
or risk…or both?
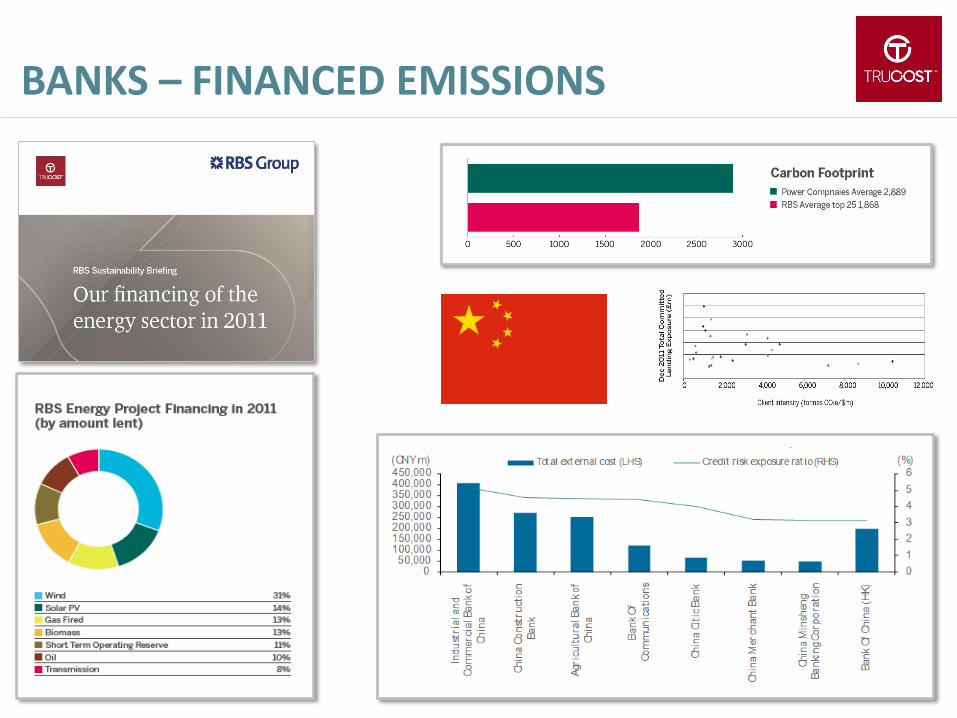
BANKS – FINANCED EMISSIONS
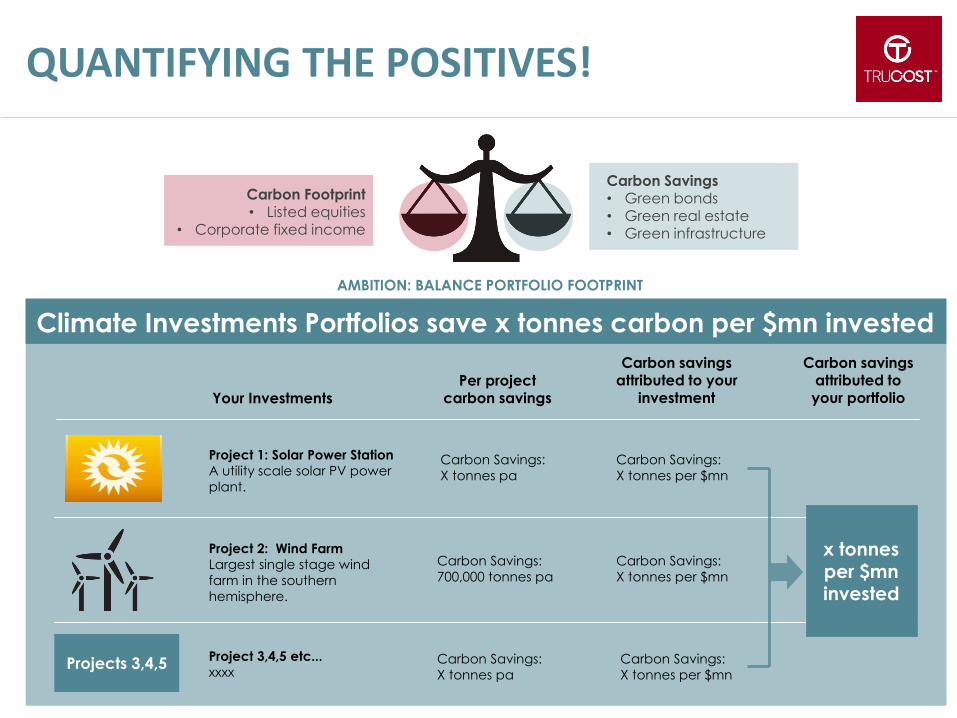
QUANTIFYING THE POSITIVES!
Project 1: Solar Power Station
A utility scale solar PV power
plant.
Project 2: Wind Farm
Largest single stage wind
farm in the southern
hemisphere.
Your Investments
Projects 3,4,5
Carbon Savings:
X tonnes pa
Carbon Savings:
700,000 tonnes pa
Project 3,4,5 etc...
xxxx
Per project carbon savings
Carbon savings attributed to your
investment
Carbon savings attributed to
your portfolio
Carbon Savings:
X tonnes pa
Carbon Savings:
X tonnes per $mn
Carbon Savings:
X tonnes per $mn
Carbon Savings:
X tonnes per $mn
Climate Investments Portfolios save x tonnes carbon per $mn invested
x tonnes per $mn invested
AMBITION: BALANCE PORTFOLIO FOOTPRINT
Carbon Footprint
• Listed equities • Corporate fixed income
Carbon Savings • Green bonds • Green real estate • Green infrastructure

AN EVIDENCE BASE FROM WHICH TO DEVELOP A STRATEGY
MEASURE
Divest
Hedge
Engage
Monitor
Manage
New Products
Invest in companies & assets best positioned
for a low carbon economy Quantify the benefits
>3x Capex spent by world’s largest fossil companies on exploration than dividends
e.g. Identify
Companies with coal activities, proportion & change over time
Embed environmental considerations in your investment strategy
Create new investment products with reduced carbon exposure
Strategic Asset Allocation Green Bonds, Infrastructure etc.
Undertake a carbon audit of portfolio constituents to understand your exposure Address other environmental issues
Address impacts in other asset classes
COMMUNICATION
Lauren Smart
Executive Director Trucost Plc, 22 Chancery Lane London UK Tel: +44 20 7160 9814 E-Mail: [email protected]
QUESTIONS? QUESTIONS?
THE MONTREAL
CARBON PLEDGE
Investor workshop on carbon footprinting, 17th June 2015
Yulia Sofronova, Networks & Global Outreach Manager, PRI
Sagarika Chatterjee, Associate Director, PRI
A CALL TO ACTION
1. Sign the Montréal Carbon Pledge
2. Ensure lobbying activities within your spheres of influence are at least neutral, if not supportive, of strong climate action
3. Ask your CEO to meet your local finance minister to explain the risks to the global economy if we do not get an ambitious agreement in Paris
“Investors have a sacred and legal fiduciary duty to engage with this issue. We have 15 months to put a regulatory framework in place to guide us over the next 50 years. If we do not do this in Paris, it will take another 10 years to rally the political will to come to another agreement. By 2025, it will be too late to keep us under 2 degrees and it will be incredibly expensive.”
Christiana Figueres, Executive Secretary of the UNFCCC, PRI in Person 2014
THE PRI’S 2015 ACTIVITIES TOWARDS COP21
Measure:
Montréal Carbon Pledge
Engage:
Investor Working Group on Corporate Climate Lobbying, water risk engagement
G7 finance ministers urged to support strong global agreement
Reduce emissions:
PRI Asset Owner Climate Change Strategy Project
Portfolio Decarbonization Coalition
Events and peer-peer exchange:
PRI in Person: 8 September in London
Caring for Climate Business Forum: 7-9 December during COP21
PRI is focusing on enabling investors to:
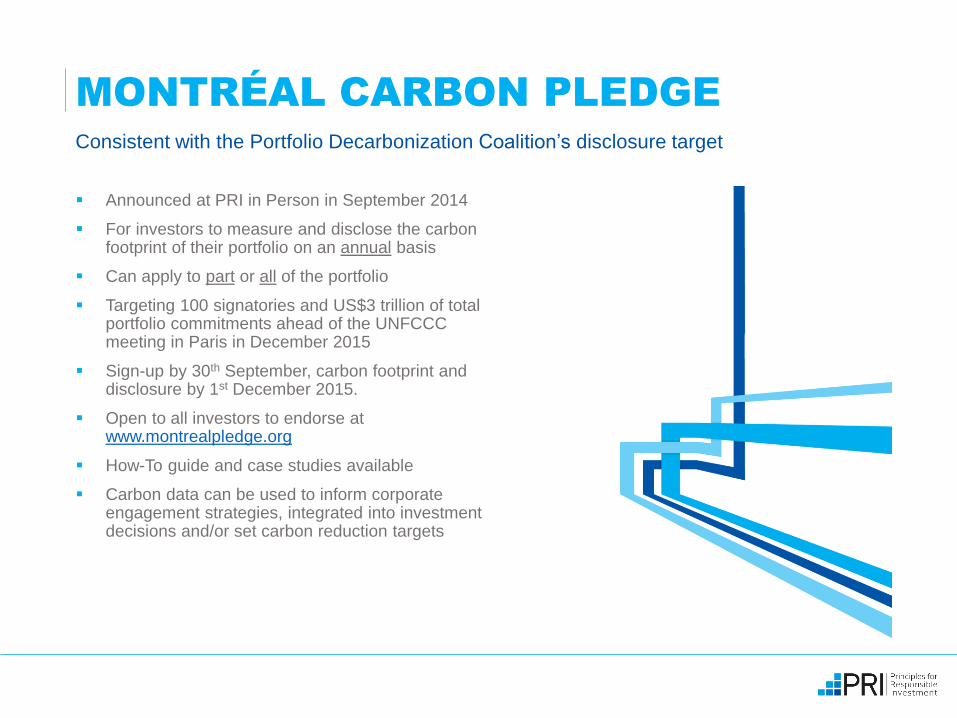
MONTRÉAL CARBON PLEDGE
Consistent with the Portfolio Decarbonization Coalition’s disclosure target
Announced at PRI in Person in September 2014
For investors to measure and disclose the carbon footprint of their portfolio on an annual basis
Can apply to part or all of the portfolio
Targeting 100 signatories and US$3 trillion of total portfolio commitments ahead of the UNFCCC meeting in Paris in December 2015
Sign-up by 30th September, carbon footprint and disclosure by 1st December 2015.
Open to all investors to endorse at www.montrealpledge.org
How-To guide and case studies available
Carbon data can be used to inform corporate engagement strategies, integrated into investment decisions and/or set carbon reduction targets
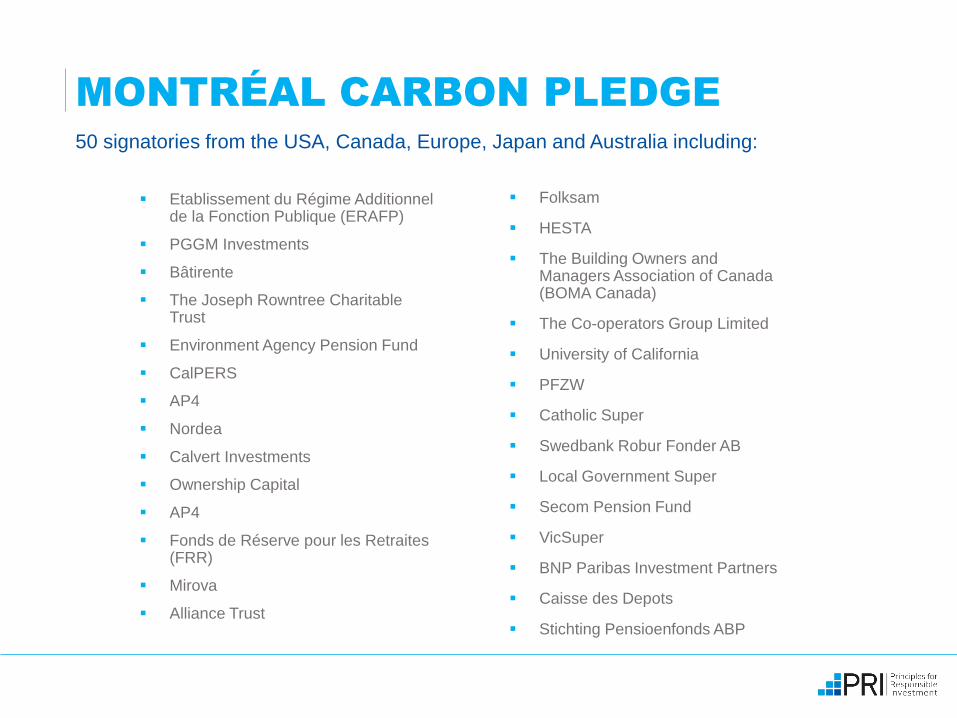
MONTRÉAL CARBON PLEDGE
50 signatories from the USA, Canada, Europe, Japan and Australia including:
Etablissement du Régime Additionnel de la Fonction Publique (ERAFP)
PGGM Investments
Bâtirente
The Joseph Rowntree Charitable Trust
Environment Agency Pension Fund
CalPERS
AP4
Nordea
Calvert Investments
Ownership Capital
AP4
Fonds de Réserve pour les Retraites (FRR)
Mirova
Alliance Trust
Folksam
HESTA
The Building Owners and Managers Association of Canada (BOMA Canada)
The Co-operators Group Limited
University of California
PFZW
Catholic Super
Swedbank Robur Fonder AB
Local Government Super
Secom Pension Fund
VicSuper
BNP Paribas Investment Partners
Caisse des Depots
Stichting Pensioenfonds ABP
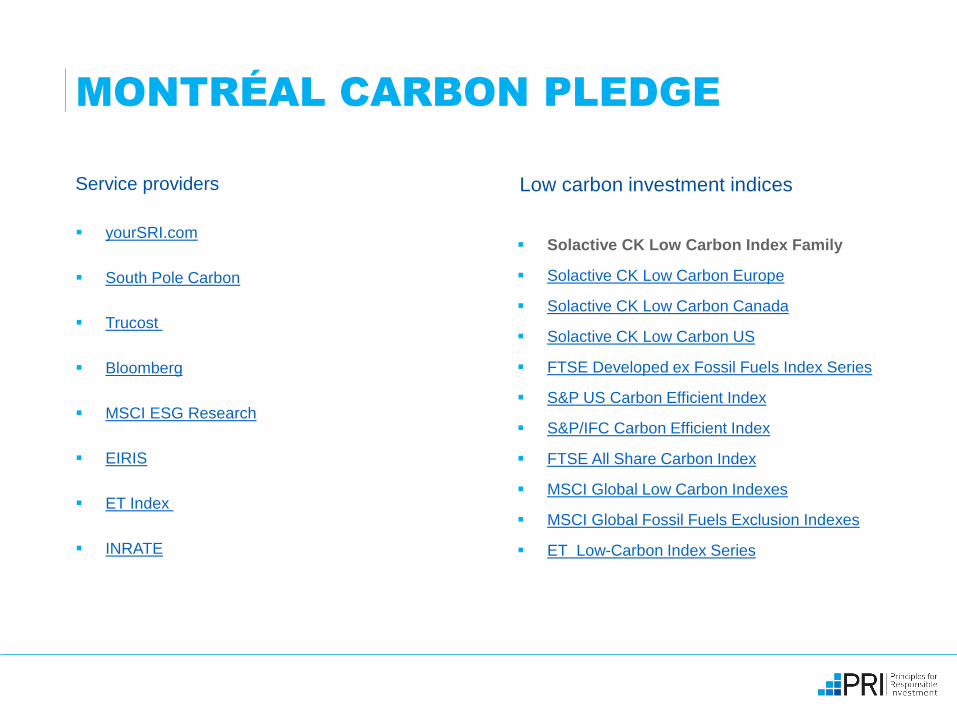
MONTRÉAL CARBON PLEDGE
yourSRI.com
South Pole Carbon
Trucost
Bloomberg
MSCI ESG Research
EIRIS
ET Index
INRATE
Solactive CK Low Carbon Index Family
Solactive CK Low Carbon Europe
Solactive CK Low Carbon Canada
Solactive CK Low Carbon US
FTSE Developed ex Fossil Fuels Index Series
S&P US Carbon Efficient Index
S&P/IFC Carbon Efficient Index
FTSE All Share Carbon Index
MSCI Global Low Carbon Indexes
MSCI Global Fossil Fuels Exclusion Indexes
ET Low-Carbon Index Series
Service providers Low carbon investment indices
PRI Asset Owner Climate Change Strategy Project:
Focuses on whether and how to set an emissions reduction goal
Aims to assist asset owners in preparing for a transition to a low carbon economy
Public report with recommendations and pilot framework in November 2015
The Portfolio Decarbonization Coalition:
Encourages investors to measure and disclose carbon footprint – targeting US$500 billion in AUM
Assembling an investor coalition that will in aggregate decarbonise US$100 billion in AUM
Co-founded by AP4, Amundi Asset Management, UNEP FI and the Carbon Disclosure Project
WHAT FURTHER STEPS CAN INVESTORS TAKE?

Investor interest in:
Coal divestment implications
Low carbon investment opportunities
Engagement: stranded assets, shareholder resolutions
Regulation: France, California
Examples:
Europe: AXA Group, BNP Paribas, Environment Agency Pension Fund and PFZW
USA: CalPERS, University of California
Australia: Local Government Super
GLOBAL TRENDS IN INVESTOR ACTION ON
CLIMATE CHANGE
RESOURCES
How-To: Five steps to measure your portfolio’s carbon footprint: http://montrealpledge.org/how-to/the-five-steps/
Case studies: http://montrealpledge.org/how-to/case-studies/
Engagement: http://www.unpri.org/areas-of-work/clearinghouse/coordinated-collaborative-engagements/
PRI in Person 2015: http://www.unpri.org/events/pri-in-person-2015/
Portfolio Decarbonization Coalition: http://unepfi.org/pdc/
Key questions for discussion
What has been your experience of carbon footprinting?
What are the key issues to address/key internal processes to complete before embarking on this exercise?
What are the main challenges/what are the main benefits of footprinting?
Should footprinting be extended to other asset classes?
Towards a global standard for measuring carbon footprint?
How could results be used?
Objective setting
Investment decisions and/or engagement with companies
Selection and/or engagement with asset managers
Reporting to beneficiaries
60
Contact:
Stephanie Pfeifer
Chief Executive
Email: [email protected]
Or
Morgan LaManna
Project Manager
Email: [email protected]
www.iigcc.org
Contact