carbon disclosure project qantas airways disclosure project cdp 2012 investor cdp 2012 information...
TRANSCRIPT

Carbon Disclosure ProjectCDP 2012 Investor CDP 2012 Information Request
Qantas Airways
Module: Introduction
Page: Introduction
0.1
Introduction
Please give a general description and introduction to your organization
Founded in the Queensland outback in 1920, Qantas has grown to be Australia's largest domestic and international airline. Registered originally as the Queenslandand Northern Territory Aerial Services Limited (QANTAS), Qantas is widely regarded as the world's leading long distance airline and one of the strongest brands in
Australia. We have built a reputation for excellence in safety, operational reliability, engineering and maintenance, and customer service. The Qantas Group's main
business is the transportation of customers using two complementary airline brands - Qantas and Jetstar. We also operate subsidiary businesses including otherairlines, and businesses in specialist markets such as Qantas Holidays and Q Catering. Our airline brands operate regional, domestic and international services.
The Group's broad portfolio of subsidiary businesses ranges from Qantas Freight Enterprises to Qantas Frequent Flyer. We employ 35,700 people with 93 per cent of
them based within Australia.
0.2
Reporting Year
Please state the start and end date of the year for which you are reporting data.
The current reporting year is the latest/most recent 12-month period for which data is reported. Enter the dates of this year first.We request data for more than one reporting period for some emission accounting questions. Please provide data for the three years prior to the current reporting year if you
have not provided this information before, or if this is the first time you have answered a CDP information request. (This does not apply if you have been offered and selected
the option of answering the shorter questionnaire). If you are going to provide additional years of data, please give the dates of those reporting periods here. Work backwards
from the most recent reporting year.Please enter dates in following format: day(DD)/month(MM)/year(YYYY) (i.e. 31/01/2001).
Enter Periods that will be disclosed
Thu 01 Jul 2010 - Thu 30 Jun 2011
0.3Country list configuration
Please select the countries for which you will be supplying data. This selection will be carried forward to assist you in completing your response
Select country
Australia
0.4

Currency selection Please select the currency in which you would like to submit your response. All financial information contained in the response should be in this currency.
AUD ($)
0.5Please select if you wish to complete a shorter information request
0.6
ModulesAs part of the Investor CDP information request, electric utilities, companies with electric utility activities or assets, companies in the automobile or auto componentmanufacture sectors and companies in the oil and gas industry should complete supplementary questions in addition to the main questionnaire.
If you are in these sectors (according to the Global Industry Classification Standard (GICS)), the corresponding sector modules will be marked as default options to yourinformation request. If you want to query your classification, please email [email protected] you have not been presented with a sector module that you consider would be appropriate for your company to answer, please select the module below. If you wish to view
the questions first, please see https://www.cdproject.net/en-US/Programmes/Pages/More-questionnaires.aspx.
Further Information
Module: Management [Investor]
Page: 1. Governance
1.1
Where is the highest level of direct responsibility for climate change within your company?
Individual/Sub-set of the Board or other committee appointed by the Board
1.1a
Please identify the position of the individual or name of the committee with this responsibility
The Board's Committee for Health, Environment, Safety and Security (CHESS)
The CHESS Committee has overall responsibility for climate change related issues.
The company's progress and status with regard to climate change and other environmental issues are reviewed three times a year at CHESS meetings and at Qantas
Board meetings.
Internal reports are provided by Management to the Board through the quarterly Qantas Board Risk report and quarterly CHESS reports.
The CHESS Charter can be viewed at http://www.qantas.com.au/infodetail/about/corporateGovernance/SESCCharter.pdf

The CHESS Charter can be viewed at http://www.qantas.com.au/infodetail/about/corporateGovernance/SESCCharter.pdf
1.2Do you provide incentives for the management of climate change issues, including the attainment of targets?
Yes
1.2aPlease complete the table
Who isentitled to
benefit fromthese
incentives?
The typeof
incentivesIncentivised performance indicator
Managementgroup
Monetaryreward
Sustainability risk management is governed by the Board of Directors and is reinforced through explicit performance targets.
Performance Incentive Plans are in place for relevant executives that are assessed against an appropriate balance of Group andbusiness segment measures and financial and non-financial measures. For some executives environmental and GHG performance ispart of the tailored business specific measures. KPI: Fuel efficiency target, GHG performance, Energy performance targets, financial &non-financial measures
Allemployees
Monetaryreward
To encourage employee engagement in environmental sustainability, a number of employee reward and recognition schemes are inplace. The annual Environmental Excel Award program provides recognition and financial incentives for environmental improvement
initiatives. In FY2011, Qantas in conjunction with the Great Barrier Reef Foundation also rewarded selected employees who deliveredenvironmental improvements with a visit to the Great Barrier Reef to research the tangible impacts of climate change. Theseemployees have become internal 'Ambassadors' on the issue. KPI: Projects that have raised awareness and demonstrated ameasurable benefit in improving the environmental performance of Qantas (reduction in emissions, waste, resource consumption,noise, air quality, soil or water.
Further Information
Page: 2. Strategy
2.1
Please select the option that best describes your risk management procedures with regard to climate change risks and opportunities
Integrated into multi-disciplinary company wide risk management processes
2.1a
Please provide further details (see guidance)
i. Scope of risk management process

All risks related to climate change are considered as part of the Group’s enterprise risk management framework, Risks and actions to manage these risks areidentified by all of the Group’s business units as well as the corporate Group Environment department. Any material risks that emerge as part of this process are
integrated into the Group’s risk register. The focus of our climate change risk management is on, but not limited to:
1) Environmental impacts- fuel use- energy use- waste to landfill2) Regulatory risks
- carbon price- emissions reporting legislation- fuel/energy taxes and regulations3) Physical risks- induced changes in natural resources- tropical cyclones and floods
- changes in weather patterns4) Reputational and consumer behaviour related risksii. Assessment of risks and opportunities at a company levelThe assessment of risks and opportunities at a Group level is subject to systematic assessment and reviewed by the Group Environment Department in conjunction
with the Internal Audit and Risk department to ensure the controls in place are appropriate to minimise financial, operational and reputation exposure to the Group. This process is guided primarily by:1) The Qantas Enterprise Risk Management (ERM) FrameworkAll risks, including climate change risks, are identified through the Qantas ERM framework. This process is governed by the Board. Under this framework, climate
change forms one of the long-term material risk categories for the Group. 2) The Qantas Risk Management PolicyThe Qantas Group Risk Management Policy sets out the requirements and responsibilities for risk management across the Qantas Group. The policy is reviewed and
updated on an annual basis or as required.iii. Assessment of risks and opportunities at an asset levelRisks and opportunities relating to climate change are formally identified and reviewed by individual business units at an asset level as well as by Group Environmentand Resilience which has Group-wide oversight. Each business unit as part of the Group’s environmental management system maintains an environmental aspectsand impacts register detailing the risks of operation as well as the management of any impacts. Risk ratings are escalated to the Group Risk Register using theQantas Group Risk Assessment Guide. Formalised reviews of the aspects register and management plans are regularly conducted.
iv. Frequency of monitoring In partnership with Internal Audit and Risk, Group Environment monitors climate change risks and opportunities on a monthly basis. The Group Risk Report is
reviewed twice a year and the risk management framework quarterly by the Board’s Audit Committee. On an annual basis, the Qantas Board and Audit Committee
reviews sustainability (including climate change) progress as part of approving the Qantas Annual Report and Sustainability Reports. v. Criteria for materiality All risks are managed through the Qantas Group Risk Assessment Guide (QRAG). Risks are categorised as very low to catastrophic. A likelihood and consequencematrix is used to determine these risk categories. Identified risks are placed on a Qantas Group Risk Register. High and extreme risks are reported to Executive
Management monthly and to the Board of Directors quarterly.The Risk Assessment Guide is designed to:- provide guidance on applying the Qantas Group Risk Management Policy; and- assist areas to comply with the requirements of the “Risk assessment and mitigation” element contained within the Group management system.The financial consequence rating provides guidance on material impacts to the Group's operations. Existing management controls are focussed on minimising
financial risk whilst providing opportunities to improve overall competitiveness.vi Communication of results

The Group governance structure facilitates the monitoring, oversight and escalation of risks to Executive Management and the Board. Business units actively
communicate material business risks in accordance with the governance structure. All material risks are reported to the Board quarterly.
2.2Is climate change integrated into your business strategy?
Yes
2.2aPlease describe the process and outcomes (see guidance)
i. Process by which the strategy is influenced by climate change The Qantas Group is committed to reducing its emissions. The Qantas Group’s Environment strategy outlines the goal of being recognised as a leading airline groupcommitted to environmental sustainability. Measures to mitigate climate change are a core focus of the Group's strategy. The Group Environment Strategy is developed through input from business units across the Group with cooperation from the Group Environment Department.Initiatives are designed to capitalise on the potential opportunities as well as effectively managing any risks. All of the strategic initiatives are evaluated against externaldrivers including impending carbon pricing, the rising price of fuel, and the sustainability of the current business model. The comprehensive strategy is designed toposition the Group as a leading airline in environment, customer, financial and climate change management. ii. Climate change aspects that have influenced the strategy
The Group’s comprehensive strategy recognises that the business is global in nature and articulates key strategic levers that underpin our environmentalperformance and commitment to reducing our carbon footprint, including both external climate change-related aspects as well as internal drivers.External drivers include the rapidly changing regulatory landscape around carbon management, including emissions trading schemes being developed andintroduced in Australia, the EU and New Zealand, the need to manage the growing footprint of aviation emissions as well as changing expectations of customer,investors and other stakeholders. The strategy outlines 4 key focus areas: 1) Continuous improvement in environmental operational efficiency, 2) early adoption and persistence in innovative fuel andcarbon management, 3) embedding environmental values to increase marketability and strengthen belief in the brand, and 4) influencing global regulators to achievesustainable lowest cost carbon compliance.iii. Short term strategy changes (1-8 years)The Group has set a fuel efficiency target and is on track to achieve an average fuel efficiency improvement of 1.5% per annum to 2020 which is aligned with the goal
set by International Air Transport Association (IATA) for the industry. This approach also achieves performance benchmarks that improve the overall profitability of thebusiness. This enables a lower cost of compliance under the EU, AUS and NZ carbon pricing schemes, as well as meeting customer expectations of performanceand responsibility. The Group’s strategy also outlines the Group’s approach to engaging in carbon pricing mechanism developments at both a local and global levelover the next 3 years. The short term strategy also directs activities over the next 1-3 years focused on lowering operational costs while improving environmentalperformance.iv. Long term strategy changes (5-40 years)As a member of IATA, the Qantas Group has endorsed the IATA's stated vision to achieve carbon neutral growth from 2020 and to reduce emissions by 50 per cent by2050. A component of this strategy is the development of Sustainable Alternative Fuels, however to achieve genuine sustainability it is essential that such fuels deliverboth cost and environmental benefits. v. Strategic advantage The Qantas Group is one of the largest fuel users in Australia, consuming 4.6 billion litres of jet kerosene in 2009/2010 (a cost of $3.3 billion). This scale provides
strategic advantages in influencing and developing alternative fuel value chains.The Group’s strategy is designed to enable the Group to achieve a competitive advantage in operational and compliance costs, especially by creating a point ofdifferentiation with customers and enabling the business to adapt to changing environmental and regulatory landscapes. -vi. Substantial business decisions Climate change has increasingly become a deciding factor in substantial business decisions as regulatory, physical and reputation aspects become more of a risk to

our business. Examples of substantial decisions include: - Investment decisions around carbon procurement to manage both customer voluntary and compliance requirements.- Fleet investment decisions to provide ongoing fuel efficiency improvements for the Group.- Resources dedicated to incentivising a Sustainable Aviation Fuels (SAF) industry that will provide a low carbon sustainable alternative to fossil fuels.- Emissions reductions targets to lower emissions by 50% by 2050- Public policy engagement such as participation in the Australian government’s Business Roundtable on Climate Change
2.3Do you engage with policy makers to encourage further action on mitigation and/or adaptation?
Yes
2.3aPlease explain (i) the engagement process and (ii) actions you are advocating
Engagement with policy makers is an important part of our business decision making process and is embedded in our strategy as one of our four key strategicoutcomes. i. Nature & method of engagement Engagement has included, but is not limited to participation in consultation programs, attendance at government facilitated workshops and direct engagement with
government agencies and policy makers both within Australia and internationally. ii. Topic of engagement Qantas is actively engaged with policy makers in many jurisdictions (including the European Union, Australia and New Zealand) on the issue of carbon pricing andcomplementary policies that will accelerate our transition to lower emissions. We will continue to press for harmonised schemes that create a level playing field for allparticipants. We are also in regular dialogue regarding the opportunities and barriers to introduce lower carbon technologies such as alternative fuels and effective and efficientuse of aircraft navigational equipment. We are also advocating for the continued improvement in the sustainability of the tourism industry.iii. Actions advocated Qantas supports carbon pricing policies that are cost effective, avoid competitive distortions and deliver tangible emission reductions.Qantas supports the Australian Government’s decision to introduce a carbon pricing framework from mid 2012. We believe this is important to provide certainty forAustralian businesses. However, we believe there is still more work to be done on the details of the scheme to make it environmentally and cost effective for Australian
industries including aviation. A global model for regulating aviation emissions, as advocated by the International Air Transport Association (IATA), would be the best possible approach. In theabsence of such a multilateral framework, we accept that individual governments will introduce their own policies.We have and will continue to advocate for the establishment of emission reduction technologies including the establishment of an Australian based low carbonaviation fuel industry and for greater use of the efficient aircraft navigational technology. Through engagement with government and tourism bodies we are incentivising the sustainable tourism practices to become mainstream activities in Australia.
Further Information
Page: 3. Targets and Initiatives
3.1

Did you have an emissions reduction target that was active (ongoing or reached completion) in the reporting year?
Intensity target
3.1bPlease provide details of your intensity target
ID Scope% of
emissionsin scope
% reductionfrom base
yearMetric
Base
year
Normalizedbase yearemissions
Target
yearComment
Scope 1 100% 16.5%
Other: metric tonnes per
Revenue TonneKilometer
2009 12027918 2020
Target is to improve fuel efficiency per
revenue tonnes kilometres by 16.5% by2020.
Scope 2 100% 10% Other: MWh 2009 224024 2020Target is to reduce electricityconsumption by 10% by 2020
Scope 3: Wastegenerated inoperations
100% 20% Other: tonnes 2009 28105 2020Target is to reduce waste to landfill 20%
by 2020.
3.1cPlease also indicate what change in absolute emissions this intensity target reflects
ID
Direction ofchange
anticipated inabsolute Scope1+2 emissions
at targetcompletion?
% changeanticipatedin absoluteScope 1+2emissions
Direction ofchange
anticipated inabsolute Scope3 emissions at
targetcompletion?
% changeanticipatedin absolute
Scope 3emissions
Comments
Decrease 0 Decrease 20
Whilst we are targeting an improvement in our fuel efficiency the change in absoluteemissions will also be impacted by: Growth of available seat kilometres, growth of demandfor air travel, extent of commercialisation of Sustainable Aviation Fuels, and GovernmentClimate Change Policy decisions. However our Scope 2 emissions (only) are expected toreduce by 10% at target completion, and our Scope 3 emissions under waste are expected toreduce by 20%.
3.1dPlease provide details on your progress against this target made in the reporting year
ID% complete
(time)% complete(emissions)
Comment
20 21Steady improvement from fuel optimization initiatives has driven Qantas Group's fuel efficiency performance towards the IATA-aligned 16.5% fuel efficiency improvement by 2020.

3.2Does the use of your goods and/or services directly enable GHG emissions to be avoided by a third party?
No
3.3Did you have emissions reduction initiatives that were active within the reporting year (this can include those in the planning and/or implementation phases)
Yes
3.3aPlease identify the total number of projects at each stage of development, and for those in the implementation stages, estimated CO2e savings
Stage of development Number of projects Total estimated annual CO2e savings (only for rows marked *)
Under investigation
To be implemented*
Implementation commenced* 9 326529.78
Implemented* 166 144877.20
Not to be implemented
3.3bFor those initiatives implemented in the reporting year, please provide details in the table below
Activitytype
Description of activity
EstimatedannualCO2e
savings
Annual
monetarysavings
(unitcurrency)
Investment
required(unit
currency)
Paybackperiod
Other
APU Reduction: Reduction in usage of Auxiliary Power Units (APUs) through aircraft connecting aircraftto Ground Power Units (GPUs) that use more efficient and less expensive alternative energy sources toaircraft fuel Other information: - Scope 1 initiative – Voluntary/mandatory: Voluntary – Developmentstage: In progress – Implemented Expected lifetime: On-going Monetary savings calculated usingaverage market fuel price ($AUD120/bbl)
7200 2300000 <1 year
Other
Aircraft Weight Reduction: Optimising food, drink & catering equipment; carrying lighter equipmentonboard; replacing freight containers with lightweight options & improving weight estimates. Otherinformation: - Scope 1 initiative - Voluntary/mandatory: Voluntary – Development stage: In progress –
Implemented Expected lifetime: On-going Monetary savings calculated using average market fuel price($AUD120/bbl)
11800 35000001-3years
Other
Flight Planning Optimisation: Improving flight planning accuracy to reduce inefficient flight paths,including system and technology optimisation, flight plan delivery and zero fuel weight optimisation, fuelcarriage optimisation. Other information: - Scope 1 initiative – 16200 4700000 120000 <1 year
Voluntary/mandatory: Voluntary – Development stage: In progress – Expected lifetime: On-going
Monetary savings calculated using average market fuel price ($AUD120/bbl)
Other
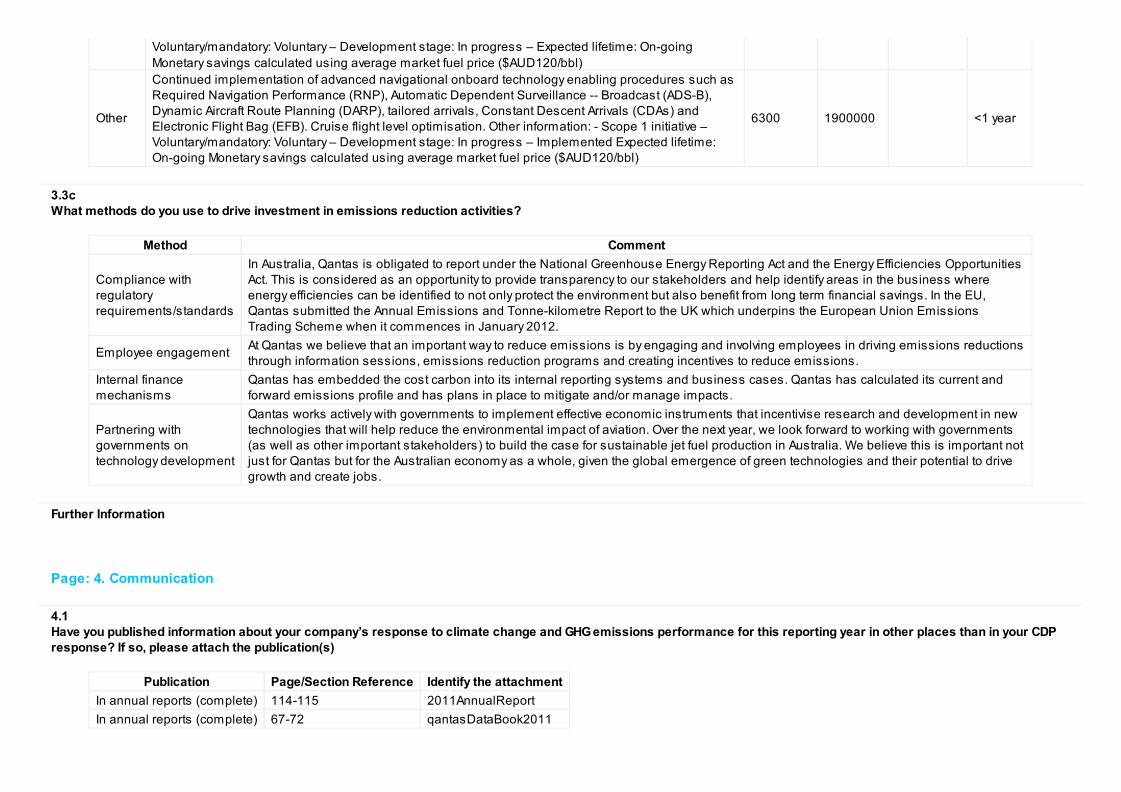
Continued implementation of advanced navigational onboard technology enabling procedures such asRequired Navigation Performance (RNP), Automatic Dependent Surveillance -- Broadcast (ADS-B),Dynamic Aircraft Route Planning (DARP), tailored arrivals, Constant Descent Arrivals (CDAs) andElectronic Flight Bag (EFB). Cruise flight level optimisation. Other information: - Scope 1 initiative –Voluntary/mandatory: Voluntary – Development stage: In progress – Implemented Expected lifetime:On-going Monetary savings calculated using average market fuel price ($AUD120/bbl)
6300 1900000 <1 year
3.3c
What methods do you use to drive investment in emissions reduction activities?
Method Comment
Compliance withregulatoryrequirements/standards
In Australia, Qantas is obligated to report under the National Greenhouse Energy Reporting Act and the Energy Efficiencies OpportunitiesAct. This is considered as an opportunity to provide transparency to our stakeholders and help identify areas in the business whereenergy efficiencies can be identified to not only protect the environment but also benefit from long term financial savings. In the EU,Qantas submitted the Annual Emissions and Tonne-kilometre Report to the UK which underpins the European Union EmissionsTrading Scheme when it commences in January 2012.
Employee engagementAt Qantas we believe that an important way to reduce emissions is by engaging and involving employees in driving emissions reductionsthrough information sessions, emissions reduction programs and creating incentives to reduce emissions.
Internal financemechanisms
Qantas has embedded the cost carbon into its internal reporting systems and business cases. Qantas has calculated its current andforward emissions profile and has plans in place to mitigate and/or manage impacts.
Partnering withgovernments ontechnology development
Qantas works actively with governments to implement effective economic instruments that incentivise research and development in newtechnologies that will help reduce the environmental impact of aviation. Over the next year, we look forward to working with governments(as well as other important stakeholders) to build the case for sustainable jet fuel production in Australia. We believe this is important notjust for Qantas but for the Australian economy as a whole, given the global emergence of green technologies and their potential to drivegrowth and create jobs.
Further Information
Page: 4. Communication
4.1Have you published information about your company’s response to climate change and GHG emissions performance for this reporting year in other places than in your CDPresponse? If so, please attach the publication(s)
Publication Page/Section Reference Identify the attachment
In annual reports (complete) 114-115 2011AnnualReport
In annual reports (complete) 67-72 qantasDataBook2011

Further Information
Attachments
https://www.cdproject.net/Sites/2012/41/15341/Investor%20CDP%202012/Shared%20Documents/Attachments/InvestorCDP2012/4.Communication/2011AnnualReport.pdfhttps://www.cdproject.net/Sites/2012/41/15341/Investor%20CDP%202012/Shared%20Documents/Attachments/InvestorCDP2012/4.Communication/qantasDataBook2011.pdf
Module: Risks and Opportunities [Investor]
Page: 2012-Investor-Risks&Opps-ClimateChangeRisks
5.1Have you identified any climate change risks (current or future) that have potential to generate a substantive change in your business operations, revenue or expenditure? Tickall that apply
Risks driven by changes in regulationRisks driven by changes in physical climate parametersRisks driven by changes in other climate-related developments
5.1aPlease describe your risks driven by changes in regulation
ID Risk driver DescriptionPotentialimpact
TimeframeDirect/Indirect
LikelihoodMagnitudeof impact
Cap andtradeschemes
Carbon price: By mid-2012, Qantas will be facing a carbon price in threejurisdictions: New Zealand, the European Union and Australia.
Reduceddemand forgoods/services
1-5 years DirectVeryunlikely
Low
Cap andtradeschemes
Carbon price: By mid-2012, Qantas will be facing a carbon price in threejurisdictions: New Zealand, the European Union and Australia.
Increasedoperationalcost
1-5 years DirectVirtuallycertain
Medium
Cap andtradeschemes
Carbon price: By mid-2012, Qantas will be facing a carbon price in threejurisdictions: New Zealand, the European Union and Australia.
Other:IncreasedOperationalComplexity
Current Direct Likely Low
Emissionreportingobligations
In Australia, Qantas is required to report under the annual NationalGreenhouse and Energy Report (NGER) and the Energy EfficienciesOpportunities which covers domestic emissions. In the EU, Qantassubmitted the Annual Emissions and Tonne-kilometre Report to the UKwhich will underpin the European Union Emissions Trading Scheme when itcommences in January 2012.
Increasedoperationalcost
Current DirectVirtuallycertain
Low

Fuel/energytaxes and
regulations
Environmental taxes: Requirements for Governments to recover revenue lostin the global financial crisis by applying punitive environmental taxes onairlines. Examples of this have been seen in the United Kingdom with the AirPassenger Duty and Germany with the “ecological” departure tax airlines.
Reduceddemand for
goods/services
Current DirectAbout aslikely as
not
Low
5.1bPlease describe (i) the potential financial implications of the risk before taking action; (ii) the methods you are using to manage this risk; and (iii) the costs associated withthese actions
i) The potential financial implications The introduction of a carbon pricing will have cost implications for the Group. The AustalianAustralian carbon pricieprice willresult in a $110m AUD liability for Group’s Australian domestic operations and $2.3m in Europe under the EU ETS. 1) Emissions trading schemes Regionalemissions trading schemes (ETS) directly impacting aviation have been enacted in New Zealand and the European Union.Under the EU trading schemes, all flights arriving or departing from EU member state aerodromes will be required to account for carbon emissions produced withineach flight sector (i.e. 1 sector = Singapore to London), from January 1, 2012 (irrespective of the nationality of the operator). This currently includes Qantas flights toand from London and Frankfurt.Any additional services to the EU introduced by either Qantas or Jetstar would also be included. Under the EU ETS, the aviation industry will be allocated up to 85%free allowances based on the annual emissions and revenue-ton kilometres reports submitted in 2010. The financial impact will be based on the Group's ability to'pass through' carbon costs and will be dependent upon market and competitive conditions.
The New Zealand ETS covers Qantas Group domestic operations, operated by Jetstar. The scheme outlines that large users of jet fuel (> ten million litres) can take onthe legal obligations themselves (by ‘opting-in’), or can adopt the ‘default’ position where the fuel supplier is responsible for reporting, procuring, surrendering andadministering permits on behalf of the ‘user’. The costs will be ‘passed-on’ to the airline under the ’default’ approach.The NZETS does not have a central government auction and participants managing ‘point-of-obligation’ (i.e. fuel suppliers) will need to source permits directly fromNew Zealand industry participants or international credits from the open market (Kyoto credits such as Certified Emission Reduction (CER’s) for example).2) Carbon Tax –In Australia, a carbon pricing scheme will apply to the Group’s domestic operations from July 2012. The first 3 years of the scheme has a fixed price of carbon of $23 atonne (rising with inflation).
All of these schemes (trading schemes or taxes) will introduce significant compliance costs and in some regions, will introduce competitive distortions betweenairlines and transport modes. More prescriptive and often duplicated emissions reporting obligations in Europe and Australia (National Greenhouse Energy Reporting System (NGERS) and EnergyEfficiency Opportunities (EEO) are examples of the increasingly complex compliance landscape. Many reporting requirements do not take the unique attributes ofaviation into consideration, therefore adding increasing administrative burden.Aviation is also exposed to the application of punitive government revenue raising under the guise of environmental taxes or to fund developing nation projects forexample the UK Government’s Aviation Passenger Duty (APD) and ‘adaptation levies’. ADP will roughly cost between 75-85 pounds sterling for economy passengersand 150-170 pounds sterling for premium passengers.
ii) Methods used to manage the risksSystems and ProcessesThe Qantas Group established a Group-wide ‘Carbon Readiness Taskforce’ in 2007. The carbon readiness program was designed to provide a consistent Group-wide response providing effective carbon price risk management. Carbon and associated regulatory, accounting and systems requirements were subsequentlyintegrated and embedded into the Group’s operations where applicable. Qantas has a comprehensive climate change strategy that has been developed to reduce the Group’s emissions and subsequent carbon liabilities. Fleet Renewal,Fuel Optimisation and Sustainable Aviation biofuels are key elements of the strategy. Qantas has an active fuel conservation program that has saved over one million tonnes of carbon emissions. We are renewing our fleet with technologically advancedfuel-efficient aircraft such as the Airbus A380, Boeing 737-800 and Boeing 787. We have flown commercial flights powered by sustainable biofuel to raise awareness
of the need for a viable sustainable fuels industry as well as partnering with government and refiners on an Australian Sustainable Aviation Fuel supply feasibility

of the need for a viable sustainable fuels industry as well as partnering with government and refiners on an Australian Sustainable Aviation Fuel supply feasibilitystudy.
Qantas actively engages with policy makers in order to contribute and be part of discussions around the future of carbon pricing, policy and technology to help mitigatethe effects of climate change.
In the context of the significant challenges facing the global aviation industry Qantas will be unable to absorb the additional costs of carbon pricing. We have alreadyannounced that we will directly pass this cost through to our customers.
iii) The costs involved with these actions:
Cost pass-through : Given the significant challenges facing the global aviation industry Qantas is passing through the cost of compliance with carbon schemes to thecustomer, with additional surcharges from $1.80 to $6.90 based on sector length being applied to tickets purchased.
Compliance: Compliance with the various policy decisions adds an increased administrative burden on the company. However, no additional resources have beenrequired to manage of cost pass-through or compliance with these schemes, as the processes have been converted to business as usual activities and embeddedwithin the organisation. Fleet Renewal: The most significant cost the Group has is the US$23 billion investment in highly fuel-efficient next-generation aircraft, such as Airbus A380 and Boeing787.
5.1cPlease describe your risks that are driven by change in physical climate parameters
ID Risk driver DescriptionPotentialimpact
TimeframeDirect/Indirect
LikelihoodMagnitudeof impact
Induced changesin naturalresources
Australia’s natural assets such as the Great Barrier Reef are potentiallyat risk due to the implications of changing climatic conditions. Theseassets are fundamental to Australia’s appeal as a tourist destination.
Reduceddemand forgoods/services
1-5 years Direct Unlikely Low
Change inprecipitationextremes anddroughts
The floods in Queensland caused severe disruption to services in2011.
Inability to dobusiness
Current Direct Likely Medium
Tropical cyclones(hurricanes andtyphoons)
Cyclonic activity continued to disrupt operations in 2011.Inability to dobusiness
Current Direct Likely Medium
Other physicalclimate drivers
Changes in weather patterns such as jet stream activity and prevailingwind patterns impact aircraft performance and route planning.
Increasedoperationalcost
1-5 years Direct Likely Low
5.1dPlease describe (i) the potential financial implications of the risk before taking action; (ii) the methods you are using to manage this risk; and (iii) the costs associated withthese actions
i. Potential financial implicationsImpact on Australia’s natural assets: The deterioration of Australia's tourism as a result of induced changes in natural resources may impact the Group's commercialsuccess as well as the broader tourism industry. In 2010, the Qantas Group carried 1.8 million inbound visitors to Australian and the national export revenuegenerated by Qantas inbound tourism is approximated at AUD $5.8 billion. Any decrease in the appeal of Australia as a tourist destination could impact this number oftourists travelling to Australia and therefore Qantas Group passengers.
Inability to do business due to Extreme weather events: Extreme weather events such as tropical cyclones and floods cause severe disruptions to Qantas’ businessand resulted in serious financial implications for the business. Qantas estimated that the impact of the Queensland floods amounted to $55 million. Weatherchanges: Changes in weather patterns such as temperature, wind speed, direction and humidity are all determinants of aircraft performance. Changes in theseconditions can impact the efficiency of aircraft on particular flight paths requiring changes in flight planning, including increased fuel burn. On particular routes where
the range of the aircraft operating is impacted, the ability to carry full loads of passengers or freight may be adversely reduced.The implications of weather related disruptions can include the following financial impacts:- loss of revenue,- additional crewing costs,- additional fuel costs- displaced passengers and associated costs- resultant cancelled services- reduced aircraft utilisation and
- aircraft damageii. Methods used to manage risksWhile the Group has no direct control over the physical risks associated with climate change, it focuses on monitoring these risks, diversifying its operations, building
capability in forecasting and managing disruptions, enhancing its crisis response capabilities, contributing to the protection of Australia’s natural assets and
internationally promoting Australia as a tourist destination.Impact on Australia’s natural assets: The Group contributes to efforts to mitigate the impact of climate change through a broad-based fuel and environmentalimprovement program. As previously stated the group has dedicated Environment and Fuel Optimisation teams driving an environment improvement program aimed
at reducing the Group's impact on the environment.Through the Qantas Foundation the Group invests in projects and organisations that help contribute to improved land management and the protection of Australianlocations from the impact of climate change. The Group has also partnered with Tourism Australia to continue to effectively market Australia as an attractive touristdestination. The partnership covers activity over three years including international cooperative marketing campaigns, major trade events, business events and public
relations activities across Europe, Asia, US and New Zealand.The Group has also established the annual Qantas Award for Excellence in Sustainable Tourism in 2010, and continued to do so in 2011. The award is a demonstration of our commitment to sustainable growth and support of tourism businesses that protect, enhance and promote our distinctive
destinations and environment.The annual 'Qantas Award for Excellence in Sustainable Tourism' is designed to:- Recognise and reward tourism businesses that implement the principles of sustainable tourism; those who set out to minimise their impact on the local
environment, conserve natural resources, respect local culture and benefit local communities.- Inspire other tourism businesses to adopt new sustainable ways of doing business.- Acknowledge tourism businesses that provide a unique travel experience and inspire visitors to promote Australia as one of world's leading sustainable tourism
destinations.In 2011, the winner of the Sustainable Tourism award was Lane Cove River national park, which received a prize of $25,000 designed to be invested in a projectaligned with the philosophy of the award, as well as coverage in all Qantas’ extensive communication channels. Prizes were also given out to winners in each state of
$2,000.Inability to do business due to Extreme weather events and Weather changes: The Group has invested in additional capability and information to ensure minimum impacts to the Group’s operations resulting from natural events such as tropical
cyclones, tsunamis and volcanic eruptions.The following are examples of the actions taken to manage these risks:• Development and ongoing review of the Group’s Fuel Policy, designed to enable safe and efficient operations. The policy states requirements dependent on the
probability of weather related events.• In-house meteorological capability. Through Qantas Meteorological (QMET), skilled analysis of weather related information is linked to the Group’s policies and
procedures• Development of probability based risk assessments to assist in route and contingency planning based on the difference between forecast, expected and unforeseen

events.• Forecast and real time flight planning functionality to optimise use of wind conditions that optimises the use of User Preferred routes.• Participation in the development of new standards to manage issues such as volcanic eruptions. The Group’s participation in developing these standards assists in
safely minimising the disruption to the Group’s operations.• Exploring options for partnerships with the Cooperative Research centre to further enhance predictive forecasting.• Ongoing research and development with Australian Climate and Weather Centre for Research (CAWR).iii. Associated costs of actionsImpact on Australia’s natural assets:Qantas has donated AUD$2 million dollars to the Qantas Foundation Environmental Sustainable Fund to support environmental conservation programs with a focus
on protecting Australia’s natural assets. The three year partnership with Tourism Australia is worth AUD$44 million. Qantas has invested over $1m in the Sustainable Tourism program since it commenced. The Qantas Award for Excellence in Sustainable Tourism provides each
State based winner a prize of $2,000. The national winner of the award then receives a major prize of $25,000. In addition, the national winner will receive coverage through Qantas' extensive communication channels, including 'Qantas - The Australian Way' inflight magazine
and other inflight entertainment channels. This will provide significant exposure for these businesses to thousands of national and international consumers.
5.1ePlease describe your risks that are driven by changes in other climate-related developments
ID Risk driver DescriptionPotentialimpact
TimeframeDirect/Indirect
LikelihoodMagnitudeof impact
ReputationAviation is currently a carbon intensive industry. A perceived lack of action bythe Qantas Group or industry in general could result in brand damage.
Reduceddemand forgoods/services
Unknown DirectVeryunlikely
Low
Changingconsumerbehaviour
There is a potential risk that customer may demand products that reducetheir carbon footprint. Technology such as video conferencing may providealternatives for face- to-face meetings therefore reducing demand for airtravel.
Reduceddemand forgoods/services
Unknown DirectVeryunlikely
Low
5.1fPlease describe (i) the potential financial implications of the risk before taking action; (ii) the methods you are using to manage this risk; (iii) the costs associated with theseactions
i. Potential financial implications In some parts of the world aviation has been identified as an industry with a growing emissions footprint. Negative perception about the industry may lead to increased
calls for financial penalties, operating restrictions and brand damage to airlines. Any perceived inaction by airlines may lead to further negative assessment by customers, which may iimpact market share and revenue.
ii. Methods used to manage this riskQantas has a comprehensive climate change strategy in place and has been committed to transparent reporting since 2007. Qantas has identified a need to ensurethat it continues to improve communications with stakeholders to ensure that its efforts are well understood. The Group‘s communication objective is to ensure theperception of its operations are reflective of its environmental commitment and activity. The use of company websites, publications, executive presentations and mediareleases are used for this purpose. Regular customer feedback is requested through direct surveys and websites for regular monitoring of communication effectiveness and to understand customer

perception of performance. Commercially, there is a growing trend for many corporate and government customers to request that their major suppliers demonstratesustainability performance as part of commercial negotiations. In response to these changed expectations, the Group made a commitment to transparent reporting ofsustainability performance. This includes dedicated information in the Annual and Sustainability reports as well as the leading sustainability indexes, FTSE4Good andDow Jones Sustainability Index (DJSI) as well as the global Carbon Disclosure Project. The Group’s commitment to transparency also enables it to obtain external recognition/feedback on the environmental and climate change strategies. The Groupregularly engages with NGO’s and community groups to openly discuss environmental issues. Complementing the extensive activity to reduce the Group’s environmental footprint, in 2007 the Qantas Group airlines launched the “Fly Carbon Neutral” program. Theprogram provides customers the opportunity to offset their share of flight emissions through Australian Government accredited programs. This program is madeavailable to customers booking their flights through qantas.com and jetstar.com.The Group also offsets its employees travel for business purpose and emissions from ground vehicle use. In addition to this online program, tailored carbonemission reporting was developed for Qantas Corporate Customers. Reports are available for Corporate Customers outlining the emissions attributable to theircompany’s business travel. The option of offsetting these emissions is also available through this program. iii. Costs associated with these actions The above-mentioned reporting and communication commitments have been embedded within the Group’s existing processes resulting in no additional expense.The cost of the Group’s commitment to offset the emissions from employee business travel and ground transport emissions was approximately $550,000 for the
reporting year.
Further Information
Page: 2012-Investor-Risks&Opps-ClimateChangeOpp
6.1Have you identified any climate change opportunities (current or future) that have the potential to generate a substantive change in your business operations, revenue orexpenditure? Tick all that apply
Opportunities driven by changes in regulationOpportunities driven by changes in other climate-related developments
6.1aPlease describe your opportunities that are driven by changes in regulation
IDOpportunity
driverDescription Potential impact Timeframe Direct/Indirect Likelihood
Magnitudeof impact
Cap andtradeschemes
Zero rating of biofuels: Current guidance provided within Emissiontrading schemes in Australia and the European Union indicate thatthe use of biofuel will not incur carbon costs.
Reducedoperational costs
6-10 years DirectVirtuallycertain
Low-medium
Otherregulatorydrivers
Improvement in energy efficiency: Focus on reporting anddisclosing environmental performance may result in furtherimprovements in environmental performance.
Reducedoperational costs
1-5 years DirectVirtuallycertain
Low
Other
regulatory
drivers
The design of effective carbon regulatory frameworks will avoid
creating competitive distortions and provide incentives for
organisations to invest in research and development.
Other: Avoids
creating Very
unlikely

drivers organisations to invest in research and development. competitive
distortions
1-5 years Direct unlikely Low
6.1bPlease describe (i) the potential financial implications of the opportunity; (ii) the methods you are using to manage this opportunity; (iii) the costs associated with these actions
i. Potential financial implicationsThe changing regulatory environment has the potential to positively impact the Group’s carbon efficiency and therefore its overall environmental footprint. Regulatoryopportunities have the potential to reduce operating costs or avoid additional costs on the Qantas Group.Zero rating of biofuels:Qantas has a comprehensive climate change strategy which includes working to accelerate the commercialisation of Sustainable Aviation Fuels (SAFs) that have thepotential to mitigate much of the incremental carbon costs. This is on the basis that ‘biofuels’ have no (or minimal) carbon charge under proposed regulations, ie. theyare ‘zero-rated’. Sustainable aviation fuel may reduce operating costs through reducing carbon costs and providing competition in the fuel market potentially leading tolower costs. Any use of a sustainable biofuel in the Group’s Australian domestic or European operations would directly reduce the respective $110m and $2.3mliabilities.As an Australian airline group the opportunities to focus on SAF production is within Australia. Australia has the unique characteristics of abundant land, access toAsia, geopolitical stability, favourable weather conditions and existing distribution infrastructure that make developing and producing biofuel sourced sustainable fuelpossible. According to the CSIRO Sustainable Aviation Fuel Roadmap (May 2011), if the aviation sector in Australia and New Zealand can achieve a 5 per cent centbio-derived jet fuel share in their fuel use by 2020, expanding that amount to 40 per cent of their total fuel use by 2050, the development will enable: - The stabilisation of aviation industry emissions from 2020 and assists in reducing emissions from 2030;- Savings of over $2 billion per annum on jet fuel imports and achieve a 17 per cent reduction in aviation GHG emissions per annum relative to an all petroleum-basedjet fuel future;- The creation of potentially 12,000 new jobs by 2030; and- The continued growth and ongoing contribution to the economy of the $39 billion Australasian tourism industry.
Improvement in energy efficiency:Governments will need to adopt more effective economic instruments that provide incentives to finance research and development in new technology and efficientlydesigned global climate policies that do not create competitive distortions.Each of these areas has the potential to significantly improve fuel efficiency and reduce emissions intensity - improving environmental performance and profitability.The design of effective carbon regulatory frameworks:Opportunities from participating in the design of legislative/economic instruments that do not create competitive distortions are particularly important for Australianbased carriers due to the ultra-long haul sectors required to reach major destinations.With a focus on carbon pricing there may be an increasing focus on reducing energy costs and promoting innovation. Early action on any energy related activity mayavoid the impact of future increasing costs for resources such as fuel and energy.ii. Methods used to manage opportunitiesZero rating of biofuels:Qantas is committed to taking a leading role in the development of sustainable alternatives to traditional fossil fuels in our region.Cleaner jet fuels promise to significantly reduce the environmental impact of aviation. To be acceptable for use, these new fuels must meet aviation's stringent safety,performance and sustainability standards. Significant progress has been made in the past three years in addressing the technical challenges of developing fuelsusing bio-derived sources such as oil from trees, algae and plants.Importantly, these fuels must also be a direct ‘drop-in’ substitute for traditional jet fuels (Jet A-1) to avoid having to redesign engines, airframes or fuel deliverysystems. The Group has been involved in a number of activities designed to accelerate the commercialisation of sustainable aviation fuel in Australia:• Qantas joined the Sustainable Aviation Fuel Users Group (SAFUG), a global group of leading airlines and aviation companies working together with scientificagencies and leading environmental non-government organisations (NGOs) to develop cleaner jet fuels.

• Qantas launched a world-first 'Roadmap' study in conjunction ASAFUG and the CSIRO, Australia’s peak science agency. The Roadmap is addressing barriers to acommercial and scalable sustainable aviation fuels industry bringing together a diverse group including aviation, scientific, traditional fuel supply, government and
community stakeholders with different expertise and perspectives.• The Qantas Group conducted Australia’s first commercial biofuel flights using a Qantas A330 and Jetstar A320.
At the same time as the first commercial biofuel flights the Group announced the commencement of a first-of-its-kind study in the feasibility of an Australian AviationBiofuel Industry. The $500,000 study, co-contributed by Qantas, the Australian Government and Shell will investigate viable feedstock options as well as the refining
and distribution options.The design of effective carbon regulatory frameworks:Qantas is taking an active role domestically and internationally in pressing for climate change regulations that are harmonised and do not introduce competitive
distortion. This work is undertaken through participation in available consultation forums and sessions. Improvement in energy efficiency:To further drive emission reduction activities within the Qantas Group we are capitalising on environmental reporting obligations the following activities have been
established:- Fuel and environmental working groups dedicated to identify and implement emission reduction activities,- Training programs to promote energy efficiency for employees enabled through government funding for employee education.- Employee reward and recognition programs to provide incentives for measureable improvements around fuel, energy, water and waste reduction and- Expanded monitoring of fuel and energy related costs throughout the business.iii. Costs associated with these actionsTo date the majority of costs involved in these activities has been related to manpower resources required to participate in industry working groups and development
of feasibility studies.Zero rating of biofuels:Support from Qantas, Shell and a $500,000 grant from the Austalian Governments Emerging Renewable Program will be used to complete a study into the long-term
viability of biofuel feedstock and the production of low carbon alternative aviation fuels in Australia.
6.1ePlease describe the opportunities that are driven by changes in other climate-related developments
ID Opportunity driver Description Potential impact Timeframe Direct/ Indirect Likelihood Magnitude of impact
Other drivers Improvement in Air Traffic Management Reduced capital costs 1-5 years Direct Likely Low-medium
6.1fPlease describe (i) the potential financial implications of the opportunity; (ii) the methods you are using to manage this opportunity; (iii) the costs associated with these actions
i. Potential financial implications Improvements in Air Traffic efficiency could provide the following benefits:- Improvement in fuel efficiency through optimised aircraft performance and reduced flying distances- Schedule integrity. Reduction in delays and aircraft holding enables better on-time performance and reduction in flow-on impacts.- System capacity improvement and- Reduction in noise for airport communities Improvements in these areas may reduce costs for the organisation and improve customer satisfaction. It is estimated by IATA that improvements in Air Traffic Management could improve fuel efficiency by greater than 10%. With a fuel as one of the largest line item costs for the Qantas Group any improvement in efficiency will have direct financial benefits. ii. Methods used to manage opportunity

The Qantas Group’s actions to maximise this opportunity are focused on investment and deployment of leading edge technology, actively driving industry forums forimproved air traffic management and engaging with government to influence and incentivise take-up of these technologies.Operational measures continue to be implemented and today are reliant on Air Service Navigation Providers (e.g. Airservices Australia (AsA), Federal Aviation
Administration (FAA)). General airspace efficiency and more favourable airport infrastructure and capability are also high on the Group’s agenda.The Group’s investment in aircraft technology allows the deployment of new navigation techniques and procedures. These initiatives have the potential to deliver largefinancial and environmental benefits. Performance Based Navigation (PBN) and new techniques such as Required Navigation Performance (RNP) improvepredictability and accuracy of aircraft flight paths. This investment in technology has been complemented by significant increase in training to capitalise on the aircraft's capability. Communities and their appointedrepresentative bodies are expecting greater involvement in the decision-making process regarding local airport and flight related issues and Qantas is an active
participant in community forums.Continued roll out of the RNP program across Australia is enabling more efficient, safer and noise sensitive flight paths to be flown and the Qantas Group is currently
the only airline group in Australia deploying this technology. In addition, continued procedural improvement associated with Free Flight (Improved flight planning) and Dynamic Airborne Route Planning (DARP) (a process thatenables flight plans to be recalculated whilst the aircraft is in-flight), continue to benefit the Groups fuel and environmental performance. Qantas also takes aleadership role at the Air Traffic Management Performance Group (ATMPG) with Government stakeholders to influence and prioritise airspace activities that deliver
benefit to industry including community relations aspects.iii. Costs associated with actions The costs associated with benefiting from the advancement in new technology aircraft is related to the Qantas Group US$23 billion (at list prices) investment in next-
generation aircraft, such as Airbus A380 and Boeing 787. Additional costs are also associated with:- crew training- procedure design for new procedures and retrofitting of aircraft and- with new technology navigation systems.
6.1hPlease explain why you do not consider your company to be exposed to opportunities driven by physical climate parameters that have the potential to generate a substantivechange in your business operations, revenue or expenditure
Potential physical changes resulting from climate change are unlikely to present any potential to generate substantive change for the Qantas Group.The Qantas Group’s primary business is the air transportation of passengers and freight. Any potential opportunities would need to provide advantages through theopening of new markets, increasing demand for air travel over other modes of transport or reducing costs of the business.The Qantas Group’s route network serves 173 destinations in 42 countries (including those covered by code share partners) in Australia, Asia and the Pacific, theAmericas, Europe and Africa. Changes in potential tourist destinations resulting from changing climate conditions may open up new routes. However these samechanges may also make existing tourist destinations less popular impacting existing route profitability.Other physical changes that may have positive impacts on the supply chain are unlikely to be relevant to kerosene fuel supply or aircraft manufacturing, the group’sbiggest procurement spend.Qantas constantly reviews the demand for services to existing and new destinations as part of its commercial planning. Any physical effects of climate change,impacting demand for air transportation will be identified as part of this process. Any opportunities driven by physical climate change parameters that have thepotential to develop new markets or customers will be investigated in due course.
Further Information
Module: GHG Emissions Accounting, Energy and Fuel Use, and Trading [Investor]
Page: 7. Emissions Methodology
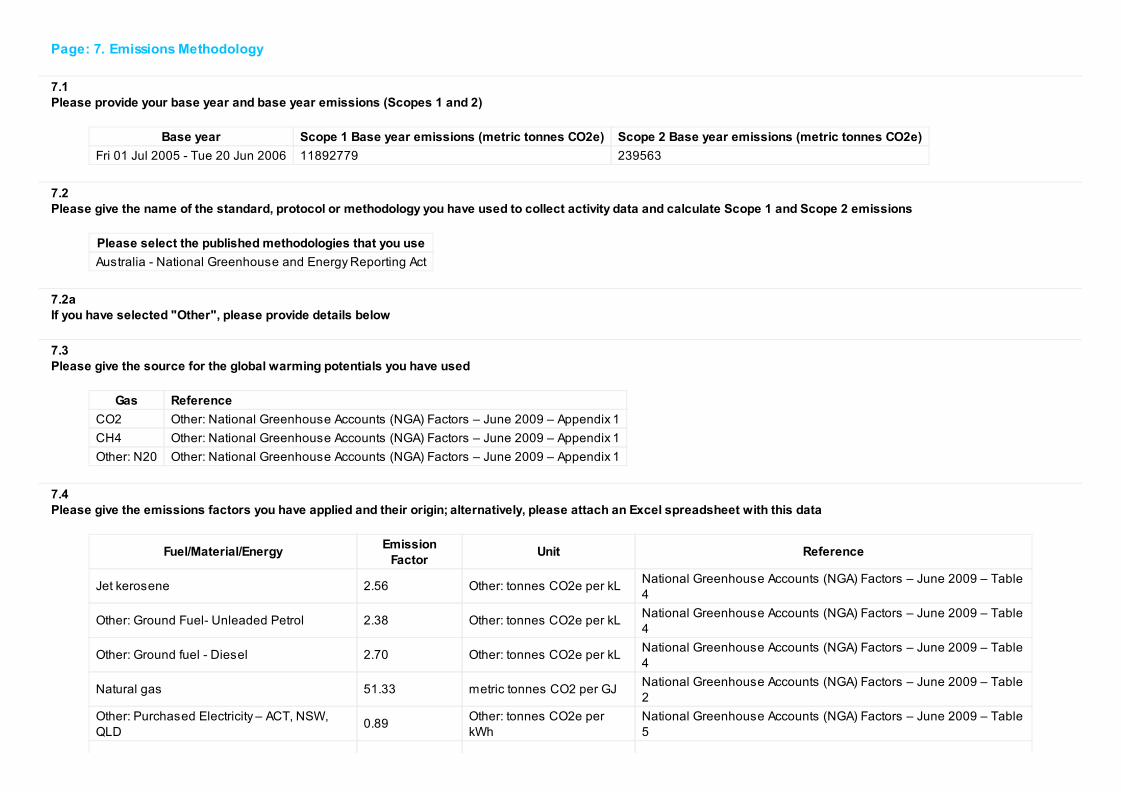
7.1Please provide your base year and base year emissions (Scopes 1 and 2)
Base year Scope 1 Base year emissions (metric tonnes CO2e) Scope 2 Base year emissions (metric tonnes CO2e)
Fri 01 Jul 2005 - Tue 20 Jun 2006 11892779 239563
7.2Please give the name of the standard, protocol or methodology you have used to collect activity data and calculate Scope 1 and Scope 2 emissions
Please select the published methodologies that you use
Australia - National Greenhouse and Energy Reporting Act
7.2aIf you have selected "Other", please provide details below
7.3Please give the source for the global warming potentials you have used
Gas Reference
CO2 Other: National Greenhouse Accounts (NGA) Factors – June 2009 – Appendix 1
CH4 Other: National Greenhouse Accounts (NGA) Factors – June 2009 – Appendix 1
Other: N20 Other: National Greenhouse Accounts (NGA) Factors – June 2009 – Appendix 1
7.4Please give the emissions factors you have applied and their origin; alternatively, please attach an Excel spreadsheet with this data
Fuel/Material/EnergyEmission
FactorUnit Reference
Jet kerosene 2.56 Other: tonnes CO2e per kLNational Greenhouse Accounts (NGA) Factors – June 2009 – Table4
Other: Ground Fuel- Unleaded Petrol 2.38 Other: tonnes CO2e per kLNational Greenhouse Accounts (NGA) Factors – June 2009 – Table4
Other: Ground fuel - Diesel 2.70 Other: tonnes CO2e per kLNational Greenhouse Accounts (NGA) Factors – June 2009 – Table4
Natural gas 51.33 metric tonnes CO2 per GJNational Greenhouse Accounts (NGA) Factors – June 2009 – Table2
Other: Purchased Electricity – ACT, NSW,QLD
0.89Other: tonnes CO2e perkWh
National Greenhouse Accounts (NGA) Factors – June 2009 – Table5
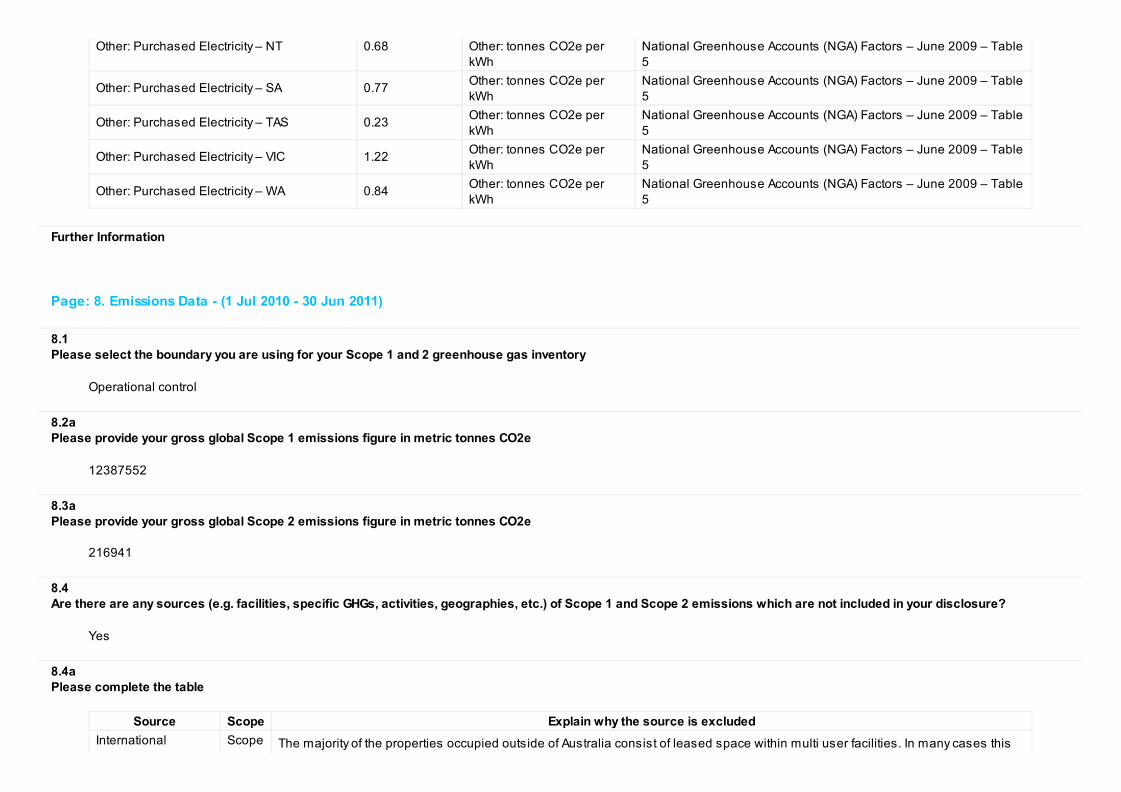
Other: Purchased Electricity – NT 0.68 Other: tonnes CO2e perkWh
National Greenhouse Accounts (NGA) Factors – June 2009 – Table5
Other: Purchased Electricity – SA 0.77Other: tonnes CO2e perkWh
National Greenhouse Accounts (NGA) Factors – June 2009 – Table5
Other: Purchased Electricity – TAS 0.23Other: tonnes CO2e perkWh
National Greenhouse Accounts (NGA) Factors – June 2009 – Table5
Other: Purchased Electricity – VIC 1.22Other: tonnes CO2e perkWh
National Greenhouse Accounts (NGA) Factors – June 2009 – Table5
Other: Purchased Electricity – WA 0.84Other: tonnes CO2e perkWh
National Greenhouse Accounts (NGA) Factors – June 2009 – Table5
Further Information
Page: 8. Emissions Data - (1 Jul 2010 - 30 Jun 2011)
8.1Please select the boundary you are using for your Scope 1 and 2 greenhouse gas inventory
Operational control
8.2aPlease provide your gross global Scope 1 emissions figure in metric tonnes CO2e
12387552
8.3aPlease provide your gross global Scope 2 emissions figure in metric tonnes CO2e
216941
8.4Are there are any sources (e.g. facilities, specific GHGs, activities, geographies, etc.) of Scope 1 and Scope 2 emissions which are not included in your disclosure?
Yes
8.4aPlease complete the table
Source Scope Explain why the source is excluded
International
Facilities - Facilities
Scope
2
The majority of the properties occupied outside of Australia consist of leased space within multi user facilities. In many cases this
area is shared with other organisations. Information regarding emissions from overseas facilities is considered non-material.
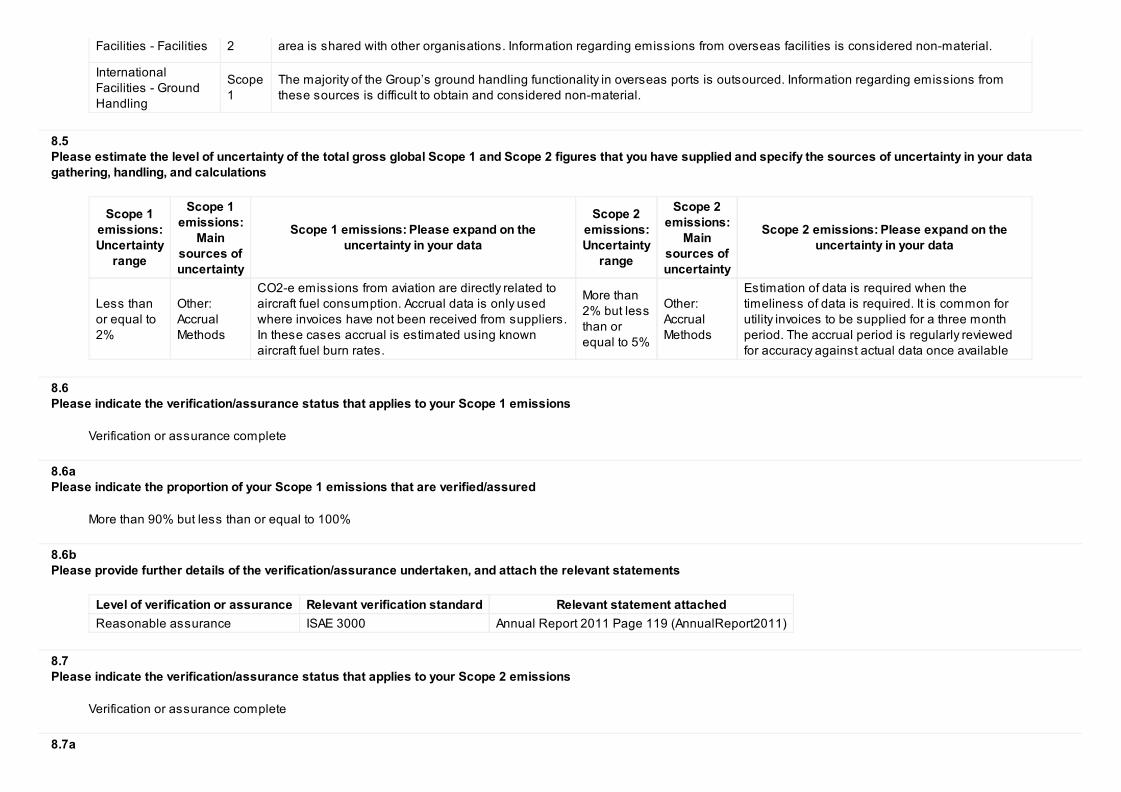
Facilities - Facilities 2 area is shared with other organisations. Information regarding emissions from overseas facilities is considered non-material.
InternationalFacilities - GroundHandling
Scope1
The majority of the Group’s ground handling functionality in overseas ports is outsourced. Information regarding emissions fromthese sources is difficult to obtain and considered non-material.
8.5Please estimate the level of uncertainty of the total gross global Scope 1 and Scope 2 figures that you have supplied and specify the sources of uncertainty in your datagathering, handling, and calculations
Scope 1emissions:Uncertainty
range
Scope 1emissions:
Main
sources ofuncertainty
Scope 1 emissions: Please expand on theuncertainty in your data
Scope 2emissions:Uncertainty
range
Scope 2emissions:
Main
sources ofuncertainty
Scope 2 emissions: Please expand on theuncertainty in your data
Less thanor equal to2%
Other:AccrualMethods
CO2-e emissions from aviation are directly related toaircraft fuel consumption. Accrual data is only usedwhere invoices have not been received from suppliers.In these cases accrual is estimated using knownaircraft fuel burn rates.
More than2% but lessthan orequal to 5%
Other:AccrualMethods
Estimation of data is required when thetimeliness of data is required. It is common forutility invoices to be supplied for a three monthperiod. The accrual period is regularly reviewedfor accuracy against actual data once available
8.6Please indicate the verification/assurance status that applies to your Scope 1 emissions
Verification or assurance complete
8.6aPlease indicate the proportion of your Scope 1 emissions that are verified/assured
More than 90% but less than or equal to 100%
8.6bPlease provide further details of the verification/assurance undertaken, and attach the relevant statements
Level of verification or assurance Relevant verification standard Relevant statement attached
Reasonable assurance ISAE 3000 Annual Report 2011 Page 119 (AnnualReport2011)
8.7Please indicate the verification/assurance status that applies to your Scope 2 emissions
Verification or assurance complete
8.7a

Please indicate the proportion of your Scope 2 emissions that are verified/assured
More than 90% but less than or equal to 100%
8.7bPlease provide further details of the verification/assurance undertaken, and attach the relevant statements
Level of verification or assurance Relevant verification standard Relevant statement attached
Limited assurance ISAE 3000 Annual Report Page 116 (AnnualReport2011)
8.8Are carbon dioxide emissions from the combustion of biologically sequestered carbon (i.e. carbon dioxide emissions from burning biomass/biofuels) relevant to yourcompany?
No
Further Information
Attachments
https://www.cdproject.net/Sites/2012/41/15341/Investor%20CDP%202012/Shared%20Documents/Attachments/InvestorCDP2012/8.EmissionsData(1Jul2010-30Jun2011)/2011AnnualReport.pdf
Page: 9. Scope 1 Emissions Breakdown - (1 Jul 2010 - 30 Jun 2011)
9.1Do you have Scope 1 emissions sources in more than one country or region (if covered by emissions regulation at a regional level)?
Yes
9.1aPlease complete the table below
Country Scope 1 metric tonnes CO2e
Australia 4362807
Other: Outside Australia 8024745
9.2Please indicate which other Scope 1 emissions breakdowns you are able to provide (tick all that apply)

Further Information
Page: 10. Scope 2 Emissions Breakdown - (1 Jul 2010 - 30 Jun 2011)
10.1Do you have Scope 2 emissions sources in more than one country or region (if covered by emissions regulation at a regional level)?
Yes
10.1aPlease complete the table below
Country Scope 2 metric tonnes CO2e
Other: ACT 3048.29
Other: NSW 98846.61
Other: QLD 35733.28
Other: SA 2918.31
Other: TAS 330.36
Other: VIC 62580.20
Other: WA 11781.45
Other: NT 385.82
10.2Please indicate which other Scope 2 emissions breakdowns you are able to provide (tick all that apply)
Further Information
Page: 11. Emissions Scope 2 Contractual
11.1Do you consider that the grid average factors used to report Scope 2 emissions in Question 8.3 reflect the contractual arrangements you have with electricity suppliers?
Yes
11.2Has your organization retired any certificates, e.g. Renewable Energy Certificates, associated with zero or low carbon electricity within the reporting year or has this been done

on your behalf?
No
Further Information
Page: 12. Energy
12.1What percentage of your total operational spend in the reporting year was on energy?
More than 25% but less than or equal to 30%
12.2Please state how much fuel, electricity, heat, steam, and cooling in MWh your organization has consumed during the reporting year
Energy type MWh
Fuel 17259237.19
Electricity 225752.92
Heat 86007.08
Steam 0
Cooling 0
12.3Please complete the table by breaking down the total "Fuel" figure entered above by fuel type
Fuels MWh
Other: Ground Fuel 90647.18
Jet kerosene 17259237.19
Further Information
Page: 13. Emissions Performance
13.1How do your absolute emissions (Scope 1 and 2 combined) for the reporting year compare to the previous year?

Increased
13.1aPlease complete the table
ReasonEmissions value
(percentage)Direction of
changeComment
Changein output
4 Increase Available Seat Kilometres grew significantly in 2011 as Qantas Group's activities expanded.
0.25 IncreaseRevenue Seat Factor dropped slightly in 2011, reducing fuel efficiency, due to a competitive business environmentwith several natural and human interruptions to business activity.
13.2Please describe your gross combined Scope 1 and 2 emissions for the reporting year in metric tonnes CO2e per unit currency total revenue
Intensityfigure
Metric numeratorMetric
denominator% change from previous
yearDirection of change from previous
yearReason for Change
0.00116metric tonnesCO2e
unit total revenue 1.99 DecreaseLower year-on-year revenue forFY2011.
13.3Please describe your gross combined Scope 1 and 2 emissions for the reporting year in metric tonnes CO2e per full time equivalent (FTE) employee
Intensityfigure
Metricnumerator
Metricdenominator
% change fromprevious year
Direction of change fromprevious year
Reason for Change
381.94metrictonnesCO2e
FTEEmployee
4 IncreaseIncrease in Full Time Employees, in line with operational increasesthat drove absolute emissions.
13.4Please provide an additional intensity (normalized) metric that is appropriate to your business operations
Intensityfigure
Metricnumerator
Metricdenominator
% changefrom
previousyear
Direction ofchange fromprevious year
Reason for Change
0.0000937metrictonnesCO2e
Other:AvailableSeatKilometers
2.07 DecreaseQantas implemented and continued to implement a number of fuel saving initiativesthis year, leading to improved flying performance and lower C02/ASK emissions, inspite of strong ASK growth.
Further Information

Page: 14. Emissions Trading
14.1Do you participate in any emission trading schemes?
No, but we anticipate doing so in the next two years
14.1bWhat is your strategy for complying with the schemes in which you participate or anticipate participating?
Our strategy is based on continual improvement of the efficiency of the Group’s operations by improving fuel efficiency through fleet and operational optimization, aswell as integration of carbon compliance at the most relevant levels of the business to improve the speed and veracity of Qantas’ carbon compliance.
14.2Has your company originated any project-based carbon credits or purchased any within the reporting period?
Yes
14.2aPlease complete the following table
Credit originationor credit
purchase
Project typeProject
identification
Verified towhich
standard
Number of credits(metric tonnes of
CO2e)
Number of credits (metrictonnes CO2e): Risk adjusted
volume
Creditsretired
Purposee.g.
compliance
Credit Purchase Other: Energy Demand VCS122 VCS 10500 10500 YesVoluntaryOffsetting
Credit PurchaseOther: Energy industries(renewable/nonrenewablesources
VCS308 VCS 8439 8439 YesVoluntaryOffsetting
Credit Purchase
Other: Energy industries
(renewable/nonrenewablesources
VCS308 VCS 12507 12507 YesVoluntaryOffsetting
Credit Purchase Other: Energy Demand VCS122 VCS 15000 15000 YesVoluntaryOffsetting
Credit PurchaseOther: Energy industries(renewable/nonrenewablesources
VCS308 VCS 23579 23579 YesVoluntaryOffsetting
Credit Purchase
Other: Energy industries
(renewable/nonrenewablesources
VCS308 VCS 22129 22129 YesVoluntaryOffsetting

Credit Purchase Other: Energy Demand VCS122 VCS 3098 3098 Yes VoluntaryOffsetting
Credit Purchase Other: Energy Demand VCS122 VCS 476 476 YesVoluntaryOffsetting
Credit Purchase Other: Energy Demand VCS122 VCS 253 253 YesVoluntaryOffsetting
Credit Purchase Other: Energy Demand VCS122 VCS 3876 3876 YesVoluntaryOffsetting
Credit Purchase Other: Energy Demand VCS122 VCS 1895 1895 YesVoluntaryOffsetting
Other: Energy Demand VCS122 VCS 1000 1000 YesVoluntaryOffsetting
Credit PurchaseOther: Energy industries(renewable/nonrenewablesources
VCS308 VCS 42368 42368 YesVoluntaryOffsetting
Further Information
Page: 2012-Investor-Scope 3 Emissions
15.1Please provide data on sources of Scope 3 emissions that are relevant to your organization
Sources of Scope3 emissions
metrictonnesCO2e
MethodologyIf you cannot provide a figure foremissions, please describe them
Waste generatedin operations
30178.8Waste disposal figures are provided by the Group’s waste contractors. Emissionsfactors from the National Greenhouse Accounts (NGA).
15.2Please indicate the verification/assurance status that applies to your Scope 3 emissions
Verification or assurance complete
15.2aPlease indicate the proportion of your Scope 3 emissions that are verified/assured
More than 90% but less than or equal to 100%
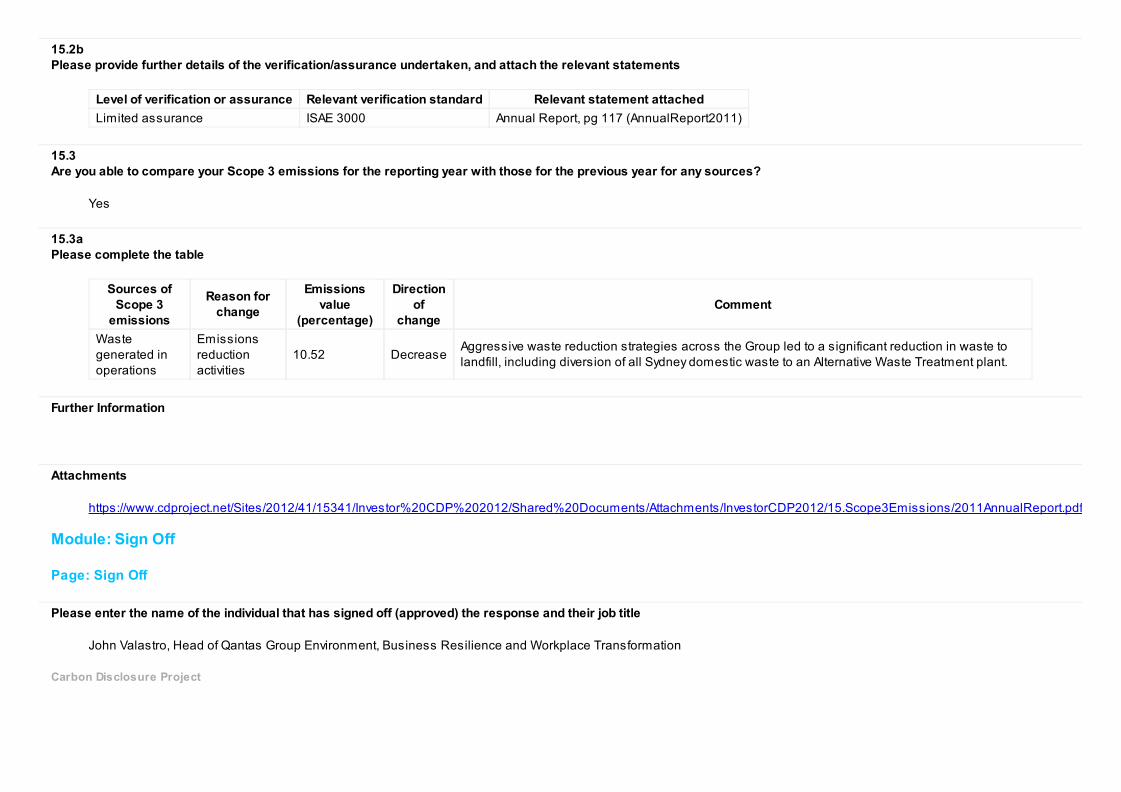
15.2b
Please provide further details of the verification/assurance undertaken, and attach the relevant statements
Level of verification or assurance Relevant verification standard Relevant statement attached
Limited assurance ISAE 3000 Annual Report, pg 117 (AnnualReport2011)
15.3Are you able to compare your Scope 3 emissions for the reporting year with those for the previous year for any sources?
Yes
15.3aPlease complete the table
Sources ofScope 3
emissions
Reason forchange
Emissionsvalue
(percentage)
Directionof
changeComment
Wastegenerated inoperations
Emissionsreductionactivities
10.52 DecreaseAggressive waste reduction strategies across the Group led to a significant reduction in waste tolandfill, including diversion of all Sydney domestic waste to an Alternative Waste Treatment plant.
Further Information
Attachments
https://www.cdproject.net/Sites/2012/41/15341/Investor%20CDP%202012/Shared%20Documents/Attachments/InvestorCDP2012/15.Scope3Emissions/2011AnnualReport.pdf
Module: Sign Off
Page: Sign Off
Please enter the name of the individual that has signed off (approved) the response and their job title
John Valastro, Head of Qantas Group Environment, Business Resilience and Workplace Transformation
Carbon Disclosure Project