carbon dioxide capture technology for the coal-powered ... · carbon dioxide capture technology for...
TRANSCRIPT

Carbon Dioxide Capture Technology for the Coal-Powered Electricity Industry:
A Systematic Prioritization of Research Needs
by
George Salem Esber III
Bachelor of Science, Chemical Engineering Ohio University, 2002
Submitted to the Engineering Systems Division
in Partial Fulfillment of the Requirements for the Degree of
Master of Science in Technology and Policy
at the
Massachusetts Institute of Technology
June 2006
©2006 Massachusetts Institute of Technology. All rights reserved.
Signature of Author…………………………………………………………………………………………….
Technology and Policy Program, Engineering Systems Division May 15, 2006
Certified by…………………………………………………………………………………………………….. Howard Herzog
Principal Research Engineer Laboratory for Energy and the Environment
Thesis Supervisor
Accepted by……………………………………………………………………………………………………. Dava J. Newman
Professor of Aeronautics and Astronautics and Engineering Systems Director, Technology and Policy Program

- 2 -

Carbon Dioxide Capture Technology for the Coal-Powered Electricity Industry: A Systematic Prioritization of Research Needs
by Salem Esber
Submitted to the Engineering Systems Division on May 15, 2006 in Partial Fulfillment of
the Requirements for the Degree of Master of Science in Technology and Policy
Abstract Coal is widely relied upon as a fuel for electric power generation, and pressure is increasing to limit emissions of the CO2 produced during its combustion because of concerns over climate change. In order to continue the use of coal without emitting CO2, low cost technologies must be developed for capturing CO2 from power plants. Current CO2 capture technology is expensive, both in terms of capital and operating cost, so research and development efforts will be heavily relied upon to improve the economic profile of the technologies. With scarce resources available for R&D, and a number or different technologies competing for these funds, efforts must be prudently prioritized in order for successful advancements to be realized. This thesis assesses the state-of-the-art CO2 capture technologies available today, as well as the leading technology options for improvement. It also examines types of R&D, government and industry roles in R&D efforts, and methods and tools for managing these efforts. From these analyses, qualitative conclusions about how to prioritize CO2 capture technology R&D efforts to ensure advancement are offered. There are three technological pathways for CO2 capture – post-combustion, oxy-fired, and pre-combustion capture - and several technology options for improvement in each pathway. There are currently no clear winners, and there is much uncertainty in which technologies have the most potential to reduce the cost of capture. Government and industry interests should both be involved in advancing R&D, but should play different roles depending on the type of research and the maturity of the technology. Portfolios of potential technologies in various stages of development should maintained by both government and industry researchers and developers, and they should use a variety of portfolio management tools to aid in decision-making. This approach will ensure that the best technologies are advanced and CO2 capture technologies will be capable of helping meet future challenges. Thesis Supervisor: Howard Herzog Title: Principle Research Engineer, Laboratory for Energy and the Environment
- 3 -

Table of Contents 1.0 Introduction.......................................................................................................- 10 -
1.1 Background & Motivation ............................................................................- 10 - 1.2 Thesis Objectives & Approach .....................................................................- 10 -
2.0 Post-Combustion Technology...........................................................................- 12 - 2.1 Overview.......................................................................................................- 12 -
2.1.1 Pulverized Coal Power Plant without CO2 Capture.............................- 12 - 2.1.2 Pulverized Coal Power Plant with CO2 Capture..................................- 15 -
2.2 Current Technology/State of the Art.............................................................- 18 - 2.2.1 Technology Overview............................................................................- 18 - 2.2.2 CO2 Capture Cost .................................................................................- 21 - 2.2.3 Plant Efficiency Losses .........................................................................- 22 - 2.2.4 Reliability and Operability Issues.........................................................- 23 -
2.3 Research Areas/Potential New Technologies ...............................................- 24 - 2.3.1 Advanced Solvents ................................................................................- 24 - 2.3.2 Process Integration ...............................................................................- 30 - 2.3.3 Cryogenic Processes .............................................................................- 31 - 2.3.4 Other Technologies ...............................................................................- 33 -
2.4 Chapter Conclusions .....................................................................................- 35 - 3.0 Oxy-fired Technology.......................................................................................- 37 -
3.1 Overview.......................................................................................................- 37 - 3.2 Current Technology/State of the Art.............................................................- 39 -
3.2.1 Technology Overview............................................................................- 39 - 3.2.2 CO2 Capture Cost .................................................................................- 42 - 3.2.3 Plant Efficiency Losses .........................................................................- 43 - 3.2.4 Reliability and Operability Issues.........................................................- 44 -
3.3 Research Areas/Potential New Technologies ...............................................- 45 - 3.3.1 Advanced O2 Separation .......................................................................- 46 - 3.3.2 Chemical Looping Combustion.............................................................- 47 - 3.3.3 Internal Flue Gas Recycle ....................................................................- 49 - 3.3.4 Clean Energy Systems, Inc. Rocket Engine Steam Cycle......................- 50 -
3.4 Chapter Conclusions .....................................................................................- 52 - 4.0 Pre-Combustion Technology ........................................................................- 54 - 4.1 Overview.......................................................................................................- 54 -
4.1.1 IGCC without CO2 Capture ..................................................................- 54 - 4.1.2 IGCC with CO2 Capture .......................................................................- 57 -
4.2 Current Technology/State of the Art.............................................................- 58 - 4.2.1 Technology Overview............................................................................- 58 - 4.2.2 CO2 Capture Cost .................................................................................- 60 - 4.2.3 Plant Efficiency Losses .........................................................................- 62 - 4.2.4 Reliability and Operability Issues.........................................................- 63 -
4.3 Research Areas..............................................................................................- 65 - 4.3.1 Pressure Swing Absorption/Adsorption with Alternative Sorbents ......- 65 - 4.3.2 CO2 Separation from Syngas by Hydrate Formation ...........................- 66 - 4.3.3 Sorption Enhanced Water Gas Shift Reaction ......................................- 68 -
- 4 -

4.3.4 Membrane-Enhanced Water Gas Shift Reaction ..................................- 69 - 4.3.5 Fuel Cell Systems ..................................................................................- 71 -
4.4 Chapter Conclusions .....................................................................................- 75 - 5.0 Discussion of Research and Development........................................................- 77 -
5.1 Types of Research & Development ..............................................................- 77 - 5.2 Role of Government and Industry in R&D...................................................- 78 - 5.3 Managing R&D Efforts as a Portfolio ..........................................................- 79 - 5.4 Portfolio Management Tools ........................................................................- 80 -
5.4.1 Technology Readiness Levels ...............................................................- 80 - 5.4.2 “Gate”-Style Models ............................................................................- 83 -
5.5 Analytical Tools............................................................................................- 85 - 5.5.1 Integrated Environmental Control Model ............................................- 85 - 5.5.2 CO2 Capture Project Common Economic Model .................................- 87 - 5.5.3 Quantitative Tools.................................................................................- 89 - 5.5.4 Risk vs. Reward Assessments ................................................................- 89 - 5.5.5 Subjective Assessments .........................................................................- 91 -
5.7 Chapter Conclusions .....................................................................................- 92 - 6.0 Conclusions and Recommendations .................................................................- 93 - 7.0 References.........................................................................................................- 97 -
- 5 -
List of Figures Figure 1. Pulverised Coal Power Plant without CO2 Capture (Adapted from U.S. DOE
NETL, 2002) .........................................................................................................- 13 - Figure 2. Pulverized Coal Power Plant with Amine Scrubbing for CO2 Capture (Adapted
from U.S. DOE NETL, 2002)...............................................................................- 19 - Figure 3. Amine Chemical Absorption Process (Adapted from Herzog & Golomb, 2004)
...............................................................................................................................- 20 -Figure 4. Total Plant Cost and Cost of Electricity for PC Plants with and without Capture
(Adapted from Deutch & Moniz, 2006) ...............................................................- 21 - Figure 5. Efficiency Losses by Category for a Subcritical PC Plant with Capture
(Adapted from Deutch & Moniz, 2006) ...............................................................- 23 - Figure 6. Alstom/Ecole des Mines de Paris Anti-Sublimation Process (Adapted from
Clodic, et al., 2005)...............................................................................................- 32 - Figure 7. Lithium Zirconium Wheel Diagram (Adapted from Alstom, 2006) ............- 34 - Figure 8. Oxy-fired Pulverized Coal Power Plant with CO2 Capture (Adapted from U.S.
DOE NETL, 2002)................................................................................................- 38 - Figure 9. CO2 Purification and Compression Plant (Adapted from Mancuso, et al., 2005)
...............................................................................................................................- 42 - Figure 10. Total Plant Cost and Cost of Electricity for Supercritical PC Plants without
Capture and with Oxy-Firing (Adapted from Deutch & Moniz, 2006)................- 43 - Figure 11. Efficiency Losses by Category for an Oxy-fired Supercritical PC Plant with
Capture (Adapted from Deutch & Moniz, 2006)..................................................- 44 - Figure 12. Boiler with Integrated Ionic Transport Membranes (Adapted from Sirman, et
al., 2004) ...............................................................................................................- 47 - Figure 13. Conceptual Diagram of Chemical Looping Combustion System (Adapted from
Adanez, et al., 2004) .............................................................................................- 48 - Figure 14. Dilute Oxygen Combustion System (Adapted from Kobayashi, 2001) .....- 49 - Figure 15. Tangential Firing Flow Regime (Adapted from Coen, 2006) ....................- 50 - Figure 16. Process Flow Diagram for "Rocket" Style Steam Generation (Adapted from
Clean Energy Systems, Inc., 2006).......................................................................- 51 - Figure 17. Close-up View of the Combustion Chamber/Steam Generator (Adapted from
Clean Energy Systems, Inc., 2006).......................................................................- 51 - Figure 18. IGCC System without Capture (Adapted from Holt, 2001).......................- 55 - Figure 19. Three Major Types of Gasifiers - Moving Bed, Fluidized Bed, and Entrained
Flow (Adapted from Holt, 2001) ..........................................................................- 56 - Figure 20. IGCC System with CO2 Capture (Adapted from Phillips, 2005)...............- 58 - Figure 21. Simplified Flow Diagram of Pressure Swing Absorption Process (Numbers
Adapted from EPRI, 2000) ...................................................................................- 60 - Figure 22. Total Plant Cost and Cost of Electricity for IGCC Systems with and without
Capture, Supercritical with Amine Capture for Reference (Adapted from Deutch & Moniz, 2006).........................................................................................................- 62 -
Figure 23. Efficiency Losses for an IGCC System with CO2 Capture (Adapted from Deutch & Moniz, 2006) ........................................................................................- 63 -
Figure 24. CO2 Separation from Shifted Syngas Stream by the Formation of Hydrates (Adapted from Deppe et al., 2003). ......................................................................- 67 -
- 6 -

Figure 25. Simplified Diagram of a Sorbent Enhanced Water Gas Shift Reaction (Adapted from Allam, et al., 2004).......................................................................- 68 -
Figure 26. Section of Membrane Enhanced Water Gas Shift Reactor (Adapted from Lowe, et al., 2004) ................................................................................................- 70 -
Figure 27. Schematic of Solid Oxide Fuel Cell (Adapted from PES Network, Inc., 2006)- 72 -
Figure 28. Solid Oxide Fuel Cell with CO2 Capture (U.S. DOE, ER, 1993). .............- 73 - Figure 29. Schematic of Molten Carbonate Fuel Cell (Adapted from U.S. DOD Fuel Cell
Projects, 2006) ......................................................................................................- 75 - Figure 30. A Stokes Research and Development Matrix (Adapted from Deutch & Lester,
2004) .....................................................................................................................- 78 - Figure 31. Technology Development Pipeline. ...........................................................- 80 - Figure 32. IECM User Interface Input Screen (Integrated Environmental Control Model,
2005) .....................................................................................................................- 86 - Figure 33. Sample Output from CO2 Capture Project Common Economic Model
(Melien, 2005).......................................................................................................- 88 - Figure 34. Example of a Risk/Reward Diagram (Adapted from Cooper, et al., 2001). - 90
-Figure 35. Schematic Representation of the Technology Options and Pathways for CO
Capture2
..................................................................................................................- 93 -
List of Tables
Table 1. Typical Raw and Treated Flue Gas Properties (IECM, 2005).......................- 16 - Table 2. A Comparison of Alternative Solvents to MEA............................................- 26 - Table 3. NASA TRL Model (Mankins, 1995).............................................................- 81 - Table 4. TRL Model Adapted for CO2 Capture Technologies ....................................- 83 - Table 5. General Electric "Tollgate" Model (Chao & Ishii, 2005) ..............................- 84 -
- 7 -

List of Acronyms ASU Air Separation Unit CO2 Carbon Dioxide COE Cost of Electricity (in $/kWhe) DOD Department of Defense DOE Department of Energy ECV Expected Cash Value EOR Enhanced Oil Recovery ESP Electrostatic Precipitator FGD Flue Gas Desulferizer GAO General Accounting Office (U.S.) HHV High Heating Value HRSG Heat Recovery Steam Generator IECM Integrated Environmental Control Model IGCC Integrated Gasification Combined Cycle ITM Ionic Transport Membrane kWe Kilowatts Electric Power kWhe Kilowatt-Hour Electric Power MCFC Molten Carbonate Fuel Cell MEA Monoethanolamine MWe Megawatts Electric Power MWth Megawatts Thermal Energy NASA National Aeronautics and Space Administration NH3 Ammonia NOx Nitrogen Oxides PC Pulverized Coal SCR Selective Catalytic Reducer SO2 Sulfur Dioxide SOFC Solid Oxide Fuel Cell TPC Total Plant Cost (in $/kWe) TRL Technology Readiness Level WGS Water Gas Shift
- 8 -

Acknowledgements
I would like to sincerely thank Howard Herzog for his guidance and support during the
development of this thesis and throughout my time at MIT. I also owe a debt of gratitude
to Jim Katzer for his guidance and patience during the work conducted both for this thesis
and for the coal study. I would also like to thank Greg McRae, John Wootten, Ernest
Moniz, and Rich Sears for their contributions that helped shape my thinking as the thesis
progressed. Mary Gallagher also deserves thanks for her knowledge, support, and
assistance that has been critical during the writing of this thesis and throughout my MIT
research experience.
I would like to thank the Carbon Sequestration Initiative for the financial support that
made this thesis possible.
I would also like to thank my parents, siblings, and friends who have provided the
external support without which the completion of this thesis would not have taken place.
I guess that even includes my office-mates, Mark Bohm and Greg Singleton, whose
comic relief surely made the workplace more fun, if not more productive.
Biographical Note
Salem Esber holds a BS in chemical engineering, cum laude, from Ohio University
(2002). He worked for nearly two years as an engineer for the Ohio Environmental
Protection Agency, and has had summer research experiences with the International
Institute for Applied Systems Analysis and the Department of Chemical Engineering at
the University of South Carolina, and a summer internship with Pacific Environmental
Services, Inc.
Salem was born in Canton, OH, on February 5, 1979, and grew up in Oxford, OH, where
he graduated from Talawanda High School (1997). He enjoys fishing, outdoor
recreation, athletics, and travel.
- 9 -

1.0 Introduction
1.1 Background & Motivation
The demand for energy in the U.S., and across the globe, has been steadily increasing in
recent years, and is projected to continue to increase for years to come. Much of this
demand is met through the production of electric power from inexpensive coal in
combustion systems, which emit large quantities of carbon dioxide to the atmosphere in
the process. Simultaneously, concerns over the effects of global climate change, which is
strongly a factor of atmospheric CO2 concentrations, are also increasing. In order to
manage the conflict between increasing demand for affordable electric power and
increasing concerns over climate change, strategies for supplying low-carbon power are
being pursued.
In the event that serious CO2 emission limitations are adopted, technological solutions
will be needed to avoid CO2 emissions while the use of coal is continued. The separation
of CO2 from post-combustion flue gas or, alternately, from fuel prior to combustion, can
be achieved with existing technology, but not without high capital and operational costs.
This thesis assesses the state-of-the-art technologies and potential options for
improvement in CO2 capture processes for the coal-fuelled electric power industry, and
recommends a path forward for advancing research and development for those
technologies.
1.2 Thesis Objectives & Approach
The primary question this thesis seeks to answer is,
“How should research and development efforts in CO2 capture technologies
for the coal-fuelled electric power industry be prioritized and advanced?”
This question implicitly asks a number of other important questions; what should the
roles of government and private industry be, what decision making tools and structures
can be used to ensure a rigorous and effective process, what should be done in the short
- 10 -

term versus the long term, how should risks and rewards be balanced, and, ultimately,
which technologies should be chosen and who should decide what these are?
To answer the overarching question, it is important to have a strong understanding of
what the technology options are and what their limits appear to be. There are a number
of potential technological approaches and pathways for capturing CO2, and a broad and
scattered literature base describing them. It is difficult for decision-makers to gain a
complete awareness of all the options, let alone gain enough understanding of each to
decide where to allocate scarce research and development resources. To help in
overcoming this difficulty, this thesis presents a comprehensive review of technology
options for CO2 capture for the coal power generation industry, and allows interested
individuals to gain an understanding of the status of CO2 capture technology and the
potential pathways forward.
In addition to a technology assessment, this thesis also examines issues in managing
research and development efforts, and discusses policies which can be undertaken to help
focus these efforts and ensure that CO2 capture technology is advanced. It will look at
potential steps that can be taken in the near term that will provide options for long-term
solutions.
Supplying the energy to facilitate wealth and prosperity, while simultaneously alleviating
the risks of climate change, is a challenge that requires advances in both technology and
policy. Technology options must be well understood, and they require prudent policy
decisions in order to advance. Based on conclusions drawn from the technology
assessment and the research and development review, this provides suggestions for a
systematic approach for analyzing options and formulating decisions in research and
development efforts in CO2 capture technology.
- 11 -

2.0 Post-Combustion Technology
Post-combustion CO2 capture refers to the capture of CO2 from the flue gas stream of a
conventional pulverized coal (PC) power plant. Conventional coal plants are based on a
simple concept – they use the heat from burning raw coal to make steam, which drives
turbines to generate electric power. Several process variations are possible, but nearly all
coal-powered plants operating in the U.S., and in the world, are conventional subcritical
or supercritical PC plants.
2.1 Overview
2.1.1 Pulverized Coal Power Plant without CO2 Capture
In order to understand how post-combustion capture works, and to appreciate the
technological challenges, it is important to first understand how a PC power plant works
(see Figure 1). In a typical plant, raw coal is milled to the consistency of talcum powder,
and fed pneumatically to the boiler in a stream of pre-heated combustion air (Deutch &
Moniz, 2006). The coal particles are rapidly heated as they enter the combustion
chamber, which pyrolitically decomposes the organic structure within the coal into
combustible gases, gaseous tars, and a carbonaceous char particle that includes the ash
materials. The gases and carbon combust in the coal flame at temperatures between 2100
and 2700 °F, giving off heat and producing CO2 and water vapor, and leaving behind an
ash residue. Also in the combustion chamber, SO2 and NOx are formed by oxidation of
sulfurous and nitrogenous compounds present in the coal. NOx is also produced through a
thermal formation process in which oxygen atoms present in the flame gases react with
N2 from the combustion air (Williams, et al., 2000).
- 12 -

Figure 1. Pulverised Coal Power Plant without CO2 Capture (Adapted from U.S. DOE NETL, 2002)
Heat from the combustion process is transferred to pressurized water through tubes that
line the boiler wall, generating high pressure steam for the steam cycle (to be described
below). The flue gas leaves the convective section of the combustion chamber at around
600 °F, and passes through the air heater after which its temperature is reduced to about
300 °F (U.S. DOE, NETL, 2002). At this point, the flue gas is made up primarily of N2,
H2O, and CO2.
In modern plants, the flue gas is then treated to meet environmental restrictions before
release to the atmosphere. Some plants have a selective catalytic reducer (SCR)
following the air heater, although it is not pictured in Figure 1. The SCR uses ammonia
or urea to reduce NOx to N2, although in-boiler controls are often used in lieu of these
- 13 -

expensive systems. The flue gas then typically passes through an electrostatic
precipitator (ESP) to remove boiler fly-ash, then through an induced draft fan which
forces the gases through the system, and maintains a slight negative pressure in the boiler.
Finally, a flue gas desulfurizer unit (FGD) is sometimes used to remove SO2 when high
sulfur coals are burned (U.S. DOE, NETL, 2002). The treated flue gas is then ejected to
the atmosphere.
The steam cycle is where the energy in the steam is converted to useable electric power.
Subcritical PC plants typically have one steam reheat cycle (as shown in Figure 1),
although some have a double reheat system. The high pressure steam reaches pressures
around 2400 psi and temperatures of 1000 °F before being passed through the high
pressure turbine. The outlet from this turbine is reheated, then passed through an
intermediate pressure turbine, then either reheated again or passed directly to the low
pressure turbine. The low pressure turbine outlet is condensed and pumped through a
series of heat exchangers, de-aerated, and sent back to the boiler to generate high pressure
steam (U.S. DOE, NETL, 2002). All of the turbines are coupled to generators, which
produce electricity. PC plants with subcritical steam systems typically have plant thermal
efficiencies in the 34-38% range, on a higher heating value (HHV) basis1 (Deutch &
Moniz, 2006).
The steam cycle can be designed to operate at higher temperatures and pressures to
improve the efficiency of the plant. Current supercritical steam cycles operate at around
3530 psi and 1050 °F, with an overall plant thermal efficiency of around 38-40%. There
are some “ultra-supercritical” plants in operation at 3850 psi and 1100 °F, and materials
advancements could allow pressures of 5300-5600 psi and temperatures of 1290-1330 °F,
reaching efficiencies of 42-45% for bituminous coal (Deutch & Moniz, 2006). For
plants with supercritical and ultra-supercritical steam systems, the flue gas processing
1 Thermal efficiency is defined as the percent ratio of electric output to energy fed to the system. For example, a 500 MW plant that is fed 4.88x10⁹ Btu/hr would be 35.0% efficient by the following calculation:
%0.35%10034141
1000/1088.4
5009 =∗⎟
⎠⎞
⎜⎝⎛
⋅∗⎟⎠⎞
⎜⎝⎛∗
hrkWBtu
MWkW
hrBtuxMW
- 14 -

portion of the plant downstream of the boiler remains essentially the same, as does the
flue gas composition. Upgrading an existing subcritical system to supercritical or ultra-
supercritical is not a trivial matter, however, and effectively means that the majority of
the plant would need to be rebuilt.
It is important to note that improvements in efficiency offered by supercritical and ultra-
supercritical systems are equivalent to a reduction in CO2 emissions. As efficiency is
improved, more electricity is generated from the same amount of coal input and, likewise,
the same amount of by-product (including CO2) output. If CO2 capture is considered, the
fact that there is less CO2 produced per kWhe of electricity generated (at higher
efficiencies) means that there is less capture cost per kWhe.
2.1.2 Pulverized Coal Power Plant with CO2 Capture
Post combustion CO2 capture technology concepts can vary greatly, but the common
characteristic is that the capture process takes place following combustion and steam
generation. Flue gas properties can be highly variable, depending on the properties of the
coal and the configuration of the boiler, but generally fall within the ranges shown in the
“Raw” flue gas column in Table 1 prior to flue gas cleaning.
In today’s state of the art PC power plants, electro-static precipitators (ESPs), flue gas
desulfurizers (FGDs), and often selective catalytic reducers (SCRs) are employed to
remove particulate matter, sulfur dioxide (SO2), and nitrogen oxides (NOx), respectively.
The ESP, FGD, and SCR change the composition of the flue gas in important ways.
Table 1 shows typical flue gas properties for a PC power plant that employs these
technologies, but does not have a CO2 capture system.
- 15 -

Raw TreatedTemperature (°F) 300 129 - 143Pressure (psi) 14.4 14.4Flow rate (ton/hr)* 2700 - 3200 2800 - 3400
N2 (%) 67 - 74 62 - 67H20 Vapor (%) 8 - 15 16 - 22CO2 (%) 11 - 12 ~11O2 (%) 5 - 6 ~5Ar (%) 0.8 - 0.9 0.7 - 0.8SO2 (ppm) 400 - 2300 3 - 15NOx (ppm) 20 - 25 2 - 5HCl (ppm) 30 - 110 3 - 10*On a 500 MWe plant basis.
Flue Gas Analysis
Table 1. Typical Raw and Treated Flue Gas Properties (IECM, 2005).
The post-combustion capture of CO2 is analogous to the capture of other air pollutants; it
is the addition of another set of process equipment at some point in the flue gas
processing train. Generally, CO2 capture processes are designed to follow the ESP, FGD,
and SCR, and these units may require re-optimization or reconfiguration. Acid gases
such as SO2 and NOx can poison solvents in capture processes, and particulate matter can
also degrade solvents and damage process equipment, so a relatively clean flue gas
stream may be needed for CO2 separation.
The challenge is to remove a significant portion of the CO2 from the flue gas stream, at
the lowest possible cost. The primary separation is that of CO2 and N2. For the purposes
of this thesis, it will be assumed that the removed CO2 stream will be prepared for
pipeline transportation and geologic storage, which means it must be pressurized higher
than the critical pressure of CO2, usually to 100 atm or greater. The CO2 must be nearly
free from non-condensable gases such as N2 and O2, so that single phase flow can be
achieved, and must be dehydrated to avoid corrosion problems.
The relatively low concentration of CO2 in the flue gas makes the separation difficult, and
actually eliminates some capture technologies from reasonable consideration. A higher
- 16 -

concentration of CO2 provides a higher driving force for separation processes. This fact
explains why separation from the flue gas stream of a coal-fired plant is more attractive
than separation from a gas-fired plant or directly from air, where CO2 concentrations are
lower. In addition, it is very significant that the flue gas from a coal boiler leaves the
system at atmospheric pressure, and hence has a low CO2 partial pressure. Separations
which are driven by a high CO2 partial pressure differential, such as most membrane
separation systems, can essentially be dismissed because of the prohibitive cost of
pressurizing such a large volume of gas.
Post-combustion CO2 separation is a major challenge because such a large volume of flue
gas is generated. For example, a typical 500 MWe subcritical PC power plant burning
Illinois #6 coal with a HHV efficiency of 35% emits approximately 2.7 million kg/hr of
flue gas, of which 463,000 kg/hr is CO2 (Deutch & Moniz, 2006). To put this in
perspective, the same plant produces approximately 12,700 kg/hr of SO2 and 1,900 kg/hr
of NOx (most of which is captured in the air pollution control devices). Controlling CO2
is a considerably larger task than previous flue gas pollution control efforts. It requires
large process units, large quantities of process energy, and can require large quantities of
additional process feedstock.
SO2 and NOx can be serious concerns for CO2 capture systems, even in low
concentrations. Levels of SO2 in the flue gas are a direct function of the sulfur content in
the coal, so higher sulfur coal types are more problematic for capture systems than low
sulfur coals. NOx levels are a function of nitrogen levels in coal, but more a function of
burner design and flame conditions. SO2 and NOx can foul solvents in chemical
absorption systems and SO2 can cause corrosion. Most chemical absorption systems
require that SO2 and NOx concentrations be less than 10 ppmv and 20 ppmv, respectively
(IEA, 2004). These levels are lower than is currently required, but are attainable with
current technology. Existing plants with FGDs would require a modification to achieve
these levels, but new plants could be designed to do this at relatively little additional cost.
Low NOx burners and an SCR could be used to meet the NOx requirements (FLUOR,
- 17 -

2004). For other types of post-combustion capture systems, SO2 and NOx requirements
may be different, but the presence of these compounds may still complicate matters.
The oxygen in the flue gas is also a concern for solvent systems, and must be taken into
consideration. It rapidly degrades amine solvents, and an inhibitor must be added to the
solvent in order for it to survive in the presence of O2 (Roberts, et al., 2005).
2.2 Current Technology/State of the Art
2.2.1 Technology Overview
Post-combustion separation is currently employed in about a dozen facilities worldwide
to produce CO2 for commercial sale, and the technology used is a chemical absorption
system using monoethanaoloamine (MEA) as the absorbent (Herzog & Golomb, 2004).
In a PC power plant, the amine system is added to the process following the FGD, just
before the flue gases go to the stack, as shown in Figure 2. The balance of the plant
essentially remains the same, although some modifications to the steam cycle are
necessary to accommodate the heat requirements in the amine plant. The FGD may also
need improvement to further reduce SO2, which otherwise fouls the solvent in the amine
plant.
- 18 -

Figure 2. Pulverized Coal Power Plant with Amine Scrubbing for CO2 Capture (Adapted from U.S.
DOE NETL, 2002)
In a chemical absorption plant, the flue gas is contacted with the MEA in a packed
absorption tower (see Figure 3). The CO2 and MEA react to form a protonated amine and
a bicarbonate anion in solution by the following reaction:
C2H4OHNH2 + H2O + CO2 ↔ C2H4OHNH3+ + HCO3
- (1)
The remaining flue gases are washed to remove any residual MEA, and exhausted to the
atmosphere. After filtration and a heat recovery step, the CO2-enriched solvent is passed
through a regeneration unit in which counter-current steam drives the reaction to the left,
producing a stream of H2O and CO2. The H2O is condensed out, leaving a stream of CO2
that is over 99% pure and prepared for compression. The CO2-lean solvent is cooled and
recycled to the absorption tower (Herzog & Golomb, 2004).
- 19 -

In addition to the MEA absorbent, Mitsubishi Heavy Industries, Ltd., and Kansai Power
Co. have developed a proprietary blend of hindered amines that is used in a similar
system (Iijima, et al., 2004). The hindered amine solution is said to have a 67% higher
CO2 absorption capacity, and a 20% lower heat of regeneration (Iijima, et al., 2004).
This allows for smaller solvent flows and associated pumping costs, and smaller diameter
absorbers and strippers. The lower heat of absorption means that less steam is required
for regeneration and the energy penalty is lower. The solvent is also resistant to
degradation by oxidation, such that make-up requirements are one-fifth of those of MEA
and corrosion problems present by the degradation products are not such an issue (Iijima,
et al., 2004).
Figure 3. Amine Chemical Absorption Process (Adapted from Herzog & Golomb, 2004)
Regardless of solvent choice, the solvent cooling, heating, and pumping processes and the
compression of the purified CO2 all require energy, and reduce the overall efficiency of
the plant. The absorption column and regeneration unit are both expensive capital
investments. If this technology is to be implemented on new PC plant builds, these costs
must be lowered. Improvements are possible in the heating and cooling processes if
- 20 -

better heat integration techniques are developed. Pumping costs and the capital cost of
the units can be reduced if solvent improvements are made which reduce the amount of
solvent required. The amount of energy required to compress the CO2 from atmospheric
pressure (at which the system operates) to a one-phase liquid for pipeline transportation
and storage could also be improved with advanced compressor designs.
2.2.2 CO2 Capture Cost
One thing is certain about CO2 capture – it increases both the total plant cost (TPC) and
the cost of electricity (COE). Deutch and Moniz performed a study in which TPC and
COE were estimated for pulverized coal plants with subcritical, supercritical, and ultra-
supercritical steam systems, both with and without capture. Their estimates were
formulated based on an analysis of recent design studies, with input from experts in
industry, and are summarized in Figure 4. The results show that adding an amine
chemical absorption system increases TPC by 54-74% and increases COE by 57-69%,
(Deutch & Moniz, 2006). The increase in TPC and COE is more pronounced for less
efficient subcritical systems than for the higher efficiency super and ultra-supercritical
systems.
Total Plant Cost
0
500
1000
1500
2000
2500
Subcritical PC Supercritical PC* Ultra-supercritical PC
Tota
l Pla
nt C
ost (
$/kW
e)
No CaptureCapture
Cost of Electricity
0.0
1.0
2.0
3.0
4.0
5.0
6.0
7.0
8.0
9.0
Subcritical PC Supercritical PC* Ultra-supercritical PC
Cos
t of E
lect
ricity
(¢/k
We-
h)
No Capture
Capture
Figure 4. Total Plant Cost and Cost of Electricity for PC Plants with and without Capture (Adapted
from Deutch & Moniz, 2006)
- 21 -

2.2.3 Plant Efficiency Losses
Capturing and compressing CO2 is the most expensive part of the capture, transport, and
storage process. The costs can be expressed in terms of overall plant efficiency losses,
which translate into lost electricity production, and lost revenue. For a subcritical PC
system, the losses can be categorized into CO2 recovery heat, CO2 recovery power, and
compression energy. The CO2 recovery heat is the steam that is used to heat the CO2-
enriched amine in the regeneration unit. The CO2 recovery power is the additional power
required to drive the flue gas fan and the sorbent pump which moves the amine solvent
through the recovery system. The CO2 compression energy is the energy required to
compress the CO2 to conditions for transport and storage.
Figure 5 shows what typical losses are for a subcritical plant and how these lower the
overall efficiency of the plant. For supercritical and ultra-supercritical systems, the same
losses would be experienced in terms of category and quantity, although the losses are
simply subtracted from a higher original efficiency. For example, an ultra-supercritical
plant with an efficiency of 43.3% loses 9.2 efficiency points2 to have an efficiency of
34.1% with capture, just as the subcritical plant dropped 9.2 points from 34.3% to 25.1%
(Deutch & Moniz, 2006).
2 It is important to make the distinction between “efficiency points” and percentage losses in efficiency. A loss in efficiency points is a decrease in efficiency where one point loss is equal to one percentage point loss in the overall efficiency. A percentage loss in efficiency is a decrease in overall efficiency as a percentage of the original efficiency. For example, a drop in efficiency from 40% to 30% would be a 10 point efficiency loss, and a 25% loss in efficiency.
- 22 -

Effic
ienc
y
20
30
40
50
45
35
25
Efficiency Loss: Subcritical Capture
CO2 Recovery
(Heat)
CO2 Recovery (Pow er) &
Other
CO2 Compressor
34.3
-0.7 25.1
-5.00
-3.5Subcritical No Capture
Subcritical w ith Capture
Figure 5. Efficiency Losses by Category for a Subcritical PC Plant with Capture (Adapted from
Deutch & Moniz, 2006)
2.2.4 Reliability and Operability Issues
Reliability is highly valued in the electric power industry, both from the perspective of
the supplier and the consumer. Consumers demand a power system which provides a
steady stream of consistent quality power, with few or no interruptions or fluctuations in
voltage. Producers require high availability in order to keep costs low and to recoup
investments. The generation, transmission, and distribution of power is a complicated
matter, and any factors which limit the reliability or availability of plants are highly
undesirable.
Pulverized coal plants without CO2 capture currently have very strong and well-tested
reliability records. The reliability of amine capture systems has not been tested on such a
wide scale, nor has it been performed on the size of gas streams as those found at large
power plants (Roberts, et al., 2005). It is not a very complicated chemical process,
however, and high availability of the capture portion of the plant is expected.
- 23 -

One important characteristic of post-combustion capture systems is that they are installed
downstream of the steam generation system and are completely separate from the power
block, where the electricity is generated. The implication of this feature is that if the
capture system encounters difficulty, the portion of the plant that produces power will be
largely unaffected. The plant can continue operation while the CO2 is vented to the
atmosphere, until the capture system can be brought back online. In essence, a plant with
post-combustion capture should be no less reliable than a similarly designed plant
without capture. This is different from such systems as IGCC, which may have to be
completely shut down if the capture equipment experiences failure or must undergo
maintenance.
2.3 Research Areas/Potential New Technologies
The high cost of capture using amine systems has prompted research into alternative post-
combustion CO2 capture options and novel improvements to existing technologies.
Efforts are focused on bringing down the capital cost or energy penalty of certain parts of
the process. For example, much work is currently underway to lower the heat required
for regeneration of CO2 solvents, because it is such a strong component of the energy
penalty of capture, as shown in Figure 5.
2.3.1 Advanced Solvents
A variety of solvents could be used in the absorption/regeneration process, and each has
its advantages and disadvantages. The key physical factors in solvent selection are heat
of absorption/regeneration, CO2 absorption rate, CO2 absorption capacity, resistance to
degradation and impurities, corrosion, and volatility (Cullinane, et al., 2002, Rochelle,
2005). A solvent with a low heat of absorption requires less energy during regeneration,
which can lead to significant savings. A solvent with a high absorption rate minimizes
absorber size and pressure drop across the absorber and associated pumping costs. A
high absorption capacity allows more efficient operation and can reduce solvent volume
requirements and equipment size. Solvents with high resistance to degradation reduce
solvent make-up costs, and can reduce gas clean-up costs in the stages prior to the
absorption system. (Cullinane, et al., 2002). Corrosive solvents are undesirable because
- 24 -

they can shorten process equipment lifetime. Solvent volatility can be an important issue
because a volatile solvent can escape with the flue gases and may exceed environmental
limits.
These factors must be optimized as solvent research goes forward, and must be balanced
when determining which solvent is the most appropriate to use in a plant design.
Regeneration energy, however, is by far the most important factor in affecting cost
because of its strong impact on overall plant efficiency, as noted in Section 2.2.3.
MEA has been the most commonly chosen solvent so far, and has often been enhanced
with additives to improve its performance. Improvements must still be made, however,
for post-combustion solvent absorption/regeneration processes to be a competitive option
for CO2 capture. It is useful to compare novel or advanced absorbents to MEA because it
is in use today. Table 2 shows how a number of alternative solvents compare with MEA,
and the following sections give further explanation (Note: hindered amines were
discussed in Section 2.2.1).
- 25 -

Performance of Alternative Solvents Relative to MEA Heat of
Regenerat-ion
CO2 Absorption
Rate
CO2 Absorption Capacity
Resistance to Degradation/
Impurities Corrosion Volatility
Sterically Hindered Amines
+ ? + + + ?
Aqueous NH3
+ ? - + + + -
K2CO3/PZ + + = ? ? =
Amino-acid Salts + + + = ? +
Alkali-metals ? + + + ? +
Other Amines = = = = = =
Performance Characteristics Key: + Better, - Worse, = Similar, ? Indeterminate
Table 2. A Comparison of Alternative Solvents to MEA
Aqueous Ammonia
There has recently been discussion of using aqueous ammonia as a solvent rather than
MEA, in a similar absorption/regeneration process. Ciferno, et al. and Resnick, et al.
have published papers that discuss the benefits of using ammonia as a solvent, including a
high CO2 loading capacity, low equipment corrosion risk, low absorbent degradation, and
a low energy requirement for absorbent regeneration (Ciferno, et al., 2005, Resnick, et
al., 2004). They also highlight the potential for selling the ammonium sulfate and
ammonium nitrate by-products as an additional source of revenue which would help
recoup some of the cost of capture.
Both authors claim that there is a significant increase in CO2 loading capacity when
comparing aqueous NH3 to MEA, although they disagree on just how much. Resnick, et
al., estimate NH3 solutions to have three times the capacity as MEA, while Ciferno, et al.,
estimate the increase to be about 25% (Ciferno, et al., 2005, Resnick, et al., 2004). This
would allow for smaller solvent flows, and hence smaller equipment and pumping costs.
- 26 -

Ciferno, et al., claim that using NH3 could lead to a reduction in steam requirements of up
to 67%, and Resnick, et al., claim that steam use could be reduced by 49-64% from an
MEA system (Ciferno, et al., 2005, Resnick, et al., 2004). Because the regeneration
steam is one of the principal costs in a chemical absorption system, this is a significant
savings opportunity. Additionally, the combination of lower solvent degradation and a
cost of NH3 that is about 6-10 times less than MEA leads to significantly lower solvent
make-up cost. The bulk of NH3 that is degraded would be in the form of ammonium
sulfate or ammonium nitrate, both of which are saleable fertilizers3.
There are significant problems with using ammonia as a solvent, however, as identified
by Rochelle (Rochelle, 2005). The volatility of ammonia is a major obstacle, because it
has a tendency to exit the absorber column to the atmosphere with the flue gas. Rochelle
estimates that the NH3 concentration in flue gas could be as high as 3%, much greater
than environmentally acceptable levels of less than 10 ppm (Rochelle, 2005). Steps such
as cooling the exit gas or adding a water or acid wash could reduce these levels, but
would introduce additional costs and complications that would negate many of the
advantages of using ammonia, and there seems to be no apparent practical method to
avoid this problem (Rochelle, 2005).
Rochelle also believes that the estimates of Ciferno, et al., and Resnick, et al., of
reductions in regeneration steam are optimistic, and the steam requirements would be
similar, if not higher, than those for MEA (Rochelle, 2005). Additionally, he argues that
the rate of absorption for the NH3 process would be much slower than MEA, which may
require the absorber to be three times the height of an MEA absorber and add a major
increase to the capital cost of the system (Rochelle). .
3 The market for ammonium sulphate and ammonium nitrate fertilizers is small compared to the amount of these substances that would be produced if ammonia solvent systems were widespread. It is possible that a major CO2 capture effort would result in such an increase in supply of these fertilizers that prices would be depressed significantly, reducing the benefit of selling the by-products.
- 27 -

Some key questions that remain are:
1. Can the volatility problem be reasonably solved?
2. Are CO2 capacity improvements significant?
3. Are steam regeneration improvements significant?
4. Do the other advantages outweigh the disadvantages of the slow reaction rate?
Piperazine/Potassium Carbonate Solution
Researchers have been investigating the possibility of using an aqueous
piperazine/potassium carbonate (K2CO3/PZ) solution as a replacement for MEA in a
chemical absorption system (Cullinane, et al., 2002). The proposed system works in the
same manner and has the same configuration as the process shown in Figure 3, except
that the solvent is a 5m K+/2.5m PZ solution rather than an MEA solution.
The research has shown that a piperazine/potassium carbonate solution is better than an
MEA solution in terms of heat of absorption and rate of absorption, and roughly equal to
MEA in CO2 capacity (Cullinane, et al., 2002). This solution has a lower heat of
regeneration than the MEA solution translating to a 25 to 49% decrease in regeneration
energy (Cullinane, et al., 2002). The piperazine/potassium carbonate solution also has a
rate of absorption that is 1 to 5 times faster than MEA, allowing for a smaller absorption
column (Cullinane, et al., 2002). The piperazine/potassium carbonate solution has been
shown to have a low volatility, reducing the environmental emissions problem that
ammonia faces. The cost of PZ ($2.20/lb) is a little higher than MEA ($0.76/lb) however,
which may offset some savings (Cullinane, et al., 2002).
Some key questions that remain are:
1. Is solvent degradation significant?
2. Is corrosion a problem?
- 28 -
Amino-acid Salts
Some work has been done to investigate the advantages of using amino-acid salts such as
potassium glycinate, potassium taurate, and potassium sarcosine (Feron & ten Asbroek,
2004). Some salts were found to absorb CO2 faster than MEA, some could potentially
reduce regeneration energy significantly, some have good resistance to degradation, and
all have low volatilities (Feron & ten Asbroek, 2004). One distinct advantage that some
amino-acid salts have is that they have a particularly high CO2 capacity, which could
allow for considerably smaller equipment sizes. A complicating factor is that a
precipitate forms during absorption, which requires that equipment be able to handle
slurries.
These solvents could be especially useful where small equipment size is necessary, such
as space-limited sites. Some key questions that remain are:
1. What effects will the precipitate have on process design?
2. Is corrosion a problem?
Alkali Metal-based Sorbents
Alkali metal-based sorbents are another option for capture. These slurries of NaHCO3,
Na2CO3, or K2CO3 can absorb CO2 in a spray dryer or fast transport reactor, and can be
regenerated in a bubbling fluidized bed (Eom, et al., 2005). They have shown high CO2
capacity, high resistance to degradation, and fast reaction times. It is not clear if there is
any advantage in the energy requirements of regeneration, although there are claims that
regeneration requires less heat than the MEA process (Coker, et al., 2005). More work is
required to determine the potential for this technology to be competitive, and some key
questions remain:
1. Is there any reason to pursue these sorbents absent a heat of regeneration
advantage?
2. Is corrosion an issue?
3. Will volatility or airborne salt dust be an issue?
- 29 -

Other Amines
The use of other amines, such as diethanolamine (DEA), methyldiethanolamine (MDEA),
2-(butylamino)ethanol (BEA), N-methyldiethanolamine (NMDEA), 2-
(methylamino)ethanol (MMEA), 2-(ethylamino)ethanol (EMEA) and 2-(2-aminoethyl-
amino)ethanol (AEEA) have been considered as an alternative to pure MEA solutions
(Hoff, et al., 2004, Bozzuto, et al., 2001). Blending of these amines and the addition of
compounds such as piperazine can also affect performance, and there are certainly other
amines that were not listed. MDEA and AEEA have shown improvements over MEA in
terms of lowered heat of regeneration and somewhat higher capacity in the case of
AEEA, but these are not revolutionary improvements (Hoff, et al., 2004, Bozzuto, et al.,
2001). Most other amines have shown poorer performance than MEA, and great
advances should not be expected (Hoff, et al., 2004).
2.3.2 Process Integration
There is the potential to significantly reduce parasitic energy losses if heat integration and
novel flow-sheeting methods are used in typical amine absorption systems (Roberts, et
al., 2004). Most current designs include stripping steam that is bled from the steam
turbine power generation system, which is the most important process integration.
Another improvement that has been suggested is to use the heat generated when
compressing the purified CO2 stream in the stripper reboiler (Fisher, et al., 2005). This
improvement saves up to 4.6% of CO2 removal costs, although it causes a slight increase
in capital costs (Fisher, et al., 2005). The stripping column could also be operated at
variable pressures, with compressors between each step in the column. In this way,
partial CO2 compression actually takes place in the regeneration column, and can save
8.4% of capture costs (Fisher, et al., 2005). The two improvements added to the
regeneration system simultaneously could result in a total capture cost reduction of 9.8%,
and an overall cost of electricity savings of 5.2% (Fisher, et al., 2005). These are
significant improvements that could be made today, with relatively little additional
research and development.
- 30 -

There are probably many other opportunities for cost saving through higher levels of
process integration. A major research thrust should be to further reduce the costs of
amine absorption systems by taking advantage of potential savings through deeper
integration of the capture plant with the rest of the power plant.
2.3.3 Cryogenic Processes
A recent study by a team from Alstom Power and Ecole des Mines de Paris investigated a
cryogenic separation technique that takes advantage of the CO2 sublimation temperature
(frosting temperature) to make the CO2/N2 separation (Clodic, et al., 2005). In this
approach, flue gases are cooled by a refrigerant in a heat exchanger to below the frosting
temperature of CO2, around -120 °C, such that solid CO2 builds up on the heat exchanger
tubes (see Figure 6). After sufficient solids build-up, the heat exchanger is heated,
evaporating a pure stream of CO2 for compression and transportation. Two heat
exchanger/evaporators are used in a swing configuration, with one frosting and the other
defrosting. Cold energy in the defrosting exchanger is recovered and used in the frosting
exchanger, improving the energy efficiency of the process.
- 31 -

Figure 6. Alstom/Ecole des Mines de Paris Anti-Sublimation Process (Adapted from Clodic, et al.,
2005)
The authors have built a mock-up model to demonstrate feasibility and estimate
efficiency. At 90% CO2 capture, the anti-sublimation process was estimated to have an
energy penalty of only 3.8 - 7.3 percentage points, which is considerably better than any
other processes so far developed (Clodic, et al., 2005). They also cite the possibility that
other pollutants could also be captured in such a system, which may eliminate the need
for other costly pollution control equipment, such as FGDs.
Key questions surrounding this concept are:
1. How does this concept compare to the MEA process on an economic basis?
2. Do the anti-sublimation/sublimation and heat transfer processes happen fast
enough such that equipment size is reasonable?
3. Can this technology scale up to handle the flue gas from a power plant?
- 32 -

It should be noted that other cryogenic processes, such as low temperature distillations
and an adaptation of the Ryan-Holmes process used by the natural gas industry have been
discussed, but are generally found to be impractical.
2.3.4 Other Technologies
Stimulus-Responsive Separation Aids and Structured Fluids
There is some interest in separation processes that are based on stimulus-responsive
separation aids and structured fluids. Stimulus responsive separation aids rely on small
changes in process operations to effect large changes in capacity (Herzog, 2002). An
example of such a system is the carbon fiber composite molecular sieve that is being
developed at Oak Ridge National Laboratory. This is a monolithic electrically
conductive carbon adsorbent composed of carbon fibers bound by a phenolic resin, and it
operates by adsorbing CO2 when gases are flowed through it, then desorbing it when a
current is passed through the sieve (Judkins & Burchell, 2001).
A structured fluid is a separation aid that self-assembles reversibly to first capture then
release CO2 (Herzog, 2002). An example of a structured fluid (which, incidentally, is
also a stimulus responsive separation aid) is a liquid crystal system which could capture
CO2 then release it when an electric current is passed through (Herzog, 2002). These
processes are only in the beginning stages of research, but have the potential to
dramatically reduce the energy required to make a CO2 separation.
Lithium Zirconate Temperature Swing Adsorption Wheel
A mechanism has been proposed for removing CO2 by adsorption on a solid lithium
zirconate surface in a novel concept that allows for a continuous process (see Figure 7).
In this technique, CO2 is adsorbed to Li2ZrO3 which coats a rotating wheel by passing
flue gas across the rotor at temperatures in the range of 450-600 °C (Alstom, 2006).
After the adsorbed CO2 is moved 180° around the track of the rotor, it is removed by a
hot sweep gas. The CO2 is then cooled and compressed, and the CO2-depleted flue gas is
cooled and vented to the atmosphere (Alstom, 2006). This process is similar to chemical
absorption because it is limited by the heat of regeneration of the adsorbent.
- 33 -

Figure 7. Lithium Zirconium Wheel Diagram (Adapted from Alstom, 2006)
Molten Carbonate Membranes
Some consideration has been given to other novel separation techniques. One such
approach is to use molten carbonate to transport carbon in the form of carbonate ions
across a membrane (Granite & O’Brien, 2005). The advantage to using molten carbonate
is that it is nearly 100% selective for CO2, it has a relatively high conductivity, and could
potentially have a low parasitic power requirement (Granite & O’Brien, 2005). However,
it is very corrosive, is poisoned by SO2, can degrade if temperatures are too high, and
requires huge stacks to scale up to match the requirements of a power plant (Granite &
O’Brien, 2005).
Solid electrolyte membranes
Solid electrolyte membranes could do the same job as molten carbonate and avoid some
of the corrosion and degradation problems, but there are still major difficulties with the
membrane technology (Granite & O’Brien, 2005). Much work is required to make
molten carbonate or solid electrolyte membranes a reality.
- 34 -

Membrane contactors
Membrane contactors are another technology which can improve CO2 capture processes,
and can be used in place of absorber and stripper columns in the amine chemical
absorption process (Herzog, 2002). The advantage to membrane contactors is that they
can increase the surface area for the absorption and stripping process, allowing for much
smaller equipment sizes (Herzog, 2002). This savings is partially offset by the cost of the
membrane, however. This type of capture system is best suited for situations in which
space is limited.
2.4 Chapter Conclusions
Post-combustion capture of flue gas CO2 is a viable option for CO2 control. The current
state-of-the-art systems use MEA chemical absorption/regeneration systems to achieve
capture, although with high additional capital costs and a high energy penalty. MEA
capture increases TPC by 54-74% and COE by 57-69%, depending on which type of
steam system is employed. The bulk of the energy is lost in regenerating the solvent and
compressing the CO2 for transport and storage.
There are a number of technological solutions under development now in attempts to
reduce the cost of capture for post-combustion systems. Several alternative solvents have
been investigated, each having their advantages and disadvantages, but none seems to be
clearly superior to MEA. Deeper integrations of a chemical absorption system into the
overall plant could yield some significant gains without requiring revolutionary
innovations. Some novel concepts, such as the cryogenic CO2 frosting process, stimulus-
responsive separation aids and structured fluids, the lithium zirconate wheel, and some
membrane processes have also been investigated and may have some advantages,
including reducing heat of regeneration requirements.
What is clear is that there is a lot of uncertainty about which processes could lead to real
improvements, and which really have no real prospects for reducing the cost of capture.
When reviewing the literature, it is difficult to compare processes or technologies that
have been studied by different groups because they each have different bases for analysis,
- 35 -

and they often inject optimism into their analyses. Technologies should be carefully and
objectively analyzed, and efforts should be made to reduce uncertainty and bias.
- 36 -

3.0 Oxy-fired Technology
Oxy-fired coal combustion technology has been discussed as a solution for bringing
down the cost of capturing CO2. Some small-scale demonstrations of oxy-firing have
been done, and some pilot scale plants are planned, but oxy-fired coal power plants have
not otherwise been deployed at a large scale. Using oxy-fired technology can offer
improvements over capturing CO2 from post-combustion flue gases, but absent capture,
there is currently no incentive to use oxy-firing for the coal power production.
3.1 Overview
In a typical oxy-fired PC design, the plant is very similar to a conventional PC power
plant, as described in Section 2.1.1. The feed system, boiler, steam system, and ESP are
essentially the same, but a portion of the flue gas is recycled following the ESP, and a
cryogenic air separation unit (ASU) is used to provide 95% pure oxygen to the boiler (see
Figure 8).
In this system, the primary separation is N2 and O2 prior to combustion, so that the flue
gas is made up primarily of CO2 and water vapor (U.S. DOE, NETL, 2002). The
purification of CO2 and preparation for transport and storage is thus made much easier
and less expensive than for an air-fired system. The flue gas recycle step is necessary to
control flame temperature and stability and to ensure proper heat flux in the boiler
(Buhre, et al., 2005). Most oxy-fired designs are designed with a supercritical steam
cycles, at around 3530 psi and 1050 °F, with an overall plant thermal efficiency of around
30% (Deutch & Moniz, 2006).
- 37 -
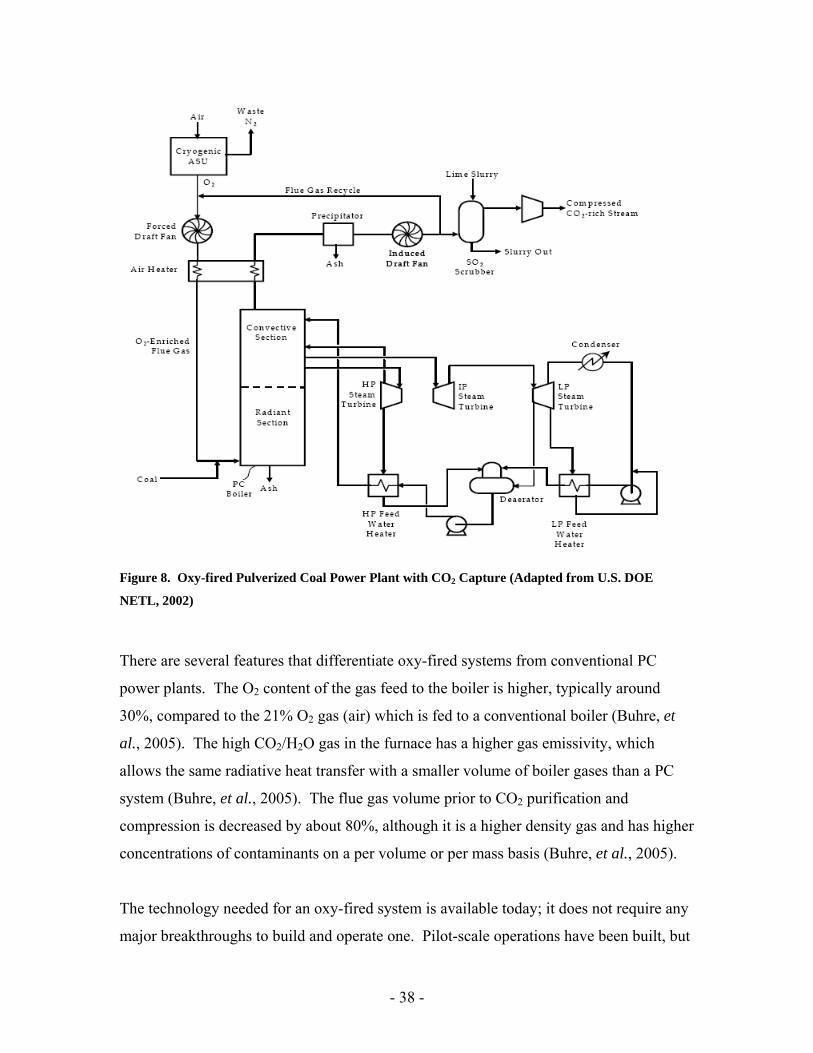
Figure 8. Oxy-fired Pulverized Coal Power Plant with CO2 Capture (Adapted from U.S. DOE
NETL, 2002)
There are several features that differentiate oxy-fired systems from conventional PC
power plants. The O2 content of the gas feed to the boiler is higher, typically around
30%, compared to the 21% O2 gas (air) which is fed to a conventional boiler (Buhre, et
al., 2005). The high CO2/H2O gas in the furnace has a higher gas emissivity, which
allows the same radiative heat transfer with a smaller volume of boiler gases than a PC
system (Buhre, et al., 2005). The flue gas volume prior to CO2 purification and
compression is decreased by about 80%, although it is a higher density gas and has higher
concentrations of contaminants on a per volume or per mass basis (Buhre, et al., 2005).
The technology needed for an oxy-fired system is available today; it does not require any
major breakthroughs to build and operate one. Pilot-scale operations have been built, but
- 38 -

none at any larger scale have been developed because incentives to capture the CO2 are
not in place, and there is no reason to use this technology except for CO2 capture (Deutch
& Moniz, 2006). The Babcock and Wilcox Company has reported flame stability, 65%
NOx reductions, and CO2 concentrations of 85% in the flue gas (with 5% air infiltration)
in a pilot-scale study (The Babcock and Wilcox Company, 2006). Boiler operation
showed no negative impact, unburned combustibles were lower or the same, and furnace
exit gas temperatures, convective pass heat absorption, and boiler exit gas temperature
were similar to an air-fired case in this study (The Babcock and Wilcox Company, 2006).
A demonstration plant is planned for Hamilton, Ohio, where a 24 MWe coal-fired power
plant will be retrofitted with oxygen feed and flue gas recycle (The Babcock and Wilcox
Company, 2006). It will undergo performance testing and should offer some insight into
how the retrofit and operation of an oxy-fired system at a larger scale will work.
Vattenfall, a Swedish company that owns power plants in Germany, has plans to build a
30 MWth lignite burning oxy-fired boiler in Germany by 2008 (Ing & Häge, 2005). This
boiler will built from the ground up and will be designed for oxy-fired combustion. It
will test the entire process, from coal feed to CO2 compression and liquefaction, with
complete interconnection of the combustion and gas processing chain (except it will not
have full steam cycle). The plant will demonstrate interaction of components and the
basic procedural principles, and will prepare Vatenfall to complete their plans to build a
300-600 MWth demonstration plant by 2015 and a 1000 MWth or greater full commercial
plant by 2020 (Ing & Häge, 2005).
3.2 Current Technology/State of the Art
3.2.1 Technology Overview
There are three distinctive features of an oxy-fired system: 1) the cryogenic air separation
unit, 2) the flue gas recycle system, and 3) and the CO2 purification and compression
system. These systems must be well understood in order to identify potential problems
and areas for improvement.
- 39 -

Cryogenic Air Separation Unit
Cryogenic oxygen production is a mature technology, and only minor improvements can
be expected in reducing the cost or energy demands of the cryogenic ASU process
(Simmonds, et al., 2005). It is currently the only large-scale technology for oxygen
production from air, and will probably be the air-separation technology utilized in the
first generation of oxy-fired power plants (Jordal, et al., 2005). Most oxy-fired systems
assume 95% pure oxygen from the ASU (the remainder being primarily argon), although
this could be adjusted up to purities greater than 99%, or down (Jordal, et al., 2005).
Higher purity oxygen is more expensive both in terms of capital and operating cost,
however, and it generally offers little additional benefit to use oxygen more pure than
95%. The cryogenic ASU consumes roughly 20% of the plant gross power output when
used in an oxy-fired system (Jordal, et al., 2005). Supplanting cryogenic ASU with a less
expensive and less energy-intensive air separation technology would be a major
development in reducing the cost of CO2 capture, and some leading options will be
discussed later.
Flue Gas Recycle
As mentioned previously, flue gas recycle is necessary to control flame temperature and
stability, to control heat flux properties in the boiler, and to maintain boiler temperatures
below the ash melting point. There are two different types of flue gas recycle, external
recycle and internal recycle. In external recycle, the flue gas stream is split after
particulate removal, and ductwork is used to deliver a portion of the flue gas back to the
boiler. The current state-of-the-art for oxy-fired combustion systems is to use external
flue gas recycle. Typically, 60-70% of the flue gas is recycled (Deutch & Moniz, 2006,
Buhre, et al., 2005). In internal recycle processes, which are used in the glass and steel
industry, high momentum oxygen jets induce a recycle flow within the boiler (Buhre, et
al., 2005). Internal recycle will be discussed in Section 3.3.3.
CO2 Purification and Compression
Requirements for purified CO2 stream conditions may vary depending on the target use
for the CO2 (storage, EOR, other) and on legal, regulatory, and environmental issues
- 40 -

(Jordal et al., 2005). For example, if it is acceptable to co-sequester CO2, SO2, and NOx
from both a technical and regulatory standpoint, then some expensive processing steps,
such as FGD, can be eliminated. Generally, it is accepted that the CO2 stream must be
greater than 95% pure, essentially free from non-condensable gases such as N2, Argon,
and O2, free from water (to reduce corrosion and avoid formation of hydrates), free from
particulate matter, and pressurized to about 110 atm (Jordal et al., 2005, Mancuso, et al.,
2005).
Figure 9 shows a possible design for a CO2 purification and compression plant that could
be integrated into an oxy-fired power plant (Mancuso, et al., 2005). In this scheme, flue
gas at 80 °C (stream 1) is first directly contacted with cool water in a scrubber tank,
where the majority of the moisture in the flue gases are condensed out and any remaining
particulate matter is also removed (Mancuso, et al., 2005). A portion of the flue gas is
then recycled, and the remainder goes through a compression and cooling process before
being further dried in a desiccant drying system. In the cold box, there is a two stage
flash tank system which separates the non-condensable gases, which are then passed
through an expander turbine to recover some useful energy, and then vented. The
purified flue gas is compressed to 110 atm and cooled to ambient conditions for pipeline
transport and storage.
- 41 -

Figure 9. CO2 Purification and Compression Plant (Adapted from Mancuso, et al., 2005)
This is just one design for a purification and compression system. Other designs are
possible, and steps can be taken in other parts of the power plant that would make
purification simpler. For example, firing the boiler with as little excess O2 as possible
and designing and building a boiler that allows very little leakage air in reduces the
presence of non-condensable gas, reducing purification requirements (Jordal et al., 2005).
3.2.2 CO2 Capture Cost
As with post-combustion systems, adding CO2 capture increases both the TPC and the
COE over a no-capture plant. Recent estimates of TPC and COE for a supercritical plant
both with and without oxy-firing and CO2 capture are summarized in Figure 10 (Deutch
& Moniz, 2006). These results show that using oxy-firing with CO2 capture increases
TPC by 43% and increases COE by 46% over a no-capture plant, and these numbers are
consistent with other estimates and from small-scale industrial experiences (Deutch &
Moniz, 2006). These TPC and COE projections are lower for an oxy-fired system than
for PC plants with today’s commercial amine capture systems.
- 42 -

Total Plant Cost
0
500
1000
1500
2000
2500
Supercritical PC* Supercritical Oxy-fired
Tota
l Pla
nt C
ost (
$/kW
e)
No CaptureCapture
*Amine Syst em f or Capt ure Case
Cost of Electricity
0.0
1.0
2.0
3.0
4.0
5.0
6.0
7.0
8.0
9.0
Supercritical PC* Supercritical Oxy-fired
Cos
t of E
lect
ricity
(¢/k
We-
h)
No CaptureCapture
*Amine Syst em f or Capt ure Case
Figure 10. Total Plant Cost and Cost of Electricity for Supercritical PC Plants without Capture and
with Oxy-Firing (Adapted from Deutch & Moniz, 2006)
3.2.3 Plant Efficiency Losses
As in the amine capture systems, there is significant energy consumption for an oxy-fired
plant with capture, which results in overall losses in plant efficiency (Deutch & Moniz,
2006). For an oxy-fired PC system, the primary losses can be categorized into ASU
energy, compression energy, and other losses. There is actually a slight gain in efficiency
due to improvements in boiler efficiency and reduced energy usage in the FGD, but this
is more than offset by the losses. A large amount of energy is required in the ASU to
make the primary separation of N2 from O2. The CO2 compression energy is the energy
required to compress the CO2 to conditions for transport and storage, and the other losses
can be mainly attributed to the energy requirements of the CO2 purification system and
the flue gas fan. Figure 11 shows what typical losses are for a supercritical oxy-fired
plant and how these lower the overall efficiency of the plant relative to a supercritical
plant without oxy-firing and capture.
- 43 -

Effic
ienc
y
20
30
40
50
45
35
25
Efficiency Loss: Supercritical Oxyfired
Other
CO2 Compressor
Air Separation
Unit
38.5
-1.0 30.6
-6.4
-3.5
Boiler & FGD
Eff iciency Increase
+3.0
Super-critical No Capture
Super-critical
Oxyfired
Figure 11. Efficiency Losses by Category for an Oxy-fired Supercritical PC Plant with Capture
(Adapted from Deutch & Moniz, 2006)
3.2.4 Reliability and Operability Issues
Pulverized coal plants without CO2 capture currently have very strong and well-tested
reliability and operability records. Oxygen-fired boilers and burners have extensive
operating histories in the steel and glass industries, and have very good reliability and
operability characteristics. Several laboratory and pilot studies have been performed and
show that, although there are some differences in performance, reliability and operability
should not be compromised if oxy-firing is applied (Buhre, et al., 2005).
One of the key differences between air fired and oxygen fired systems is that the mixture
of gases in the boiler have different heat transfer and heat capacity characteristics (Buhre,
et al., 2005). This affects how heat is transferred from the boiler into the steam system
and how stable the flame is. If the properties are substantially different, boiler or fuel
feed system redesign may be necessary to achieve performance comparable to an air fired
- 44 -

system. Results of lab and pilot-scale tests show that boiler performance actually
improves with oxy-firing because of better heat transfer characteristics, although flame
stability is compromised in some cases (Buhre, et al., 2005). Some authors have
concluded that higher oxygen concentrations must be maintained in the boiler to sustain a
stable flame, and this is a problem that can be managed (Buhre, et al., 2005).
There is some concern that the higher heat flux to the boiler walls and increased fouling
and SO3 deposition could lead to more corrosion in the boiler, and this issue should be
further investigated (Jordal, et al., 2005). Another concern is that the gas-phase
concentrations of volatile metals such as mercury, selenium, and possibly arsenic may be
slightly higher in an oxy-fired system, although one advantage is that the formation of
submicron ash particles may be slightly reduced. (Buhre, et al., 2005). Evidence shows
that oxy-fired plants have lower NOx emissions, and may possibly even have lower SOx
emissions (Buhre, et al., 2005).
A reliability and operability advantage with post-combustion capture systems is that the
entire plant does not need to shut down if there is a problem with the CO2 capture
equipment, as discussed in Section 2.2.4. For an oxy-fired plant, the situation is a little
different. If the plant is configured such that the flue gas is cleaned of SO2 prior to the
CO2 purification and compression steps, then the plant can continue operation if the
purification and compression system encounters difficulty, with CO2 vented to the
atmosphere. Reliability and operability and would not be compromised for such a
configuration. However, if SO2 is co-captured with the CO2, and the CO2 equipment
goes down, SO2 concentrations in the flue gas would be too high to vent the stream to the
atmosphere. If the plant is to continue operation, there must be a system in place to
control SO2.
3.3 Research Areas/Potential New Technologies
Figure 11 shows that the largest consumer of energy in an oxy-firing system is the ASU,
and the CO2 compression energy is also a major consumer of energy. Efforts are
underway to improve the compression process, but novel ideas for less energy-intensive
- 45 -

air separation processes to replace the cryogenic ASU are the primary focus for
improvements in oxy-fired plants. Effective process integration, particularly with heat
loads, can also make oxy-fired power plants more efficient, although this is a much lower
priority than improving air separation.
3.3.1 Advanced O2 Separation
One concept under investigation is air separation by an ionic transport membrane (ITM)
integrated into the boiler system, a technology under development by Praxair, Inc. ITMs
are non-porous ceramic membranes that selectively allow oxygen ions to pass through,
and are driven by the O2 partial pressure differential across the membrane (Chiesa, et al.,
2005). Operated in a stand-alone system, it takes a highly pressurized air feed (to
maintain a high O2 partial pressure differential) or very large membrane surface areas to
achieve significant air separation, either of which is expensive. But when integrated with
a boiler system, the ITM could operate with much less feed air pressurization and a
smaller surface area, and could result in significant savings over a cryogenic ASU. In
this type of arrangement, the coal combustion consumes the purified oxygen on the
product side of the membrane as it comes out of the membrane, which helps to maintain a
high driving force for producing additional oxygen. Figure 12 shows what a boiler with
an integrated ITM might look like. The boiler is fed coal from the bottom, with ITM
tubes and steam tubes on the walls.
Boiler-integrated ITM technology, if commercialized, could have considerable benefits.
Praxair believes that the oxygen could be supplied to a boiler for one tenth the cost of a
cryogenic ASU, and CO2 could be potentially captured for as little as $10/ton CO2,
including compression (Sirman, et al., 2004). This may be an optimistic evaluation,
however, and there are some serious issues that must be overcome. To operate in the
severe environment of a boiler, a robust material is required that can handle
compositional stress in the ITM tubes (Sirman, et al., 2004). Temperature control of the
membranes is both critical and difficult, carbon and ash deposition is problematic, and
there remain serious questions about the long term integrity and reliability of the
membrane components (Sirman, et al., 2004).
- 46 -

Figure 12. Boiler with Integrated Ionic Transport Membranes (Adapted from Sirman, et al., 2004)
3.3.2 Chemical Looping Combustion
Chemical looping combustion (CLC) is another interesting concept for oxygen delivery
(see Figure 13). This technology employs two interconnected fluidized bed reactors (air
reactor and fuel reactor), in which oxygen is removed from air by an oxygen carrier by
the following reaction in the air reactor, where Me = Metal (Ryden & Lyngfelt, 2004):
2Me + O2 2MeO (1)
In the second reactor (fuel reactor), the oxygen carrier is contacted with the fuel and
combustion takes place by the following reaction:
CnH2m + (2n+m)MeO nCO2 + mH2O + (2n+m)Me (2)
The oxygen carrier is a metal oxide particle, usually based on copper, iron, manganese, or
nickel, and delivers oxygen from the air reactor to the fuel reactor, and then is recycled to
the air reactor to be enriched with oxygen again (Ryden & Lyngfelt, 2004). Reaction (1)
- 47 -

is strongly exothermic, the heat from which is used to produce steam for power
generation in turbines. Reaction 2 is usually slightly endothermic, but can be exothermic
depending on which type of oxygen carrier is used. It is possible to generate some steam
from the fuel reactor if an oxygen carrier with an exothermic reaction is used, but the
bulk of the steam generation occurs in the air reactor.
Figure 13. Conceptual Diagram of Chemical Looping Combustion System (Adapted from Adanez, et
al., 2004)
The fuel only comes in contact with oxygen from the carrier and never mixes with N2, so
that the products from the fuel reactor are simply CO2 and H2O. These can be easily
separated and the CO2 compressed for transport and storage. No cryogenic ASU is
necessary and no major energy consuming separation processes are required.
Chemical looping combustion has been tested in systems using natural gas as a fuel. A
very high fuel conversion can be attained in the fuel reactor, and a very high purity CO2
stream is possible, with nearly 100% capture (Adanez, et al., 2004). High retention of
fines is achievable, and oxygen carrier particles have been found that neither decrease in
reactivity nor particle strength over an operation time of 100 hours (Adanez, et al., 2004).
- 48 -

It has been estimated that particle lifetime is on the order of 4,000 hours, with a cost of
replacement on the order of $1/ton CO2 captured (Adanez, et al., 2004).
There are some concerns about the use of this concept with solid fuel feedstock. It is
much more difficult for the oxygen carriers to effectively deliver the O2 to solid fuel
particles, and there may be problems separating the oxygen carrier particles from ash
particles after combustion. It is possible, and probably simpler, to combust coal
gasification products in a CLC system.
3.3.3 Internal Flue Gas Recycle
There are several possible schemes for internal recycle of flue gas. Aspirating burners
are special nozzles that are used to fire pulverized coal with an oxygen stream, which
mimics air at the fuel jet. A new concept, known as dilute oxygen combustion, reacts a
hot, dilute oxygen jet with a separate fuel jet to achieve uniform heating and ultra-low
NOx production in a unique boiler configuration, shown in Figure 14 (Kobayashi, 2001).
In a similar design, the oxygen stream enters the boiler at the opposite corner of the boiler
from the fuel jet, creating a circular flow regime. In tangential firing, oxygen and fuel are
injected from the four corners of the boiler to create a circular flow, with fuel and oxygen
injections alternating with height, as shown in Figure 15 (COEN, 2006).
Figure 14. Dilute Oxygen Combustion System (Adapted from Kobayashi, 2001)
- 49 -

Figure 15. Tangential Firing Flow Regime (Adapted from Coen, 2006)
The advantage to internal flue gas recycle systems is that they eliminate the need for
external ductwork and blowers, and they can reduce the flue gas volume. This could
bring down the cost of a greenfield oxy-fired plant, but internal recycle systems may be
difficult to achieve as a retrofit.
3.3.4 Clean Energy Systems, Inc. Rocket Engine Steam Cycle
A technology is currently being developed by Clean Energy Systems, Inc., in which
gasified coal (see Section 4) is burned with oxygen in a unique steam generation system
based on technology from the aerospace industry. This system relies on the injection of
water during the combustion process for steam generation, as opposed to firing in a
water-wall boiler to raise steam (as in conventional PC plants) or in a gas turbine with a
heat recovery steam generator (as in an integrated gasification combined cycle). The
resulting high energy gases drive multi-stage turbines to generate power, then pass
through a condenser where the water is cooled and removed (see Figure 16 & Figure 17).
Clean Energy Systems believes it could potentially reduce the cost of capture to one-tenth
of the cost of a PC plant with an MEA system, (Clean Energy Systems, Inc., 2006).
- 50 -

Figure 16. Process Flow Diagram for "Rocket" Style Steam Generation (Adapted from Clean
Energy Systems, Inc., 2006)
Figure 17. Close-up View of the Combustion Chamber/Steam Generator (Adapted from Clean
Energy Systems, Inc., 2006)
This process may be advantageous for several reasons. The combustion technique, which
provides precise, uniform mixing, as well as the injected water which controls local
temperatures, both work to keep NOx production to very low levels, so no additional
process equipment is necessary for NOx control (Clean Energy Systems, Inc., 2006). The
mixing also allows for nearly exact stoichiometric oxygen supply, which means that the
CO2 stream is more pure after combustion and water removal, and removal of non-
condensable gases may not be necessary (Clean Energy Systems, Inc., 2006).
- 51 -

The combustion chamber may also be cheaper than other alternatives, such as PC boilers
and gas turbines with heat recovery steam generators (HRSG). PC boilers are large, and
the steam tube systems are complex and require frequent maintenance, and HRSGs are
also large and expensive. This combustion chamber would be compact and would
preclude the need for a tube-based steam system or an HRSG. Additionally, this type of
system is more efficient in transferring heat to the steam than conventional boilers and
HRSGs, which are only 85-92% efficient.
The disadvantage to using this combustion technique with coal is that the coal must first
be gasified, which requires large and costly equipment (see Section 4). An expensive and
energy-intensive ASU is also required, and more oxygen is required than an oxygen-
blown IGCC systems (U.S. DOE, 2002). CO2 compression costs may also be higher than
for other gasification-based capture technologies because of the low turbine exhaust
pressures (U.S. DOE, 2002). There may also be separations required after combustion
and water separation to prepare the CO2 for transport and storage, although this depends
on how pure the oxygen feed stream is and what the purity requirements are for the CO2
stream.
3.4 Chapter Conclusions
Oxy-fired pulverized coal combustion with CO2 capture is a viable option for CO2
control, and appears to be competitive with MEA post-combustion systems both in terms
of TPC and COE. State-of-the-art oxy-fired combustion systems use cryogenic ASU to
produce O2, external recycle of flue gases to control boiler temperature and heat flux
characteristics, and a compression and cooling process with drying and flash systems to
purify and compress the CO2 for transport and storage. For a supercritical plant, oxy-
firing with CO2 capture increases TPC by 43% and increases COE by 46% over a similar
plant with capture. While firing with oxygen actually increases the efficiency of the
boiler, this is more than offset by the additional cost of the cryogenic ASU and CO2
compression.
- 52 -
Because the cost of producing O2 is so high, most efforts to improve oxy-fired CO2
capture systems focus on the air separation process. While membrane systems are
generally considered to be too expensive as stand-alone air separation systems, novel
techniques for integrating them into the combustion process could reduce the cost of oxy-
fired combustion. Chemical looping combustion is another novel concept for air
separation that could lower the cost of CO2 capture. The rocket engine steam system
under development by Clean Energy Systems, Inc. still relies on a cryogenic ASU, but
may provides gains in boiler efficiency and reduces O2 demand enough that the cost of
capture may be reduced.
As with post-combustion capture technologies, there is considerable uncertainty about
which processes could lead to improvements in the cost of capture. It is not clear for
example, that advantages provided by boiler-integrated ITM will offset the technical
problems of putting ITMs in a boiler, and the performance of chemical looping
combustion is relatively unproven in real operating conditions. In addition, the same
difficulties with comparing processes and technologies persist, and seeing through the
biases of the authors while reviewing the literature is also a problem.
- 53 -

4.0 Pre-Combustion Technology
The idea behind pre-combustion capture systems is that the CO2 is easier to remove from
a concentrated, high pressure stream prior to combustion than from a dilute stream at low
pressure (as in post-combustion). To achieve this, coal is converted to synthesis gas
(“syngas”), which is a mixture of primarily hydrogen and carbon monoxide. For a
capture system, the carbon monoxide is converted to hydrogen gas and CO2, the latter of
which is separated for storage, while the former is combusted in a turbine for power. The
syngas can also be utilized directly in a non-capture system. These types of systems are
known as an integrated gasification combined cycles (IGCC), and can offer some
significant benefits when used in a CO2 capture context.
4.1 Overview
4.1.1 IGCC without CO2 Capture
There are several types and configurations of IGCC systems, but all operate on the same
premise (see Figure 18). Coal is gasified at high temperature and pressure with steam
and oxygen, then cooled, cleaned of sulfur and particulates, and burned in a gas turbine
for power. A portion of the heat remaining in the exhaust gas from the turbine is used to
make steam in a HRSG, and the steam drives another turbine system, generating
additional power.
- 54 -

Figure 18. IGCC System without Capture (Adapted from Holt, 2001)
There are three major types of gasifiers in use today – moving bed, fluidized bed, and
entrained flow, and each has their own advantages and disadvantages (see Figure 19)
(Holt, 2001). In a moving bed reactor, steam and oxidant4 are fed in the bottom of the
gasifier, and they flow up through a bed of coal, which is fed from the top. The coal and
steam/oxidant flow counter-currently past each other, and stages of the gasification
process takes place throughout. A dry ash falls through a grate at the bottom of the
vessel, and is removed there, although some systems can operate with a wet ash (slag)
that flows out the bottom. Moving bed gasifiers are in use in South Africa, the U.S.,
Germany, Czech Republic, and China, although most uses are not for electric power
production (Holt, 2001).
4 The oxidant for a gasifier is oxygen fed to the gasifier as either air or a purified (>95% pure) oxygen stream. Most gasifiers are fed purified oxygen.
- 55 -

In fluidized bed gasification, the steam and oxidant are fed from the bottom at such a rate
that they mix the coal in the gasifier to a fluid-like consistency. Ash, which is typically
removed as a dry solid or agglomerate, is removed from the bottom. These systems can
process most coals, although are typically used with low quality coals (Holt, 2001). Of
the three types of gasifiers, this type is the least widely employed today.
Entrained flow gasifiers operate with the oxidant and fuel both fed from the top and
flowing co-currently to the bottom, where ash and syngas are removed. The residence
time for both solids and gases is very brief (only a few seconds), and temperatures are
very high. Ash is removed from the bottom as a wet slag. Because of the short residence
time, a single entrained flow gasifier can produce the syngas needed for a commercial-
scale operation, so most commercial IGCC plants use this technology (Holt, 2001).
Figure 19. Three Major Types of Gasifiers - Moving Bed, Fluidized Bed, and Entrained Flow
(Adapted from Holt, 2001)
The raw syngas can contain a considerable amount of sensible heat, particularly in the
entrained flow gasifier that is popular for IGCC plants. This heat may be upwards of
15% of the energy in the coal, so the recovery of this heat can increase the overall
efficiency of the plant (Holt, 2001). Some gasifiers have radiant heat exchangers on the
walls of the vessel to produce steam, and some have convective heat exchangers directly
following the gasifier to produce additional steam from the hot syngas. Heat exchangers
can add substantial capital cost to a plant, but can markedly improve efficiency.
- 56 -

Raw syngas contains entrained particulates, HCN and NH3 from fuel-bound nitrogen, and
sulfur compounds primarily in the form of hydrogen sulphide (H2S) and carbonyl
sulphide (COS), and trace mercury and arsenic (Holt, 2001; Higman & van der Burgt,
2003). Virtually no NOx is formed during gasification. Particulates are usually removed
in a cyclone or candle filter, or a combination of the two. In some cases, a water quench
is used. The nitrogenous compounds are removed in a water wash step, and the sulfur
compounds are removed in Acid Gas Removal processes (Holt, 2001; Higman & van der
Burgt, 2003). Mercury removal can be performed from syngas with the use of a sulfur-
impregnated activated carbon bed, at an order of magnitude less cost than from a
conventional PC power plant (Higman & van der Burgt, 2003). Although arsenic is not
regulated as an emission, most arsenic is removed in either the slag in entrained-flow
gasifiers, or in the syngas treatment wastewater (Higman & van der Burgt, 2003).
NOx can form in the combustion turbine, and this is controlled by either saturating the
cleaned fuel gas with water or by adding N2, both of which are techniques to lower flame
temperature(Holt, 2001). Current designs are able to limit NOx levels to below 15 ppm,
and some units can achieve single digits (Higman & van der Burgt, 2003).
The HRSG is a large heat exchanger in which heat from the combustion turbine exhaust
gas is transferred to steam. The steam is used to generate power in a turbine system,
similar to those used in post-combustion plants, although the steam is at lower
temperatures and pressures. The exhaust gas is then vented to the atmosphere.
4.1.2 IGCC with CO2 Capture
Unlike post-combustion capture from conventional PC plants, major changes must be
made to the core process to capture CO2 from and IGCC system (see Figure 20).
Specifically, a water gas shift (WGS) reactor is added, in which CO reacts with H2O to
form H2 and CO2. Then a separation process, typically a physical or chemical absorption
process, is used to remove the CO2 from the “shifted syngas” stream. The CO2 is then
dehydrated for further compression, and the remaining gas stream of nearly pure H2 is
- 57 -
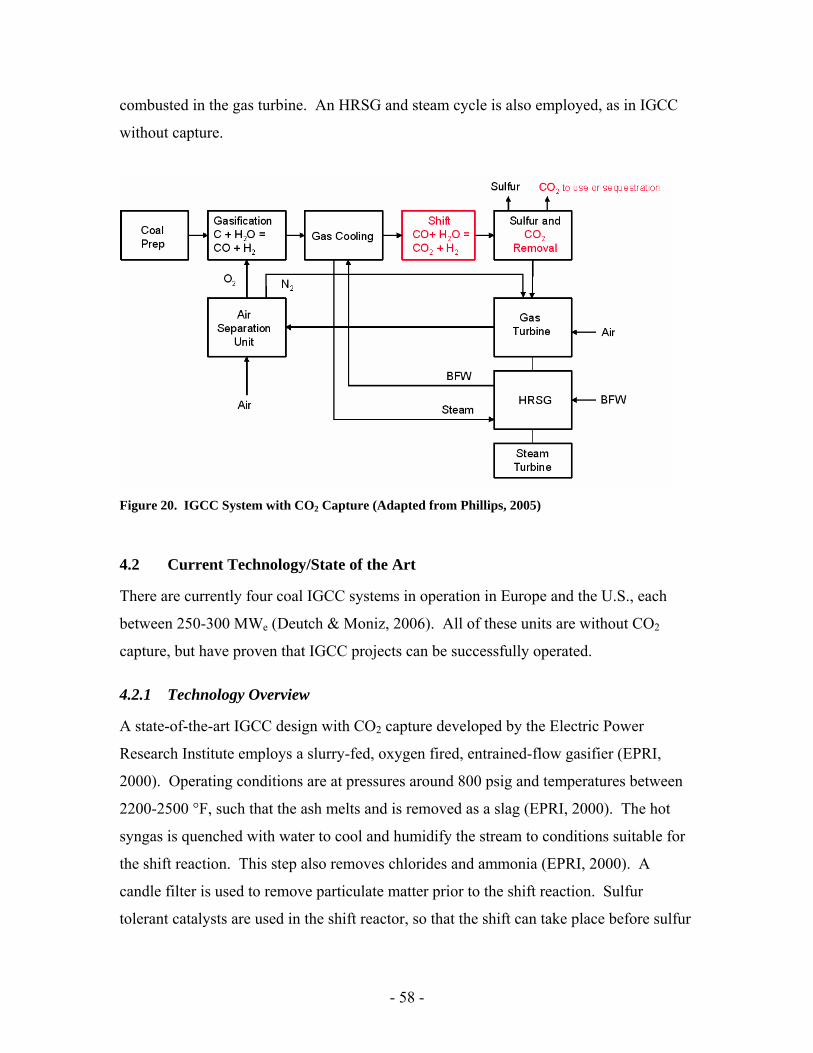
combusted in the gas turbine. An HRSG and steam cycle is also employed, as in IGCC
without capture.
Figure 20. IGCC System with CO2 Capture (Adapted from Phillips, 2005)
4.2 Current Technology/State of the Art
There are currently four coal IGCC systems in operation in Europe and the U.S., each
between 250-300 MWe (Deutch & Moniz, 2006). All of these units are without CO2
capture, but have proven that IGCC projects can be successfully operated.
4.2.1 Technology Overview
A state-of-the-art IGCC design with CO2 capture developed by the Electric Power
Research Institute employs a slurry-fed, oxygen fired, entrained-flow gasifier (EPRI,
2000). Operating conditions are at pressures around 800 psig and temperatures between
2200-2500 °F, such that the ash melts and is removed as a slag (EPRI, 2000). The hot
syngas is quenched with water to cool and humidify the stream to conditions suitable for
the shift reaction. This step also removes chlorides and ammonia (EPRI, 2000). A
candle filter is used to remove particulate matter prior to the shift reaction. Sulfur
tolerant catalysts are used in the shift reactor, so that the shift can take place before sulfur
- 58 -

removal5. A multi-stage Selexol absorption system is used to remove both CO2 and H2S,
the latter of which is then separated and converted to purified sulfur for sale or disposal
(EPRI, 2000). Selexol is a physical solvent consisting of a proprietary mixture of glycols,
and can be very cheaply regenerated. The CO2 is compressed and cooled for pipeline
transport and storage, and the H2-rich fuel gas is sent to the power block for electricity
generation.
Figure 21 gives a simplified view of how a typical single-stage Selexol CO2 capture
system works (not including sulfur capture). The CO2-rich shifted syngas, made up
primarily of CO2 and H2, is contacted with a lean Selexol solvent in an absorption
column. Here, the CO2 is physically absorbed by the solvent at a pressure around 700
psia. For the purposes of this discussion, it should be assumed that the syngas stream has
been previously cleaned of sulfur, although there are processes in which the sulfur and
CO2 are removed simultaneously. Other solvents which can also be used are chilled
methanol (also known as Rectisol) or methyldiethanolamine (MDEA), a chemical solvent
(Heintz, 2006). A relatively pure H2 fuel stream leaves the top of the absorber and is
prepared for energy conversion in a gas turbine or fuel cell, and a CO2-rich solvent
stream leaves the absorber bottom and goes to a two-stage flash tank system for
regeneration. Most of the CO2 (~90%) desorbs from the solvent in the first flash tank,
where the pressure is reduced from around 700 psia to about 50 psia. The remainder of
the CO2 desorbs in the second flash tank at atmospheric pressure, and it is boosted to 50
psia, added to the larger CO2 stream, and compressed to transportation and storage
pressure. The CO2-lean solvent is pumped back up to pressure and is sent back to the
absorption tower for another cycle (EPRI, 2000).
5 Designs in which sulfur removal takes place before the shift reactor are less efficient than designs in which sulfer tolerant catalysts are used and sulfur clean-up takes place after the shift reaction. This is because the syngas stream must be cooled down for sulfur removal then later reheated, a process in which energy is lost. In addition, as the stream is cooled, steam required for the shift reaction condenses out of the syngas stream, and, therefore, additional steam must be added for the shift reaction.
- 59 -

Hydrogen Fuel
Lean Solvent
700 psia
Absorber CO2 50 psia
(~91% of captured CO2) CO2 to Storage
~1200 psia Compressor
CO2-Rich Solvent 700 psia
Syngas
700 psia CO2 14.7 psia (~9% of
captured CO2)
Flash Tank
50 psia Valve
Semi Rich CO2 Solvent
50 psia
Valve Flash Tank
14.7 psia
Lean Solvent
14.7 psia Pump
Figure 21. Simplified Flow Diagram of Pressure Swing Absorption Process (Numbers Adapted from EPRI, 2000)
4.2.2 CO2 Capture Cost
Capturing CO2 pre-combustion, of course, increases TPC and COE relative to an IGCC
without capture. The increase, however, is less pronounced than for a conventional or
oxy-fired PC plant, for two reasons. First, it is much easier and cheaper to remove CO2
from a stream in which the partial pressure of the CO2 is higher. Partial pressure is a
function of both the concentration of CO2 in the stream and the total pressure of the
stream. For an IGCC system, the shifted syngas stream has both a concentration of CO2
that is 2-3 times higher than a post-combustion flue gas stream and a total pressure that is
40-60 times higher, so the CO2 partial pressure is almost two orders of magnitude higher.
For this reason, a weakly-binding physical solvent such as Selexol can be used, allowing
for a relatively non-energy intensive, and thus inexpensive, solvent regeneration6 (Deutch
& Moniz, 2006). The fuel gas stream is low volume and concentrated (in comparison
with a post-combustion stream that includes nitrogen), so the additional equipment for
capture is smaller than the additional equipment for a post-combustion system. Secondly,
because the syngas is pressurized in the gasifier, and kept at an elevated pressure 6 Stronger binding solvents, such as the chemical solvent MEA, require more energy to remove the CO2, and are advantageous for streams in which the CO2 concentration is lower.
- 60 -

throughout the processing steps, less energy is required to compress it to transportation
and storage conditions (Deutch & Moniz, 2006). Figure 21 shows that over 90% of the
CO2 removed is at about 50 psia (three times greater than atmospheric pressure), with the
remainder at atmospheric pressure. As mentioned in Sections 2.2.3 and 3.2.3, the energy
required for compression is quite high when the initial condition of the CO2 is at
atmospheric pressure, as in post-combustion or oxy-fired systems. Compared to those
systems, about one-third of the compression energy is eliminated for an IGCC system.
This is a substantial improvement given that the energy requirements of compression are
about 40-45% of the energy penalty of capture for post-combustion and oxy-fired
systems.
For a greenfield design, the TPC for capture is increased only about 32% and COE
increased only 27% compared to an IGCC system with no capture (Deutch & Moniz,
2006). Figure 22 shows the increase in cost of electricity for an IGCC system with and
without capture, including a supercritical PC with amine capture for comparison (Deutch
& Moniz, 2006). The TPC for an IGCC plant with capture is 10% lower than the TPC
for a supercritical PC plant with amine capture, and COE is 20% lower (Deutch & Moniz,
2006). Under the assumptions chosen by Deutch & Moniz, CO2 capture appears to be
less expensive from an IGCC than from a post-combustion PC, although for other cases
or sets of assumptions, this may not hold true.
- 61 -

Total Plant Cost
0
500
1000
1500
2000
2500
Supercritical PC* IGCC
Tota
l Pla
nt C
ost (
$/kW
e)
No CaptureCapture
*Amine Syst em f or Capt ure Case
Cost of Electricity
0.0
1.0
2.0
3.0
4.0
5.0
6.0
7.0
8.0
9.0
Supercritical PC* IGCC
Cos
t of E
lect
ricity
(¢/k
We-
h)
No CaptureCapture
*Amine Syst em f or Capt ure Case
Figure 22. Total Plant Cost and Cost of Electricity for IGCC Systems with and without Capture,
Supercritical with Amine Capture for Reference (Adapted from Deutch & Moniz, 2006)
4.2.3 Plant Efficiency Losses
As previously mentioned, the efficiency losses for an IGCC with capture are less than for
PC systems with capture. The loss in efficiency is 7.2 percentage points, as compared to
a 9.2 percentage point drop for post-combustion PC systems with capture, as shown in
Figure 23 (Deutch & Moniz, 2006). The losses can be categorized into WGS reaction
and other minor losses, CO2 recovery losses, and CO2 compression energy. The WGS
reactor requires steam and energy, and the gasifier configuration is changed such that less
steam is produced for power generation7. The CO2 compression energy is the energy
required to compress the CO2 to conditions for transport and storage, and is lower than in
post-combustion systems. The CO2 recovery losses are attributable to the additional
power required for the pumps, blowers, etc., in the Selexol unit. Figure 23 shows what
typical losses are for an IGCC plant with capture and how these lower the overall
efficiency of the plant.
7 Without capture, a radiant syngas cooler is used to generate additional steam. For a capture system, this is eliminated because the additional steam would be injected in the syngas stream for the shift reaction, so the syngas is directly quenched instead. The result is an approximately 2% decrease in overall plant efficiency.
- 62 -

CO2 Recovery
-0.9
Effic
ienc
y
20
30
40
50
45
35
25
Efficiency Loss: IGCC Capture
IGCC No Capture
CO2 Compression
-2.1
Water/Gas Shift & Other
IGCC With Capture
31.2
38.4
-4.2
Figure 23. Efficiency Losses for an IGCC System with CO2 Capture (Adapted from Deutch & Moniz, 2006)
4.2.4 Reliability and Operability Issues
Gasification of coal is an inherently capital-intensive process. As such, it is important
that IGCC systems have high availability, in order to keep the cost of electricity
competitive and recoup investment costs. This compounds the already high demand for
availability and reliability of electricity consumers.
IGCC units have not had particularly good records of availability in electric power
applications. This is because nearly all plants have been one-of-a-kind units, without the
benefits of standardization and improvement over time, and because of a few widely
publicized demonstration plants with less than impressive records on availability
(Higman & van der Burgt, 2003). Gasification processes also require considerable
operation and maintenance attention. However, it has been proven that they can offer
very high reliability and availability with the proper foresight and if operated correctly.
Although there are several substantial differences between liquid fed and coal fed
gasifiers, there is a great deal of industrial experience with the former and with very high
- 63 -

on-stream factors, up to 98% (Higman & van der Burgt, 2003). Such high availability
might not be obtainable with a coal feed, but it shows reason to believe that competitive
capacity factors are possible.
The problem with capturing CO2 from an IGCC is that the capture equipment is central to
the operation of the process as a whole. If there is a problem with any of the capture
equipment, the whole process line may go down, and power production would come to a
halt. This is in contrast to a post-combustion system in which the power-generating
portion of the plant can operate if the capture system is out of operation, and the CO2 can
be vented to the atmosphere for a period of time. Problems with reliability due to the
failure of CO2 capture equipment are very unfavorable for plant operators from an
economic perspective, and may present difficulties in grid operation that could affect
many stakeholders, including consumers.
A bypass of the capture process units is impractical because everything downstream from
the shift reactor is designed for a process with CO2 capture. The syngas stream has a
very different composition and volume without the shift reaction and CO2 capture. This
has an impact on the sulfur cleanup system, which would face very different operating
conditions, and the gas turbine, which could have flame stability problems with such a
different fuel stream.
Issues of reliability and availability hurt the competitiveness of IGCC (with or without
capture) in relation to conventional PC systems. Many studies in which these
technologies are compared assume a single capacity factor for both plant configurations,
and this simply may not be a fair assumption. Small gains in capacity factor can equal
big gains in economic performance, and the fact that PC plants may be able to attain a
better capacity factor, particularly with CO2 capture, could conceivably tip the balance in
the favor of PC plants. There is still much uncertainty involved in this debate, and the
performance of both types of plants with capture needs to be tested at large scale before
any conclusive determination could be made.
- 64 -

4.3 Research Areas
There is a great deal of interest in understanding the potential of IGCC plants for bringing
down the cost of capturing CO2. Researchers are looking at a number of parts of the
process in which to make improvements, including using superior sorbents, improving
the water gas shift reaction, and using advanced energy conversion techniques.
4.3.1 Pressure Swing Absorption/Adsorption with Alternative Sorbents
Attempts are being made to improve the cost of separation of CO2 from the fuel gas for
standard IGCC process configurations. There is some room for improvement in this
process step, although it must be kept in mind that the bulk of the cost of capture for an
IGCC system lies in the energy requirements of the water gas shift reaction and the CO2
compression energy. Energy requirements for the capture process itself, which can be
attributed primarily to the regeneration energy of the Selexol absorbent and some fluid
delivery energy, account for less than 15% of the total capture energy penalty. Systems
which reduce capital costs of capture equipment would also be beneficial.
The use of pressure swing absorption has been described in Section 4.2.1 and in Figure
21, and is currently the process of choice for removing CO2 from IGCC facilities. The
problem with these processes is that the entire fuel gas stream must be cooled
considerably before entering the Selexol unit, and even further if Rectisol is used (U.S.
DOE, NETL, 2002). The stream is cooled from about 460°F after the low temperature
shift reactor to about 100°F, which takes a substantial amount of cooling energy. If the
CO2 removal step could be performed at a higher temperature, it could be considerably
less costly in terms of the energy required to reheat the gas stream for combustion.
Researchers are looking at processes using a number of other solvents which may have
advantages over the current favorites, Selexol and Rectisol, including the ability to
function at higher temperatures.
Some fluorinated solvents are under investigation for use in pressure swing absorption
systems such as that shown in Figure 21, including perfluoropolyethylene,
perfluoropolypropylene, and perfluoroalkylpolysiloxanes. These physical solvents have
- 65 -

the ability to selectively separate CO2 from gaseous streams at high temperatures and
pressures, potentially obviating the need for a cooling and reheat step (Heintz, et al.,
2005). They also have high chemical stability, high gas solubility, low vapor losses, and
low regeneration energy requirements, which could make them attractive as replacements
for Selexol or Rectisol.
Some other adsorbents include lithium silicate-based sorbents, such as Li4SiO4, and
hydrotalcite-like compounds such as [Mg0.73Al0.27(OH)2](CO3)0.135·mH2O (Li, et al.,
2005; Hutson, et al., 2004). The lithium silicate sorbent is effective at high temperatures,
yields a high purity, high pressure CO2 stream, is highly tolerant to syngas contaminants
such as sulfur, and is effective across a broad range of CO2 concentrations (Li, et al.,
2005). It is also chemically stable and is highly regenerable, so it appears to be
promising as a CO2 sorbent. The hydrotalcite-like compounds have very good CO2
selectivity and capacity at high temperatures, but have relatively slow kinetic properties
and show some loss of capacity with cycling (Hutson, et al., 2004). These compounds,
however, are very open to structural and chemical manipulation to improve
characteristics. The kinetics and cycling properties must be better understood and
advanced in order for them to be useful as CO2 sorbents (Hutson, et al., 2004).
The use of molecular sieves, activated carbon, and zeolites has also been investigated. It
is not clear that these compounds show any advantages over current processes, however,
because they require low temperatures similar to the Selexol process.
4.3.2 CO2 Separation from Syngas by Hydrate Formation
A process is under development in which CO2 is separated from a shifted syngas stream
by taking advantage of the formation of gas hydrates rich in CO2. The syngas stream,
which consists primarily of CO2 and H2 is highly pressurized (~1000 psia) and then
cooled to temperatures approaching 0 °C (Deppe, et al., 2003). It is fed to a reactor with
saturated water, in which ice crystals form, trapping the H2S and CO2 within the
polyhedral structures (see Figure 24). The H2 molecules are too small to be stabilized
within the crystals, and are separated from the stream in a slurry/gas separator for use in
- 66 -

power generation. The water/hydrate slurry is decomposed, producing high-pressure CO2
for storage, and the water is re-saturated and recycled to the reactor (Deppe, et al., 2003).
Gaseous or liquid “promoters,” including H2S and some hydrocarbons, can be used to
enhance hydrate formation such that the hydrates form at much lower pressures, saving
pumping energy (Deppe, et al., 2003).
The advantage to this process is that it doesn’t require the use of large absorber towers or
steam heated regenerators, but it requires significant capital and energy use in
refrigeration (Deppe, et al., 2003). Progress on the concept is still in the experimental
phase, with the development of a pilot plant underway. It is possible that this process
may be superior to current CO2 capture techniques from IGCC fuel streams because it
nearly eliminates the CO2 compression step prior to storage. This may, however, be
offset by the high pumping energy requirement for hydrate formation and the energy
required for refrigeration.
Figure 24. CO2 Separation from Shifted Syngas Stream by the Formation of Hydrates (Adapted from Deppe et al., 2003).
- 67 -

4.3.3 Sorption Enhanced Water Gas Shift Reaction
The water gas shift reaction is a major consumer of energy in the capture process,
requiring nearly half of the energy required in the capture process. Improvements in the
process could be very beneficial for the economics of the capture process as a whole.
A variation of the pressure swing absorption process that could be advantageous is to
combine it with the WGS reaction. This can be done by performing the shift in a reactor
with an adsorbent bed followed by an adsorbent/catalyst bed in a high temperature, high
pressure process (see Figure 25). The first adsorbent bed removes CO2, and the
adsorbent/catalyst bed catalyzes the WGS reaction and simultaneously removes the CO2
produced as the WGS reaction takes place (Allam, et al., 2004). The reaction advances
further to the products side, so more CO is shifted to H2, and a purified H2 fuel stream is
produced. When the adsorbent is near its CO2 capacity, it is regenerated by releasing the
pressure and purging the bed with steam, producing a pure CO2 stream. Multiple
reaction/adsorption beds undergo cyclic process steps in combination to drive CO in the
fuel gas to near extinction. The CO2 adsorbent under consideration for this process is the
hydrotalcite Mg6Al2(OH)16[CO3]·4H2O promoted by K2CO3 (Allam, et al., 2004).
Adsorbent & WGS Catalyst Adsorbent
90% CO2 Removal
Figure 25. Simplified Diagram of a Sorbent Enhanced Water Gas Shift Reaction (Adapted from Allam, et al., 2004)
- 68 -

The advantages to this process are threefold (Allam, et al., 2005). First, the WGS
reaction is equilibrium limited, so removal of CO2 during the reaction drives it further to
the products side, so a more pure H2 stream can be obtained with smaller reactors.
Second, the process can be conducted at high temperatures and pressures, minimizing
heat exchange equipment costs and reheat energy loss. And lastly, the H2 fuel exits the
reactors at high temperature and with excess steam, which is ideal for feed to a gas
turbine for low NOx formation and high process efficiency. The concept has been
demonstrated and looks promising, but further characterization of process parameters at
the industrial scale is needed (Allam, et al., 2004).
4.3.4 Membrane-Enhanced Water Gas Shift Reaction
Similar to the sorption enhanced WGS process is the concept of enhancing the WGS
reaction with the use of membranes (see Figure 26). In such a system, syngas is fed to a
fixed bed reactor which has a membrane wall, at pressures around 500 psia. As H2 is
produced in the catalyzed WGS reaction, it is passed selectively through the membrane
and is swept by N2 gas to a turbine or fuel cell. The pressure drop across the membrane
is approximately 435 psi, so the H2 is produced at about 65-70 psi, so it must be
compressed further for use in a gas turbine. The removal of the H2 allows the WGS
reaction to proceed further to the desired products side, and a purified, high pressure
stream of CO2 and H2O is produced on the retentate side of the membrane. Water can
easily be removed, and the CO2 can be compressed for transport and storage. Some
retentate (H2 and CO) passes through the system un-reacted, and must be converted to
power in a turbine, fuel cell, or converted to H2 in an additional reactor step.
- 69 -

∆P = 435 psi
Figure 26. Section of Membrane Enhanced Water Gas Shift Reactor (Adapted from Lowe, et al., 2004)
Metal alloy membranes have been tested and been found to have good flux and
selectivity performance, and were able to withstand the high differential pressures
required in a membrane reactor (Lowe, et al., 2004). The membranes were alloys of Nb,
Ta, V, Zr, Pd, and other Group IVB and VB elements, but other membrane materials,
such as ceramics, are also possible (Lowe, et al., 2004).
The membrane enhanced WGS reaction concept has some advantages over the Selexol
and Rectisol processes (Lowe, et al., 2004). It can be performed at high temperatures and
pressures, saving energy. Also, because the CO2 stream is at high pressure following the
reaction and membrane separation, compression costs are lower than for a post-
combustion or oxyfired system, which is a major advantage. Membrane enhanced WGS
systems can also achieve higher CO2 removal and a more pure H2 fuel stream, and can
decrease the amount and size of process equipment, saving money on capital costs.
There are also a number of possible configurations for including membrane reactors in
- 70 -

plants, including as an afterburner step for a fuel cell system (to be discussed in Section
4.3.5). Membrane enhanced WGS reactors show potential to be a lower cost CO2
removal system, but membrane technology must be improved and costs lowered, and a
commercial-scale demonstration must be made to show that the technology can be scaled
up.
4.3.5 Fuel Cell Systems
In addition to technologies to directly separate CO2 from the fuel gas stream, different
techniques of energy conversion with CO2 separation can also be used to improve the
electricity production process. Fuel cells present the possibility of relatively low cost
CO2 capture. The efficiency attainable with a fuel cell system could greatly exceed what
is now possible with IGCC systems, and the in situ fuel reforming capability of solid
oxide and molten carbonate fuel cells could save some of the energy losses associated
with the WGS reaction. The Selexol system could be eliminated, saving additional
energy, but the CO2 compression would still be a major cost and there are other problems
that need to be overcome.
Solid Oxide Fuel Cells
The Solid Oxide Fuel Cell (SOFC) is a technology option which could potentially offer
significantly higher efficiencies than gas turbine/combined cycle systems. It works by
transferring oxygen ions from an air stream across a membrane, where they react with
hydrogen molecules, producing water and two electrons (see Figure 27). The water is
expelled from the system, and the electrons provide useable electric current. The
membrane, in effect, performs the major N2 separation for a system in which the CO2 is
captured. Solid oxide fuel cells operate at high temperatures, on the order of 1000 °C,
and the electrolyte membrane is typically a Zirconium/Yttrium oxide (U.S. DOE, ER,
1993).
Solid oxide fuel cells are capable of processing a variety of fuels, including syngas,
hydrocarbons, or hydrogen. In a coal fuelled system, a SOFC would be preceded by a
gasifier and syngas cleaning steps. A water gas shift reactor could be used, but it is not
- 71 -

necessary because the high operating temperature of the fuel cell enables in-situ fuel
reforming to hydrogen (with the addition of steam), as shown in the “Fuel” stream of
Figure 27 (U.S. DOE, ER, 1993). During reforming, CO2 is formed, and it exits the
anode side with H2O and excess fuel (H2 and CO). Because there is significant energy
remaining in this stream, it is further processed in an “afterburner” step, which would
typically be a catalyzed combustion process, followed by expansion in a gas turbine and a
steam bottoming cycle.
Figure 27. Schematic of Solid Oxide Fuel Cell (Adapted from PES Network, Inc., 2006)
For a system in which the CO2 is captured, the fuel cell is operated in the same fashion,
but the excess fuel is fired with pure (95%) oxygen in an afterburner, rather than with air,
and the exhaust gases would not be expanded for energy recovery (see Figure 28). The
exhaust gases are then almost entirely H2O and CO2, which can easily be separated and
the CO2 further compressed for transport and storage.
Some alternate steps have also been proposed for the afterburner step (Figure 28). One
option is to include a shift reactor followed by an H2 membrane separator, which converts
the remaining CO to H2 and CO2. The H2 is separated for recycle back to the fuel stream
and the CO2 is prepared for purification and compression (U.S. DOE, ER, 1993). The
relatively low CO concentrations in the anode effluent may not justify a shift reactor, but
- 72 -

there is sufficient H2 in the effluent to warrant separation and recycle (U.S. DOE, ER,
1993).
Other afterburner steps have also been proposed, including an additional SOFC, an
oxygen pump, a mixed oxide conductor, or combinations of these technologies (Lokurlu,
et al., 2004). An in-depth analysis of each of these options is not necessary, but it is
important to note that there are other options for extracting additional energy from the
excess fuel in the anode effluent. Relative investment cost and cost of electricity between
the options is difficult to estimate because of the effects of variable economic factors can
change the costs (i.e. fuel costs, CO2 tax). One study of the relative costs of these options
estimated that the investment cost and levelized cost of electricity for the technologies
following the primary SOFC can be ranked in the following order:
combustion/expansion/steam cycle < second SOFC < mixed oxide conductor < oxygen
pump (Lokurlu, et al., 2004).
Figure 28. Solid Oxide Fuel Cell with CO2 Capture (U.S. DOE, ER, 1993).
Another concept that could improve the overall performance of the process is integration
with other parts of the process. For example, integrating the high temperature fuel cell
Anode
Cathode
Combustion Chamber/
Steam Cycle Syngas
Air
2% CO 9% CO215% H2
74% H2O
Electric Power
Water
3% H2O 85% N213% O2
Or SOFC, Mixed Oxide Conductor, Oxygen Pump, Shift Reactor w/ H2 Recycle
CO2 Purification/
Compression
ASU N2Air
95% O2
CO2
- 73 -

with a high temperature air separation process, such as an ITM (see Section 3.3.1), could
reduce the cost of providing O2 to the gasifier or the gas turbine (U.S. DOE, ER, 1993).
Solid oxide fuel cell power plants can reach efficiencies of nearly 60% without CO2
capture, and 50% with capture on a lower heating value basis (U.S. DOE, NETL, 2002).
Preliminary estimates put the investment cost of an SOFC/gas turbine plant without
capture at about 20% greater than for a subcritical PC plant without capture (U.S. DOE,
NETL, 2002). For a capture case however, the SOFC/gas turbine plant is comparable in
price to an IGCC plant with capture, which is the least expensive capture plant (U.S.
DOE, NETL, 2002). The levelized cost of electricity was estimated to be a bit lower than
the IGCC plant (U.S. DOE, NETL, 2002). While SOFC plants may be nearly cost-
competitive with PC and IGCC plants, particularly with CO2 capture, there are still
hurdles. Improvements must be made in the cost and durability of electrolytes.
Operation and maintenance, and hence availability, are also an issue, as the components
of an SOFC have a shorter lifetime than those in conventional power plants and will
require outage time during replacement.
Molten Carbonate Fuel Cells
A molten carbonate fuel cell (MCFC) works in much the same way as an SOFC, except
that the electrolyte is a different material and the reaction and mechanism for transferring
ions are a bit different (see Figure 29). The electrolyte in an MCFC has a chemical
formula of MxCO3, where Mx is a metal, usually lithium or potassium (Itou, et al., 2002).
At temperatures in the range of 600-650°C, CO2 and O2 at the cathode create a carbonate
ion (CO32+) and two electrons. The ion diffuses through the MxCO3 membrane to the
anode, and the electrons provide useable power (Itou, et al., 2002). At the anode, the
carbonate ion reacts with H2 to produce H2O, CO2, and heat. The CO2 and H2O can be
easily separated, and the CO2 compressed for transport and storage, with some CO2
recycled to the cathode for consumption there. For use with coal as a fuel, the coal is first
gasified, and the syngas reformed in the cell, as with the SOFC. Alternately, it is possible
to have a direct carbon fuel cell, in which carbonate ion reacts with C, evolving pure CO2
and heat, but it is difficult and costly to get a pure C stream (Steinberg, et al., 2002).
- 74 -

Figure 29. Schematic of Molten Carbonate Fuel Cell (Adapted from U.S. DOD Fuel Cell Projects, 2006)
The balance of the plant for a MCFC is very similar to that of the SOFC, with an
“afterburner” system following the fuel cell. There are several small plants operating
around the world, most of which are around the 250 kWe scale, with one plant at the 1
MWe scale (U.S. DOE, Webpage, 2006). The questions that remain are similar to those
for SOFCs, and focus on the cost and durability of electrolytes, as well as materials
corrosion.
4.4 Chapter Conclusions
Pre-combustion capture of CO2 is a viable option for CO2 control, and may have
advantages over post-combustion systems. The current state-of-the-art systems use
slurry-fed, oxygen fired, entrained-flow gasifiers with a water gas shift reaction and cold
gas Selexol CO2 capture. TPC for capture is increased only about 32% and COE
increased only 27% compared to an IGCC system with no capture, which equates to a
TPC 10% lower than for a supercritical PC plant with amine capture, and COE that is
20% lower. The major energy consumers are the water gas shift reaction and, to a lesser
extent, CO2 compression.
Several alternative sorbents have been investigated, and some may be able to offer an
advantage over Selexol or Rectisol because they can be used at high temperatures. It is
not yet clear, however, if they are superior to Selexol or Rectisol at this point. Separating
- 75 -

CO2 by taking advantage of the formation of CO2 hydrates in water has also been
discussed, but would require cooling of the syngas, and my not be advantageous over
current processes. Improving the yield of the water gas shift reaction through the use of a
sorption enhanced or membrane enhanced process may also offer improvements to IGCC
systems with capture. Using solid oxide or mixed carbonate fuel cells could greatly
improve the overall plant efficiency, but require additional development.
IGCC systems with CO2 capture may be able to reduce the cost of capture over post-
combustion systems with MEA, but questions remain, particularly about the reliability
and operability of IGCC systems. It is not yet clear if the advantages to IGCC outweigh
the uncertainties. There are additional technological improvements to pre-combustion
capture systems which may further reduce the cost of capture. As with post combustion
and oxy-fired technologies, comparisons based simply on literature reviews are made
difficult by high levels of uncertainty, the uses of different assumptions, and the inherent
biases of the authors.
- 76 -

5.0 Discussion of Research and Development
Before discussing strategy for prioritizing CO2 capture technology research and
development efforts, a discussion of R&D theory and the role of government and private
industry in the R&D process is necessary. It is also important to look at how R&D
efforts are managed, both in government and private industry, and to investigate some of
the tools that make management easier.
5.1 Types of Research & Development
A useful way to conceptualize R&D types is by creating a matrix in which the two broad
purposes of research, improving basic understanding and finding practical applications,
are plotted on the two axes (see Figure 30). Research which is purely for improving
understanding of scientific phenomena is epitomized by the work done by Niels Bohr,
who pursued a deeper comprehension of the workings of the atom (Deutch & Lester,
2004). R&D which is directed towards finding practical applications is exemplified by
the work that Thomas Edison did in taking existing knowledge about the properties of
electric currents and applying it to develop useful products, giving little thought to the
underlying scientific implications (Deutch & Lester, 2004). Between these two extremes
is a type of research that can be thought of as “use-inspired basic research.” This is
comparable to the work done by Louis Pasteur, who had a goal of treating disease in
humans and animals and preventing the spoilage of milk, which led him to embark on
investigations of the fundamental microbiological foundations of disease (Deutch &
Lester, 2004). The bulk of CO2 capture R&D will fall in this “Pasteurian” category, with
the research being directed toward finding solutions to climate change risk, but still being
relatively fundamental in nature. There may be some purely “Bohrian” research, and
there will eventually be a great deal of “Edisonian” R&D if CO2 capture technologies are
adopted on a large scale.
- 77 -

Figure 30. A Stokes Research and Development Matrix (Adapted from Deutch & Lester, 2004)
5.2 Role of Government and Industry in R&D
It is generally accepted that the role of federal government is to protect and improve the
public welfare (Deutch & Lester, 2004). In this role, governments defend national
security, take steps to improve the economic well-being of their citizens, and protect
public health, safety and natural resources, and they use technology in various ways to
meet these ends (Deutch & Lester, 2004). Private companies seek to maximize value
from investments, serving both their shareholders and their customer base, and rely
heavily on technology to do so. Because of the particularly heavy reliance on technology
in the coal-based electric power industry and the uncertainty in terms of climate change
risk, it is very important to both parties that innovation take place in the area of CO2
capture technology. The question then arises over what the role of government and
private industry players should be in the process of innovation, and what these groups
should do to ensure that innovation occurs.
Governments should clearly take a role in use-inspired basic research or applied R&D
when it supports a specific national purpose, or when they are a specific user of the
technology that is being advanced (Deutch & Lester, 2004). Research to advance CO2
- 78 -
capture technology fits a national purpose, reducing climate change risk, so it is clear that
there should be some level of government involvement in the more applied types of
research. A final, but very important, area in which government support for R&D is
warranted is in basic research, from which the discoveries that drive much innovative
activity arise (Deutch & Lester, 2004).
Much of the time, however, there is little reason for serious government involvement in
R&D, particularly applied R&D. Private firms will generally invest in their own R&D if
they expect a sufficient payoff. In the case of CO2 capture technology, if firms expect
climate change legislation, they will have incentive to advance the technology such that it
will help them remain profitable even with CO2 limitations.
5.3 Managing R&D Efforts as a Portfolio
With several development pathways and multiple technology options to choose from
within each pathway, limited resources must be allocated such that a company interested
in CO2 capture technology will have a number of options available to them in the future.
A balance must be struck such that enough technologies are actively being developed to
provide future options, but not so many that scarce resources are spread too thin,
diminishing the chances that any single technology will reach maturity. Decisions must
be made over which CO2 capture technologies should be pursued, which should be
accelerated, and which should be cut. Prioritizing research advancements in CO2 capture
technology is essentially a portfolio management problem.
The optimal technology portfolio will have a number of different projects in various
stages of development at any given time, and will balance risk versus return and short-
term versus long-term advancements (Cooper, et al., 2001). The portfolio can be thought
of as a pipeline of technology development, with raw concepts at one end, and useable
technologies produced at the other end (see Figure 31). Research and development
efforts move potential technologies from concepts to finished products, and the portfolio
management process is used to determine which technologies are pushed through the
pipeline and how fast, and which are abandoned and when.
- 79 -

Con
cept
s Products/
Useful Technologies
Applied R&D
Basic Research
Figure 31. Technology Development Pipeline.
The management of a technology portfolio cannot occur in the dark. There must be a
structured approach to understanding each technology, determining its place in the
technology development pipeline, and deciding what to do with it. Using technology
assessments and project development tools can provide the information and structure
required to effectively manage a portfolio. There are a number of tools available, each
having its own purpose and its unique strengths and weaknesses. Government and
private industry stakeholders should carefully choose a set of portfolio management tools
that supports their strategy and their unique outlook, and fits within their aversion to their
specific set of risks.
5.4 Portfolio Management Tools
5.4.1 Technology Readiness Levels
Several approaches for assessing the potential of technologies have been experimented
with by a number of different organizations. NASA developed a system of “Technology
Readiness Levels” (TRLs) in the 1980’s to provide a consistent comparison of maturity
between different types of technology, and continues to use a refined version of it today
(Mankins, 1995). The Department of Defense (DOD) adopted the TRL approach in
2004, although the Air Force Research Lab had been using them since the 1990’s.
The NASA TRL system has nine levels, TRL 1 through TRL 9, as summarized in Table
3. Technologies are advanced from TRL 1 up through TRL 9 as they are developed.
The specific language of the TRLs shows how they are tailored for typical NASA
- 80 -

technologies, which are based primarily on flight in a space environment. The DOD
adapted the language of the TRL to suit their needs and their operating environment, but
essentially accepted the same system.
TRL 1 Basic principles observed and reported TRL 2 Technology concept and/or application formulated TRL 3 Analytical and experimental critical function and/or characteristic proof-of-concept TRL 4 Component and/or breadboard validation in laboratory environment TRL 5 Component and/or breadboard validation in relevant environment TRL 6 System/subsystem model or prototype demonstration in a relevant environment TRL 7 System prototype demonstration in a space environment TRL 8 Actual system completed and “flight qualified” through test and demonstration TRL 9 Actual system “flight proven” through successful mission operations
Table 3. NASA TRL Model (Mankins, 1995)
In 1999, the U.S. General Accounting Office (GAO) produced a report describing their
study of how technology development and transition are treated differently between the
DOD and private industry. It showed that technology assessment systems such as TRLs
can successfully aid in decision-making if properly applied, and can aid in bringing
technologies to maturity with fewer cost and schedule over-runs (U.S. GAO, 1999). The
GAO report also revealed that technologies for which product development began before
the technology was sufficiently mature (i.e. projects that were hurried to launch) tended
to have less favourable outcomes.
Technologies for DOD are generally developed first by outside organizations, and then
transferred to DOD project management and funding once a certain maturity level has
been reached. The GAO observed that, due to budget and deadline pressures, the
maturity level of early-stage technologies was often overstated so transfer to DOD could
occur sooner, which led to a higher failure rate. The GAO report recommended the
adoption of a disciplined, knowledge-based approach for technology assessment centered
around the use of TRLs, with the requirement that technologies reach a high level of
maturity (analogous to a TRL of 7) before DOD commits to development and production
(U.S. GAO, 1999).
- 81 -

The situation with CO2 capture technologies is quite similar in nature to the transfer
process that occurs in DOD development programs, although the roles are reversed. For
CO2 capture technology, most of the early stage development is done in government labs
or with government funding, while later-stage development is done primarily by private
industry, with a “transfer” of leadership when private firms are satisfied that the
technology has reached a certain level of maturity8. During the writing of this thesis, it
was observed that the early-stage technology developers seem to often overstate the
maturity or the potential of their CO2 capture technology, presumably to make their
project appear attractive to funders. To avoid the problems encountered by DOD when
rushing technologies to deployment, it would be sensible for CO2 capture technologies
that are being researched with governmental funding to have their maturity assessed
according to a TRL-like system.
The GAO also found that, in successful commercial sector organizations, product
development for manufacture and marketing does not usually take place until technology
development is complete (U.S. GAO, 1999). Because private firms must remain
profitable to survive, they took a more conservative approach, allowing technologies to
mature and prove their performance characteristics before any additional resources were
spent to bring them to manufacture and production stages. To keep with the GAO’s
second recommendation, and in light of this finding, technologies which are being
developed with governmental funding should be brought to a relatively high TRL number
before private industry players should be expected to take a leadership role in bringing
them to market.
Other groups have used TRLs, and identified problems with applying them to different
technology categories. Researchers at the Carnegie Mellon Software Engineering
Institute have explored using TRLs for some software products, and identified
8 The roles are reversed because the characteristics of the market are different for CO2 capture technologies than for DOD technologies, and the end-users are also different. The market for capture technologies is driven by the prospect of government regulation of CO2, which would force private firms to invest scarce resources in technologies for which they would be the end-user. For DOD technologies, the market is driven by well-financed government demand for advanced weaponry, which incentivizes outside firms to develop early-stage technologies for which the government will be the end-user.
- 82 -

shortcomings due to the differences between the characteristics of the software products
and NASA’s technologies (Smith, 2005). Researchers have also adapted the TRL system
for use with intelligent systems such as robots, intelligent vehicles, and teleoperated
devices. The additional sources of uncertainty and complexity in the requirements for
these systems have prompted researchers to include measurement standards
complementary to the NASA and DOD TRL model in their evaluation system (Meystel,
et al., 2003). Because the characteristics of and requirements for CO2 capture
technologies are unique, a TRL system specific to CO2 capture technologies should be
developed.
Using the NASA model as a basis, a first-attempt TRL model specific to CO2 capture
technologies is shown in Table 4 (Mankins, 1995). It includes the progression of the
technology from a scientific principle and technology concept to laboratory-scale, bench-
scale, and full-scale prototypes, and then to full deployment. These steps are intended to
reflect the actual sequence of steps that a CO2 capture technology would go through as it
is developed and deployed. The final TRL incorporates the demonstration of economic
viability, which is not included in NASA and DOD TRL models, but is an important
factor for CO2 capture technologies.
TRL 1 Basic scientific principles observed and reported TRL 2 Technology concept and/or application formulated TRL 3 Analytical and experimental critical function and/or proof-of-concept validated TRL 4 Component and/or process validated at laboratory scale TRL 5 Component and/or process validated at pilot scale TRL 6 System/subsystem model or prototype demonstrated at pilot scale TRL 7 System prototype demonstrated at full scale TRL 8 Actual system integrated into a full-scale plant and successfully deployed TRL 9 Actual system market proven through economically successful industrial operations
Table 4. TRL Model Adapted for CO2 Capture Technologies
5.4.2 “Gate”-Style Models
Many private sector organizations have their own processes to guide product
development. General Electric’s “Tollgate” system and ABB’s “Gate” model are two
- 83 -

good examples, and there are several others (Chao & Ishii, 2005). The GE model is
shown in Table 5.
TG 1 Identify need and develop concepts TG 2 Perform economic feasibility studies and select best options TG 3 Obtain customer feedback and refine approach TG 4 Develop proposal/program plans TG 5 Define launch requirements TG 6 Prepare to launch TG 7 Perform detailed design and manufacturing plan TG 8 Prepare for validation TG 9 Complete validation TG 10 Product support and identify opportunities for improvement
Table 5. General Electric "Tollgate" Model (Chao & Ishii, 2005)
These systems are meant to be a focused, formal, and disciplined approach to prioritizing
and managing projects in a portfolio (Chao & Ishii, 2005). Each gate is a decision point
at which the project is either continued with or without changes, or terminated, based on
an assessment of its benefit, status, risk, and resource and technological considerations
(Chao & Ishii, 2005). These models have been successful in ensuring consistent
implementation of process standards, enforcing discipline, managing investment risk, and
synchronizing project work.
For “gate” style project management models, there is a delicate balance between adding
structure to the technology development process and adding cumbersome bureaucratic
barriers. The rules for each step must be demanding enough that managers and
technologists are forced to stop and consider the value of the project they are pursuing, its
place in the overall strategy of the organization, and potentially even the strategy of the
organization as a whole. At the same time, valuable time and money cannot be wasted on
unnecessary and overbearing administrative steps.
Gate project management tools are valuable for delivering to market technologies that are
already mature and proven, and thus are best applied by private industry for technologies
that would have a high TRL number. They are not practical for developing early-stage
- 84 -

research concepts where the uncertainty of technical success is high. Gate models should
be incorporated into the product development process by private firms who seek to bring
CO2 capture technologies with proven technical performance characteristics to market.
5.5 Analytical Tools
Technology Readiness Level and Gate models can provide the framework for developing
technology, but there still must be methods for obtaining reliable information when
deciding which technologies to include in the portfolio. Analytical tools can be very
useful for providing such information for portfolio management decisions. The tools can
vary greatly in their purpose, applicability, and format, but generally they seek to
quantitatively analyze technologies or activities to understand the dynamics of cost,
performance, and reliability by considering technical, financial, policy, scale, learning,
and other factors. Information from these tools can be used to aid in the portfolio
management process by giving reasonable preliminary estimates of cost, material
requirements, expected performance, emissions output, and other factors. Some
analytical tools can also make an estimate of the economic or emissions impact that a
technology can have if it is successful.
There are a number of different analytical tools, each filling a different niche in the
information it is capable of providing. None of them are perfect, none of them are
universally applicable, and they are only as strong as the assumptions upon which the
calculations are based. Also, there is a distinct trade-off between sophistication and ease
of use; those that make very detailed calculations and provide very precise output require
more detailed and rigorous inputs, placing additional burden on the user. It is very
important that the analytical tool to be used is selected thoughtfully and applied
appropriately in order to get information that is useful and reliable.
5.5.1 Integrated Environmental Control Model
A good example of an analytical tool is the Integrated Environmental Control Model
(IECM), which was developed for the Department of Energy by researchers at Carnegie
Mellon University. The IECM can furnish the user with valuable information about the
energy and mass flows (including air pollutants, reagent requirements, and solid wastes)
- 85 -

and the economic factors (including capital cost, operating and maintenance costs, and
levelized cost of electricity) of coal-fuelled power plants of various configurations in a
matter of minutes (U.S. DOE, National Energy Technology Laboratory, 2001). In a
simple Windows-based interface, the user enters information about the type of coal plant
and the air emission control technologies, including for NOx, SO2, particulate matter,
mercury, and CO2, and enters key operating parameters (see Figure 32). The program re-
calculates mass and energy balances and economic estimates, and displays results in
several useful formats. The IECM is fast, powerful, and can provide an excellent basis
for comparison between competing technologies.
Figure 32. IECM User Interface Input Screen (Integrated Environmental Control Model, 2005)
IEA GHG R&D Programme Rapid Assessment Program
An analytical tool which is even more relevant for CO2 capture technology assessment is
an Excel-based calculator developed by a team from the IEA GHG R&D Programme in
- 86 -

the UK (Haines, et al., 2005). This tool screens novel CO2 capture schemes to assess
viability and performance by using standardized sources of data and performing some
simple calculations. Viability is evaluated by assessing the state of technology
development , the complexity of the flow scheme, the types of materials required, the
severity of process conditions, and the safety and environmental aspects of the
technology (Haines, et al., 2005). Performance is evaluated by assessing CO2 emissions,
fuel consumption, capital and operating costs, process complexity, severity of conditions,
construction materials, natural resource requirements, development requirements, and
safety and environmental impacts (Haines, et al., 2005). Viability and performance are
mapped on a chart with two axes, much like the bubble diagrams discussed in Section
5.4.4, to provide a visual representation of the absolute and comparative potential that
each technology option offers. This analytical tool can be very useful in helping to better
understand the strengths and weaknesses of competing processes, and in screening out
new processes which have little chance of commercial success (Haines, et al., 2005). It is
useful for technologies which are in the early stages of development.
5.5.2 CO2 Capture Project Common Economic Model
A similar analytical tool is the Common Economic Model for comparing different CO2
capture technologies that has been developed for the CO2 Capture Project (Melien, 2005).
This model applies a common set of approaches and methods in cost estimation and
economic screening of CO2 capture technologies, including a common discount factors,
pre-tax analyses, and emissions taxes (Melien, 2005). It takes into account site-specific
scenarios, comparative case analysis, significant non-capture costs, multi or byproduct
outputs, technology comparisons, and generic pricing factors (Melien, 2005). This model
makes a “best estimate” of cost levels and operational performance for technologies at the
time of commerciality, for technologies that are either commercially available or very
close to being available. Capture cost and avoided cost of CO2 is calculated based on
capital cost, operating cost, and energy costs of the capture system up to the point of
delivery of CO2 (Melien, 2005). Transportation and storage costs are addressed
separately, in a sensitivity analysis. An example of an output from the model is shown in
- 87 -

Figure 33, where the terms on the x-axis are the different CO2 capture technologies that
were compared9.
Figure 33. Sample Output from CO2 Capture Project Common Economic Model (Melien, 2005).
This model is very useful for comparing technologies that are at the “products” end of the
technology development pipeline. It is applicable to specific situations in which an
industrial operation is planned, a number of CO2 capture technologies could be chosen,
and a decision must be made in the near term. It is not useful for screening new or novel
technology options.
There are other analytical tools available, such as the chemical process models of coal-
fired power plants, with and without CO2 capture, that are developed during the course of
larger DOE-funded studies (U.S. DOE, NETL, 2002). Typically, the results of
government-funded studies are publicly available, including the analytical models which
were used to develop results. These may be of limited scope, but could still be useful in
portfolio management.
9 BL Amine = Post-combustion MEA system; MWGS/DOE = Pre-combustion membrane WGS system with DOE membrane; MWGS/GR/DOE = Pre-combustion membrane WGS system with GRACE and DOE membrane; MWGS/GR = Pre-combustion membrane WGS system with GRACE and Pd-membrane; FGRec-ASU = Oxy-fired with flue gas recycle and cryogenic ASU; FGRec-ITM = Oxy-fired with flue gas recycle and ITM.
- 88 -

5.5.3 Quantitative Tools
There are a number of quantitative and financial tools which can be useful in assessing
the value of CO2 capture technologies and in making decisions regarding portfolio
management, each having their own characteristics and applications. Some examples are
Net Present Value analyses, the “Expected Commercial Value” model and the “Bang-
For-Buck Index” developed by Cooper, as well as the “Productivity Index” model, the
“Options Pricing Theory” model, the “Dynamic Rank-Ordered Lists” model, and various
other customized scoring models. (Cooper, et al., 2001).
Quantitative tools are often simple to use, and provide distinct answers that make
comparison between technologies clear and easy to understand. It is very important to be
aware, however, that these tools are only as good as the assumptions upon which they are
based, and they often do not capture all of the aspects which should be considered when
evaluating technologies. If the strengths and weaknesses of quantitative and financial
tools are well understood and the tools are applied consistently and appropriately,
however, they can be very powerful and effective in maintaining a successful technology
development portfolio.
5.5.4 Risk vs. Reward Assessments
Finding the correct balance of risk and reward is an essential part of managing an R&D
portfolio, and should be considered by government and industry when developing CO2
capture technologies. Using a chart to display some metric of risk versus reward is a
common way of visually communicating the risk/reward profile of a technology, in an
absolute sense and in relation to other technologies. Figure 34 shows an example of what
a risk/reward diagram might look like, in this case for a company that produces a variety
of household and beauty items.
- 89 -

Figure 34. Example of a Risk/Reward Diagram (Adapted from Cooper, et al., 2001).
There are several variants of the risk/reward chart, in which different metrics are used,
but the essential characteristic is that some valuation of risk is placed on one axis, and
reward on the other axis (Cooper, et al., 2001). Metrics may differ depending on who is
using the chart, and what type of research is being performed. For example, a
government lab performing basic research should rate technologies based on probability
of technical success, while private firms doing late-stage development should be
concerned with commercial success. The size of the bubbles on the chart, as well as
colors and shading schemes can also communicate other pieces of information, such as
the estimated resources required to develop the project, levels of uncertainty surrounding
data on the technology, and importance in strategy, among others.
For CO2 capture technologies, a qualitative assessment of reward should suffice, although
a quantitative metric such as potential capture cost in $/ton CO2 might also be valuable.
Risk should be defined qualitatively, and should depend on who is developing the chart.
- 90 -
It is beyond the scope of this thesis to attempt to place the collection CO2 capture
technologies on a risk/reward diagram, but that is an exercise which should be undertaken
by both government and industry researchers.
5.5.5 Subjective Assessments
Technology readiness levels, gate product development models, and other analytical tools
can only offer so much information to decision-makers, and cannot be 100% accurate in
their assessments. There will always be factors which cannot accounted for by even the
most sophisticated decision-making tools. Additionally, there may not always be one
right answer when it comes to choosing between technology options and when deciding
whether to accelerate or abandon a technology. For these reasons, there must still be
some reliance on subjective assessments of CO2 capture technologies. Expert analysis
from individuals with extensive industry experience will always be valuable, and should
be used to fill in gaps in information when using other portfolio management tools, if not
be given a leading role in the decision-making process.
Analytical Tools Conclusions
The value in using analytical tools is that they can provide information that is very useful
in decision-making at a relatively low cost. Unfortunately, there are relatively few such
tools available for general use, and many of those that are available are still under
development. Generating additional analytical tools, particularly those which specialize
in evaluating CO2 capture technologies specifically, would be very useful for plant
owners and operators, regulators, researchers, environmental groups, and other interested
parties. The availability of such tools could provide decision makers with information on
potential technology options quickly and inexpensively, could offer valuable support in
the CO2 technology portfolio management process, and could reduce the uncertainty
surrounding the potential of novel capture technologies. It should be a top priority in
CO2 capture technology research, both for government and industry, to develop
additional analytical tools.
- 91 -

5.7 Chapter Conclusions
There are different types of R&D, ranging from pure basic research, which seeks to
answer fundamental questions about the nature of scientific phenomena, to pure applied
research, which seeks to exploit scientific phenomena to achieve practical ends.
Government and private industry have different purposes in performing R&D activities,
and should pursue a different mix of R&D types. Both, however, should actively
maintain a portfolio of technologies that are “in the pipeline,” and should use portfolio
management tools to aid in the process of making technology decisions. There are a
number of portfolio management tools available, each having their own strengths and
weaknesses. Improving the management tools and increasing the reach and capacity of
analytic tools is a major and worthwhile task in itself, and could lead to better decision-
making in the future and better use of limited R&D resources.
- 92 -
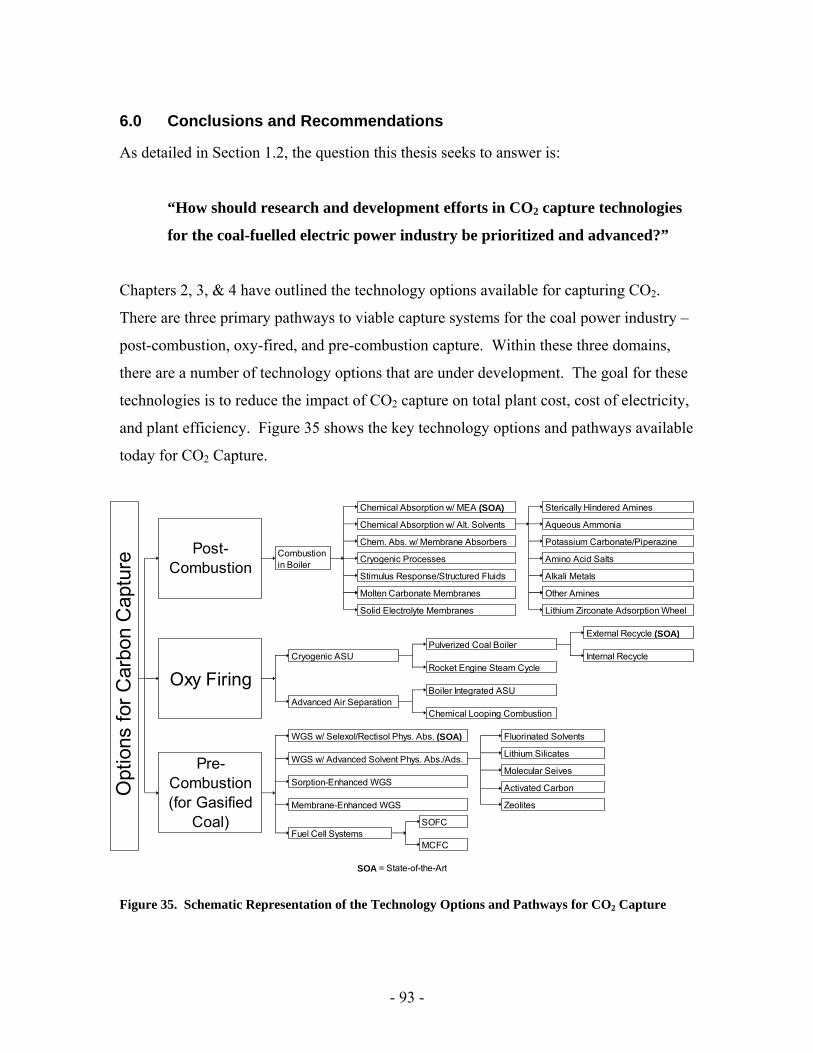
6.0 Conclusions and Recommendations
As detailed in Section 1.2, the question this thesis seeks to answer is:
“How should research and development efforts in CO2 capture technologies
for the coal-fuelled electric power industry be prioritized and advanced?”
Chapters 2, 3, & 4 have outlined the technology options available for capturing CO2.
There are three primary pathways to viable capture systems for the coal power industry –
post-combustion, oxy-fired, and pre-combustion capture. Within these three domains,
there are a number of technology options that are under development. The goal for these
technologies is to reduce the impact of CO2 capture on total plant cost, cost of electricity,
and plant efficiency. Figure 35 shows the key technology options and pathways available
today for CO2 Capture.
Opt
ions
for C
arbo
n C
aptu
re
Post-Combustion
Oxy Firing
Pre-Combustion (for Gasified
Coal)
Boiler Integrated ASU
Chemical Looping Combustion
Cryogenic ASU
External Recycle (SOA)Pulverized Coal Boiler
Rocket Engine Steam CycleInternal Recycle
Advanced Air Separation
Chemical Absorption w/ MEA (SOA)
Cryogenic Processes
Stimulus Response/Structured Fluids
Molten Carbonate Membranes
Fluorinated Solvents
Lithium Silicates
Molecular Seives
WGS w/ Selexol/Rectisol Phys. Abs. (SOA)
Sorption-Enhanced WGS
Combustion in Boiler
Chemical Absorption w/ Alt. Solvents
Chem. Abs. w/ Membrane Absorbers
Solid Electrolyte Membranes
Sterically Hindered Amines
Amino Acid Salts
Alkali Metals
Other Amines
Aqueous Ammonia
Potassium Carbonate/Piperazine
Lithium Zirconate Adsorption Wheel
WGS w/ Advanced Solvent Phys. Abs./Ads.
Membrane-Enhanced WGS
Fuel Cell Systems
Zeolites
Activated Carbon
SOFC
MCFC
SOA = State-of-the-Art
Figure 35. Schematic Representation of the Technology Options and Pathways for CO2 Capture
- 93 -
Chapter 5 has summarized the different types of research and development efforts and
their objectives, and has discussed the roles of different groups in pursuing these efforts.
A suite of decision-making tools for systematically managing technology development
projects were also examined.
Based on the assessment of technologies available for CO2 capture from coal-powered
plants, the following conclusions can be drawn:
• There are three primary pathways to capture available today – post-combustion
capture from flue gases, oxy-fired combustion, and pre-combustion capture from
fuel.
• Within these pathways there are a number of technological options at various
stages of development for improving the process and reducing the cost of capture
• Given the tools available today, it is a major effort to assess the potential of the
technologies and to compare different technologies.
• There are no clear technology winners.
When taken with the conclusions from the investigation of research types, roles, and
management tools, a set of recommendations can be set out for prioritizing research
efforts in CO2 capture technologies:
• A portfolio of technologies should be pursued, including technologies from across
the three different pathways and at various stages of development.
• Government portfolios should focus primarily on early-stage technology concepts
and basic research.
- 94 -

• Government organizations should use TRLs and a variety of analytical tools to aid
in portfolio management.
• Industrial firms’ portfolios should focus primarily on late-stage technologies
which are being pushed to commercialization.
• Industrial firms should use gate models and a variety of analytical tools to aid in
portfolio management.
• A major near-term effort should be made to improve current and develop new
analytical tools, with the goal of improving the outcome of long-term decision-
making.
Hence, the answer to the overarching question outlined at the beginning of this section is:
“Because there are several pathways that include multiple technologies at
various stages of development, high levels of uncertainty surrounding the
technologies, and no clear winners, government and industry stakeholders
must pursue portfolios of technologies using appropriate portfolio
management tools and analytical tools, balancing risk and reward and long
term versus short term needs.”
We are at a crossroads in terms of moving CO2 capture technology forward. New builds
in the coal-fired power industry are expected over the next several years in the U.S., and
China is currently installing coal capacity at the rate of one large plant per week.
Decisions made today will have an impact on which CO2 capture options will be
available in the future. It is important that well-informed strategic policies are put in
place and that practical decisions are made today, in both the public and private sector, to
ensure that CO2 capture technology is sufficiently capable of meeting future needs for the
U.S. and other international interests. Government and industrial technology developers
- 95 -

must put forth a sustained effort to advance CO2 capture technologies, and it is hoped that
the insights provided in this thesis will contribute to that endeavour.
- 96 -

7.0 References
1. Adanez, J., Hurst, P., Lyngfelt, A., Kronberger, B., Morin, J.-X. (2004), “The Grace Project: Development of Oxygen Carrier Particles for Chemical-Looping Combustion. Design and Operation of a 10kW Chemical-Looping Combustor,” Presented at the 7th International Conference on Greenhouse Gas Technologies, Sept. 5-9, 2004, Vancouver, Canada.
2. Allam, R., Chiang, R., Hufton, J., Weist, E., White, V., Middleton, P. (2004),
“Power Generation with Reduced CO2 Emissions via the Sorption Enhanced Water Gas Shift Process,” Presented at the Third Annual Conference on Carbon Capture and Sequestration,” May 3-6, 2004, Alexandria, VA.
3. Allam, R., Chiang, R., Hufton, J., Weist, E., White, V., Middleton, P. (2005),
“Development of the Sorption Enhanced Water Gas Shift Process,” Carbon Dioxide Capture for Storage in Deep Geologic Formations – Results from the CO2 Capture Project, Elsevier, Ltd., Oxford, UK.
4. Bozzuto, C., Gupta, J.C., Guha, M., Johnson, H., Liljedahl, G., Marion, J., ya
Nsakala, N., Palkes, M., Plasysnki, S. (2001), “Engineering Feasibility of CO2 Capture on an Existing U.S. Coal-Fired Power Plant,” Presented at the First National Conference on Carbon Sequestration, May 15-17, 2001, Washington D.C.
5. Buhre, B.J.P., Elliot, L.K., Sheng, C.D., Gupta, R.P., Wall, T.F. (2005), “Oxy-
fuel Combustion Technology for Coal-fired Power Generation,” Progress in Energy and Combustion Science, 31, pp. 283-307.
6. Chao, L.P., Ishii, K. (2005), “Design Process Error-Proofing: Benchmarking
Gate and Phased Review Life-Cycle Models,” Presented at IDETC/CIE 2005, Long Beach, CA, USA, September 24-28, 2005.
7. Chiesa, P., Consonni, S., Napoletano, S., Romano, M. (2005), “Decarbonized
Electricity Production from Coal by Means of Oxygen Transport Membranes,” Presented at the Fourth Annual Conference on Carbon Capture and Sequestration,” May 2-5, 2005, Washington, D.C.
8. Chinn, D., Choi, G.N., Degen, B., Richen, P.L., Wen, H. (2005), “CO2 Removal
from Power Plant Flue Gas – Cost Efficient Design and Integration Study,” an excerpt from Carbon Dioxide Capture for Storage in Deep Geologic Formations, Vol 1., Elsevier Ltd, Oxford, UK.
9. Ciferno, J.P., DiPietro, P., Tarka, T. (2005), “An Economic Scoping Study for
CO2 Capture Using Aqueous Ammonia,” Prepared for U.S. Department of Energy, National Energy Technology Laboratory.
- 97 -

10. Clean Energy Systems, Inc. (2006), Clean Energy Systems, Inc. webpage “The Technology,” downloaded 03/09/2006 from http://www.cleanenergysystems.com/2005/technology.html.
11. Clodic, D., El Hitti, R., Younes, M., Bill, A., Casier, F. (2005), “CO2 Capture by
Anti-Sublimation Thermo-Economic Process Evaluation,” Presented at the 4th Annual Conference on Carbon Capture & Sequestration, May 2-5, 2005, Alexandria, VA, USA.
12. Coen. (2006), “BIF Boiler Regulations and Technology,” downloaded 4/12/2006
from http://www.coen.com/i_html/white_bif.html. 13. Coker, D., Figueroa, J., Green, D.A., Gupta, R.P., McMichael, W.J., Nelson, T.O.,
Portzer, J.W. (2005), “Dry Regenerable Carbonate Sorbents for Capture of Carbon Dioxide from Flue Gas,” Presented at the Fourth Annual Conference on Carbon Capture and Sequstration, May 2-5, 2005, Washington, D.C.
14. Cooper, R.G., Edgett, S.J., Kleinschmidt, E.J. (2001), Portfolio Management for
New Products (2nd Edition), Perseus Publishing Services, Cambridge, MA. 15. Cullinane, J.T., Oyenekan, B.A., Lu, J, Rochelle, G. T. (2002), “Carbon Dioxide
Capture by Absorption with Potassium Carbonate,” NETL funded project, University of Texas at Austin.
16. Deppe, G., Tam, S.S., Currier, R.P., Young, J.S., Anderson, G.K., Le, L., Spencer,
D.F. (2003), “Developments in the SIMTECHE Process – Separation of CO2 from Coal Syngas by Formation of Hydrates,” Presented at the Second Annual Conference on Carbon Capture and Sequestration, Alexandria, VA, May 5-8, 2003.
17. Deutch & Moniz. (2006), “The Future of Coal,” MIT Laboratory for Energy and
the Environment, Cambridge, MA. 18. Deutch, J.M., Lester, R.K. (2004), Making Technology Work: Applications in
Energy and the Environment, Cambridge University Press, Cambridge, UK. 19. Electric Power Research Institute. (2000), “Evaluation of Innovative Fossil Fuel
Power Plants with CO2 Removal,” An interim report published December 2000, Palo Alto, CA.
20. Eom, T.H., Lee, J.B., Oh, J.M., Ryu, C.K., Yi, C.K. (2005), “Development of Na
and K-Based Sorbents for CO2 Capture from Flue Gas,” Presented at the Fourth Annual Conference on Carbon Capture and Sequstration, May 2-5, 2005, Washington, D.C.
- 98 -

21. Feron, P.H.M., ten Asbroek, N. (2004), “New Solvents Based on Amino-Acid Salts for CO2 Capture from Flue Gases,” Presented at the 7th International Conference on Greenhouse Gas Technologies, Sept. 5-9, 2004, Vancouver, Canada.
22. Fisher, K.S., Beitler, C., Figueroa, J.D., Jassim, M., Rochelle, G., Rueter, C.
(2005), “Integrating MEA Regeneration with CO2 Compression to Reduce CO2 Capture Costs,” Presented at the Fourth Annual Conference on Carbon Capture and Sequstration, May 2-5, 2005, Washington, D.C.
23. FLUOR (2004), “Potential for Improvement in Power Generation with Post-
Combustion Capture of Carbon Dioxide,” Interim Final Report prepared for IEA GHG R&D Programme, Report No. August 2004-08-10.
24. FLUOR. (2004), “Improvement in Power Generation with Post-Combustion
Capture of CO2,” IEA Greenhouse Gas R&D Programme, Report No. PH4/33. 25. Gibbins, J., Roberts, C.A., Panesar, R., Kelsall, G. (2004), “Potential for
Improvement in Power Generation with Post-Combustion Capture of CO2,” Interim report, IEA GHG R&D Programme.
26. Granite, E.J., & O’Brien, T. (2005), “Review of Novel Methods for Carbon
Dioxide Separation from Flue and Fuel Gases,” Fuel Processing Technology, No. 86, pp. 1423-1434.
27. Haines, M.R., Skinner, G.F., Maunder, A.D. (2005), “Rapid Assessment of Novel
CO2 Capturing Power Plants,” Presented at the 7th International Conference on Greenhouse Gas Technologies, Sept. 5-9, 2004, Vancouver, Canada.
28. Heintz, Y., Lemoine, R.O., Sehabiague, L., Morsi, B.I., Jones, K.L. Pennline,
H.W. (2005), “CO2 Capture Under Elevated Pressures and Temperatures Using Fluorinated Solvents,” Presented at the AICHE 2005 Annual Meeting, Cincinnati, OH, Oct. 30- Nov. 4, 2005.
29. Herzog, H., & Golomb, D. (2004), “Carbon Capture and Storage from Fossil Fuel
Use,” Encyclopedia of Energy, Elsevier, Article No. NRGY: 00422. 30. Herzog, H., Golomb, D., Zemba., S. (1991), “Feasibility, Modeling and
Economics of Sequestering Power Plant CO2 Emissions in the Deep Ocean,” Environmental Progress, Vol. 10, No. 1.
31. Herzog, H.J. (2002), “Carbon Sequestration: Analysis of Research Activities,” A
report to the Electric Power Research Institute, Palo Alto, CA. 32. Higman, C., van der Burgt, M. (2003), “Gasification,” Elsevier Science,
Burlington, MA, USA.
- 99 -

33. Hoff, K.A., Juliussen, O., Ma’mun, S., Svendsen, H.F. (2004), “Selection of New
Absorbents for Carbon Dioxide Capture,” Presented at the 7th International Conference on Greenhouse Gas Technologies, Sept. 5-9, 2004, Vancouver, Canada.
34. Holt, N. (2001), “Integrated Gasification Combined Cycle Power Plants,”
Encyclopedia of Physical Science and Technology, Sept. 2001. 35. Hutson, N., Attwood, B., Reynolds, S., Gadre, S., Ebner, A., Ritter, J. (2004),
“Separation and Capture of CO2 Using a High Temperature Pressure Swing Adsorption System,” Presented at the Third Annual Conference on Carbon Capture and Sequestration,” May 3-6, 2004, Alexandria, VA.
36. Iijima, M., Ishida, K., Kamijo, T., Mimura, T., Yagi, Y., Yonekawa, T.,
Yoshiyama, R. (2004), “Improvements of Carbon Dioxide Capture Technology from Flue Gas,” Presented at the 7th International Conference on Greenhouse Gas Technologies, Sept. 5-9, 2004, Vancouver, Canada.
37. Ing, Häge, H.C. (2006), “Balancing the Triangle of Economy, Security, and
Environment in an Open European Energy Market,” Presented at Energy Paths – Horizon 2050, Vienna, Austria, March 16th, 2006.
38. Integrated Environmental Control Model. (2005), Developed by Carnegie Mellon
University for the U.S. DOE, National Energy Technology Laboratory. Publicly available at http://www.iecm-online.com/index.htm.
39. Itou, K., Tani, H., Ono, Y., Kasai, H., Ota, K. (2002), “High Efficiency CO2
Separation and Concentration System by Using Molten Carbonate,” Presented at the 6th International Conference on Greenhouse Gas Technologies, Oct. 1-4, 2002, Kyoto, Japan.
40. Jordal, K., Anheden, M., Yan, J., Stromberg, L. (2005), “Oxyfuel Combustion for
Coal-Fired Power Generation with CO2 Capture – Opportunities and Challenges,” Presented at the 7th International Conference on Greenhouse Gas Technologies, Sept. 5-9, 2004, Vancouver, Canada.
41. Judkins, R.R. & Burchell, T.D. (2001), “CO2 Removal From Gas Streams Using
a Carbon Fiber Composite Molecular Sieve,” Presented at the First National Conference on Carbon Sequestration, Washington, DC, May 14-17 2001.
42. Kobayashi, H., Deneys, A.C., Riley, M.F. (2001), “Praxair’s Dilute Oxygen
Combustion Technology for Pyrometallurgical Applications,” JOM : The Journal of the Minerals, Metals & Materials Society. Vol 53, Issue 5, pp. 21-24.
- 100 -

43. Li, W., Turk, B.S., Gangwal, S.K., Nelson, T.O., Gupta, R.P. (2005), “Novel Lithium Silicate-based Sorbents for High Temperature Carbon Dioxide Removal,” Presented at the Fourth Annual Conference on Carbon Capture and Sequestration,” May 2-5, 2005, Washington, D.C.
44. Lokurlu, A., Bakke, K., Blum, L., Heidug, W., Li, K-J., Riensche, E. (2004),
“CO2 Sequestration from Solid Oxide Fuel Cells: Technical Options and Costs,” Presented at the 7th International Conference on Greenhouse Gas Technologies, Sept. 5-9, 2004, Vancouver, Canada.
45. Lowe, C., Mundschau, M., Xie, X. (2004), “Hydrogen Membrane Selection for a
Water Gas Shift Reactor, Phase II,” Presented at the Third Annual Conference on Carbon Capture and Sequestration,” May 3-6, 2004, Alexandria, VA.
46. Mancuso, L., Farina, G.L., Domenichini, R. (2005), “CO2 Capture in Low-Rank
Coal Power Plants,” Draft Report, IEA Greenhouse Gas R&D Programme, July 2005.
47. Mankins, J.C. (1995), “Technology Readiness Levels: A White Paper,” NASA,
Office of Space Access and Technology, Advanced Concepts Office. 48. Melien, T. (2005), “Economic and Cost Analysis for CO2 Capture Costs in the
CO2 Capture Project Scenarios,” Carbon Dioxide Capture for Storage in Deep Geologic Formations – Results from the CO2 Capture Project, Elsevier, Ltd., Oxford, UK.
49. Meystel, A., Albus, J., Messina, E., Leedom, D. (2003), “Performance Measures
for Intelligent Systems: Measures of Technology Readiness,” A white paper presented at the Performance Metrics for Intelligent Systems Workshop, Gaithersburg, MD, Sept. 16-18, 2003.
50. PES Network, Inc. (2006), “Solid Oxide Fuel Cells,” downloaded 4/13/2006
from http://www.freeenergynews.com/Directory/FuelCell/SolidOxide/. 51. Phillips, J. (2005), “Integrated Gasification Combined Cycles with CO2 Capture,”
Electric Power Research Institute presentation. 52. Resnik, K.P., Yeh, J.T., Pennline, H.W. (2004), “Aqua Ammonia process for
Simultaneous Removal of CO2, SO2, and NOx,” International Journal of Environmental Technology and Management, Vol. 4, Nos. 1/2.
53. Roberts, et al.. (2005), “Potential for Improvement in Power Generation with
Post-Combustion Capture of CO2,” Presented at The International Conference on Greenhouse Gas Control Technologies, Vancouver, Canada, 5-9 September, 2005.
- 101 -

54. Rochelle, Gary. (2005), Gary Rochelle of University of Texas (Austin) personal communication with Howard Herzog of MIT Laboratory for Energy and the Environment, March 7, 2005.
55. Ryden, M., Lyngfelt, A. (2004), “Hydrogen and Power Production with
Integrated Carbon Dioxide Capture by Chemical-Looping Reforming,” Presented at the 7th International Conference on Greenhouse Gas Technologies, Sept. 5-9, 2004, Vancouver, Canada.
56. Simmonds, M., Miracca, I., Gerdes, K. (2005), “Oxyfuel Technologies for CO2
Capture: A Techno-Economic Overview,” Presented at the 7th International Conference on Greenhouse Gas Technologies, Sept. 5-9, 2004, Vancouver, Canada.
57. Sirman, J., Simmonds, M., Switzer, L., Thompson, D. (2004), “Oxygen Transport
Membranes – An Enabling Technology for Cost Effective CO2 Capture,” Presented at the Third Annual Conference on Carbon Capture and Sequestration,” May 4, 2004, Washington, D.C.
58. Smith, J.D. (2005), “An Alternative to Technology Readiness Levels for Non-
Developmental Item Software,” Carnegie Mellon Software Engineering Institute, presented at the 38th Hawaii International Conference on System Sciences, Jan. 3-6, 2005.
59. Steinberg, M., Cooper, J.F., Cherepy, N. (2002), “High Efficiency Carbon and
Hydrogen Fuel Cells for CO2 Mitigated Power,” Presented at the 6th International Conference on Greenhouse Gas Technologies, Oct. 1-4, 2002, Kyoto, Japan.
60. The Babcock and Wilcox Company (2006), “Demonstration of the Oxy-
combustion Process for CO2 Control at the City of Hamilton,” Presented at the Americal Coal Council 2006 Mercury & Multi-Emissions Conference, March 16, 2006.
61. U.S. Department of Defense, Fuel Cell Projects. (2006), “Fuel Cell Information
Guide,” Downloaded April 14th, 2006 from http://dodfuelcell.cecer.army.mil/molten.html.
62. U.S. Department of Energy, National Energy Technology Laboratory.
(2002),“Advanced Fossil Power Systems Comparison Study,” Morgantown, WV. 63. U.S. Department of Energy, Office of Energy Research. (1993), “A Research
Needs Assessment for the Capture, Utilization and Disposal of Carbon Dioxide from Fossil Fuel-Fired Power Plants,” Vol II, July 1993.
64. U.S. Department of Energy. (2006), “Molten Carbonate Fuel Cell Technology,”
Downloaded April 14, 2006 from
- 102 -

http://www.fossil.energy.gov/programs/powersystems/fuelcells/fuelcells_moltencarb.html.
65. U.S. DOE, National Energy Technology Laboratory. (2001), “The Integrated
Environmental Control Model,” A Project Fact Sheet, available at http://www.netl.doe.gov/technologies/publications/factsheets/project/proj147.pdf
66. U.S. GAO (1999), “Better Management of Technology Development can
Improve Weapon System Outcomes,” A Report to the Chairman and Ranking Minority Member, Subcommittee on Readiness and Management Support, Committee on Armed Services, U.S. Senate, Washington D.C., July 30, 1999.
67. Williams, A., Pourkashanian, M., Jones, J.M., Skorupska, N. (2000), Combustion
and Gasification of Coal, Taylor & Francis, New York, NY.
- 103 -