carbon capture and storage, geomechanics and … · full length article carbon capture and storage,...
TRANSCRIPT

Verdon, J. P., & Stork, A. L. (2016). Carbon capture and storage,geomechanics and induced seismic activity. Journal of Rock Mechanics andGeotechnical Engineering, 8(6), 928–935. DOI: 10.1016/j.jrmge.2016.06.004
Publisher's PDF, also known as Version of record
License (if available):CC BY-NC-ND
Link to published version (if available):10.1016/j.jrmge.2016.06.004
Link to publication record in Explore Bristol ResearchPDF-document
This is the final published version of the article (version of record). It first appeared online via Elsevier athttp://www.sciencedirect.com/science/article/pii/S1674775516301196. Please refer to any applicable terms ofuse of the publisher.
University of Bristol - Explore Bristol ResearchGeneral rights
This document is made available in accordance with publisher policies. Please cite only the publishedversion using the reference above. Full terms of use are available:http://www.bristol.ac.uk/pure/about/ebr-terms
lable at ScienceDirect
Journal of Rock Mechanics and Geotechnical Engineering 8 (2016) 928e935
Contents lists avai
Journal of Rock Mechanics andGeotechnical Engineering
journal homepage: www.rockgeotech.org
Full Length Article
Carbon capture and storage, geomechanics and induced seismicactivity
James P. Verdon*, Anna L. StorkSchool of Earth Sciences, University of Bristol, Wills Memorial Building, Queen’s Road, Bristol, BS8 1RJ, UK
a r t i c l e i n f o
Article history:Received 31 March 2016Received in revised form13 June 2016Accepted 16 June 2016Available online 8 September 2016
Keywords:Carbon capture and storage (CCS)Induced seismicityGeomechanics
* Corresponding author.E-mail address: [email protected] (J.P. VPeer review under responsibility of Institute of R
nese Academy of Sciences.
http://dx.doi.org/10.1016/j.jrmge.2016.06.0041674-7755 � 2016 Institute of Rock and Soil MechanicNC-ND license (http://creativecommons.org/licenses/
a b s t r a c t
Injection of large volumes of carbon dioxide (CO2) for the purposes of greenhouse-gas emissionsreduction has the potential to induce earthquakes. Operators of proposed projects must therefore takesteps to reduce the risks posed by this induced seismicity. In this paper, we examine the causes ofinjection-induced seismicity (IIS), and how it should be monitored and modelled, and thereby mitigated.Many IIS case studies are found where fluids are injected into layers that are in close proximity tocrystalline basement rocks. We investigate this issue further by comparing injection and seismicity intwo areas where oilfield wastewater is injected in significant volumes: Oklahoma, where fluids areinjected into a basal layer, and Saskatchewan, where fluids are injected into a much shallower layer. Wesuggest that the different induced seismicity responses in these two areas are at least in part due to thesedifferent injection depths. We go on to outline two different approaches for modelling IIS: a statisticsbased approach and a physical, numerical modelling based approach. Both modelling types have ad-vantages and disadvantages, but share a need to be calibrated with good quality seismic monitoring dataif they are to be used with any degree of reliability. We therefore encourage the use of seismic monitoringnetworks at all future carbon capture and storage (CCS) sites.� 2016 Institute of Rock and Soil Mechanics, Chinese Academy of Sciences. Production and hosting byElsevier B.V. This is an open access article under the CC BY-NC-ND license (http://creativecommons.org/
licenses/by-nc-nd/4.0/).
1. Introduction
Carbon dioxide (CO2), produced from the burning of fossil fuelsin thermal power stations and other large industrial facilities, canbe captured and removed from a plant’s exhaust gases. Thecaptured CO2 can then be transported to a sedimentary basin, andinjected into a suitable geologic formation, where it is permanentlytrapped. This carbon capture and storage (CCS) technology has thepotential to substantially reduce the greenhouse-gas emissionsfrom fossil fuel usage.
By allowing continued fossil fuel usewhilemitigating emissions,CCS is vital in reducing the costs of decarbonisation. The Interna-tional Energy Agency (Levina et al., 2013) has estimated that, if CCSis not used in the electricity generation sector, the capital invest-ment needed to meet the same emissions constraints is increasedby 40%. Moreover, CCS is often the only technology capable of
erdon).ock and Soil Mechanics, Chi-
s, Chinese Academy of Sciences. Prby-nc-nd/4.0/).
mitigating emissions from other CO2-intensive sources such as thecement, steel and refining industries.
Broadly speaking, research on CCS is divided between “capture”and “storage”. The capture side focuses on how CO2 is capturedfrom the exhaust stream of a power plant (or cement factory, oilrefinery, etc.): from a financial perspective, this is the costliest partof the CCS process (e.g. Nauclér et al., 2008). The storage side fo-cuses on how CO2 can be injected and stored in sedimentary for-mations. It is in understanding how the CO2 will interact with thesubsurface, and in ensuring that the injected CO2 cannot return tothe surface, that the most significant uncertainties associated withCCS are found.
Most early research on CO2 storage was primarily concernedwith the possibility that the buoyant CO2 would move through thecaprock, and eventually leak at the surface. While the fact thatsubsurface injection could trigger seismicity has been known fordecades (e.g. Raleigh et al., 1976), the risks of CCS-induced seis-micity were generally downplayed in early CCS papers (e.g. Damenet al., 2006). This was probably because induced seismicity inwideroilfield operations was relatively uncommon.
However, in recent years, a substantial increase in injectedwastewater volumes in the mid-continental USA has been linked
oduction and hosting by Elsevier B.V. This is an open access article under the CC BY-

Fig. 1. Histograms showing event depths at various IIS case studies relative to thedeepest injection depth. Modified from Verdon (2014). The red lines mark the injectionintervals at each site, and the green lines mark the approximate position of the crys-talline basement. The case studies considered are: RMA ¼ Rocky Mountain Arsenal(Healy et al., 1968); PER ¼ Perry, Ohio (Nicholson et al., 1988); ASH ¼ Ashtabula, Ohio(Seeber et al., 2004); TRI ¼ Trinidad, Colorado (Meremonte et al., 2002); GUY ¼ Guy,Arkansas (Horton, 2012); YOU ¼ Youngstown, Ohio (Kim, 2013); PRA ¼ Prague,Oklahoma (Keranen et al., 2013); and TIM ¼ Timpson, Texas (Frohlich et al., 2014).
J.P. Verdon, A.L. Stork / Journal of Rock Mechanics and Geotechnical Engineering 8 (2016) 928e935 929
to a dramatic increase in the number of recorded earthquakes (e.g.Ellsworth, 2013), and similar observations have been made insome Canadian basins (e.g. BC Oil and Gas Commission, 2014), andduring wastewater disposal in Chinese gas fields (Lei et al., 2008,2013). Seismic activity also appears to have been triggered bynatural gas injection for storage purposes (e.g. Cesca et al., 2014).Given that the proposed injection volumes for commercial-scaleCCS sites significantly exceeds the volumes injected at many ofthese case examples (e.g. Verdon, 2014), the risk of injection-induced seismicity (IIS) at CCS sites is being re-appraised (e.g.Zoback and Gorelick, 2012, 2015; Verdon et al., 2013; Verdon,2014).
At present, there are still very few active commercial-scale(w1 Mt/year or more of CO2 injected) CCS projects. Given thatthe geomechanical effects of subsurface injection are generallyassumed to be scale-dependent (e.g. Verdon et al., 2013), the lack ofcommercial-scale projects means that there are as yet few oppor-tunities to study the geomechanical impacts of large-scale CO2 in-jection directly. Instead, the nascent CCS industry should look tolearn from other similar industries. Most notably, there are manysimilarities between CCS and wastewater disposal (e.g. Verdon,2014), and we believe that the CCS industry should examine pastcases of wastewater disposal-induced seismicity in order to learnlessons that can be applied to future CCS projects.
In this paper, we begin by reviewing case examples wherewastewater disposal has triggered seismicity, with the particularaim of establishing the mechanisms for induced seismicity, andthe factors that might make an area prone to (or not prone to)induced seismicity. Of particular interest is the link between in-jection and basement rocks. We go to consider how seismicity canbe modelled: we outline two different modelling approaches, onestatistical and one numerical, that can be used to estimate thelikely largest event size that might be triggered by an injectionproject. We have applied these models to the induced seismicityrecorded at the In Salah CCS project, Algeria. Finally, we makerecommendations for the monitoring of induced seismicity atfuture CCS sites.
2. Case examples of injection-induced seismicity
2.1. Mechanisms for injection-induced seismicity
The first well-recorded example of seismic activity induced byinjection occurred at the Rocky Mountain Arsenal, Denver (Healyet al., 1968). The link between injection and seismicity wasconclusively demonstrated in the Rangely oilfield, Colorado(Raleigh et al., 1976), where variations in injection rates and pres-sures produced variations in seismicity.
It is generally accepted that injection-induced seismicity occurson pre-existing faults. A fault can slide if the shear stress on thefault, s, exceeds the MohreCoulomb failure envelope:
s > mðsn � PÞ þ sO (1)
where m is the coefficient of friction, sn is the normal stress actingon the fault, P is the pore pressure within the fault, and sO is thecohesive strength of the fault surface. Subsurface injection canthereby lead to seismicity if it leads to either shear stress increases,normal stress decreases, or pore pressure increases, on a fault. Thiscan happen in a number of ways:
� When fluids are injected, pore pressures will inevitably increaseto accommodate the additional volumes in the subsurface. Thispore pressure increase is the most direct way that injection canlead to seismicity.
� Injection may also cause an expansion of the reservoir, whichwill alter the stress field in the rocks surrounding the reservoir,potentially leading to fault slip outside the reservoir.
� Once faults begin to slip, the displacement along a fault willcreate further stress changes capable of triggering events (e.g.King et al., 1994).
Several of these mechanisms may act together during asequence of induced events. For example, Sumy et al. (2014) studiedthe seismicity triggered by wastewater disposal near to Prague,Oklahoma, finding that the initial events were likely to have beencaused by pore pressure increases in the reservoir, but those sub-sequent events were triggered by static stress transfer generated byslip along the re-activated fault. It is often challenging to determineprecisely the causative mechanism for a series of triggered events(e.g. Cesca et al., 2014).
2.2. Induced seismicity in sediments and basement rocks
Verdon (2014) examined a selection of IIS case studies (allinduced by wastewater disposal), and found that seismicity tendsto occur at depths below the injection interval, and indeed in manycases, most of the events are observed in the crystalline basementthat underlies the sedimentary basin (Fig. 1). Vilarrasa and Carrera(2015) suggested that this is because deviatoric stresses tend to behigher in basement rocks compared to the overlying sediments.Vilarrasa and Carrera (2015) went on to conclude that IIS duringCO2 injection was therefore unlikely.
The relationship between injection into near-basement rocksand IIS merits further consideration. In many IIS case examples,fluids are injected into sedimentary layers that are in close prox-imity to the crystalline basement. For example, in Oklahoma, wherea significant increase in IIS has been observed, much of the injec-tion is into the basal Arbuckle Formation, which directly overliesthe pre-Cambrian basement. Similarly, injection into the basal MtSimon Formation in Ohio and Illinois has led to cases of IIS (e.g.Nicholson et al., 1988; Seeber et al., 2004), including at the DecaturCO2 injection pilot project (Kaven et al., 2015).
Verdon et al. (2016) compared induced seismicity in two areasthat have seen extensive hydrocarbon-extraction-related activityover many decades: Oklahoma, and southeast Saskatchewan. In

J.P. Verdon, A.L. Stork / Journal of Rock Mechanics and Geotechnical Engineering 8 (2016) 928e935930
both areas, conventional fields have been active for a long time,there are high-volume wastewater disposal wells present, andhydraulic fracturing is used to extract unconventional resources. InFig. 2, we compare the numbers of high-volume injection wells inboth regions (normalised by the respective study areas) and wenote that the number of wells and their maximum monthly injec-tion rates are similar. However, while injection well volumes aresimilar, Oklahoma has seen a substantial increase in seismicity,related primarily to high-volume disposal wells, while almost nooilfield-related seismicity has been detected in Saskatchewan.
One potential reason for the difference in IIS between the twoareas is that stress conditions in Saskatchewan are such that faultsare less likely to rupture. However, a substantial number of earth-quakes have been identified in southeast Saskatchewan that areassociated with potash mining. Stress conditions in the area mustbe such that seismicity can be induced given the appropriateforcing.
One key difference between these two areas is the differentgeological units used for wastewater disposal. As stated above,most of the wastewater disposal in Oklahoma is into the ArbuckleFormation, which is a basal formation that directly overlies, andtherefore is likely to be hydraulically connected to, the crystallinebasement. This means that pore pressure increases in this layer canbe easily communicated into the underlying basement rocks.
In contrast, in southeast Saskatchewan, the only sedimentaryformations that experience a net volume increase are Cretaceousformations, and there is significant separation (usually several kil-ometres) between these units and the pre-Cambrian crystallinebasement. Verdon et al. (2016) surmised that this difference ininjection strategy e targeting shallower aquifers rather than basalformations e may account for the very different IIS responses be-tween the two regions.
With respect to CO2 leakage, deeper formations have generallythought to be a better option, because there is more stratigraphythroughwhich CO2 would have to leak before it reaches the surface.However, on this understanding, with respect to IIS, deeper for-mations may in fact pose a higher risk if they are hydraulicallyconnected to the crystalline basement.
Fig. 2. Number of wells as a function of their highest monthly injection volume forsoutheast Saskatchewan (Verdon et al., 2016) and Oklahoma, normalised by therespective study areas. Overall, Saskatchewan has more injection wells, but thenumber of high-volume wells per unit area is similar.
However, our assessment does not conclude that, so long asbasal sedimentary layers are avoided, then IIS can be completelymitigated, as suggested by Vilarrasa and Carrera (2015). Evidently,there are cases where injection into shallower layers, that havesignificant separation from the basement, has produced IIS,including at Trinidad, Colorado (Meremonte et al., 2002), Timpson,Texas (Frohlich et al., 2014), and at the In Salah CCS demonstrationproject (Stork et al., 2015). In Chinese gas fields, seismicity has beenobserved both in basement rocks (Lei et al., 2008) at some sites, butalso contained entirely within overlying sedimentary formations(Lei et al., 2013) at others. Clearly, sedimentary formations arecapable of supporting sufficient deviatoric stresses on faults suchthat IIS can be generated without a direct hydraulic connection tothe crystalline basement (e.g. Zoback and Gorelick, 2015).
3. Modelling seismicity
If the risks of IIS are to be mitigated, then we must developmodels capable of simulating IIS at proposed sites. This will allowoperators to identify sites at which IIS might become an issue, andto moderate the CO2 injection programme such that the risk isreduced. Broadly speaking, models for IIS fall into two types: sta-tistical models, which use recorded events during the early stagesof operation to forecast what will occur as injection continues; andphysical models, which numerically simulate the processes occur-ring in a reservoir. In the following sections, we demonstrate eachtype of model, as applied to the In Salah CCS project, Algeria, anddiscuss the strengths and weaknesses of each model type.
3.1. CO2 injection and seismicity at the In Salah CCS project
Between 2004 and 2011, over 3.8 million tonnes of CO2 wereinjected via three injection wells into the water leg of a natural gasreservoir at In Salah, Algeria. The CO2 had been stripped from theproducing wells of several nearby gas fields. The CO2 storageoperation is summarised in Fig. 3. The reservoir consisted of a 20 mthick Carboniferous sandstone, overlain by approximately 950 m ofmudstone rocks that acted as a caprock. The reservoir had relativelylow porosity (13%e20%) and permeability (averaging 10 mD),meaning that injection led to substantial pore pressure increases,which in turn produced significant amounts of geomechanicaldeformation. This deformation was first identified using InSARmethods (Onuma and Ohkawa, 2009).
In 2009, a monitoring network was installed near to one of thethree injection wells (KB-502, labelled in Fig. 3). A string of geo-phones was installed in a shallow borehole at the depth of 80e500 m. However, technical issues with the deployment meant thatfully-useable data were available only from the uppermost in-strument. Nevertheless, Stork et al. (2015) identified P- and S-wave picks for over 6000 events between August 2009 and June2011. Stork et al. (2015) computed moment magnitudes for theseevents, finding that the largest event had a magnitude of 1.7. Moredetails regarding the event positions, occurrence rates and fre-quencyemagnitude distributions of the observed events areavailable in Stork et al. (2015) and Verdon et al. (2015). It is theseobserved events, and especially their largest magnitudes, that wefocus on modelling here, using both statistical and numericalmethods.
3.2. Statistical model
McGarr (2014) identified that the cumulative seismic momentreleased during injection, SMO, could be scaled with the injectionvolume, DV:

Date (MM-YY)
Fig. 4. Using a statistical method to forecast MMAX during CO2 injection at In Salah. Inthe lower panel, b values (dashed line) and seismic efficiency (solid line) are contin-ually updated during injection. In the upper panel, Eq. (4) is used to forecastMMAX (redline). Also plotted are the observed event magnitudes (black dots). The largestobserved event has a magnitude of 1.7. Based on the MMAX forecast from the earlyevents, an event of this size is expected.
Fig. 3. Schematic diagram summarising CCS operations at In Salah. Gas is producedfrom a sandstone reservoir at the centre of an anticline formation. CO2 is stripped fromthis gas stream and re-injected into the water leg of the same formation.
J.P. Verdon, A.L. Stork / Journal of Rock Mechanics and Geotechnical Engineering 8 (2016) 928e935 931
SMO ¼ GDV (2)
where G is the rock shear modulus. This relationship applies tosituations where almost all of the deformation induced by injectionis released seismically. However, in most cases, much or all of thedeformation may occur aseismically, meaning that the SMO fallswell below this value. Hallo et al. (2014) therefore suggested amodification to Eq. (2), introducing a “seismic efficiency” term SEFF:
SMO ¼ SEFFGDV (3)
If seismic activity is closelymonitored from the start of injection,then SEFF can be quickly and easily determined from the observedmoment release, and the known injection volume. Given that anoperator will have a planned total injection volume, then if it isassumed that SEFF does not change during injection, the totalseismic moment release during the life of the project can bedetermined from Eq. (3).
Given an expected cumulative moment, the magnitude of thelargest event, MMAX, is determined by the GutenbergeRichter bvalue. Much like SEFF, the b value can be easily determined if a site iswell-monitored. From the measured b value and SEFF, the expectedvalue for MMAX can be computed using the equations of Hallo et al.(2014):
SMO ¼ 109:110ab
1:5� b
h10MMAXð1:5�bÞ � 10MMINð1:5�bÞ
i(4)
where
a ¼ bMMAX � log10�10bd � 10�bd
�(5)
where MMIN is the completeness magnitude defined when calcu-lating the b value, and d is the probabilistic half-bin size definedaround MMAX as described by Hallo et al. (2014).
The results for In Salah are shown in Fig. 4. In the lower panel,we continually update b and SEFF based on the observed events. Inthe upper panel, we forecast MMAX based on these values and Eq.(4). The largest event to be recorded at In Salah had a magnitude of1.7 (Stork et al., 2015). We note that, based only on the smallerevents observed during the early stages of monitoring, we are ableto forecast the magnitude of this largest event.
3.3. Physical, numerical model
As an alternative to statistical methods, numerical models canbe used to simulate the physical processes occurring in a reservoir,including slip on pre-existing faults. We assume that all IISs occuron pre-existing faults and fractures. The basis of our modellingapproach, outlined in detail in Verdon et al. (2015), is that if weknow or can simulate the positions, orientations and sizes of frac-tures in the reservoir, and if we can simulate both the initial stressconditions at the start of injection, and the changes in stress duringinjection, then we can identify when and where fractures exceedthe MohreCoulomb failure envelope (Eq. (1)), generatingseismicity.
The simulated fracture network for In Salahwas generated usinga geo-structural model described by Bond et al. (2013). The faulted,folded reservoir was reconstructed from the original, flat-lyingsedimentary layers using a mass-spring solver. Doing so creates amap of strain intensity and orientation throughout the reservoir.Bond et al. (2013) used these strain maps to populate a modelledfracture network. Two fracture sets were generated, one associatedwith faulting, and the other associated with folding. In total, the
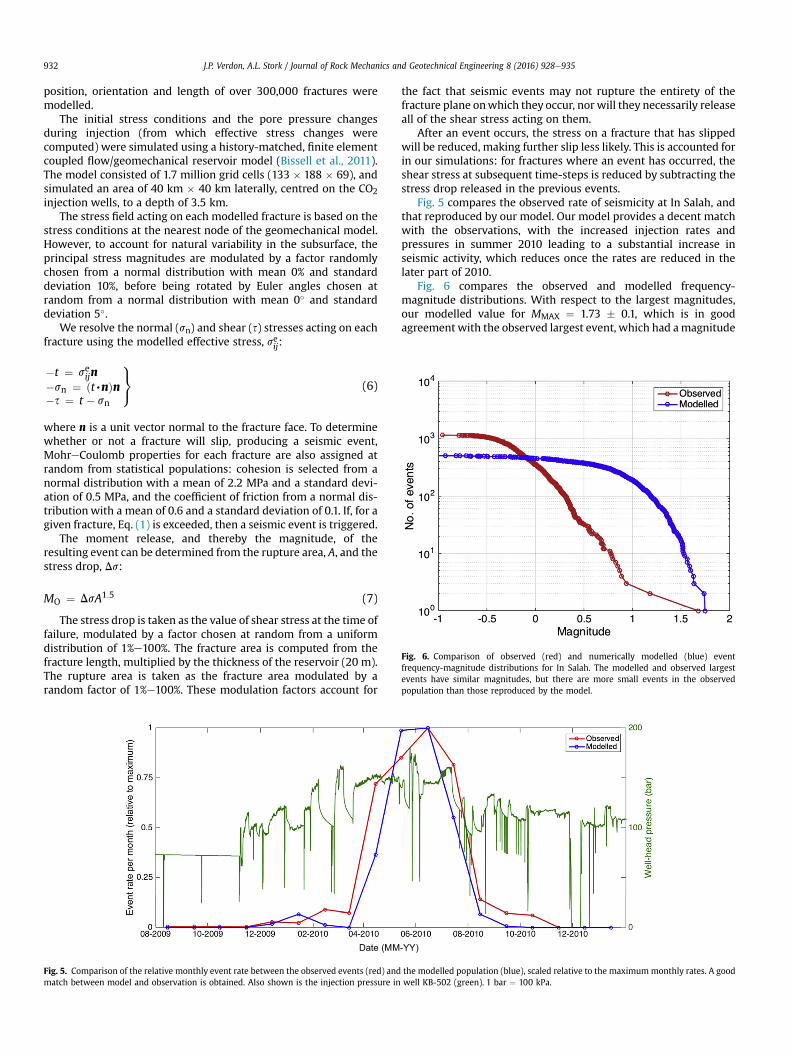
Fig. 6. Comparison of observed (red) and numerically modelled (blue) eventfrequency-magnitude distributions for In Salah. The modelled and observed largestevents have similar magnitudes, but there are more small events in the observedpopulation than those reproduced by the model.
J.P. Verdon, A.L. Stork / Journal of Rock Mechanics and Geotechnical Engineering 8 (2016) 928e935932
position, orientation and length of over 300,000 fractures weremodelled.
The initial stress conditions and the pore pressure changesduring injection (from which effective stress changes werecomputed) were simulated using a history-matched, finite elementcoupled flow/geomechanical reservoir model (Bissell et al., 2011).The model consisted of 1.7 million grid cells (133 � 188 � 69), andsimulated an area of 40 km � 40 km laterally, centred on the CO2injection wells, to a depth of 3.5 km.
The stress field acting on each modelled fracture is based on thestress conditions at the nearest node of the geomechanical model.However, to account for natural variability in the subsurface, theprincipal stress magnitudes are modulated by a factor randomlychosen from a normal distribution with mean 0% and standarddeviation 10%, before being rotated by Euler angles chosen atrandom from a normal distribution with mean 0� and standarddeviation 5�.
We resolve the normal (sn) and shear (s) stresses acting on eachfracture using the modelled effective stress, seij:
�t ¼ seijn�sn ¼ ðt,nÞn�s ¼ t � sn
9=; (6)
where n is a unit vector normal to the fracture face. To determinewhether or not a fracture will slip, producing a seismic event,MohreCoulomb properties for each fracture are also assigned atrandom from statistical populations: cohesion is selected from anormal distribution with a mean of 2.2 MPa and a standard devi-ation of 0.5 MPa, and the coefficient of friction from a normal dis-tributionwith a mean of 0.6 and a standard deviation of 0.1. If, for agiven fracture, Eq. (1) is exceeded, then a seismic event is triggered.
The moment release, and thereby the magnitude, of theresulting event can be determined from the rupture area, A, and thestress drop, Ds:
MO ¼ DsA1:5 (7)
The stress drop is taken as the value of shear stress at the time offailure, modulated by a factor chosen at random from a uniformdistribution of 1%e100%. The fracture area is computed from thefracture length, multiplied by the thickness of the reservoir (20 m).The rupture area is taken as the fracture area modulated by arandom factor of 1%e100%. These modulation factors account for
Date (MM
Fig. 5. Comparison of the relative monthly event rate between the observed events (red) andmatch between model and observation is obtained. Also shown is the injection pressure in
the fact that seismic events may not rupture the entirety of thefracture plane onwhich they occur, nor will they necessarily releaseall of the shear stress acting on them.
After an event occurs, the stress on a fracture that has slippedwill be reduced, making further slip less likely. This is accounted forin our simulations: for fractures where an event has occurred, theshear stress at subsequent time-steps is reduced by subtracting thestress drop released in the previous events.
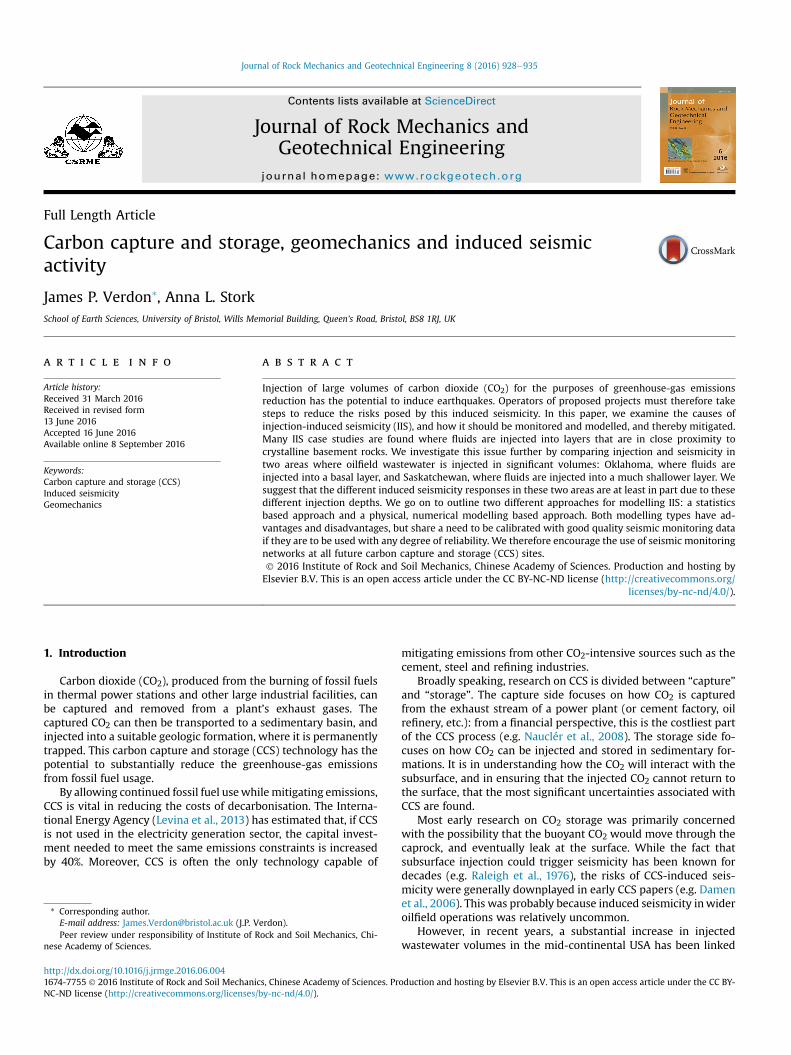
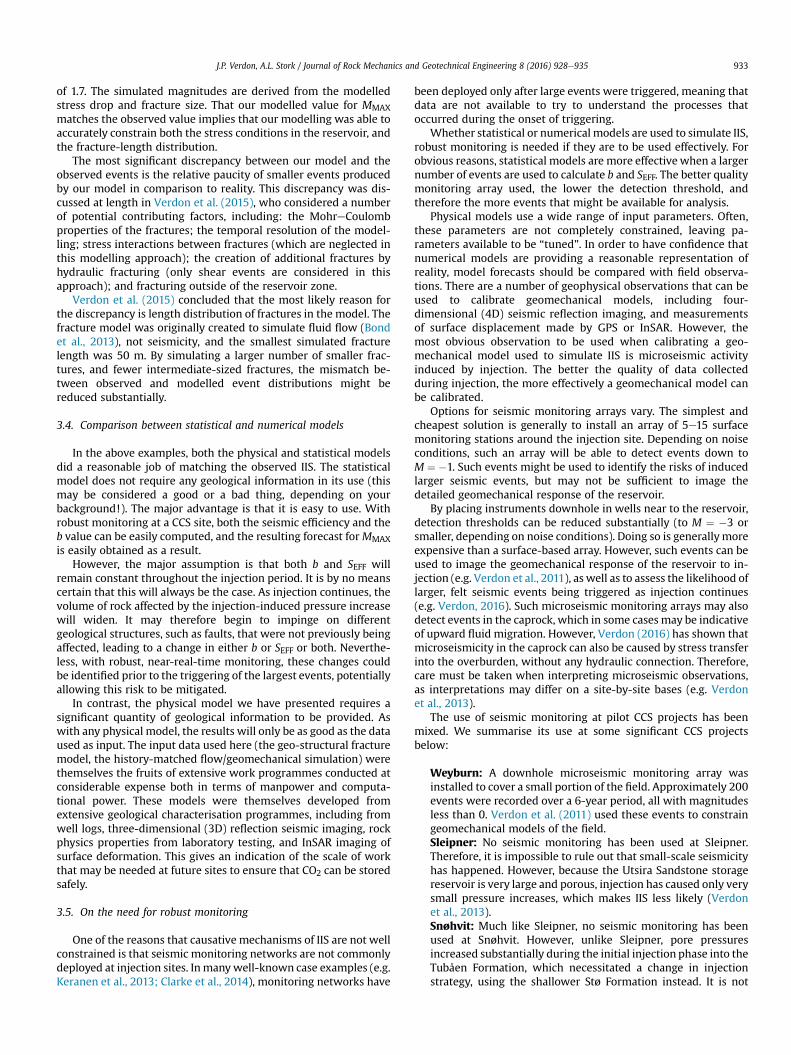
Fig. 5 compares the observed rate of seismicity at In Salah, andthat reproduced by our model. Our model provides a decent matchwith the observations, with the increased injection rates andpressures in summer 2010 leading to a substantial increase inseismic activity, which reduces once the rates are reduced in thelater part of 2010.
Fig. 6 compares the observed and modelled frequency-magnitude distributions. With respect to the largest magnitudes,our modelled value for MMAX ¼ 1.73 � 0.1, which is in goodagreement with the observed largest event, which had amagnitude
-YY)
the modelled population (blue), scaled relative to the maximummonthly rates. A goodwell KB-502 (green). 1 bar ¼ 100 kPa.
J.P. Verdon, A.L. Stork / Journal of Rock Mechanics and Geotechnical Engineering 8 (2016) 928e935 933
of 1.7. The simulated magnitudes are derived from the modelledstress drop and fracture size. That our modelled value for MMAXmatches the observed value implies that our modelling was able toaccurately constrain both the stress conditions in the reservoir, andthe fracture-length distribution.
The most significant discrepancy between our model and theobserved events is the relative paucity of smaller events producedby our model in comparison to reality. This discrepancy was dis-cussed at length in Verdon et al. (2015), who considered a numberof potential contributing factors, including: the MohreCoulombproperties of the fractures; the temporal resolution of the model-ling; stress interactions between fractures (which are neglected inthis modelling approach); the creation of additional fractures byhydraulic fracturing (only shear events are considered in thisapproach); and fracturing outside of the reservoir zone.
Verdon et al. (2015) concluded that the most likely reason forthe discrepancy is length distribution of fractures in the model. Thefracture model was originally created to simulate fluid flow (Bondet al., 2013), not seismicity, and the smallest simulated fracturelength was 50 m. By simulating a larger number of smaller frac-tures, and fewer intermediate-sized fractures, the mismatch be-tween observed and modelled event distributions might bereduced substantially.
3.4. Comparison between statistical and numerical models
In the above examples, both the physical and statistical modelsdid a reasonable job of matching the observed IIS. The statisticalmodel does not require any geological information in its use (thismay be considered a good or a bad thing, depending on yourbackground!). The major advantage is that it is easy to use. Withrobust monitoring at a CCS site, both the seismic efficiency and theb value can be easily computed, and the resulting forecast forMMAXis easily obtained as a result.
However, the major assumption is that both b and SEFF willremain constant throughout the injection period. It is by no meanscertain that this will always be the case. As injection continues, thevolume of rock affected by the injection-induced pressure increasewill widen. It may therefore begin to impinge on differentgeological structures, such as faults, that were not previously beingaffected, leading to a change in either b or SEFF or both. Neverthe-less, with robust, near-real-time monitoring, these changes couldbe identified prior to the triggering of the largest events, potentiallyallowing this risk to be mitigated.
In contrast, the physical model we have presented requires asignificant quantity of geological information to be provided. Aswith any physical model, the results will only be as good as the dataused as input. The input data used here (the geo-structural fracturemodel, the history-matched flow/geomechanical simulation) werethemselves the fruits of extensive work programmes conducted atconsiderable expense both in terms of manpower and computa-tional power. These models were themselves developed fromextensive geological characterisation programmes, including fromwell logs, three-dimensional (3D) reflection seismic imaging, rockphysics properties from laboratory testing, and InSAR imaging ofsurface deformation. This gives an indication of the scale of workthat may be needed at future sites to ensure that CO2 can be storedsafely.
3.5. On the need for robust monitoring
One of the reasons that causative mechanisms of IIS are not wellconstrained is that seismic monitoring networks are not commonlydeployed at injection sites. Inmanywell-known case examples (e.g.Keranen et al., 2013; Clarke et al., 2014), monitoring networks have
been deployed only after large events were triggered, meaning thatdata are not available to try to understand the processes thatoccurred during the onset of triggering.
Whether statistical or numerical models are used to simulate IIS,robust monitoring is needed if they are to be used effectively. Forobvious reasons, statistical models are more effective when a largernumber of events are used to calculate b and SEFF. The better qualitymonitoring array used, the lower the detection threshold, andtherefore the more events that might be available for analysis.
Physical models use a wide range of input parameters. Often,these parameters are not completely constrained, leaving pa-rameters available to be “tuned”. In order to have confidence thatnumerical models are providing a reasonable representation ofreality, model forecasts should be compared with field observa-tions. There are a number of geophysical observations that can beused to calibrate geomechanical models, including four-dimensional (4D) seismic reflection imaging, and measurementsof surface displacement made by GPS or InSAR. However, themost obvious observation to be used when calibrating a geo-mechanical model used to simulate IIS is microseismic activityinduced by injection. The better the quality of data collectedduring injection, the more effectively a geomechanical model canbe calibrated.
Options for seismic monitoring arrays vary. The simplest andcheapest solution is generally to install an array of 5e15 surfacemonitoring stations around the injection site. Depending on noiseconditions, such an array will be able to detect events down toM ¼ �1. Such events might be used to identify the risks of inducedlarger seismic events, but may not be sufficient to image thedetailed geomechanical response of the reservoir.
By placing instruments downhole in wells near to the reservoir,detection thresholds can be reduced substantially (to M ¼ �3 orsmaller, depending on noise conditions). Doing so is generallymoreexpensive than a surface-based array. However, such events can beused to image the geomechanical response of the reservoir to in-jection (e.g. Verdon et al., 2011), as well as to assess the likelihood oflarger, felt seismic events being triggered as injection continues(e.g. Verdon, 2016). Such microseismic monitoring arrays may alsodetect events in the caprock, which in some cases may be indicativeof upward fluid migration. However, Verdon (2016) has shown thatmicroseismicity in the caprock can also be caused by stress transferinto the overburden, without any hydraulic connection. Therefore,care must be taken when interpreting microseismic observations,as interpretations may differ on a site-by-site bases (e.g. Verdonet al., 2013).
The use of seismic monitoring at pilot CCS projects has beenmixed. We summarise its use at some significant CCS projectsbelow:
Weyburn: A downhole microseismic monitoring array wasinstalled to cover a small portion of the field. Approximately 200events were recorded over a 6-year period, all with magnitudesless than 0. Verdon et al. (2011) used these events to constraingeomechanical models of the field.Sleipner: No seismic monitoring has been used at Sleipner.Therefore, it is impossible to rule out that small-scale seismicityhas happened. However, because the Utsira Sandstone storagereservoir is very large and porous, injection has caused only verysmall pressure increases, which makes IIS less likely (Verdonet al., 2013).Snøhvit: Much like Sleipner, no seismic monitoring has beenused at Snøhvit. However, unlike Sleipner, pore pressuresincreased substantially during the initial injection phase into theTubåen Formation, which necessitated a change in injectionstrategy, using the shallower Stø Formation instead. It is not

J.P. Verdon, A.L. Stork / Journal of Rock Mechanics and Geotechnical Engineering 8 (2016) 928e935934
known whether the pore pressure increases in the TubåenFormation had any geomechanical impacts.In Salah: As discussed in previous sections, seismic monitoringwas installed at In Salah, but only after 5 years of injection hadtaken place, and significant geomechanical impacts had beenobserved by other methods. The monitoring array consisted of asingle geophone in a shallow borehole. Over 6000 events weredetected during the monitoring period, the largest of which hada magnitude of 1.7.Aquistore: A monitoring array of 65 geophones has beendeployed tomonitormicroseismicity at the Aquistore site. Thesegeophones are buried to depths of 5e20 m, and form part of alarger network that was deployed primarily for repeat seismicreflection surveys. No microseismic events have been detected,although only a small portion of the planned injection volumehas yet been stored.Cranfield: A seismic monitoring array was deployed consistingof six instruments buried in shallow boreholes 100 m deep. Noseismic events have been detected (Hovorka et al., 2013).Decatur: Two separate monitoring arrays were installed tomonitor the Illinois Basin-Decatur Project: a downhole micro-seismic monitoring array consisting of 34 multicomponentgeophones in two deep boreholes (Bauer et al., 2016), and asecondary array consisting of 13 broadband seismic instrumentsat the surface and 4 accelerometers deployed in 150 m-deepboreholes (Kaven et al., 2015). The downhole microseismic arraydetected a total of 4747 events during 3 years of CO2 injection,with an average magnitude of �0.9. The surface monitoringarray has detected 179 events, with magnitudes rangingfrom �1.1 to 1.3.Aneth: A downhole array of 60 geophones was deployed tomonitor CO2-EOR at the Aneth Field. Produced water from thefield was also being injected into an underlying aquifer. Noseismicity was detected associated with the CO2 injection, butthe underlying produced water disposal generated approxi-mately 1400 events over the course of 1 year, with the largestevent having a magnitude of 1.2 (Rutledge, 2010).Lacq-Rousse: A hybrid seismicmonitoring arraywas installed tomonitor CO2 storage at the Lacq-Rousse field, consisting of 1surface seismometer, 7 shallow arrays of 4 geophones eachburied to depths of approximately 200 m, and a deep downholearray of 3 accelerometers. This system detected over 2500reservoir-related microseismic events over 3 years of moni-toring, all of which had magnitudes less than 0 (Payre et al.,2014).
4. Conclusions
Injection of CO2 into subsurface reservoirs has the potential totrigger seismicity. Therefore, the risks posed by IIS must beconsidered at all future CCS sites. We can also learn much bystudying past incidents of IIS in other industries, such as the shalegas, wastewater disposal and hydraulic fracturing industries. Inmany such case studies, IIS has been associated with injection intolayers that have a potential hydraulic connection to the underlyingcrystalline basement.
Previously, such layers have been considered optimal targets forCCS, because their greater depth means a larger distance for CO2 tomigrate back to the surface in the event of leakage. However, ifnear-basement injection poses a greater seismic hazard, then suchconsiderations may have to be revised, and injection targets chosenthat do not have a hydraulic connection to the crystalline basement.However, it should be noted that avoiding near-basement layersalone is not a sufficient condition to avoid IIS.
The hazards posed by IIS can bemitigated by effective modellingand monitoring regimes. We have demonstrated two types ofmodelling approaches e statistical and numerical. The statisticalapproach uses the characteristics of smaller event populationsrecorded during the early stages of injection to make forecastsabout what will happen as injection volumes increase. The nu-merical approach involves building a geomechanical simulationthat models how injection will alter the stress conditions on pre-existing faults and fractures in the reservoir.
We have applied both models to the seismicity recorded duringCO2 injection at the In Salah CCS project. Both models were able tosuccessfully simulate the magnitude of the largest recorded event.Each modelling type has benefits and disadvantages. The statisticalmodel is relatively simple and easy to use, but requires as anassumption that both the amount of seismicity induced per unitvolume injected and the b value remain constant during injection,which may not be the case. The numerical model requires anextensive geological characterisation programme in order to pro-vide reliable input data, and is both labour- and computationally-intensive. However, regardless of the modelling method used,good quality monitoring is required to mitigate IIS at future CCSsites.
If CCS is to make a significant impact on global CO2 emissions, alarge number of commercial-scale CCS projects will be required.Comparisons with other industries suggest that IIS at some siteswill be inevitable (indeed, we have already seen low levels of IIS atmultiple pilot projects). However, the risk posed by IIS during CO2
injection must be weighted against the risks of allowing anthro-pogenic emissions to remain unmitigated, leading to increasedclimate change.
Conflict of interest
Wewish to confirm that there are no known conflicts of interestassociated with this publication and there has been no significantfinancial support for this work that could have influenced itsoutcome.
Acknowledgements
James Verdon’s Research Fellowship at the University of Bristolis supported by the British Geological Survey. We would like tothank the operators of the In Salah JV and JIP for providing the datafrom In Salah shown in this paper.
References
Bauer RA, Carney M, Finley RJ. Overview of microseismic response to CO2 injectioninto the Mt Simon saline reservoir at the Illinois Basin-Decatur project. Inter-national Journal of Greenhouse Gas Control 2016. http://dx.doi.org/10.1016/j.ijggc.2015.12.015 (in press).
Bissell RC, Vasco DW, Atbi M, Hamdani M, Okwelegbe M, Goldwater MH. A full fieldsimulation of the In Salah gas production and CO2 storage project using acoupled geomechanical and thermal fluid flow simulator. Energy Procedia2011;4:3290e7.
Bond CE, Wightman R, Ringrose PS. The influence of fracture anisotropy on CO2flow. Geophysical Research Letters 2013;40(7):1284e9.
BC Oil and Gas Commission. Investigation of observed seismicity in the Montneytrend. 2014.
Cesca S, Grigoli F, Heimann S, González Á, Buforn E, Maghsoudi S, Blanch E, Dahm T.The 2013 SeptembereOctober seismic sequence offshore Spain: a case ofseismicity triggered by gas injection? Geophysical Journal International2014;198(2):941e53.
Clarke H, Eisner L, Styles P, Turner P. Felt seismicity associated with shale gas hy-draulic fracturing: the first documented example in Europe. GeophysicalResearch Letters 2014;41(23):8308e14.
Damen K, Faaij A, Turkenburg W. Health, safety and environmental risks of un-derground CO2 storage e overview of mechanisms and current knowledge.Climatic Change 2006;74(1):289e318.

J.P. Verdon, A.L. Stork / Journal of Rock Mechanics and Geotechnical Engineering 8 (2016) 928e935 935
Ellsworth W. Injection-induced earthquakes. Science 2013;341(6142). http://dx.doi.org/10.1126/science.1225942.
Frohlich C, EllsworthW, BrownWA, BruntM, Luetgert J,MacDonald T,Walter S. The 17May 2012M4.8 earthquake near Timpson, East Texas: an event possibly triggeredby fluid injection. Journal of Geophysical Research 2014;119(1):581e93.
Hallo M, Oprsal I, Eisner L, Ali MY. Prediction of magnitude of the largest potentiallyinduced seismic event. Journal of Seismology 2014;18(3):421e31.
Healy JH, Rubey WW, Griggs DT, Raleigh CB. The Denver earthquakes. Science1968;161(3848):1301e10.
Horton S. Injection into subsurface aquifers triggers earthquake swarm in CentralArkansas with potential for damaging earthquake. Seismological ResearchLetters 2012;83(2):250e60.
Hovorka SD, Meckel TA, Treviño RH. Monitoring a large-volume injection at Cran-field, Mississippi e project design and recommendations. International Journalof Greenhouse Gas Control 2013;18:345e60.
Kaven JO, Hickman SH, McGarr AF, Ellsworth WL. Surface monitoring of micro-seismicity at the Decatur, Illinois, CO2 sequestration demonstration site. Seis-mological Research Letters 2015;86(4):1096e101.
Keranen KM, Savage H, Abers GA, Cochran ES. Potentially induced earthquakes inOklahoma, USA: links between wastewater injection and the 2011 MW 5.7earthquake sequence. Geology 2013;41(6):699e702.
Kim WY. Induced seismicity associated with fluid injection into a deep well inYoungstown, Ohio. Journal of Geophysical Research 2013;118(7):3506e18.
King GCP, Stein RS, Lin J. Static stress changes and the triggering of earthquakes.Bulletin of the Seismological Society of America 1994;84(3):935e53.
Lei X, Yu G, Ma S, Wen X, Wang Q. Earthquakes induced by water injection at w3km depth within the Rongchang gas field, Chongqing, China. Journal ofGeophysical Research 2008;113(B10). http://dx.doi.org/10.1029/2008JB005604.
Lei X, Ma S, ChenW, Pang C, Zeng J, Jiang B. A detailed view of the injection-inducedseismicity in a natural gas reservoir in Zigong, southwestern Sichuan Basin,China. Journal of Geophysical Research 2013;118(8):4296e311.
Levina E, Bennett S, McCoy S. Technology roadmap: carbon capture and storage.Paris, France: International Energy Agency; 2013.
McGarr A. Maximum magnitude earthquakes induced by fluid injection. Journal ofGeophysical Research 2014;119(2):1008e19.
Meremonte ME, Lahr JC, Frankel AD, Dewey JW, Crone AJ, Overturf DE, Carver DL,Rice WT. Investigation of an earthquake swarm near Trinidad, Colorado,August-October 2001. U.S. Geological Survey Open-File Report 02-0073. 2002.
Nauclér T, Campbell W, Ruijs J. Carbon capture and storage: assessing the eco-nomics. McKinsey & Company; 2008.
Nicholson C, Roeloffs E, Wesson RL. The Northeastern Ohio earthquake of 31January 1986: was it induced? Bulletin of the Seismological Society of America1988;78(1):188e217.
Onuma T, Ohkawa S. Detection of surface deformation related with CO2 injection byDInSAR at In Salah, Algeria. Energy Procedia 2009;1(1):2177e84.
Payre X, Maisons C, Marblé A, Thibeau S. Analysis of the passive seismic monitoringperformance at the Rousse CO2 storage demonstration pilot. Energy Procedia2014;63:4339e57.
Raleigh CB, Healy JH, Bredehoeft JD. An experiment in earthquake control atRangely, Colorado. Science 1976;191(4233):1230e7.
Rutledge J. Geologic demonstration at the Aneth Oil Field, Paradox Basin, Utah.Southwest Regional Partnership of Carbon Sequestration. 2010.
Seeber L, Armbruster JG, Kim WY. A fluid-injection-triggered earthquake sequencein Ashtabula, Ohio: implications for seismogenesis in stable continental regions.Bulletin of the Seismological Society of America 2004;94(1):76e87.
Stork AL, Verdon JP, Kendall JM. The microseismic response at the In Salah carboncapture and storage (CCS) site. International Journal of Greenhouse Gas Control2015;32:159e71.
Sumy DF, Cochran ES, Keranen KM, Wei M, Abers GA. Observations of staticCoulomb stress triggering of the November 2011 M5.7 Oklahoma earthquakesequence. Journal of Geophysical Research 2014;119(3):1904e23.
Verdon JP. Significance for secure CO2 storage of earthquakes induced by injection.Environmental Research Letters 2014;9(6):064022.
Verdon JP. Using microseismic data recorded at the Weyburn CCS-EOR site to assessthe likelihood of induced seismic activity. International Journal of GreenhouseGas Control 2016. http://dx.doi.org/10.1016/j.ijggc.2016.03.018 (in press).
Verdon JP, Kendall JM, White DJ, Angus DA. Linking microseismic event observationswith geomechanical models to minimise the risks of storing CO2 in geologicalformations. Earth and Planetary Science Letters 2011;305(1e2):143e52.
Verdon JP, Kendall JM, Stork AL, Chadwick RA, White DJ, Bissell RC. Comparison ofgeomechanical deformation induced by megaton-scale CO2 storage at Sleipner,Weyburn, and In Salah. Proceedings of the National Academy of Sciences of theUSA 2013;110(30):E2762e71.
Verdon JP, Stork AL, Bissell RC, Bond CE, Werner MJ. Simulation of seismic eventsinduced by CO2 injection at In Salah, Algeria. Earth and Planetary Science Let-ters 2015;426:118e29.
Verdon JP, Kendall JM, Horleston AC, Stork AL. Subsurface fluid injection andinduced seismicity in southeast Saskatchewan. International Journal ofGreenhouse Gas Control 2016. http://dx.doi.org/10.1016/j.ijggc.2016.04.007 (inpress).
Vilarrasa V, Carrera J. Geologic carbon storage is unlikely to trigger large earth-quakes and reactivate faults through which CO2 could leak. Proceedings of theNational Academy of Sciences of the USA 2015;112(19):5938e43.
Zoback MD, Gorelick SM. Earthquake triggering and large-scale geologic storage ofcarbon dioxide. Proceedings of the National Academy of Sciences of the USA2012;109(26):10164e8.
Zoback MD, Gorelick SM. To prevent earthquake triggering, pressure changes due toCO2 injection need to be limited. Proceedings of the National Academy of Sci-ences of the USA 2015;112(33):E4510.
James P. Verdon received M.A. and M.Sci. degrees inNatural Sciences from Cambridge University, andcompleted his Ph.D. in Geophysics at the University ofBristol. For his PhD thesis he was awarded the KeithRuncorn Prize for the best doctoral thesis in geophysics bythe Royal Astronomical Society. He is presently a SeniorResearch Fellow in the School of Earth Sciences, Universityof Bristol, where his position is funded by the BritishGeological Survey (BGS). He has published over 30 articlesin peer-reviewed, scholarly publications.