carbon capture and geological storage emission reduction .../media/files/ehs/climate-change/... ·...
TRANSCRIPT

Carbon C
apture and Geological S
torage Em
ission Reduction P
roject Family
Prepared by: U
RS
Corporation
Part II: Carbon Capture and Geological StorageEmission Reduction Family
Oil and Natural Gas Industry Guidelines for Greenhouse Gas Reduction Projects
International Petroleum Industry Environmental Conservation Association
American Petroleum Institute
Prepared by URS Corporation
June 2007

International Petroleum Industry Environmental Conservation Association
The International Petroleum Industry Environmental Conservation Association (IPIECA) wasfounded in 1974 following the establishment of the United Nations Environment Programme(UNEP). IPIECA provides one of the industry’s principal channels of communication with theUnited Nations.
IPIECA is the single global association representing both the upstream and downstream oil andgas industry on key global environmental and social issues. IPIECA’s programme takes fullaccount of international developments in these issues, serving as a forum for discussion andcooperation involving industry and international organizations.
IPIECA’s aims are to develop and promote scientifically-sound, cost-effective, practical, sociallyand economically acceptable solutions to global environmental and social issues pertaining to theoil and gas industry. IPIECA is not a lobbying organization, but provides a forum forencouraging continuous improvement of industry performance.
5th Floor, 209–215 Blackfriars Road, London SE1 8NL, United KingdomTel: +44 (0)20 7633 2388 Fax: +44 (0)20 7633 2389E-mail: [email protected] Internet: www.ipieca.org
American Petroleum Institute
The American Petroleum Institute is the primary trade association in the United Statesrepresenting the oil and natural gas industry, and the only one representing all segments of theindustry. Representing one of the most technologically advanced industries in the world, API’smembership includes more than 400 corporations involved in all aspects of the oil and gasindustry, including exploration and production, refining and marketing, marine and pipelinetransportation and service and supply companies to the oil and natural gas industry.
API is headquartered in Washington, D.C. and has offices in 27 state capitals and provides itsmembers with representation on state issues in 33 states. API provides a forum for all segmentsof the oil and natural gas industry to pursue public policy objectives and advance the interests ofthe industry. API undertakes in-depth scientific, technical and economic research to assist in thedevelopment of its positions, and develops standards and quality certification programs usedthroughout the world. As a major research institute, API supports these public policy positionswith scientific, technical and economic research. For more information, please visit www.api.org.
1220 L Street NW, Washington DC, 20005-4070 USATel: +1 202 682 8000 Internet: www.api.org
© IPIECA 2007. All rights reserved. No part of this publication may be reproduced, stored in a retrieval system, or transmitted inany form or by any means, electronic, mechanical, photocopying, recording or otherwise, without the prior consent of IPIECA.
Cover photographs reproduced courtesy of the following: Wellhead (left): Copyright © EnCana Corporation. All rights reserved.Sleipner Platform (right): Copyright © Øyvind Hagen, Statoil. All rights reserved.
Section 6. Geological Storage Emission Reduction Project Family
June 2007 i
Table of Contents
PART I1 .................................................................................................. March 2007 Section 1. Introduction
Section 2. GHG Reduction Project Concepts and Principles
Section 3. Policy Considerations Section 4. Overview of GHG Reduction Project Families
Section 5. Cogeneration Project Family PART II .................................................................................................... June 2007 Acknowledgements ...................................................................................................... iv
Section 6. Carbon Capture and Geological Storage Emission Reduction Project Family ....................................................................................................... 1
6.1 Overview ........................................................................................................................1 6.2 Introduction ....................................................................................................................1 6.3 Project Definition ...........................................................................................................4
6.3.1 Capture ...............................................................................................................4 6.3.2 Transport ............................................................................................................4 6.3.3 Storage ...............................................................................................................5
6.4 Baseline Scenarios .........................................................................................................7 6.5 Emission Sources and Assessment Boundary ................................................................9
6.5.1 Baseline Emission Sources ..............................................................................11 6.5.2 Capture Emission Sources ...............................................................................12 6.5.3 Transport Emission Sources ............................................................................12 6.5.4 Storage Emission Sources ................................................................................12
6.6 Emission Reductions ....................................................................................................13 6.7 Monitoring ...................................................................................................................14
6.7.1 Definition and Purpose ....................................................................................14 6.7.2 Monitoring Methods ........................................................................................20 6.7.3 Emissions Monitoring ......................................................................................21 6.7.4 Monitoring for Storage Risk Management ......................................................22 6.7.5 Remediation .....................................................................................................25
6.8 Reporting and Documentation .....................................................................................25 6.9 Verification/Assurance ................................................................................................26 6.10 Policy Considerations ..................................................................................................26
6.10.1 Assessment Boundary ......................................................................................26
1 International Petroleum Industry Environmental Conservation Association (IPIECA) and American Petroleum Institute (API). Oil and Natural Gas Industry Guidelines for Greenhouse Gas Reduction Projects, March 2007.

Section 6. Geological Storage Emission Reduction Project Family
June 2007 ii
6.10.2 Eligibility .........................................................................................................27 6.10.3 Ownership ........................................................................................................27
6.11 Project Examples .........................................................................................................28 6.12 Conclusions ..................................................................................................................28 6.13 References ....................................................................................................................28 6.14 Glossary .......................................................................................................................29
Attachments Attachment 1 CCS Project Case Study #1: Carbon Capture and Storage for Enhanced Oil
Recovery ................................................................................................................31 Attachment 1 CCS Project Case Study #2: Geological Storage of Acid Gas ..............................48 Attachment 1 CCS Project Case Study #3....................................................................................62 Attachment 2 Example CCS Projects and Research, Current and Planned ..................................76 Attachment 3 Applications and Technologies for CO2 Capture ...................................................78
Section 6. Geological Storage Emission Reduction Project Family
June 2007 iii
List of Tables
6-1 Potential Baseline Candidates for Probable CCS Projects ..................................................8 6-2 Summary of Potential GHG Emission Sources ...................................................................9 6-3 Summary of Direct and Indirect Techniques that can be used to Monitor CO2 Storage
Projects ...............................................................................................................................15 6-4 Case Study #1 Baseline Candidates ...................................................................................34 6-5 Case Study #1 Baseline Scenario Assessment ...................................................................35 6-6 Case Study #1 Assessment Boundary Determination ........................................................38 6-7 Case Study #2 Baseline Candidates ...................................................................................49 6-8 Case Study #2 Baseline Scenario Assessment ...................................................................50 6-9 Case Study #2 Assessment Boundary Determination ........................................................53 6-10 Case Study #3 Baseline Candidates ...................................................................................64 6-11 Case Study #3 Baseline Scenario Assessment ...................................................................65 6-12 Case Study #3 Assessment Boundary Determination ........................................................67
List of Figures 6-1 CCS Process Chain ..............................................................................................................2 6-2 CO2 Capture Processes ........................................................................................................5 6-3 Geological Storage Options .................................................................................................6 6-4 Schematic of Potential GHG Emission Sources ................................................................11 6-5 Potential Project Emission Reduction Calculated from Reference Baseline Scenario ......13 6-6 Illustration of Monitoring Techniques ...............................................................................19 6-7 Project Illustration of CO2 Capture, Transport and Injection for Enhanced Oil
Recovery Operations ..........................................................................................................32 6-8 Baseline Illustration of CO2 Capture, Transport and Injection for Enhanced Oil
Recovery Operations ..........................................................................................................37 6-9 Project Illustration of Acid Gas Storage Operations ..........................................................48 6-10 Baseline Illustration of Acid Gas Storage Project .............................................................53 6-11 Project Illustration of CO2 Capture, Transport and Injection in a Saline Formation .........62 6-12 CO2 Storage Formation ......................................................................................................63 6-13 Baseline Illustration of CO2 Capture, Transport and Injection in a Saline Formation ......66

Section 6. Geological Storage Emission Reduction Project Family
June 2007 iv
ACKNOWLEDGEMENTS
This section of the Oil and Natural Gas Industry Guidelines for Greenhouse Gas Reduction Projects (IPIECA and API, March 2007) is the work product of the IPIECA Joint Industry Task Force on Greenhouse Gas (GHG) Reporting Guidelines. The Task Force was convened under the auspices of the International Petroleum Industry Environmental Conservation Association (IPIECA) Climate Change Work Group, in collaboration with the American Petroleum Institute (API). The Joint Industry Task Force formed a Drafting Committee to the Carbon Capture and Geological Storage Emission Reduction Project Family. The committee was comprised of:
Lead Organizations: Karin Ritter API Luke Warren and
Robert Siveter IPIECA
Chair: Frede Cappelen Statoil Project Guidance Experts: Charles Christopher
Martin Fasola Gemma Heddle Wolfgang Heidug Theresa Hochhalter Haroon Kheshgi Luc de Marliave Mike McMahon Tom Mikus Brigitte Poot Wishart Robson Anthony Webster Ian Wright
BP Repsol YPF Chevron Shell ExxonMobil ExxonMobil Total BP Shell Total Nexen HESS BP
Contractors: Terri Shires and
Mahesh Gundappa URS Corporation
The authors are grateful to the IPIECA and API member companies and their representatives on the Drafting Committee who have contributed valuable time, resources, and information throughout the development of this document.
Much of the material in this section builds on the Intergovernmental Panel on Climate Change Special Report on Carbon Capture and Storage (IPCC, 2005), as well as ongoing research, developments and CCS demonstrations by the U.S. Department of Energy and the International Energy Agency.

Section 6. Geological Storage Emission Reduction Project Family
June 2007 v
In addition, the Drafting Committee would also like to thank the following individuals and organizations for reviewing and providing comments on the draft document:
David Bardin Arent Fox LLP Dr. Klaus Brendow World Energy Council Steve Crookshank API Lisa Hanle US EPA Office of Air and Radiation Arthur Lee Chevron Dennis Van Puyvelde CO2CRC API Legal

Section 6. Geological Storage Emission Reduction Project Family
June 2007 vi

Section 6. Geological Storage Emission Reduction Project Family
June 2007 1
SECTION 6. CARBON CAPTURE AND GEOLOGICAL STORAGE EMISSION REDUCTION PROJECT FAMILY
6.1 Overview This section is a continuation of the Oil and Natural Gas Industry Guidelines for Greenhouse Gas Reduction Projects (IPIECA and API, 2007), referred to as the General Project Guidelines.2 It is the second of five greenhouse gas (GHG) reduction “project families” in an ongoing process of developing guidelines for project activities of interest to the oil and natural gas industry.
Guidelines are provided for carbon dioxide (CO2) capture and geological storage (CCS) as an emission reduction option, following the framework presented in Section 2 of the General Project Guidelines (IPIECA and API, 2007).3 The focus is on specific technical considerations and aspects rather than policy considerations. Case studies of three potential applications are provided in Attachment 1.
6.2 Introduction CCS refers to the chain of processes to collect or capture a CO2 gas stream, transport the CO2 to a storage location, and inject the CO2 into a geological formation4 for long-term isolation from the atmosphere (See Figure 6-1). The assessment of project reductions from CCS should address all of these elements.
CCS involves avoiding CO2 emissions to the atmosphere by injecting CO2 and ultimately storing it in a geological formation. For a CCS project to be regarded as a climate change mitigation activity, the geological formations at the selected site must have the appropriate long-term containment capability. Definition of long-term containment or an insignificant probability of physical leakage is a policy matter.
2 This guidance document is not intended to create any requirement or industry standards for GHG reduction projects. Rather it is intended solely for the convenience and voluntary use of oil and natural gas companies that may find it helpful. Nor is this document intended to imply a direct connection between GHG emissions from the oil and natural gas industry and the phenomenon commonly referred to as climate change. To the contrary, this guidance document recognizes that companies may undertake GHG reduction projects for a variety of reasons. 3 The American Petroleum Institute (API) and the International Petroleum Industry Environmental Conservation Association (IPIECA) make no representation that use of this guidance document would satisfy any legal or technical requirements of standards for creditable GHG reduction projects, or ensure compliance with any other requirements, under any applicable regulatory regime. Any company that uses these Project Guidelines should consult its own legal counsel as to any legal requirements that may apply to a project. 4 For the purpose of this project family, geological storage reservoirs explicitly exclude ocean sequestration.

Section 6. Geological Storage Emission Reduction Project Family
June 2007 2
Figure 6-1. CCS Process Chain Adapted from IEA, Energy Technology Analysis, Prospects for CO2 Capture and Storage, 2004
Most experts agree on what makes a geological formation suitable for very long-term storage of CO2 (addressed further in Section 6.7.4). Application of CCS toward climate change mitigation builds on existing industrial operations, for example in the separation of CO2 from gas mixtures; in the compression, transport, and injection of CO2; and corrosion control, and may be compatible with many current energy infrastructures. Many of the methods and techniques to identify appropriate sites, conduct injection operations, project subsurface performance, manage injected gases and substances, and to avoid or mitigate unwanted developments are well known to the oil and natural gas industry. By 2000, there were 84 CO2 enhanced oil recovery (EOR)

Section 6. Geological Storage Emission Reduction Project Family
June 2007 3
operations worldwide (Oil and Gas Journal, 2001) and about 33 million tonnes (Mt) of CO2 injected each year, in addition to the volume of CO2 that were recycled as part of the EOR operations (IPEICA, 2003). One of the largest EOR operations injects nearly 260 MMscf of CO2 per day (Heinrich, 2003), five times greater than the injection rate of the Sleipner Field. Although the scale of CCS deployment that would be required to make a substantial impact as a global climate change mitigation option is much larger, these operations provide significant experience in the handling of large quantities of CO2. Additional significant experience is provided by natural gas storage and acid gas injection operations (IPCC SRCCS, 2005). In addition, a number of pilot- and commercial-scale CO2 storage projects are underway or planned (see examples provided in Attachment 2).
In principle, the steps for site selection to determine if a geological formation is suitable for long-term containment of CO2 include:
• Site characterization– confirming that the storage location is appropriate for CO2 containment based on evaluating − surface area land use; − the geology and local hydrogeology; − its capacity to store the desired amount of CO2; − its injectivity to receive CO2 at the rate that it is supplied from the source(s); − the presence of a secure structural or stratigraphic trap or other confining unit; and − possible physical leakage pathways (site characterization is discussed further in
Section 6.7.3); and • An assessment of the risk of physical leakage from the geological formations – including
the use of models that predict movements of CO2 over time and locations where potential physical leakage might occur.
CCS may play a significant role in mitigating greenhouse gas (GHG) emissions. However, much of this depends on public and policy maker acceptance, which will necessitate demonstrating that potential local risks or other concerns associated with long-term CO2 storage are managed.
Risk management entails applying a structured process to identify and quantify the risks associated with a given process, to evaluate these, taking into account stakeholder input, to modify the process to remove risks, where possible, and to identify and implement appropriate monitoring and intervention strategies to manage the remaining risks. Careful site selection, monitoring to provide assurance that the CCS project is performing as expected and to provide early warning in the event that it begins to leak, and use of remediation measures to eliminate or limit the causes and impacts of physical leakage are effective ways of managing potential risks associated with CCS. In this project family, pre-operational evaluation as a risk management technique for selecting a geological formation and monitoring to control potential risks during and after injection are described separately from the monitoring and reporting activities to determine GHG emission reductions from a CCS project.
Section 6. Geological Storage Emission Reduction Project Family
June 2007 4
6.3 Project Definition As defined in the General Project Guidelines, a GHG reduction project is a recognizable and distinct activity or set of activities that reduce global GHG emissions, increase the storage of carbon, or enhance GHG removals from the atmosphere. A project activity is a specific action or intervention that changes GHG emissions, removals, or storage. An overview of technologies associated with the three main activities of the CCS process chain—capture, transport, injection, and storage—is provided below.
6.3.1 Capture
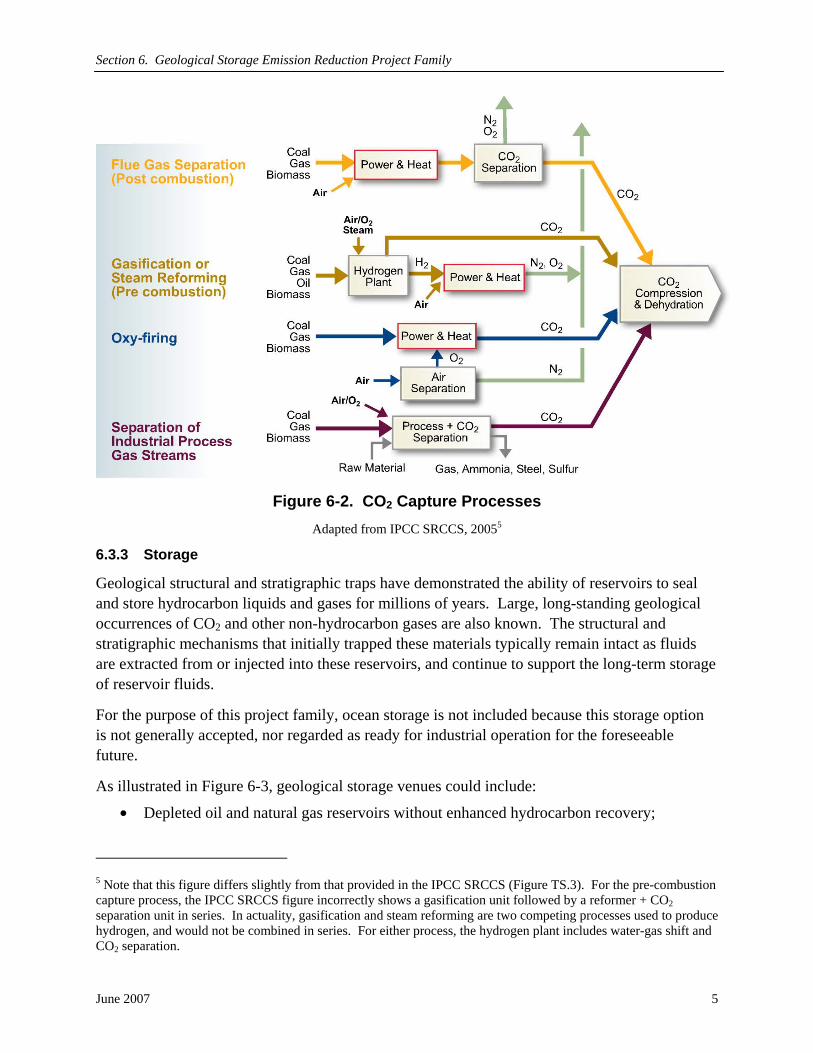
The capture step involves the separation of CO2 from other gaseous products, compression to facilitate efficient transportation and injection and, where necessary, conditioning for transport (e.g., dehydration). Figure 6-2 provides a simple illustration of the four primary separation applications for potential CO2 capture from industrial and power plant operations:
• Separation of industrial process gas streams. This includes the separation of CO2 from natural gas to meet sales gas specifications or to condition the gas for producing liquefied natural gas (LNG). In addition, a number of industrial processes involve chemical reactions that form CO2 in quantities and concentrations that may allow direct capture or separation of the CO2. These include: hydrogen production, ethanol production, ammonia production, cement manufacturing, and iron and steel manufacturing;
• Flue gas separation where CO2 is separated from the flue gases produced by combustion of a primary fuel (coal, natural gas, oil or biomass) in air;
• Oxy-firing combustion which uses oxygen instead of air for combustion, producing a flue gas that is mainly H2O and CO2 and which is readily captured. This option is still under development; and
• Gasification (partial oxidation) or steam reforming where a gas, liquid, or solid hydrocarbon is reacted to produce separate streams of CO2 for storage and H2.
Additional information on specific technologies and applications are provided in Attachment 3.
6.3.2 Transport
Except when an industrial facility is located directly above a geological storage site, captured CO2 must be transported from the point of capture to the storage site. Pipelines operate as a mature market technology and historically are the most common method for transporting CO2. These pipelines operate at ambient temperature and high pressure, with flow driven by pumps. There are currently about 5,000 km of land-based CO2 pipelines in existence worldwide (IOGCC, 2005), with more expected to be built or begin operation in the near future. For example, a sub-sea pipeline transporting captured CO2 for storage under the seabed 146 km offshore will come into operation in Norway in 2007.
Bulk transport of CO2 by ship also takes place, though on a much smaller scale. This occurs in insulated containers at low temperatures and much lower pressures than pipeline transport. Transport by truck and rail occurs for small quantities of CO2, but is unlikely to be widely used if large volumes of CO2 are to be transported for CCS purposes.
Section 6. Geological Storage Emission Reduction Project Family
June 2007 5
Figure 6-2. CO2 Capture Processes Adapted from IPCC SRCCS, 20055
6.3.3 Storage
Geological structural and stratigraphic traps have demonstrated the ability of reservoirs to seal and store hydrocarbon liquids and gases for millions of years. Large, long-standing geological occurrences of CO2 and other non-hydrocarbon gases are also known. The structural and stratigraphic mechanisms that initially trapped these materials typically remain intact as fluids are extracted from or injected into these reservoirs, and continue to support the long-term storage of reservoir fluids.
For the purpose of this project family, ocean storage is not included because this storage option is not generally accepted, nor regarded as ready for industrial operation for the foreseeable future.
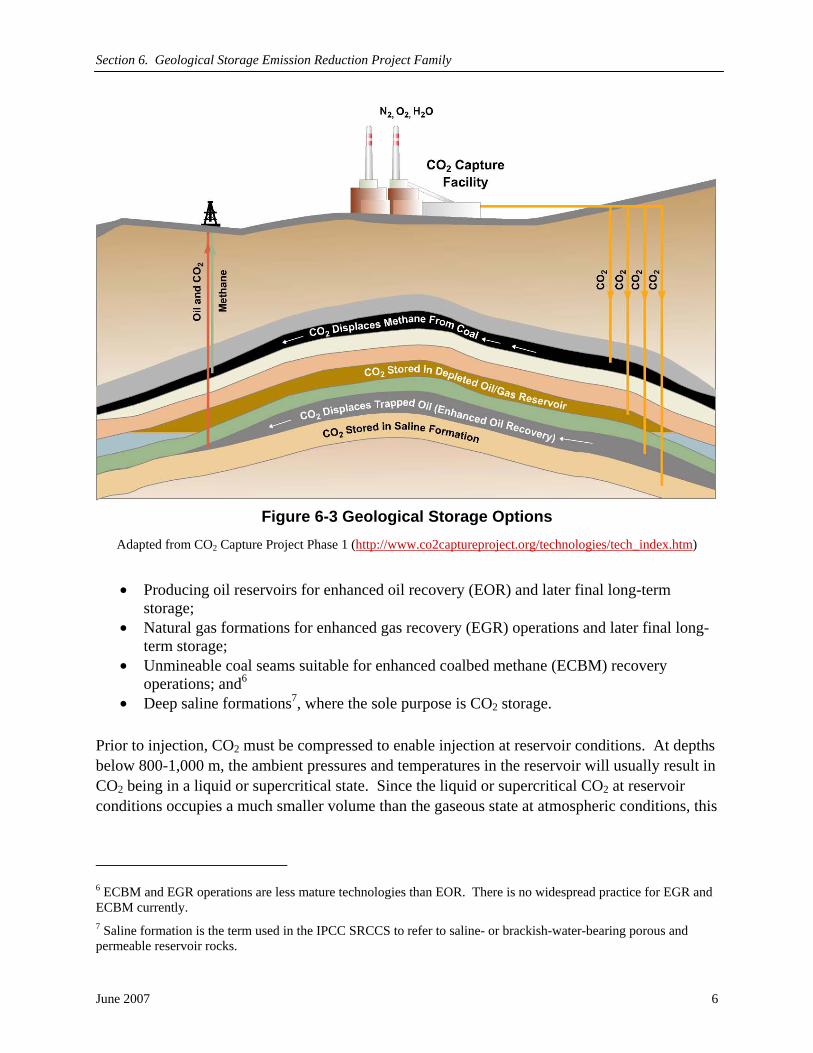
As illustrated in Figure 6-3, geological storage venues could include:
• Depleted oil and natural gas reservoirs without enhanced hydrocarbon recovery;
5 Note that this figure differs slightly from that provided in the IPCC SRCCS (Figure TS.3). For the pre-combustion capture process, the IPCC SRCCS figure incorrectly shows a gasification unit followed by a reformer + CO2 separation unit in series. In actuality, gasification and steam reforming are two competing processes used to produce hydrogen, and would not be combined in series. For either process, the hydrogen plant includes water-gas shift and CO2 separation.
Section 6. Geological Storage Emission Reduction Project Family
June 2007 6
Figure 6-3 Geological Storage Options
Adapted from CO2 Capture Project Phase 1 (http://www.co2captureproject.org/technologies/tech_index.htm)
• Producing oil reservoirs for enhanced oil recovery (EOR) and later final long-term storage;
• Natural gas formations for enhanced gas recovery (EGR) operations and later final long-term storage;
• Unmineable coal seams suitable for enhanced coalbed methane (ECBM) recovery operations; and6
• Deep saline formations7, where the sole purpose is CO2 storage. Prior to injection, CO2 must be compressed to enable injection at reservoir conditions. At depths below 800-1,000 m, the ambient pressures and temperatures in the reservoir will usually result in CO2 being in a liquid or supercritical state. Since the liquid or supercritical CO2 at reservoir conditions occupies a much smaller volume than the gaseous state at atmospheric conditions, this
6 ECBM and EGR operations are less mature technologies than EOR. There is no widespread practice for EGR and ECBM currently. 7 Saline formation is the term used in the IPCC SRCCS to refer to saline- or brackish-water-bearing porous and permeable reservoir rocks.

Section 6. Geological Storage Emission Reduction Project Family
June 2007 7
provides the potential for more efficient utilization of underground storage space in the pores of sedimentary rocks, and improves storage security.
CO2 is retained in geological formations by a combination of physical and geochemical trapping mechanisms, with the proportion of exact mechanism(s) depending on the formation type and fluid properties. These trapping mechanisms include the presence of an impermeable caprock, dissolution in water, trapping by capillary forces in small pores, and long-term mineralization. In oil reservoirs, CO2 may dissolve in and be produced with oil, but a portion of the CO2 will remain in the reservoir.
For saline formations with no distinct geological trap, the presence of an impermeable caprock above the reservoir, residual or capillary trapping, and the geochemical mechanisms of solubility and mineral trapping are also very important. For example, solubility trapping involves the dissolution of the CO2 into the reservoir fluids over hundreds to thousands of years. The formation water saturated with CO2 is denser than water without the CO2; hence the formation water containing CO2 slowly sinks towards the bottom of the storage formation. Mineral trapping involves the reaction between the dissolved CO2 and minerals present in the formation to form stable, solid compounds (e.g., carbonates) over thousands to millions of years, permanently trapping the CO2 in the reservoir.
ECBM through the injection of CO2 is possible due to the preferential adsorption of CO2 over methane onto the coal matrix. In the case of ECBM, the CO2 will remain trapped as long as pressures and temperatures remain stable and the coal is not disturbed by mining or seismic activity.
The injection of CO2 in deep geological formations involves many of the same technologies that have been developed in the oil and natural gas exploration and production industry for EOR purposes – well drilling, fluid injection, computer simulation of storage reservoir systems, performance monitoring, and well intervention methods.
6.4 Baseline Scenarios Potential candidates for the baseline scenario represent situations or conditions that plausibly would have occurred in the absence of the emission reduction project. There is no generic baseline for CCS; baseline scenario candidates must be evaluated for the specific CCS application and should consider all elements of the CCS chain. A listing of potential baseline scenario candidates for the most probable CCS projects is provided in Table 6-1. To the extent possible, project activities and potential baseline candidates associated with each step of the CCS chain are presented separately.

Section 6. Geological Storage Emission Reduction Project Family
June 2007 8
Table 6-1. Potential Baseline Candidates for Probable CCS Project Elements Bold italic text indicates the project activity
CCS Chain Probable Project Elements Potential Baseline Candidates
Cap
ture
Separation of CO2 to purify natural gas to sales gas specifications or for producing LNG
• CO2 is separated from the Hydrogen sulfide (H2S) and CO2 is vented to the atmosphere
• CO2 is vented to the atmosphere when the acid gas is incinerated
• CO2 and H2S are separated from the acid gas stream and CO2 is captured
Separation of CO2 from industrial process gas streams
• CO2 is vented to the atmosphere as a result of one of the industrial processes described in Section 6.3.1
• CO2 is capturedFlue gas CO2 separation • CO2 from an existing flue gas stream (e.g., power plant
exhaust gas) is vented to the atmosphere. • CO2 is captured
Oxy-firing combustion Gasification (partial oxidation) or steam reforming to produce hydrogen
Tra
nspo
rt Transport by land or marine
pipeline • Where CO2 is vented to the atmosphere in the baseline
scenario, transport baseline candidates would not exist • Natural-sourced CO2 is transported by pipeline or ship • Captured CO2 is transported by pipeline or ship Transport by ship
Inje
ctio
n an
d St
orag
e
Acid gas injection - CO2 and H2S are disposed of through injection into the production reservoir.
• CO2 and H2S separated from the acid gas stream are stored in another geological formation
• CO2 separated from the acid gas stream is sold to the market
• CO2 separated from the acid gas stream is used for EOR, EGR, ECBM, or to maintain reservoir pressure
• CO2 and H2S separated from the acid gas stream are stored in the production reservoir
Inje
ctio
n an
d St
orag
e
Captured CO2 is used for EOR or enhanced gas recovery (EGR)
• CO2 is purchased from a naturally-occurring underground source for use in EOR or EGR8
• CO2 is purchased from an industrial facility for use in EOR or EGR
• EOR is achieved by the injection of natural gas, nitrogen (N2), or water. EGR is achieved by means other than the injection of CO2.
• Captured CO2 is reinjected into the same hydrocarbon reservoir (oil or gas) from which it was produced.
• CO2 produced from EOR production wells in a CO2-flooded field is vented to the atmosphere
• CO2 produced from EOR production wells in a CO2-flooded field is recycled to EOR operations and sealed for final storage
• Captured CO2 is used for EOR or EGR
8 The use of naturally occurring, underground-sourced CO2 for enhanced hydrocarbon recovery is not, in and of itself, a GHG emission reduction project.

Section 6. Geological Storage Emission Reduction Project Family
June 2007 9
Table 6-1. Potential Baseline Candidates for Probable CCS Project Elements (Continued)
Bold italic text indicates the project activity CCS
Chain Probable Project Elements Potential Baseline Candidates
Inje
ctio
n an
d St
orag
e
Captured CO2 is injected in a geological formation or saline formation for long-term storage
• Captured CO2 is sold to market • Captured CO2 is reinjected into the same hydrocarbon
reservoir (oil or gas) from which it was produced. • Captured CO2 is used for EOR, EGR, or to maintain
pressure in a hydrocarbon reservoir • Captured CO2 is stored
Inje
ctio
n an
d St
orag
e
CO2 capture for enhanced coal bed methane (ECBM) operations
• CO2 is purchased from a naturally-occurring underground source for use in ECBM
• CO2 is purchased from an industrial facility for use in ECBM
• N2 is used in ECBM operations • Captured CO2 is used for ECBM
6.5 Emission Sources and Assessment Boundary
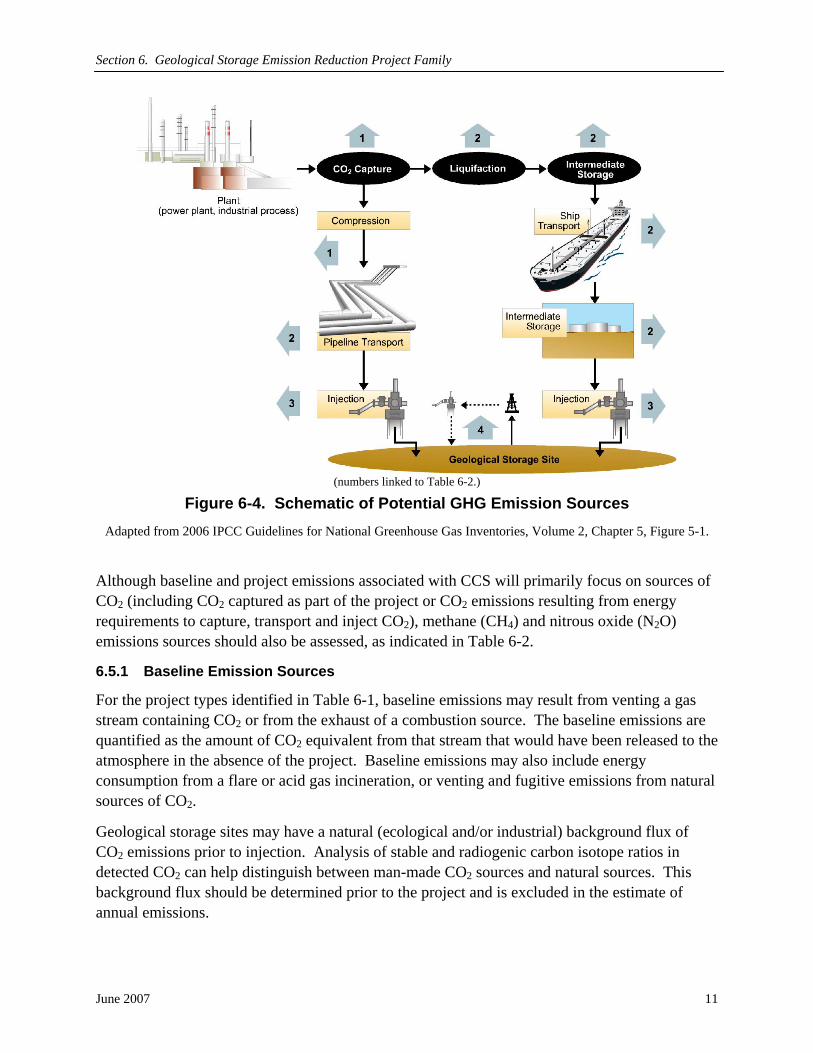
As discussed in Section 2.5 of the General Project Guidelines (IPIECA and API, 2007), the assessment boundary encompasses all project and baseline emission sources controlled by the project proponent, related to the CCS project, or affected by the CCS project. Affected emissions are discussed in Section 6.9.1. Emissions discussed below may be controlled or related, depending on which sources the project proponent controls. This can vary from project to project. Different sources of emissions that could occur across the CCS chain are summarized in Table 6-2 and illustrated in Figure 6-4. For a CCS project, the assessment boundary also includes the subsurface.
Table 6-2. Summary of Potential GHG Emission Sources
Emission Source Emission Type* GHG Species
Baseline Waste gas stream from an industrial process
Vented CO2
Flue gas stream from a large stationary source
Vented CO2
Emissions from stationary combustion sources, flares, and/or incinerated streams (e.g., flared associated gas)
Combustion Primarily CO2; CH4 and N2O to lesser degree
Venting of stripped CO2 from a natural gas stream
Vented CO2 and potentially CH4
Naturally occurring emissions originating from a geological CO2 formation
Vented and fugitive
Primarily CO2, may contain some CH4

Section 6. Geological Storage Emission Reduction Project Family
June 2007 10
Table 6-2. Summary of Potential GHG Emission Sources (Continued) Emission Source Emission Type* GHG Species
CC
S C
hain
1. Capture Dehydration and other gas treatment
equipment to separate the CO2 from other gas stream components
Combustion Primarily CO2; CH4 and N2O to lesser degree
Vented CO2 and CH4 Fugitive CO2 and CH4 Fuel combustion associated with
capture process (Note: compression may occur in the capture step)
Combustion Primarily CO2; CH4 and N2O to lesser degree
Purchased electricity associated with capture process
Indirect Primarily CO2; CH4 and N2O to lesser degree
Fraction of CO2 or CH4 not captured Vented and fugitive
CO2 and/or CH4
Use and disposal/incineration of CO2 removal process/agent
Primarily energy consumption
Primarily CO2; CH4 and N2O to lesser degree
2. Transport Gas-fired compressor engines Combustion Primarily CO2; CH4 and N2O to lesser degree
Mobile source energy consumption Combustion Primarily CO2; CH4 and N2O to lesser degree
Purchased electricity Indirect Primarily CO2; CH4 and N2O to lesser degree
Pressurized equipment and pipeline leaks
Fugitive
CO2 and potentially CH4
Maintenance or emergency releases Vented Intermediate storage Vented Loading/unloading Vented Losses in transport Vented
3. Injection Gas-fired compressor engines for injection or recycle
Combustion Primarily CO2; CH4 and N2O to lesser degree
Purchased electricity Indirect Primarily CO2; CH4 and N2O to lesser degree
Pressurized CO2 injection equipment Fugitive CO2 and potentially CH4
CC
S C
hain
Maintenance or emergency releases Vented Production and injection wells Vented Dehydration and other gas treatment
equipment for recycled gas Combustion Primarily CO2; CH4 and
N2O to lesser degree Vented CO2 and CH4 Fugitive CO2 and CH4 Purchased electricity Indirect Primarily CO2; CH4 and
N2O to lesser degree 4. Storage Physical leakage from geological
formations, Fugitive
CO2 and potentially CH4
CO2 leakage from wells, Vented and/or Fugitive
Uncaptured CO2 co-produced with oil/gas
Vented
* Indirect emissions are “related” emission sources. All others may be “controlled” or “related” depending on which sources the project proponent controls.
Section 6. Geological Storage Emission Reduction Project Family
June 2007 11
(numbers linked to Table 6-2.)
Figure 6-4. Schematic of Potential GHG Emission Sources Adapted from 2006 IPCC Guidelines for National Greenhouse Gas Inventories, Volume 2, Chapter 5, Figure 5-1.
Although baseline and project emissions associated with CCS will primarily focus on sources of CO2 (including CO2 captured as part of the project or CO2 emissions resulting from energy requirements to capture, transport and inject CO2), methane (CH4) and nitrous oxide (N2O) emissions sources should also be assessed, as indicated in Table 6-2.
6.5.1 Baseline Emission Sources
For the project types identified in Table 6-1, baseline emissions may result from venting a gas stream containing CO2 or from the exhaust of a combustion source. The baseline emissions are quantified as the amount of CO2 equivalent from that stream that would have been released to the atmosphere in the absence of the project. Baseline emissions may also include energy consumption from a flare or acid gas incineration, or venting and fugitive emissions from natural sources of CO2.
Geological storage sites may have a natural (ecological and/or industrial) background flux of CO2 emissions prior to injection. Analysis of stable and radiogenic carbon isotope ratios in detected CO2 can help distinguish between man-made CO2 sources and natural sources. This background flux should be determined prior to the project and is excluded in the estimate of annual emissions.

Section 6. Geological Storage Emission Reduction Project Family
June 2007 12
6.5.2 Capture Emission Sources
Technologies for capturing CO2 require the use of energy, with a corresponding increase in fossil fuel consumption and/or purchased electricity. Processes that separate CO2 from other components in the captured gas, such as dehydration to remove H2O, are potential sources of combustion, vented or fugitive emissions. Compression of the captured CO2 may occur in this step, resulting in combustion or indirect emissions. In addition, the capture processes are less than 100 percent efficient, resulting in a small amount of residual CO2 emissions.
6.5.3 Transport Emission Sources
In transport, fugitive emissions may result from pressurized equipment leaks. Vented emissions result from equipment maintenance, emergency releases, intermediate storage facilities, loading/offloading, and losses in transport. Combustion emissions result from compressor fuel consumption or mobile source fuel consumption. Indirect emissions from purchased electricity may result from the power requirement for compression at booster stations, pump stations, or cooling of CO2 for cryogenic ship transport.
6.5.4 Storage Emission Sources
Emissions associated with storage operations include vented, fugitive, and combustion emissions from surface equipment at the injection site. Such equipment may include the distribution manifold at the end of the transport pipeline, distribution pipelines to wells, injection wells, compression equipment, and measurement and control systems. Indirect emissions may result from power requirements at the injection site. Additional energy may also be required for ongoing monitoring and maintenance of the storage reservoir.
With appropriate site selection and good operating practices, CO2 emissions from the storage site are likely to be very small, but could include physical leakage from the geological formation and from wells. Site-specific monitoring systems will provide assurance for secure storage.
Emissions associated with CO2 co-produced with oil and/or gas are another potential emission source within the assessment boundary. ECBM and EGR processes attempt to avoid CO2 production because it is costly to separate CO2 from the produced gas mixture, while most EOR projects capture and reinject CO2 that is produced with the associated gas, due to the cost of purchased CO2. For fields that lack adequate gas handling or recompression facilities, the CO2 associated with oil recovery may be vented to the atmosphere (subject to the EOR operating constraints). If the project activity includes recovery and recycling of this previously vented stream, these emissions would be included in the assessment boundary. Example 1, presented in Attachment 1, addresses considerations for quantifying GHG emission reductions associated with CCS combined with EOR operations.
Fugitive and vented emissions of CH4 are also associated with enhanced hydrocarbon recovery operations, such as ECBM and EGR. Hydrocarbon gas streams may be processed, used as fuel on site, flared or vented, depending on the hydrocarbon content. These emission sources should be evaluated to determine if there are differences between baseline and project emissions.

Section 6. Geological Storage Emission Reduction Project Family
June 2007 13
6.6 Emission Reductions Emissions reductions are the net difference between the baseline emissions and project emissions, and are primarily attributable to the quantity of CO2 captured, injected and stored, as illustrated in Figure 6-5. Emissions reductions are typically reported in terms of CO2 equivalents (CO2e), in which all of the GHG species are converted to an equivalent basis relative to their global warming potential (GWP). The calculation of potential emission reductions for various CCS projects is demonstrated through examples in Attachment 1.
Figure 6-5. Potential Project Emission Reduction Calculated from Reference Baseline Scenario
Adapted from IPCC Special Report Carbon Dioxide Capture and Storage, Technical Summary, Figure TS.11, 2005
Baseline emissions are emissions that would have occurred from a referenced operation (baseline scenario) without carbon capture but with the same output as the project plant (e.g., similar power output for a power plant, or volume of natural gas processed for a gas processing facility). Baseline emissions should reflect emission sources associated with each step of the CCS chain, but that would have occurred in the absence of the project. This can be expressed by the following general equation:
Baseline emissions = VENT1 + CMB1 + FUG1 + IND1 (Equation 1) where,
VENT1 = Vented CO2 emissions from baseline operations or equipment that would have occurred in the baseline scenario. (For most petroleum industry CCS projects, the volume of CO2 captured by the project would be included in this amount.)

Section 6. Geological Storage Emission Reduction Project Family
June 2007 14
CMB1 = Direct combustion emissions that would have occurred in the baseline scenario. These might include fuel consumed in stationary combustion equipment or emissions from flares or acid gas incineration.
FUG1 = Fugitive CO2 emissions from baseline equipment that would have occurred in the baseline scenario.
IND1 = Indirect emissions that would have occurred from electricity purchased from outside sources in the baseline scenario.
Similarly, project emissions can be expressed as:
Project emissions = VENT2 + CMB2 + FUG2 + IND2 (Equation 2)
where, VENT2, CMB2, FUG2, and IND2 refer to vented, combustion, fugitive, and indirect emissions, respectively, associated with the project.
As presented in Section 6.5, project emissions include the additional energy required for capture, transport, and storage operations, and other emission sources above and beyond the baseline. Project emissions may also include emissions arising from the replacement of lost power due to inefficiencies in the capture process. Thus, while the amount of CO2 captured and stored can equal the vented CO2 emissions in the baseline scenario, the net reduction will almost always be a lesser amount.
6.7 Monitoring 6.7.1 Definition and Purpose
Monitoring for CCS has two purposes. The first is from a GHG emissions point of view, to establish the amount of GHG emissions reduction. Here, monitoring refers to the continuous or periodic assessment of GHG emissions and removals with the purpose of determining emissions and emission reductions from the project. The second purpose is for potential risk assessment, avoidance, and mitigation.
Monitoring must be sufficient to allow the transparent quantification of GHG reductions. Methodologies for monitoring can be direct or indirect, and include estimation, modeling, measurements, and/or calculation approaches. Table 6-3 summarizes the breadth and variety of monitoring techniques currently available and applicable to CCS operations, some of which are illustrated in Figure 6-6. The applicability of these techniques is site-specific and selection among these options requires an understanding of the site-specific characteristics and risks, as well as the measurement limitations.
In terms of geological storage of CO2, monitoring includes use of methods to assess that the CO2 in the subsurface is behaving as predicted and according to any permit requirements or regulations. Subsurface monitoring is used to determine that the risk of emissions to the environment is not increasing above accepted levels, usually established by the permit for the storage project. In additional, monitoring should establish that CO2 does not leak into other energy and mineral resources in the subsurface, shallow potable groundwater, and soils.

Section 6. Geological Storage Emission Reduction Project Family
June 2007 15
Table 6-3. Summary of Direct and Indirect Techniques that can be used to Monitor CO2 Storage Projects9 Measurement Technique
Measurement Parameters Example Applications Capabilities/Limitations
Introduced and natural tracers
Travel time Partitioning of CO2 into brine or oil Identification of sources of CO2
Tracing movement of CO2 in the storage formation Quantifying solubility trapping Tracing physical leakage
Ease detection of low levels of CO2 and are not impacted by background concentrations. Tracers make soil gas or flux measurements more quantitative, eliminating the need to discriminate between sources of CO2.
Water composition CO2, HCO3-, CO3
2-,
Major ions Trace elements Salinity pH Isotope analysis
Quantifying solubility and mineral trapping Quantifying CO2-water-rock interactions Detecting physical leakage into shallow groundwater aquifers
Compares baseline surveys of water quality and/or isotope composition to differentiate between new (injected) CO2 and pre-existing CO2 at that site. CO2 movement can be detected by monitoring chemical changes in the reservoir fluids, in particular changes in bicarbonate ion levels in the fluid.
Subsurface pressure Formation pressure Annulus pressure Groundwater aquifer pressure
Controlling formation pressure below fracture gradient Determining wellbore and injection tubing condition Controlling physical leakage out of the storage formation
Injection pressure tests and production tests can be applied in wells to determine permeability, the presence of barriers in reservoir, and assess the ability of caprock to retain fluids.
Well logs Brine salinity Sonic velocity CO2 saturation Cement integrity Injection profiles Tracer detection Temperature profiles
Tracking CO2 movement in and above storage formation Tracking migration of brine into shallow aquifers Calibrating seismic velocities for 3D seismic surveys
Widely used to characterize hydrocarbon reservoirs. Well logs can measure many parameters, including the condition of the well, the identity of pore fluids, estimation of water chemistry based on conductivity measurements, and mineralogy of the formation. Data can be used to track migration of CO2 and brine in the reservoir and to ensure that the well itself does not provide a physical leakage pathway for CO2 migration. The resolution of well logs may not be sufficient to detect very small rates of physical leakage through microcracks.
9 Reference: Table 5.4 of IPCC Special Report on Carbon Dioxide Capture and Storage, 2005.
Section 6. Geological Storage Emission Reduction Project Family
June 2007 16
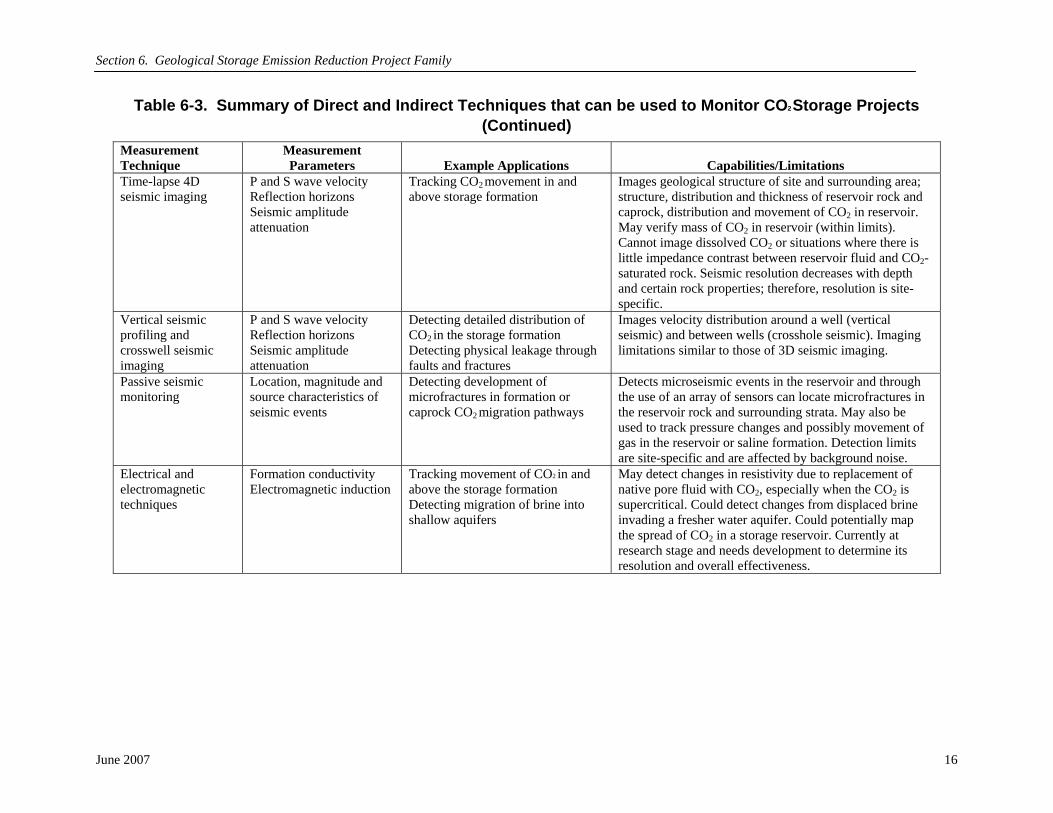
Table 6-3. Summary of Direct and Indirect Techniques that can be used to Monitor CO2 Storage Projects (Continued)
Measurement Technique
Measurement Parameters Example Applications Capabilities/Limitations
Time-lapse 4D seismic imaging
P and S wave velocity Reflection horizons Seismic amplitude attenuation
Tracking CO2 movement in and above storage formation
Images geological structure of site and surrounding area; structure, distribution and thickness of reservoir rock and caprock, distribution and movement of CO2 in reservoir. May verify mass of CO2 in reservoir (within limits). Cannot image dissolved CO2 or situations where there is little impedance contrast between reservoir fluid and CO2- saturated rock. Seismic resolution decreases with depth and certain rock properties; therefore, resolution is site-specific.
Vertical seismic profiling and crosswell seismic imaging
P and S wave velocity Reflection horizons Seismic amplitude attenuation
Detecting detailed distribution of CO2 in the storage formation Detecting physical leakage through faults and fractures
Images velocity distribution around a well (vertical seismic) and between wells (crosshole seismic). Imaging limitations similar to those of 3D seismic imaging.
Passive seismic monitoring
Location, magnitude and source characteristics of seismic events
Detecting development of microfractures in formation or caprock CO2 migration pathways
Detects microseismic events in the reservoir and through the use of an array of sensors can locate microfractures in the reservoir rock and surrounding strata. May also be used to track pressure changes and possibly movement of gas in the reservoir or saline formation. Detection limits are site-specific and are affected by background noise.
Electrical and electromagnetic techniques
Formation conductivity Electromagnetic induction
Tracking movement of CO2 in and above the storage formation Detecting migration of brine into shallow aquifers
May detect changes in resistivity due to replacement of native pore fluid with CO2, especially when the CO2 is supercritical. Could detect changes from displaced brine invading a fresher water aquifer. Could potentially map the spread of CO2 in a storage reservoir. Currently at research stage and needs development to determine its resolution and overall effectiveness.
Section 6. Geological Storage Emission Reduction Project Family
June 2007 17
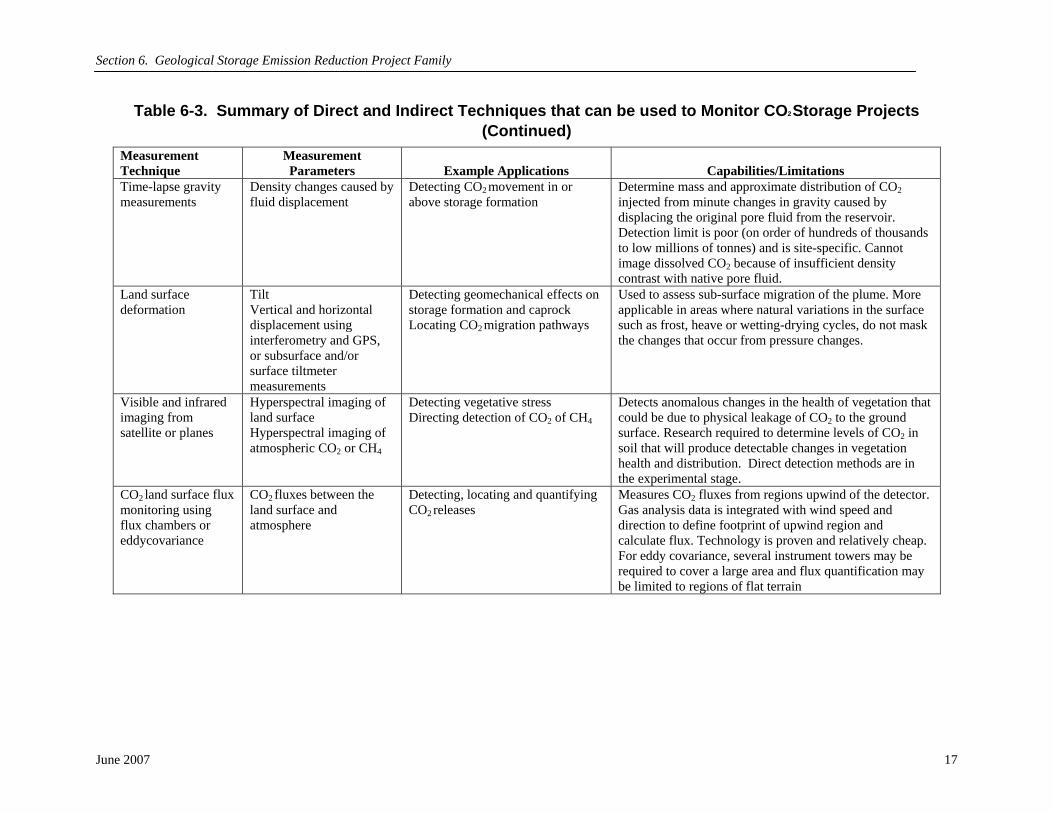
Table 6-3. Summary of Direct and Indirect Techniques that can be used to Monitor CO2 Storage Projects (Continued)
Measurement Technique
Measurement Parameters Example Applications Capabilities/Limitations
Time-lapse gravity measurements
Density changes caused by fluid displacement
Detecting CO2 movement in or above storage formation
Determine mass and approximate distribution of CO2 injected from minute changes in gravity caused by displacing the original pore fluid from the reservoir. Detection limit is poor (on order of hundreds of thousands to low millions of tonnes) and is site-specific. Cannot image dissolved CO2 because of insufficient density contrast with native pore fluid.
Land surface deformation
Tilt Vertical and horizontal displacement using interferometry and GPS, or subsurface and/or surface tiltmeter measurements
Detecting geomechanical effects on storage formation and caprock Locating CO2 migration pathways
Used to assess sub-surface migration of the plume. More applicable in areas where natural variations in the surface such as frost, heave or wetting-drying cycles, do not mask the changes that occur from pressure changes.
Visible and infrared imaging from satellite or planes
Hyperspectral imaging of land surface Hyperspectral imaging of atmospheric CO2 or CH4
Detecting vegetative stress Directing detection of CO2 of CH4
Detects anomalous changes in the health of vegetation that could be due to physical leakage of CO2 to the ground surface. Research required to determine levels of CO2 in soil that will produce detectable changes in vegetation health and distribution. Direct detection methods are in the experimental stage.
CO2 land surface flux monitoring using flux chambers or eddycovariance
CO2 fluxes between the land surface and atmosphere
Detecting, locating and quantifying CO2 releases
Measures CO2 fluxes from regions upwind of the detector. Gas analysis data is integrated with wind speed and direction to define footprint of upwind region and calculate flux. Technology is proven and relatively cheap. For eddy covariance, several instrument towers may be required to cover a large area and flux quantification may be limited to regions of flat terrain

Section 6. Geological Storage Emission Reduction Project Family
June 2007 18
Table 6-3. Summary of Direct and Indirect Techniques that can be used to Monitor CO2 Storage Projects (Continued)
Measurement Technique
Measurement Parameters Example Applications Capabilities/Limitations
Soil gas sampling Soil gas composition Isotopic analysis of CO2
Detecting elevated levels of CO2
Identifying source of elevated soil gas CO2
Evaluating ecosystem impacts
Measures CO2 levels and fluxes in soil using probes, commonly hammered in soil to a depth of 50-100 cm. Soil gas is drawn up through probe and analyzed. A range of gases may be measured; ratios of other gases and isotopes can provide clues to origin of CO2. Useful for detailed measurements, especially around detected low flux physical leakage points. Accuracy depends on well established levels of background flux and its variation. Surveying large areas may be time consuming and costly.
Excerpted from Table A5.1 of the Draft 2006 IPCC Guidelines for National Greenhouse Gas Inventories, Chapter 5, page 5.24.
Section 6. Geological Storage Emission Reduction Project Family
June 2007 19
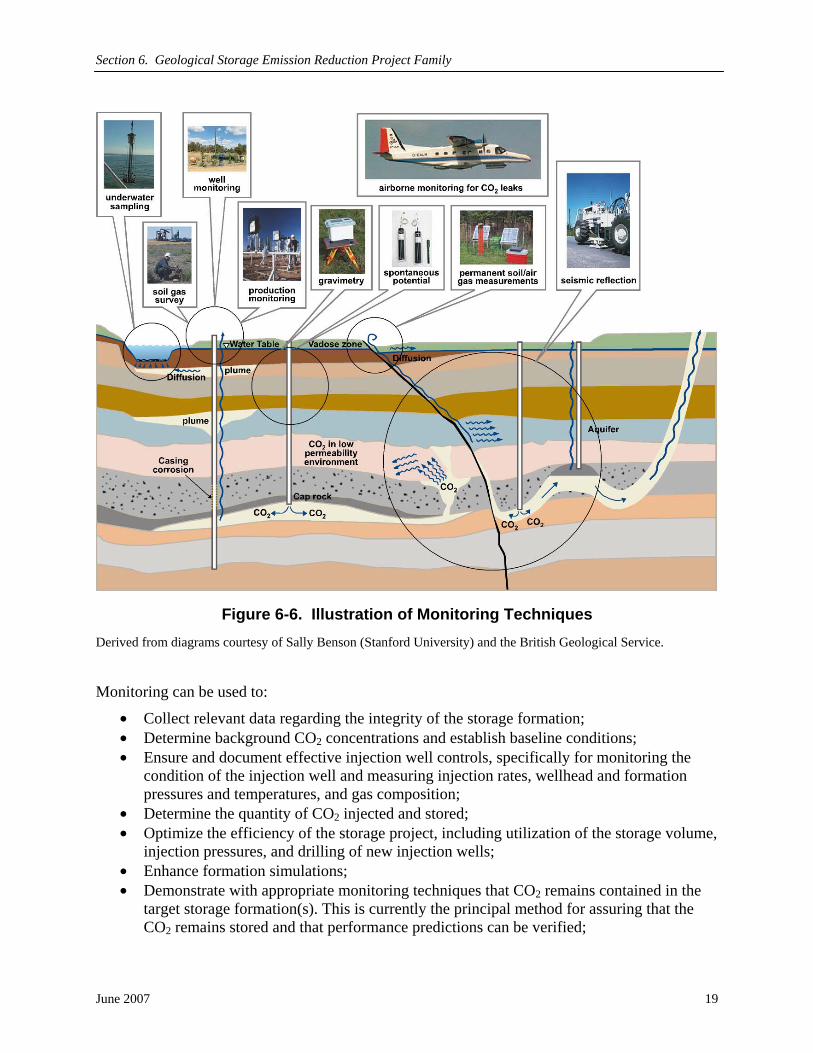
Figure 6-6. Illustration of Monitoring Techniques
Derived from diagrams courtesy of Sally Benson (Stanford University) and the British Geological Service.
Monitoring can be used to:
• Collect relevant data regarding the integrity of the storage formation; • Determine background CO2 concentrations and establish baseline conditions; • Ensure and document effective injection well controls, specifically for monitoring the
condition of the injection well and measuring injection rates, wellhead and formation pressures and temperatures, and gas composition;
• Determine the quantity of CO2 injected and stored; • Optimize the efficiency of the storage project, including utilization of the storage volume,
injection pressures, and drilling of new injection wells; • Enhance formation simulations; • Demonstrate with appropriate monitoring techniques that CO2 remains contained in the
target storage formation(s). This is currently the principal method for assuring that the CO2 remains stored and that performance predictions can be verified;

Section 6. Geological Storage Emission Reduction Project Family
June 2007 20
• Maintain operations, such as injection pressure, at or below any limits imposed by regulatory agencies on the storage of CO2, particularly in regard to reservoir and caprock integrity;
• Periodically investigate the entire assessment boundary to confirm the absence of unpredicted leaks;
• Detect physical leakage out of the storage formation and provide an early warning of any physical leakage that might require mitigation; and
• Identify the need for changes in operation or remedial activities to avoid physical leakage out of the storage formation.
The captured stream would include CO2, and in addition may include associated substances derived from the process that produced the CO2 and/or from the separation process. The associated substances may have some impact on monitoring activities to ensure that the captured, transported, injected and stored stream is within limits likely to be set by regulatory agencies.
Section 2 of the Project Guidelines (IPIECA and API, 2007) provides general monitoring guidance for emission reduction projects. For CCS operations, monitoring is an iterative risk-based process, utilizing information from ongoing assessments of characteristics that are specific to a particular CCS project. As a result, monitoring plans should be developed on a case-by-case basis to manage potential risks for the specific CCS application. These may include: Health, Safety, and Environmental (HSE) purposes (worker and public safety; minimization of local environmental impacts to the groundwater and ecosystems; and net isolation from the atmosphere); storage operation performance (in target migration); and physical leakage detection in time to modify the operating parameters. A risk-based monitoring approach applies risk assessment techniques to identify the key potential risks of physical leakage for the specific project. Then appropriate monitoring techniques are identified to manage the risks and demonstrate performance against the monitoring plan. Monitoring should continue to evolve with improved technologies, new information, and ongoing risk management.
6.7.2 Monitoring Methods
As depicted in Figure 6-6, a variety of monitoring methods are available for CCS. Many are well established in the oil and natural gas industry sector from EOR activities, and others are developing to better address CCS. Table 6-3 addresses the capabilities and limitations of the current monitoring methods. The suitability and efficacy of these technologies can be strongly influenced by the geology and potential emission pathways at individual storage sites. Ultimately the monitoring program for CO2 storage projects should be tailored to the specific conditions and potential risks at the storage site (i.e., fit for purpose), and may include a combination of measurements, modeling, and estimation techniques.
The following subsections address monitoring activities for the complete chain of CCS activities. However, public risk perception and the drivers for a policy framework and regulatory conditions for approving CCS projects rest primarily on demonstrating that the injected CO2 will be sealed from the atmosphere and will not adversely impact other subsurface resources. Therefore, monitoring techniques associated with storage are discussed in more detail.
Section 6. Geological Storage Emission Reduction Project Family
June 2007 21
6.7.3 Emissions Monitoring
The following subsections describe methods for monitoring the emissions associated with each step of the CCS process chain. In terms of emissions monitoring, many of the methodologies provided in the API Compendium are appropriate for estimating baseline emissions and quantifying project emissions. Where multiple methodologies are available, selection should consider the costs of collecting data or measuring emissions versus the materiality of the emission source and the requirements of the climate change regime or GHG registry.
Capture
Monitoring emissions associated with CO2 capture can be accomplished using available technology (e.g., metered fuel or electricity consumption rates, metered gas flow rates). The total CO2 that could potentially be emitted in the absence of the project can be determined through a carbon balance of the large stationary sources. This quantity establishes the baseline emissions for the capture facility. For the project, the difference between the total CO2 generated and the quantity captured reflects the performance of the capture technology.
Transport
Technologies for monitoring the volume of gas transported (by pipeline, marine vessel, railcar or tanker truck) are well established. Losses during pipeline transport can be estimated from the established procedures (e.g., the API Compendium). Key operating parameters for GHG emission sources used during transport (e.g., compressor engines, dehydration equipment) can be monitored using appropriate metering equipment, estimation techniques, and other recognized methods. Transport losses can be quantified from records of maintenance/emergency releases and operational practices that result in releases.
Storage
For storage, monitoring is conducted both for determining emissions as well as for risk assessment, avoidance and mitigation (discussed in Section 6.7.4). In general, there are three phases for monitoring a geological storage site: pre-operational, operational, and closure monitoring.
Pre-operational Evaluation
It is essential to have a reasonably detailed understanding of background emissions and conditions at or near the surface prior to injection. Site characterization and monitoring plans should identify possible sources of emissions outside the site including natural (e.g., lateral migration, groundwater) and anthropogenic (industrial and associated facilities) sources. Naturally occurring fluxes of CO2, on diurnal, seasonal, and annual cycles must be identified to distinguish naturally occurring CO2 from what is injected, as well as other background noise around the site that may mask a physical leak or seepage signal. In addition, the pre-operational evaluation should assess the presence and condition of existing and abandoned wells as potential pathways for leakage.

Section 6. Geological Storage Emission Reduction Project Family
June 2007 22
Operational Monitoring
The amount of CO2 injected into the storage site, the condition of the injection well(s), wellhead pressures, and formation pressures and temperatures are important basic operational parameters to monitor and to control the injection process (e.g., to prevent excess pore fluid pressure building up in the reservoir). Petroleum industry experience suggests that physical leakage from the injection well itself, resulting from improper completion or deterioration of the casing, packers or cement, is one of the most significant areas of potential leakage for injection projects (IPCC, 2005).
Figure 6-6 and Table 6-3 illustrate and summarize a variety of monitoring techniques currently available and applicable to CCS operations. The applicability of these techniques is site-specific and selection among these options requires an understanding of the site-specific characteristics and risks, as well as the measurement limitations.
Closure Monitoring
Closure monitoring refers to the long-term monitoring of the geological storage site after completing CO2 injection. Many of the measurement techniques shown in Figure 6-6 apply to long-term monitoring, as well as operational monitoring.
6.7.4 Monitoring for Storage Risk Management
Monitoring to manage the potential risk of leakage involves the use of one or more monitoring techniques and procedures tailored to the storage site and comparison with reservoir simulations to interpret the monitoring results. The three phases for monitoring a geological storage site – pre-operational, operational, and closure monitoring – are discussed separately below.
Pre-operational Evaluation
Monitoring for risk management begins with characterizing and selecting an appropriate geological formation, and establishing baseline conditions prior to injecting CO2. Carbon dioxide can remain trapped under ground by virtue of a number of trapping mechanisms, such as:
• Physical trapping (trapping below an impermeable, confining layer (caprock)); • Capillary trapping (retention in an immobile phase, trapped in the pores spaces of the
storage formation); • Mineralization (precipitation as a carbonate material); • Solubility trapping (dissolution in fluids already present in the formation); and • Adsorption onto organic matter in coal and shale.
Various techniques can be used to assess the availability of these trapping mechanisms and the characteristics of the prospective storage site, particularly capacity and injectivity.
Another goal of site characterization is to identify the features, events and processes that could result in physical leakage from the storage reservoir. These include the identification and characterization of potential physical leakage pathways such as faults, fractures, and existing wells (active, inactive, or abandoned), and quantification of hydrogeological properties, particularly with respect to CO2 migration. Proper site characterization and selection can help

Section 6. Geological Storage Emission Reduction Project Family
June 2007 23
build confidence that there should be minimal risk of physical leakage; improve modeling capabilities, results, and accuracy; and ultimately reduce the level of monitoring needed.
Techniques developed for the exploration, development, production, and management of oil and natural gas reservoirs, natural gas storage sites, acid gas injection locations, and liquid waste disposal sites are potentially suitable for characterizing geological storage sites for CO2. Before selecting a site, the subsurface conditions must be characterized to predict the following to a satisfactory level:
• The overlying caprock will provide an effective seal; • Faults contacted are unlikely to reactivate; • Existing fractures will not re-open; • Storage capacity is sufficient; • Permeable distribution is suitable for both injection and in-target migration; • Trapping mechanisms (capillary, solubility and mineralization) are effective; and • New and existing wells will not compromise the integrity of the seal.
Many of the parameters that can be used to monitor a storage project do not directly indicate the presence of CO2. Instead it is the changes in these parameters over time that can be used to detect and track migration of CO2 and its reaction products. For these reasons, it is important to have a well-defined baseline that includes not only the average value of these parameters, but also how they vary in space and time before the project begins. Precise determination of proportions of CO2 stored by various mechanisms or lost from the target zone may not be achievable, but the principal objective of monitoring should be to detect anomalies in time for intervention.
Baseline determination methods that may provide useful risk management data include the following:
• Any seismic testing that provides information on the size and acoustic properties of the reservoir;
• Any geophysical or geochemical testing that may have been performed on the reservoir and that may help in establishing its mechanical and chemical integrity;
• Any history in the number and types of wells that have penetrated the target reservoir, including their status (e.g., active, suspended, abandoned), well condition, and the abandonment technique used;
• Geological mapping and interpretation based on well logs for wells that have penetrated the target reservoir;
• Gas composition and isotopic analysis of any background fluxes of CO2, which is useful for distinguishing between natural (biogenic or thermogenic), anthropogenic and injected CO2; and
• Sampling and analysis of in-situ fluids (oil, gas, brine). Some of these methods are also useful for gathering emissions data.
Section 6. Geological Storage Emission Reduction Project Family
June 2007 24
Operational Monitoring
Periodically monitoring the distribution of CO2 in the subsurface, whether directly (e.g., logging of, or sampling and analysis from observation wells), indirectly (e.g., seismic or using other compounds in the gas as tracers for monitoring the CO2) or remotely (e.g., aerial or satellite anomalies), provides valuable information on reservoir characteristics and the fate of the CO2 in the near and longer term. Monitoring data also provide information needed to update the modeling/simulation and risk assessment processes by providing calibration points for predictions in the early and interim years, which can help build confidence in the longer-term predictions. A successful history match, or agreement between reservoir simulations and monitoring data, may be used to validate the project and justify monitoring program scale-back and eventual field decommissioning.
Computer programs that model underground CO2 movement are useful for supporting site characterization and selection activities, as well as operational and long-term monitoring. Many of the physicochemical factors involved (changes in temperature and pressure, mixing of the injected gas with the fluids initially present in the reservoir, the type and rate of CO2 immobilization mechanisms, and fluid flow through the geological environment) can be modeled successfully with numerical modeling tools generally known as reservoir simulators. These programs are widely used in the oil and natural gas industry, and have proven effective in predicting the movement of gases and liquids, including CO2, through geological formations. Reservoir simulations can be useful tools in identifying or predicting potential pathways for physical leakage and are continuing to evolve for CCS applications. Their application, coupled with risk management and other operational data, can be used to focus both operational and long-term monitoring.
Computer models need to be updated and new simulations should be run based on new monitoring data as a project proceeds. Experience from the monitoring exercise and availability of new monitoring techniques may result in the need to modify the monitoring methods during the course of the project. As a result, monitoring methods cannot be pre-defined for the life span of the project, and are best developed for specific applications by operators with knowledge of the geological formation’s characteristics and experience in the applicability and limitations of the techniques available. How to examine and determine monitoring techniques and methodologies would be described in the monitoring plan.
Closure Monitoring
Determining, on a long-term basis, how the injected CO2 is performing and interacting with the subsurface containment is an important aspect of risk management for a CCS project. A closure monitoring program should be based on information collected and modeling conducted during the project period. Modeling coupled with risk assessment studies can predict the long-term fate of the injected CO2 and help assure that the storage containment capability conforms to the acceptance criteria. This information then can be used to select and implement appropriate closure monitoring methods at high-risk locations.
Section 6. Geological Storage Emission Reduction Project Family
June 2007 25
The operator’s responsibilities for reporting, and if needed, remediation activities will normally be defined on the basis of the permit or other authorization needed to inject CO2 for storage purposes. It may be appropriate to decrease the frequency of (or discontinue) monitoring post-injection based on demonstrating that monitoring data are consistent with reservoir simulations. There are continuing discussions about the extent to which liabilities for the project could potentially be transferred to the public (as represented by national authorities) after the abandonment and the post-injection monitoring period.
6.7.5 Remediation
Although CCS projects will be selected and operated to avoid physical leakage, there exists a small possibility that physical leakage with risk of adverse consequences may occur and remediation methods will be needed, either to stop the leak or to prevent/minimize impacts. As with risk management, remediation planning is another element that contributes to assurance of long-term CO2 storage.
Physical leakage scenarios and applicable remediation options have been identified based on surveys of practices used to remediate natural gas storage projects, groundwater and soil contamination, and disposal of liquid wastes in deep geological formations. Additional details on potential physical leakage scenarios and the available remediation options are provided in the IPCC Special Report on Carbon Capture and Storage (IPCC, 2005).
Should physical leakage occur, net emission reductions should account for these emissions. The monitoring techniques presented in Table 6-3 and Figure 6-6 address the advantages and complexities of different methods available to detect physical leakage and determine the extent of emissions associated with such leakage.
6.8 Reporting and Documentation Section 2 of the General Project Guidelines provides the following high-level objectives for emission reduction reporting and documentation:
• Provide sufficient transparency to enable the intended audience to make an informed decision on the credibility of the emission reduction;
• Provide a plausible and transparent account of the project, decisions, and assumptions; and
• Maintain supporting documentation. These general principles also apply to reporting for CCS projects.
Additional reporting requirements may be specified for a particular climate change regime or GHG registry. IPCC’s 2006 guidelines for national inventories (IPCC, 2006) suggests documenting and reporting the following:
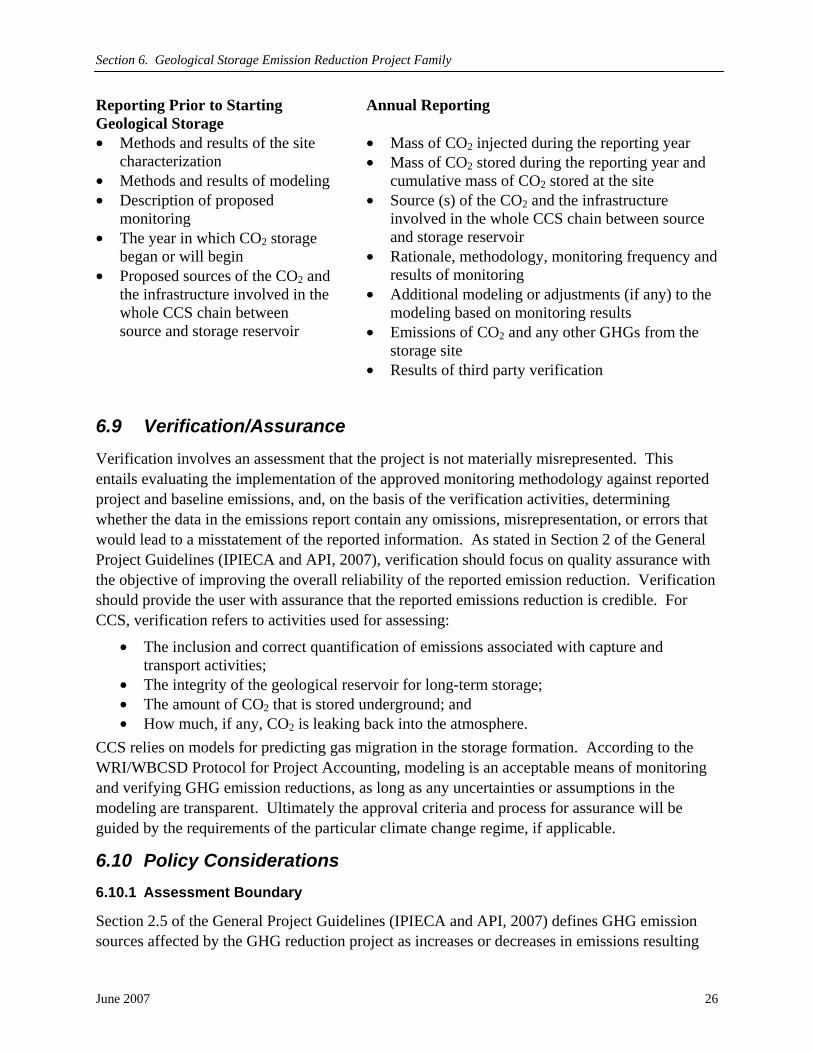
Section 6. Geological Storage Emission Reduction Project Family
June 2007 26
Reporting Prior to Starting Geological Storage
Annual Reporting
• Methods and results of the site characterization
• Methods and results of modeling • Description of proposed
monitoring • The year in which CO2 storage
began or will begin • Proposed sources of the CO2 and
the infrastructure involved in the whole CCS chain between source and storage reservoir
• Mass of CO2 injected during the reporting year • Mass of CO2 stored during the reporting year and
cumulative mass of CO2 stored at the site • Source (s) of the CO2 and the infrastructure
involved in the whole CCS chain between source and storage reservoir
• Rationale, methodology, monitoring frequency and results of monitoring
• Additional modeling or adjustments (if any) to the modeling based on monitoring results
• Emissions of CO2 and any other GHGs from the storage site
• Results of third party verification
6.9 Verification/Assurance Verification involves an assessment that the project is not materially misrepresented. This entails evaluating the implementation of the approved monitoring methodology against reported project and baseline emissions, and, on the basis of the verification activities, determining whether the data in the emissions report contain any omissions, misrepresentation, or errors that would lead to a misstatement of the reported information. As stated in Section 2 of the General Project Guidelines (IPIECA and API, 2007), verification should focus on quality assurance with the objective of improving the overall reliability of the reported emission reduction. Verification should provide the user with assurance that the reported emissions reduction is credible. For CCS, verification refers to activities used for assessing:
• The inclusion and correct quantification of emissions associated with capture and transport activities;
• The integrity of the geological reservoir for long-term storage; • The amount of CO2 that is stored underground; and • How much, if any, CO2 is leaking back into the atmosphere.
CCS relies on models for predicting gas migration in the storage formation. According to the WRI/WBCSD Protocol for Project Accounting, modeling is an acceptable means of monitoring and verifying GHG emission reductions, as long as any uncertainties or assumptions in the modeling are transparent. Ultimately the approval criteria and process for assurance will be guided by the requirements of the particular climate change regime, if applicable.
6.10 Policy Considerations 6.10.1 Assessment Boundary
Section 2.5 of the General Project Guidelines (IPIECA and API, 2007) defines GHG emission sources affected by the GHG reduction project as increases or decreases in emissions resulting

Section 6. Geological Storage Emission Reduction Project Family
June 2007 27
from changes in market demand or supply for associated products or services, or through physical displacement of products or services. Other climate change regimes may refer to these as “leakage”10 or “secondary effects.”
Where CO2 capture and storage is associated with EOR, ECBM, or EGR operations, the reduction of CO2 emissions through long-term storage in geological reservoirs occurs in conjunction with increased oil or natural gas production. The increased production resulting from EOR provides an economic incentive for early action to reduce GHG emissions by offsetting a portion of the costs required to capture, transport, inject, and monitor the CO2. Additional GHG emissions that result from the combustion of oil or natural gas produced from EOR, ECBM, and/or EGR operations occur outside the direct control of the project proponent. The extent and detail to which these emissions are included in the assessment boundary are policy decisions of the GHG registries and climate change regimes, and their treatment is beyond the scope of these guidelines.
6.10.2 Eligibility
In some regimes, CCS projects may not be eligible as candidate emissions reduction projects. Also in some regimes, the eligibility of a project as a candidate for emissions reduction credits may depend on the financial viability of the project without the revenues from the sale of Certified Emission Reductions (CERs). This may be the situation for a new EOR or ECBM project. However, for an existing EOR or ECBM project, the project developer may need to demonstrate that the project is not a financially attractive investment even with the increased oil production or methane production.
6.10.3 Ownership
Because CCS involves the physical transport of CO2, ownership of the CO2 can change and multiple parties may be involved in the operation or control of the different elements of the CCS chain. Several parties may use the same geological structure/formation for storing their individual streams of CO2 or for hydrocarbon production, and all the parties may face joint and separate responsibilities. These situations complicate the allocation of benefits (i.e., GHG reductions) and responsibilities, as well as the assignment of potential liability for possible emissions from the formation. Ultimately, discussions and agreements related to responsibilities, liability, contractual obligations, etc., between the parties would be described in agreements between the parties or as part of the conditions for permit decisions.
10 It should be noted here that the term “leakage” in this context refers to “secondary” emissions that are accounted as part of a climate change regime or GHG registry requirements, as opposed to physical leakage (escape) of CO2 from a geologic storage site that is considered in a risk assessment framework (Bachu and Celia, 2006). To clearly differentiate between the two, the term “physical leakage” is used throughout this document to refer to the escape of CO2 to from the storage formation to the atmosphere.
Section 6. Geological Storage Emission Reduction Project Family
June 2007 28
6.11 Project Examples Attachment 1 provides three examples of CCS projects to illustrate the steps of project definition, baseline scenario determination, project assessment boundary and emission source determination, emission reduction calculation, and assessment of monitoring methods. These hypothetical examples are developed from the types of CCS activities that petroleum companies are conducting to demonstrate the application of guidelines for quantifying GHG reductions. The approaches, emission factors, and assumptions used in these examples reflect the decision process by a fictional project proponent based on the defined conditions, and do not universally apply in all situations.
6.12 Conclusions Key messages related to CCS for reducing GHG emissions are:
• CO2 capture and storage (CCS) offers significant potential for reducing GHG emissions. Through new technologies for capturing CO2 from exhaust streams, CCS could play a key role in providing affordable energy while minimizing CO2 emissions to the atmosphere.
• The entire CCS chain – capture, transport, injection and storage – must be considered in assessing and ensuring the integrity of GHG emission reductions associated with CCS project.
• Existing oil and natural gas industry experience and expertise provide a basis for and confidence in CCS. This experience and further demonstrations of CCS projects will highlight best practices, increase alignment among experts, and assist in building broad understanding and public acceptance.
• Growing industry experience with CCS can be used to develop an overall approach to managing geological storage and reducing the risk of unintended physical leakage or other failures. Appropriate site selection, operation, and monitoring are all components of a risk management approach.
• Good practices in monitoring are especially important for CCS to be a safe and secure GHG emission reduction option. Monitoring should be based on a site-specific risk assessment, with monitoring methods appropriate to the identified potential risks.
6.13 References Bachu, S. “Sequestration of CO2 in geologic media: criteria and approach for site selection in response to climate change.” Energy Conservation and Management, 41:954, 2000.
Bachu, S. and M.A. Celia. “Assessing the potential for CO2 leakage, particularly through wells, from geologic storage sites.” The Science of CO2 Storage (B.J. McPherson and E. Sundquist, eds.), AGU Monograph Series, American Geographic Union, Washington D.C., 2006.
Heinrich, Jason J., Howard J. Herzog, and David M. Reiner. “Environmental Assessment of Geologic Storage of CO2” Massachusetts Institute of Technology, Laboratory for Energy and the Environment, Presented at the Second National Conference on Carbon Sequestration, Washington, DC, May 5-8, 2003.
Section 6. Geological Storage Emission Reduction Project Family
June 2007 29
International Energy Agency (IEA). Energy Technology Analysis, “Prospects for CO2 Capture and Storage.” IEA and Organization for Economic Cooperation and Development (OECD), 2004. http://www.iea.org/textbase/nppdf/free/2004/prospects.pdf http://www.iea.org/textbase/nppdf/free/2004/prospects.pdf
International Energy Association (IEA), “Report on Monitoring Workshop.” Organized by IEA Greenhouse R&D Programme and BP with the support of EPRI and the US DOE/NETL, Seymour Center, University of California Santa Cruz, November 8-9, 2004.
Intergovernmental Panel on Climate Change (IPCC). Draft 2006 IPCC Guidelines for National Greenhouse Gas Inventories. Chapter 5: Carbon Dioxide Transport, Injection and Geological Storage, March 2006.
Intergovernmental Panel on Climate Change (IPCC). IPCC Special Report on Carbon Dioxide Capture and Storage. Prepared by Working Group III of the Intergovernmental Panel on Climate Change [Metz, B., O. Davidson, H. C. de Coninck, M. Loos, and L. A. Meyer (eds.)]. Cambridge University Press, Cambridge, United Kingdom and New York, NY, USA, 2005.
International Petroleum Industry Environmental Conservation Association (IPIECA). Carbon Dioxide Capture and Geological Storage: Contributing to Climate Change Solutions. Summary Brochure, IPIECA Workshop, Brussels, Belgium, 21-22 October 2003.
International Petroleum Industry Environmental Conservation Association (IPIECA) and American Petroleum Institute (API). Oil and Natural Gas Industry Guidelines for Greenhouse Gas Reduction Projects, March 2007.
Interstate Oil and Gas Compact Commissions (IOGCC). Carbon Capture and Storage – A Regulatory Framework for the States. IOGCC CO2 Geological Sequestration Task Force, Kevin Bliss, editor. Prepared under DOE Contract No. DE-FC26-03NT41994, January 2005.
“OGJ Special – Worldwide production.” Oil & Gas Journal, pp. 126-157, December 24, 2001.
OSPAR Commission. “OSPAR Convention for the Protection of the Marine Environment of the North East Atlantic.” Meeting of the Biodiversity Committee, BDC 06/5/9-E(L), Trondheim, 13-17 March 2006.
World Business Council for Sustainable Development (WBCSD) and World Resources Institute (WRI). The Greenhouse Gas Protocol: The GHG Protocol for Project Accounting, November 2005.
6.14 Glossary
CCS Process Chain Refers to the series of processes to collect a CO2 gas stream, transport the CO2 to a storage location, and inject the CO2 into a geological formation for long-term isolation from the atmosphere.
Capillary trapping

Section 6. Geological Storage Emission Reduction Project Family
June 2007 30
Water preferentially adheres to the surface of the reservoir rocks over CO2. If there is enough saline water within a pore (75-90% of the pore volume), it will form a capillary plug that traps the CO2 within the pore space.
Leakage In the context of GHG reduction projects, leakage is used to describe the displacement of GHG emissions beyond the assessment boundary of the project.
Physical Leakage Refers to the flow of CO2 from the storage site to other places in the ground or to the atmosphere or ocean.
Migration The movement of CO2 out of the geological storage site while remaining in the same geological formation.
31
Attachments to Section 6: Carbon Capture and Geological Storage Emission Reduction Project Family9
9 All of the project case studies in this attachment are hypothetical examples developed from the types of CCS activities that petroleum companies are conducting for the purpose of demonstrating the application of guidelines for quantifying GHG reductions. The approaches, emission factors, and assumptions used in these examples reflect the decision process by a fictional project proponent based on the defined conditions, and do not universally apply in all situations.

Section 6. Geological Storage Emission Reduction Project Family
June 2007 32
ATTACHMENT 1 CCS PROJECT CASE STUDY #1: CARBON CAPTURE AND
STORAGE FOR ENHANCED OIL RECOVERY
Project Definition Description of the Project Activity
The purpose of this project is to recover carbon dioxide (CO2) emitted from a natural gas processing facility and inject it into an oil production field for enhanced oil recovery (EOR). The project proponent is a Joint Venture Partner in the EOR operations, but does not own or operate the gas processing facility or the CO2 transport operations. A schematic diagram of the project activity is shown in Figure 6-7.
Figure 6-7. Project Illustration of CO2 Capture, Transport and Injection for Enhanced Oil Recovery Operations
Recycle CO2compression
Produced HCs
Recycled CO2
meter
CO2 compression and dehydration
Recycled CO2
Gas Processing Facility
Produced HCs
m et er
Natural Gas
Captured CO2
GHG emissions due to energy consumption
CO2 Process Vents & Fugitive Emissions
EOROperations
Injected CO2
Produced HCs
CO2 Process Vents & Fugitive Emissions
GHG emissions due to energy consumption
Recovered S
HC and CO2Separation
Capture
Transport
Storage
Pum p CO2Process Vents & Fugitive Emissions
Project emissions
Process additions resulting from the project
Legend
Assessment Boundary
CO2Process Vents & Fugitive EmissionsRecycle CO2
compression
Produced HCs
Recycled CO2
meter
CO2 compression and dehydration
Recycled CO2
Gas Processing Facility
Produced HCs
m et er
Natural Gas
Captured CO2
GHG emissions due to energy consumption
CO2 Process Vents & Fugitive Emissions
EOROperations
Injected CO2
Produced HCs
CO2 Process Vents & Fugitive Emissions
GHG emissions due to energy consumption
Recovered S
HC and CO2Separation
Capture
Transport
Storage
Pum p CO2Process Vents & Fugitive Emissions
Project emissions
Process additions resulting from the project
Legend
Assessment Boundary
CO2Process Vents & Fugitive Emissions
Section 6. Geological Storage Emission Reduction Project Family
June 2007 33
This project involves the following:
• The CO2 stream separated from the natural gas and hydrogen sulfide (H2S) is captured and routed to compression/dehydration units. These activities and the increased energy requirements associated with them are shown within the assessment boundary, but may physically be located within the gas processing facility.
• Composition of the captured gas is 98.4 percent CO2, and 1.6 percent methane (CH4) by volume.
• The recovered CO2 is compressed using multiple engine-driven compressors and electric-driven pumps to transport the CO2 stream 32 km (20 miles) to the oil production field and inject it into the reservoir for EOR. Facility fuel and electricity usage records, and CO2 metering records indicate that, on an annual basis, 31.7×10⁶ m3 (1.12×10⁹ scf) of fuel gas and 17.35×10¹² J (4.82 GW-hr) of electricity are consumed at the compression/pump and metering facilities to compress 510×106 m3 (18 Bscf) CO2 that is captured from the gas plant.
• Crude and associated gas produced from the EOR operations are sent to a central processing facility. CO2 contained in the associated gas is separated through an amine unit, compressed, and re-injected into the EOR process, thereby recycling the CO2 back into the reservoir.
• The captured, anthropogenic CO2 from the gas processing facility replaces underground-sourced CO2 used for tertiary oil recovery.
Assumptions for this example include the following:
• The injection of CO2 for EOR is planned for the foreseeable future of the reservoir. • Common practice in the area is to purchase the underground-sourced CO2 for EOR
operations. • For the gas processing facility, venting the exhaust from the amine unit is common practice,
as allowed under the terms of existing regulations in the facility location. • Common practice for the EOR operation is to capture and recycle the CO2 produced from the
EOR production wells.
Reservoir Background
The geological formation for this project is not prone to significant tectonic activity, earthquakes or proximity to active volcanism, which could pose the potential for accidental, rapid escape of stored CO2 to the atmosphere. Through petroleum exploration and production operations, the geology and hydrogeology of the reservoir are well understood and documented. These properties make storage of CO2 in this reservoir a viable long-term option and minimize the potential of an accidental release as a result of natural occurrences.
Baseline Scenario Selection Baseline Candidates Considered
The baseline scenario represents the situation or conditions that plausibly would have occurred in the absence of the project. For this example, there are three aspects to the baseline scenario:
1) The disposition of the CO2 associated with the gas processing facility; 2) The source of the CO2 used for EOR; and

Section 6. Geological Storage Emission Reduction Project Family
June 2007 34
3) The disposition of the CO2 produced from the EOR production wells in the CO2-flooded field.
Plausible candidates for each of these aspects of the baseline scenario are identified in Table 6-4 below.
Table 6-4. Case Study #1 Baseline Candidates
Potential Baseline Candidates for the Disposition of the CO2 from the Gas
Processing Facility
Potential Baseline Candidates Associated with the CO2 used for
EOR
Potential Baseline Candidates for the
Disposition of the CO2 from the EOR wells
Candidate 1: Continuation of the current situation, where the natural gas plant receives gas produced from surrounding fields and processes it to remove and separate H2S and CO2. The removed CO2 is released to the atmosphere. Candidate 2: The project activity, CO2 is separated from the acid gas stream, captured, and utilized for EOR, EGR, ECBM, or to maintain reservoir pressure in another formation. Candidate 3: CO2 is separated from the acid gas stream, captured, and utilized in another capacity, for example soft drink production or chemical manufacturing. Candidate 4: CO2 is separated from the acid gas stream, captured, and reinjected into the same hydrocarbon reservoir (oil or gas) from which it was produced. Candidate 5: CO2 is separated from the acid gas stream, captured, and injected into a saline aquifer.
Candidate A: Continuation of the current situation, where underground-sourced CO2 is produced with necessary processing to result in a pipeline quality CO2 stream, and transported for EOR operations.10 Candidate B: The project activity, where captured CO2 replaces the underground-sourced CO2. This candidate requires the installation of compression and pipeline facilities to transport the captured CO2 from the natural gas plant to the EOR location. Candidate C: The EOR operations locate another source of anthropogenic CO2, such as combustion exhaust streams or industrial processes Candidate D: EOR is achieved by the injection of natural gas, N2, or water.
Candidate I: CO2 produced from EOR production wells in a CO2-flooded field is vented to the atmosphere. Candidate II: The project activity, CO2 produced from EOR production wells in a CO2-flooded field is recycled to EOR operations.
All candidates comply with applicable regulations. In addition, the baseline candidates reflect due consideration of the time frame and geological criteria discussed in Section 2.4 of the General Project Guidelines.
Baseline Scenario
Table 6-5 applies some common tests or screening procedures to assist in assessing the baseline candidates.
10 The use of naturally occurring, underground-sourced CO2 for enhanced hydrocarbon recovery is not, in and of itself, a GHG emission reduction project.

Section 6. Geological Storage Emission Reduction Project Family
June 2007 35
Table 6-5. Case Study #1 Baseline Scenario Assessment Baseline Scenario
Alternatives Investment
Ranking Technology Policy/
Regulatory Benchmarking
Dis
posi
tion
of th
e C
O2 f
rom
the
Gas
Pro
cess
ing
Faci
lity
Candidate 1: Current situation - CO2 removed from the acid gas is released to the atmosphere
No additional costs No additional technology requirements
Consistent with current, applicable laws or regulations
Common practice in region11
Candidate 2: CO2 is separated from the acid gas stream, captured, and utilized for EOR, EGR, ECBM, or to maintain reservoir pressure in a hydrocarbon formation
Moderate costs for capture infrastructure; Moderate to high costs for transport
Existing technologies
Commercial in some regions
Candidate 3: CO2 is separated from the acid gas stream, captured, and utilized in another capacity
Moderate costs for capture infrastructure; Moderate to high costs for transport. Uncertain market for CO2
Existing technologies
Commercial in some regions
Candidate 4: CO2 is separated from the acid gas stream, captured, and reinjected into the same hydrocarbon reservoir from which it was produced
Moderate costs for capture infrastructure; Lower transport costs than candidates 2 and 3
Existing technologies
Commercial in some regions
Candidate 5: CO2 is separated from the acid gas stream, captured, and injected into a saline aquifer.
Moderate costs for capture infrastructure; Moderate to high costs for transport
Existing technologies
Commercial in some regions
CO
2 use
d fo
r E
OR
Candidate A: Current situation - underground-sourced CO2 is produced and transported for EOR operations
No additional costs No additional technology requirements
Consistent with current, applicable laws or regulations
Common practice in region
Candidate B: The project activity - captured CO2 replaces underground-sourced CO2
Moderate to high costs for capture and transport infrastructure
Existing technologies
Commercial in some regions
Candidate C: The EOR operations locate another source of anthropogenic CO2, such as combustion exhaust streams or industrial processes
Moderate to very high costs for capture infrastructure; Moderate to high costs for transport
Existing technologies for some applications
Commercial in some regions, though applications capturing CO2 from exhaust streams are limited
11 Depending on the circumstances of the project, the region or geographic area may be narrow (e.g., an area within a nation or state), or broad (e.g., an international region or global area).
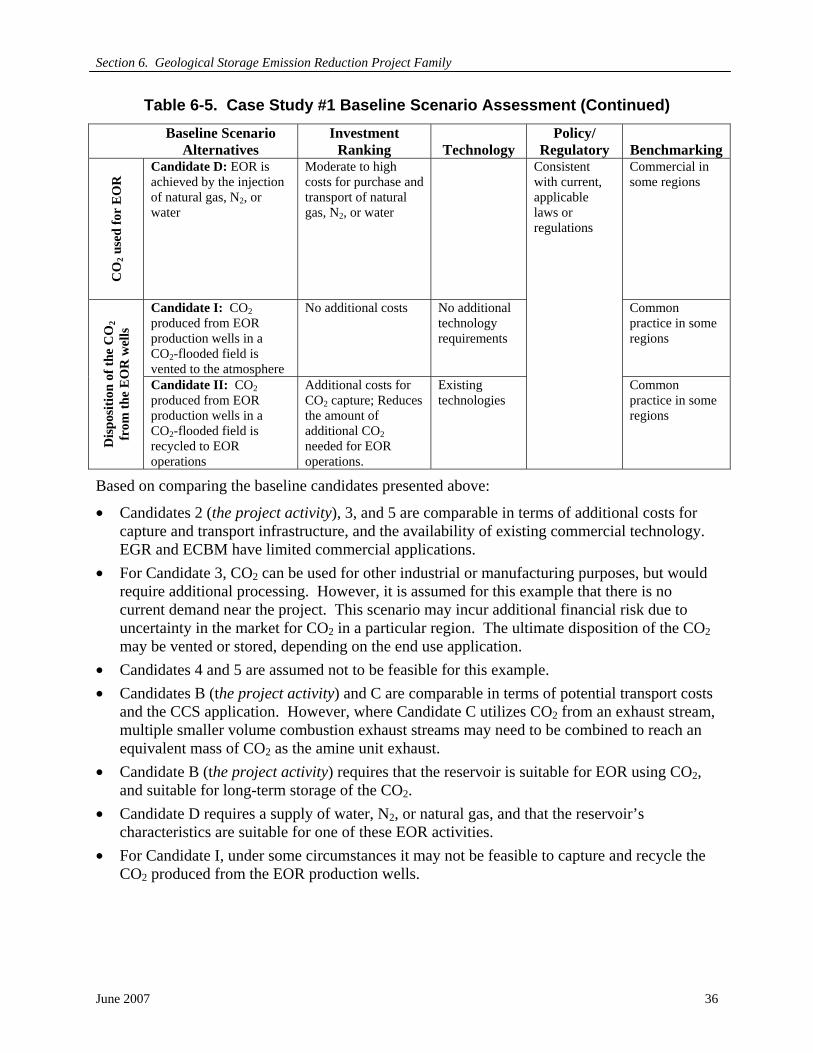
Section 6. Geological Storage Emission Reduction Project Family
June 2007 36
Table 6-5. Case Study #1 Baseline Scenario Assessment (Continued) Baseline Scenario
Alternatives Investment
Ranking Technology Policy/
Regulatory Benchmarking
CO
2 use
d fo
r E
OR
Candidate D: EOR is achieved by the injection of natural gas, N2, or water
Moderate to high costs for purchase and transport of natural gas, N2, or water
Consistent with current, applicable laws or regulations
Commercial in some regions
Dis
posi
tion
of th
e C
O2
from
the
EO
R w
ells
Candidate I: CO2 produced from EOR production wells in a CO2-flooded field is vented to the atmosphere
No additional costs No additional technology requirements
Common practice in some regions
Candidate II: CO2 produced from EOR production wells in a CO2-flooded field is recycled to EOR operations
Additional costs for CO2 capture; Reduces the amount of additional CO2 needed for EOR operations.
Existing technologies
Common practice in some regions
Based on comparing the baseline candidates presented above:
• Candidates 2 (the project activity), 3, and 5 are comparable in terms of additional costs for capture and transport infrastructure, and the availability of existing commercial technology. EGR and ECBM have limited commercial applications.
• For Candidate 3, CO2 can be used for other industrial or manufacturing purposes, but would require additional processing. However, it is assumed for this example that there is no current demand near the project. This scenario may incur additional financial risk due to uncertainty in the market for CO2 in a particular region. The ultimate disposition of the CO2 may be vented or stored, depending on the end use application.
• Candidates 4 and 5 are assumed not to be feasible for this example. • Candidates B (the project activity) and C are comparable in terms of potential transport costs
and the CCS application. However, where Candidate C utilizes CO2 from an exhaust stream, multiple smaller volume combustion exhaust streams may need to be combined to reach an equivalent mass of CO2 as the amine unit exhaust.
• Candidate B (the project activity) requires that the reservoir is suitable for EOR using CO2, and suitable for long-term storage of the CO2.
• Candidate D requires a supply of water, N2, or natural gas, and that the reservoir’s characteristics are suitable for one of these EOR activities.
• For Candidate I, under some circumstances it may not be feasible to capture and recycle the CO2 produced from the EOR production wells.

Section 6. Geological Storage Emission Reduction Project Family
June 2007 37
As a result of this analysis, Candidates 1, A, and II, each representing the continuation of current activities, comprise the most probable baseline scenario.12 Carbon dioxide is vented in the baseline scenario for the gas processing portion of the project. For this example, the disposition of H2S in the produced natural gas does not matter because it is unchanged between the project and the baseline. The baseline scenario for the EOR operation portion of the project consists of the project proponent purchasing equivalent volumes (equal to metered volumes of captured vent-stack CO2 supplied for EOR purposes) from natural, underground-sourced CO2 sources, which are located approximately 80.5 km (50 miles) from the EOR operations. This natural CO2 is dehydrated and compressed using electric-driven compressors requiring 1.02×10⁵ J/m3 (802 kW-hr/MMscf) of compressed CO2 for pipeline transport to the EOR operations for this example. Crude and associated gas produced from the EOR operations are sent to a central processing facility. CO2 contained in the associated gas is separated through an amine unit, compressed, and combined with natural-sourced CO2 for re-injection into the EOR process. The baseline operations are illustrated in Figure 6-8.
Figure 6-8. Baseline Illustration of CO2 Capture, Transport and Injection for Enhanced Oil Recovery Operations
12 Baseline candidates and the analysis presented here are for illustrative purposes only. Actual project activities will require an assessment of the candidates and characteristics specific to the project application. Specific climate change regimes may require additional details and justification for baseline scenario determination.
Produced HCs
Vented CO2
Natural Gas
Gas Processing Facility
Recovered S
Recycle CO2compression
Produced HCs
Recycled CO2
meter
CO2 compression and dehydration
Recycled CO2
EOROperations
Injected CO2
Produced HCs
CO2 Process Vents & Fugitive Emissions
GHG emissions due to energy consumption
HC and CO2Separationmeter
GHG emissions due to energy consumption
CO2Production
Well
pump
Baseline emissionsLegend
CO2Process Vents & Fugitive Emissions
CO2 Process Vents & Fugitive
Emissions
Assessment Boundary
Produced HCs
Vented CO2
Natural Gas
Gas Processing Facility
Recovered S
Recycle CO2compression
Produced HCs
Recycled CO2
meter
CO2 compression and dehydration
Recycled CO2
EOROperations
Injected CO2
Produced HCs
CO2 Process Vents & Fugitive Emissions
GHG emissions due to energy consumption
HC and CO2Separationmeter
GHG emissions due to energy consumption
CO2Production
Well
pump
Baseline emissionsLegend
CO2Process Vents & Fugitive Emissions
CO2 Process Vents & Fugitive
Emissions
Assessment Boundary
Section 6. Geological Storage Emission Reduction Project Family
June 2007 38
Project Assessment Boundary After defining the project and identifying the baseline scenario, the next step is to determine the assessment boundary. The assessment boundary encompasses GHG emission sources, sinks, and reservoirs controlled by the project proponent that are related to the GHG reduction project, affected by the GHG reduction project, and relevant to the baseline scenario. Figures 6-7 and 6-8 illustrate the processes and operations within the assessment boundary for both the project activity and the baseline scenario, respectively. Table 6-6 examines potential emission sources within the assessment boundary and compares the baseline scenario to the project activity.
Table 6-6. Case Study #1 Assessment Boundary Determination
Potential Emission Sources
Relation to the Project Proponent Considerations
Baseline Scenario Capture CO2 and, to a lesser extent, CH4 emissions
from the amine unit exhaust at the gas plant Related
Vented and fugitive CO2 emissions associated with recovering CO2 from the underground-sourced source
Transport CO2, CH4, and N2O emissions from offsite electricity generation used to operate transport equipment
Related
Baseline scenario transport emissions are similar to the project activity and may cancel out depending on the difference in distance transported.
CO2, CH4, and N2O emissions from fuel combustion associated with transport equipment
Vented and fugitive CO2 emissions, associated with transport operations and equipment
Storage CO2, CH4, and N2O emissions from offsite electricity generation used for storage operations and equipment, including the recycle of CO2 from the associated gas.
Related
Baseline scenario storage and recycle emissions will likely cancel out the project-based emissions.
CO2, CH4, and N2O emissions from fuel combustion associated with storage operations and equipment, including the recycle of CO2 from the associated gas.
Vented and fugitive CO2 emissions, associated with storage operations and equipment, including the recycle of CO2 from the associated gas.
Controlled Controlled
Section 6. Geological Storage Emission Reduction Project Family
June 2007 39
Table 6-6. Case Study #1 Assessment Boundary Determination (Continued)
Potential Emission Sources
Relation to the Project Proponent Considerations
Project Activity Capture CO2 and, to a lesser extent, CH4 emissions
from the dehydration of the capture gas stream
CO2, CH4, and N2O emissions from fuel combustion associated with compressing the capture gas stream
CO2, CH4, and N2O emissions from offsite electricity used to operate capture equipment
Related
Transport CO2, CH4, and N2O emissions from offsite electricity used to operate transport equipment
Related Project-based transport emissions are similar to the baseline scenario and may cancel out depending on the difference in distance transported.
CO2, CH4, and N2O emissions from fuel combustion associated with transport equipment
Vented and fugitive CO2 emissions, associated with transport operations and equipment
Related
Storage CO2, CH4, and N2O emissions from offsite electricity generation used for storage operations and equipment
Related
Project-based storage and recycle emissions will likely cancel out the baseline scenario emissions.
CO2, CH4, and N2O emissions from fuel combustion associated with storage operations and equipment, including the recycle of CO2 from the associated gas
Vented and fugitive CO2 emissions, associated with storage operations and equipment, including the recycle of CO2 from the associated gas.
Controlled Controlled
Quantifying Emission Reductions The following exhibit demonstrates the emission estimation for the baseline scenario and project activity. Emission reductions are quantified as the difference between the baseline and project emissions.
EXHIBIT 6.1: Capture and Storage of Vent-Sourced CO2 Known Information (based on hypothetical, measured data) • Process: 510×106 m3 (18 ×109 scf) CO2 is captured from the gas plant for the year • Captured Gas Composition: 98.4 % CO2, 1.6 % CH4 by volume Energy Requirements: 31.7×10⁶ m3 (1,120 MMscf) of natural gas and 17.35×10¹² J (4.82 GW-hr) of electricity are consumed at the compression/pump and metering facilities to transport the capture gas 32 km (20 miles) to the EOR facility and inject it into the formation.
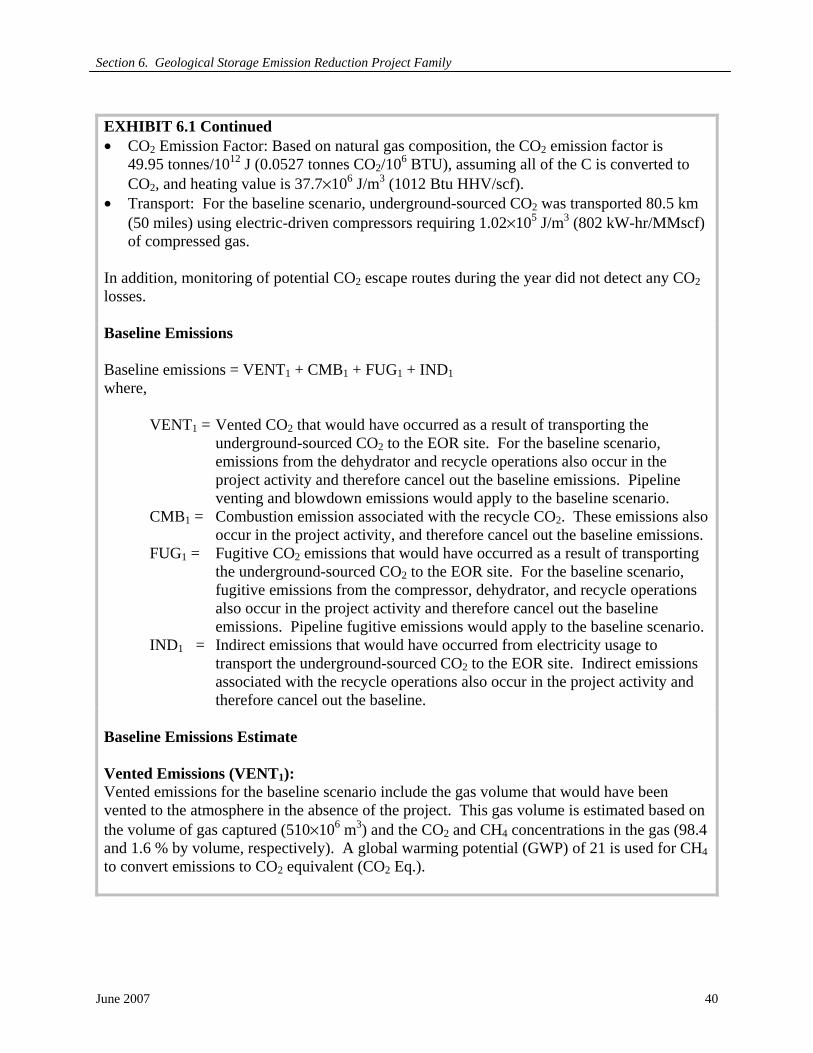
Section 6. Geological Storage Emission Reduction Project Family
June 2007 40
EXHIBIT 6.1 Continued • CO2 Emission Factor: Based on natural gas composition, the CO2 emission factor is
49.95 tonnes/1012 J (0.0527 tonnes CO2/106 BTU), assuming all of the C is converted to CO2, and heating value is 37.7×10⁶ J/m3 (1012 Btu HHV/scf).
• Transport: For the baseline scenario, underground-sourced CO2 was transported 80.5 km (50 miles) using electric-driven compressors requiring 1.02×10⁵ J/m3 (802 kW-hr/MMscf) of compressed gas.
In addition, monitoring of potential CO2 escape routes during the year did not detect any CO2 losses. Baseline Emissions Baseline emissions = VENT1 + CMB1 + FUG1 + IND1 where,
VENT1 = Vented CO2 that would have occurred as a result of transporting the
underground-sourced CO2 to the EOR site. For the baseline scenario, emissions from the dehydrator and recycle operations also occur in the project activity and therefore cancel out the baseline emissions. Pipeline venting and blowdown emissions would apply to the baseline scenario.
CMB1 = Combustion emission associated with the recycle CO2. These emissions also occur in the project activity, and therefore cancel out the baseline emissions.
FUG1 = Fugitive CO2 emissions that would have occurred as a result of transporting the underground-sourced CO2 to the EOR site. For the baseline scenario, fugitive emissions from the compressor, dehydrator, and recycle operations also occur in the project activity and therefore cancel out the baseline emissions. Pipeline fugitive emissions would apply to the baseline scenario.
IND1 = Indirect emissions that would have occurred from electricity usage to transport the underground-sourced CO2 to the EOR site. Indirect emissions associated with the recycle operations also occur in the project activity and therefore cancel out the baseline.
Baseline Emissions Estimate Vented Emissions (VENT1): Vented emissions for the baseline scenario include the gas volume that would have been vented to the atmosphere in the absence of the project. This gas volume is estimated based on the volume of gas captured (510×106 m3) and the CO2 and CH4 concentrations in the gas (98.4 and 1.6 % by volume, respectively). A global warming potential (GWP) of 21 is used for CH4 to convert emissions to CO2 equivalent (CO2 Eq.).
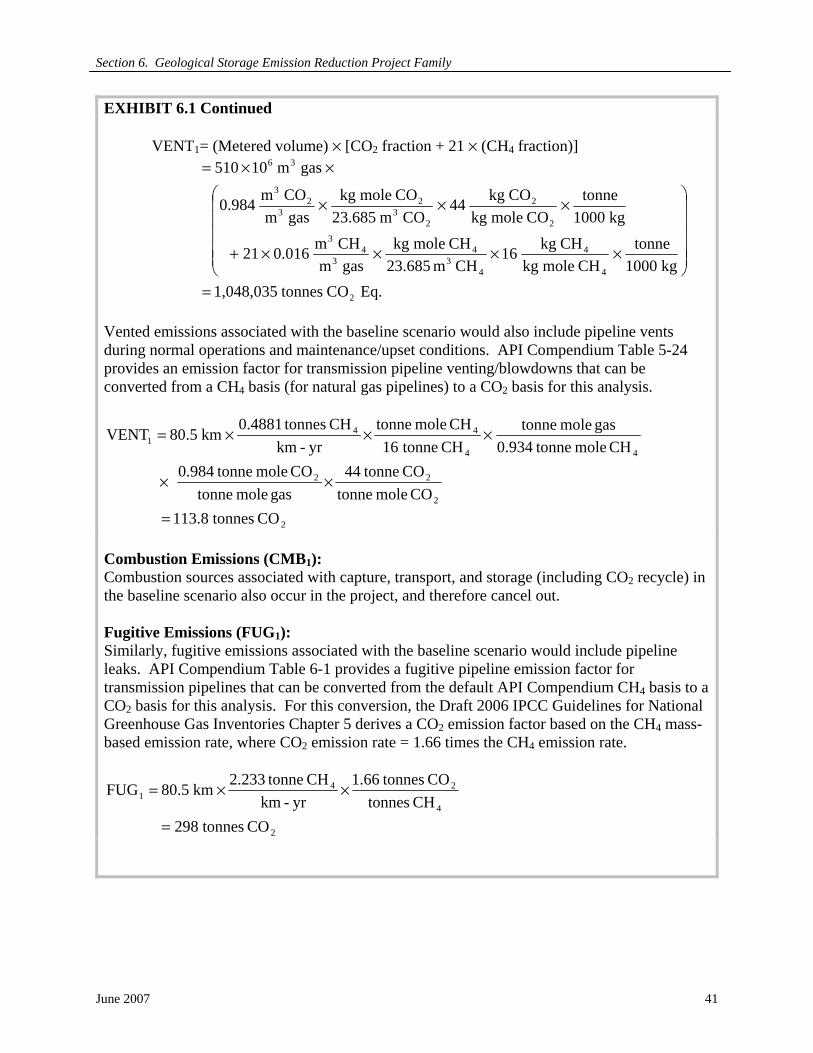
Section 6. Geological Storage Emission Reduction Project Family
June 2007 41
EXHIBIT 6.1 Continued VENT1= (Metered volume) × [CO2 fraction + 21 × (CH4 fraction)]
Eq.COtonnes1,048,035kg1000
tonneCHmolekg
CHkg16CH m 23.685
CHmolekggasm
CHm0.01621
kg1000tonne
COmolekgCOkg44
COm23.685COmolekg
gasmCOm0.984
gasm10510
2
4
4
43
43
43
2
2
23
23
23
36
=
⎟⎟⎟⎟⎟
⎠
⎞
⎜⎜⎜⎜⎜
⎝
⎛
××××+
×××
××=
Vented emissions associated with the baseline scenario would also include pipeline vents during normal operations and maintenance/upset conditions. API Compendium Table 5-24 provides an emission factor for transmission pipeline venting/blowdowns that can be converted from a CH4 basis (for natural gas pipelines) to a CO2 basis for this analysis.
2
2
22
44
441
CO tonnes8.113CO mole tonne
CO tonne44gas mole tonne
CO mole tonne0.984CH mole tonne0.934
gas mole tonneCH tonne16
CH mole tonneyr-km
CH tonnes4881.0km5.80VENT
=
××
×××=
Combustion Emissions (CMB1): Combustion sources associated with capture, transport, and storage (including CO2 recycle) in the baseline scenario also occur in the project, and therefore cancel out. Fugitive Emissions (FUG1): Similarly, fugitive emissions associated with the baseline scenario would include pipeline leaks. API Compendium Table 6-1 provides a fugitive pipeline emission factor for transmission pipelines that can be converted from the default API Compendium CH4 basis to a CO2 basis for this analysis. For this conversion, the Draft 2006 IPCC Guidelines for National Greenhouse Gas Inventories Chapter 5 derives a CO2 emission factor based on the CH4 mass-based emission rate, where CO2 emission rate = 1.66 times the CH4 emission rate.
2
4
241
CO tonnes298CH tonnes
CO tonnes1.66yr-km
CH tonne233.2km5.80FUG
=
××=

Section 6. Geological Storage Emission Reduction Project Family
June 2007 42
EXHIBIT 6.1 Continued Indirect Emissions (IND1): Emissions associated with the electricity used to transport the underground-sourced CO2 to the EOR facility are estimated based on the electricity demand for the volume of gas transported and regional electric generation emission factors. For the purpose of this example, the electricity emission factors for the (hypothetical, undefined) region associated with the underground-sourced CO2 are: 0.2425 tonnes CO2/109 J, 0.0016 tonnes CH4/1012 J, and 0.0036 tonnes N2O/1012 J. The total CO2 Eq. emissions are calculated using a GWP of 21 for CH4 and 310 for N2O.
J1002.52gasm
J 10 1.02gasm10510)(energyIND 123
536
1 ×=×××=
212
92 CO tonnes615,12J1002.52J10
tonnes2425.0emissionsCO =××=
412
124 CH tonnes0832.0J1002.52J 10
tonnes0016.0emissionsCH =××=
ON tonnes187.0J1002.52J 10
tonnes0036.0emissionsON 212
122 =××=
( )Eq.COtonnes12,675
ONtonnes0.187310)CHtonnes0.0832(21COtonnes12,615 IND
2
2
421
=×+
×+=
Baseline emissions = 1,048,035 + 113.8 + 298 + 12,675 = 1,061,122 tonnes CO2 Eq. Project Emissions Calculations Project emissions = VENT2 + CMB2 ++FUG2 + IND2 where,
VENT2 = Pipeline venting and blowdown emissions from transporting the CO2 to the EOR site. Note that dehydrator emissions also occur in the baseline scenario and therefore cancel out. Vented emissions associated with the recycle CO2 also occur in the baseline scenario, and therefore cancel out.
CMB2 = Combustion emissions from gas-fired compressors at the gas plant. Note that fuel usage to inject the CO2 into the EOR reservoir would also occur for the baseline scenario and therefore cancel out. Combustion emissions associated with the recycle CO2 also occur in the baseline scenario, and therefore cancel out.

Section 6. Geological Storage Emission Reduction Project Family
June 2007 43
EXHIBIT 6.1 Continued FUG2 = Pipeline fugitive CO2 emissions from transporting the CO2 to the EOR site.
Note that fugitive emissions from the compressor, dehydrator, and CO2 recycle operations also occur in the baseline scenario and therefore cancel out.
IND2 = Indirect emissions for electric-driven pumps used to transport the CO2 to the EOR site. Indirect emissions associated with the recycle CO2 also occur in the baseline scenario, and therefore cancel out.
Vented Emissions (VENT2): Vented emissions associated with the project include pipeline vents during normal operations and maintenance/upset conditions. API Compendium Table 5-24 provides an emission factor for transmission pipeline venting/blowdowns that can be converted from a CH4 basis (for natural gas pipelines) to a CO2 basis for this analysis. Note that the gas transported in the project contains a small amount of CH4.
22
22
44
442
CO tonnes3.45CO mole tonne
CO tonne44gas mole tonne
CO mole tonne0.984CH mole tonne0.934
gas mole tonneCH tonne16
CH mole tonnekm
CH tonne4881.0km32 EmissionsCO
=××
×××=
4
4
44
22
224
CH tonnes27.0CH mole tonne
CH tonne16gas mole tonne
CH mole tonne0.016CO mole tonne984.0
gas mole tonneCO tonnes44CO mole tonneCO tonnes3.45Emissions CH
=
××
××=
( )Eq. CO tonnes0.51
CH tonnes0.2721CO tonnes3.45 VENT
2
422
=×+=
Combustion emissions (CMB2): Project combustion emissions are calculated based on measured fuel consumption rates and fuel analysis data. Based on fuel analysis data, the CO2 emission factor in terms of thermal energy input is 49.95 tonnes/1012 J (0.0527 tonnes CO2/106 Btu) and the fuel heating value is 37.7×10⁶ J/m3 (1012.4 Btu/scf). The emission factor was conservatively estimated by assuming all the carbon in the fuel is converted to CO2 during the combustion process and discharged to the atmosphere, consistent with the API Compendium’s preferred approach.
Using this emission factor and the fuel usage, the annual CO2 emissions are calculated as:
2122
3636
2 COtonnes695,59J10
COtonne95.49
mJ107.37m107.31emissionsCO =××××=
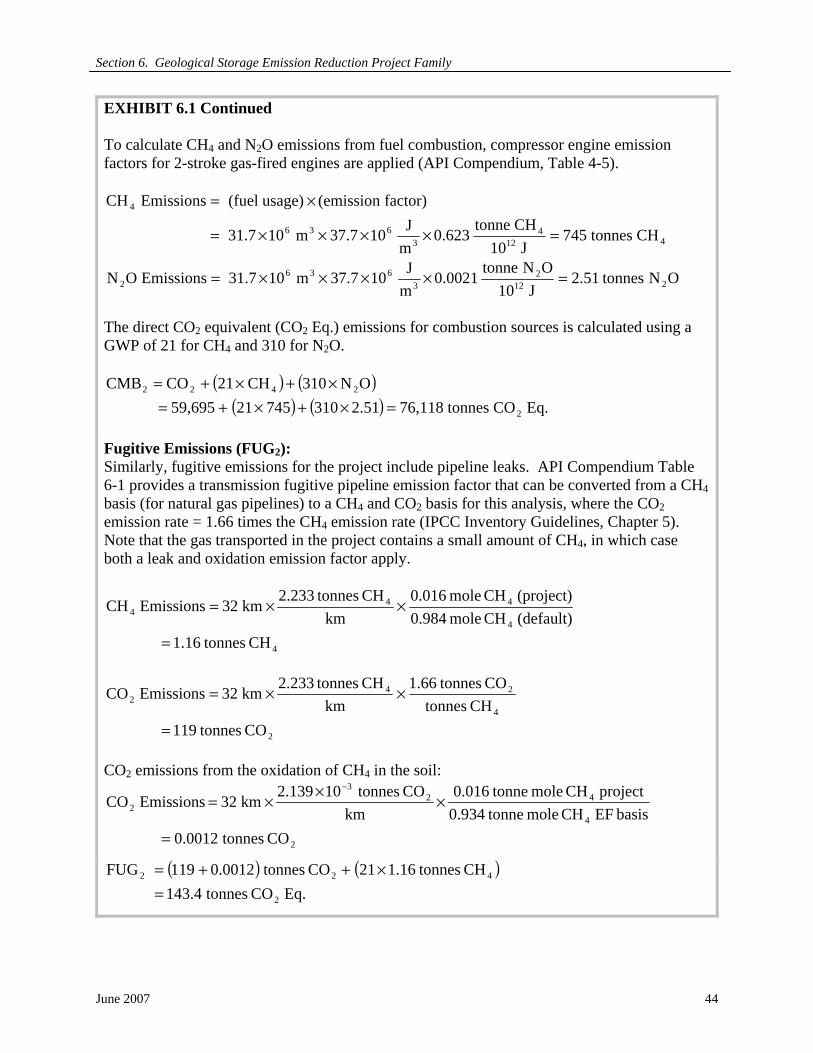
Section 6. Geological Storage Emission Reduction Project Family
June 2007 44
EXHIBIT 6.1 Continued To calculate CH4 and N2O emissions from fuel combustion, compressor engine emission factors for 2-stroke gas-fired engines are applied (API Compendium, Table 4-5).
4124
3636
4
CHtonnes745J10
CHtonne623.0mJ107.37m107.31
factor)(emissionusage)(fuelEmissionsCH
=××××=
×=
ONtonnes51.2J10
ONtonne0021.0mJ107.37m107.31EmissionsON 212
23
6362 =××××=
The direct CO2 equivalent (CO2 Eq.) emissions for combustion sources is calculated using a GWP of 21 for CH4 and 310 for N2O.
( ) ( )( ) ( ) Eq. COtonnes76,1182.513107452159,695
ON310CH21COCMB
2
2422
=×+×+=×+×+=
Fugitive Emissions (FUG2): Similarly, fugitive emissions for the project include pipeline leaks. API Compendium Table 6-1 provides a transmission fugitive pipeline emission factor that can be converted from a CH4 basis (for natural gas pipelines) to a CH4 and CO2 basis for this analysis, where the CO2 emission rate = 1.66 times the CH4 emission rate (IPCC Inventory Guidelines, Chapter 5). Note that the gas transported in the project contains a small amount of CH4, in which case both a leak and oxidation emission factor apply.
4
4
444
CH tonnes16.1(default) CH mole 0.984(project) CH mole 0.016
kmCH tonnes233.2km32Emissions CH
=
××=
2
4
242
CO tonnes119CH tonnes
CO tonnes1.66km
CH tonnes233.2km32Emissions CO
=
××=
CO2 emissions from the oxidation of CH4 in the soil:
2
4
423
2
CO tonnes0012.0basis EF CH mole tonne0.934
project CH mole tonne0.016km
CO tonnes10139.2km32 Emissions CO
=
××
×=−
( ) ( )Eq. CO tonnes4.143
CH tonnes16.121CO tonnes0012.0119 FUG
2
422
=×++=

Section 6. Geological Storage Emission Reduction Project Family
June 2007 45
EXHIBIT 6.1 Continued Indirect emissions (IND2) Indirect emissions (IND2) are calculated from regional emission factors [for the purpose of this example, the electricity emission factors for the (hypothetical, undefined) region associated with the underground-sourced CO2 are: 0.2425 tonnes CO2/109 J (0.873 tonnes CO2/MW-hr), 0.0016 tonnes CH4/1012 J (5.76E-6 tonnes CH4/MW-hr), and 0.0036 tonnes N2O/1012 J (1.311E-5 tonnes N2O/MW-hr)]. The indirect emissions represent the emissions due to the generation of electricity required to operate the pumping equipment and facilities associated with transporting the captured CO2 from the gas plant to the EOR site. These emissions are calculated from actual electricity usage data as reflected in the electric utility bills. The total CO2 Eq. emissions are calculated using a GWP of 21 for CH4 and 310 for N2O. Emissions = (emission factor) × (electrical usage)
212
92
2 COtonnes207,4J1035.17J10
COtonne0.2425EmissionsCO =××=
412
94
4 CHtonne0.028J1035.17J 10CHtonnes
0016.0EmissionsCH =××=
ONtonne0.063J1035.17J10
ONtonnes0036.0EmissionsON 212
92
2 =××=
( ) ( )
Eq. COtonnes,2274ON tonnes0.063310CH tonnes0.02821CO tonnes4,207 IND
2
2422
=×+×+=
Project emissions = VENT2 + CMB2 ++FUG2 + IND2 = 51.0 + 76,118+ 143.4 + 4,227 = 80,539 tonnes CO2 Eq. per year Emission Reductions = Baseline Emissions – Project Emissions = 1,061,122 – 80,539 = 980,583 tonnes CO2 Eq. per year
Monitoring As discussed in Section 6.7, monitoring for CCS is an iterative, risk-based process, utilizing information from ongoing assessments of characteristics that are specific to a particular CCS project. As a result, monitoring plans should be fit-for-purpose to manage potential risks for the specific CCS application.

Section 6. Geological Storage Emission Reduction Project Family
June 2007 46
The following outlines some potential monitoring activities that might be implemented for this type of GHG reduction project. These are provided for illustrative purposes for this example. Actual monitoring requirements depend on the specific project characteristics. In addition, particular climate change regimes may specify monitoring requirements.
Baseline Monitoring
For the baseline scenario, CO2 injection was already occurring for EOR. In addition, the reservoir was well characterized before and during the stages of oil production. Baseline monitoring information may include the following:
• Characterization of sub-surface conditions to determine the effectiveness of the trapping mechanisms and of the caprock to serve as a seal;
• Determination of storage capacity; • Characterization of permeable distribution for CO2 injection (not necessary for long-term
monitoring of CO2) and in targeted areas for migration for EOR; • Integrity of existing wells (active wells and abandoned wells); and • Identification of any other potential escape mechanisms. In assessing the reservoir’s ability to store CO2, seismic monitoring and simulation results were used to determine potential pathways for CO2 to escape and estimate the amount of CO2 that could escape from any identified routes.
Operational (Project) Monitoring
Monitoring methods were established to detect anomalies from any areas identified during the baseline period that indicated a risk for loss of containment. During the project’s operational phase, three types of monitoring are used:
1) Monitoring to determine the project activities emissions, 2) Monitoring of the movement of CO2 within the reservoir; and 3) Monitoring of areas of potential escape to demonstrate containment.
The example above demonstrates the type of measurement data needed to quantify the project activity’s emissions and reductions. The temperature and pressure of the reservoir are obtained through downhole monitoring, and are used to support reservoir simulations, as well as to ensure that the reservoir pressure does not adversely impact the caprock and that injection does not induce fractures in the reservoir formation. The amount of CO2 injected into the reservoir, the condition of the injection well(s), and wellhead pressures are additional monitoring data. The movement of the CO2 within the reservoir is monitored through sampling and analysis from observation wells. Since the reservoir contains some natural CO2 that is produced with the crude, a tracer gas can be added to the injected CO2 to distinguish it from the underground-sourced CO2. The containment of CO2 depends on the migration rate, path, and extent of the caprock. Baseline data established the areas of potential leaks. Monitoring methods specific to those areas are used to determine the ongoing containment of the reservoir. Here also, tracers may be used to distinguish the injected CO2 from underground-sourced CO2.

Section 6. Geological Storage Emission Reduction Project Family
June 2007 47
3D seismic surveys can be used to confirm that the injected CO2 behaves as expected, and/or can be conducted if/when the escape of CO2 is detected. Seismic survey data also support reservoir modeling, which can be used to examine the potential for CO2 leaks and to estimate the volume of any CO2 leaks.
Post-Injection Monitoring Emission reductions are not quantified after injection has ceased; however, adjustments and emissions will continue to be assessed and thus ongoing monitoring may be needed post-injection. Data collected during the injection phase will be used to determine the type and extent of monitoring after the production lifetime of the reservoir.

Section 6. Geological Storage Emission Reduction Project Family
June 2007 48
ATTACHMENT 1 CCS PROJECT CASE STUDY #2: GEOLOGICAL STORAGE
OF ACID GAS
Project Definition Description of the Project Activity
This project example is based on capture of acid gas from sour gas production (including sour associated gas during oil production), separation of the acid gas components (H2S and CO2) in a conventional acid gas removal process, and transport and re-injection of the acid gas in an abandoned reservoir. As a result, this project avoids CO2 emissions, as well as the need for sulfur recovery operations. A schematic diagram of the project activity is shown in Figure 6-9.
Figure 6-9. Project Illustration of Acid Gas Storage Operations
Sour Gas Processing Facility
Produced HCs
m et er
Sour Gas
Acid Gas (H2S/CO2)
GHG emissions due to energy consumption
Acid Gas Injection Operations
Injected Acid Gas (H2S/CO2)
Capture
Transport
Storage
Pum p
Abandoned Reservoir
FlareCO2 Process Vents & Fugitive Emissions
CO2 emission from Compressor Blowdowns
CO2compression
CO2emissions from Pipeline Vents
Combustion Emissions
Project emissions
Process additions resulting from the project
Legend
Assessment Boundary

Section 6. Geological Storage Emission Reduction Project Family
June 2007 49
This project involves the following:
• Capture of the exhaust stream from the sour gas processing unit regenerator. The composition of the captured gas in this example is taken to be 50% H2S, 45% CO2, 4% moisture, and 1% CH4 by volume, but is expected to vary from project to project. (Note that the separation of the acid gases [H2S and CO2] from the hydrocarbons in the produced gas occurs in the absence of the project.)
• Compression using multiple electric-driven compressors and pumps to transport the acid gases 16 km (10 miles) by pipeline.
• Injection of the acid gases into an abandoned reservoir. • Facility electricity usage and CO2 metering records indicate that, on an annual basis,
308×1012 J (85.6 GW-hr) of electricity is consumed at the compression/pump and metering facilities to compress 362×106 m3 (12.8 ×10⁹ scf) gas captured from the sour gas processing plant.
Reservoir Background
The geological formation for this project is suitable for storage. It is not prone to significant tectonic activity, earthquakes, or proximity to active volcanism, or other types of potential leaks of the stored gas. Since this reservoir formerly contained hydrocarbons that have been recovered, the geology and hydrogeology of the reservoir are well understood and documented. These properties make injection and storage of the acid gas in this reservoir a viable long-term option and minimize the potential of an accidental release as a result of natural occurrences.
Baseline Scenario Selection For this example, common practice for gas processing operations is assumed to consist of processing the H2S in the gas by conversion to elemental sulfur (Claus process) and venting the exhaust, mainly products of combustion, including CO2, to the atmosphere. Alternatively, the acid gas may be incinerated, which also results in venting the CO2 to the atmosphere.
Baseline Candidates Considered
The baseline scenario represents the situation or conditions that plausibly would have occurred in the absence of the project. Plausible candidates for the baseline scenario are presented in Table 6-7. To the extent possible, elements of the baseline candidates are aligned with corresponding aspects of the CCS chain.
Table 6-7. Case Study #2 Baseline Candidates Potential Baseline Candidates for the Disposition of the CO2
from the Gas Processing Facility (Capture)
Potential Baseline Candidates Associated with Transport
Potential Baseline Candidates Associated with the Ultimate
Disposition of the CO2 (Storage)
Candidate 1: Further processing of the acid gas stream in a sulfur plant to separate out the sulfur using a suitable process (e.g., Claus units).
Candidate 1: The sulfur separated from the acid gas stream would either be sold or transported offsite for disposal in the absence of a market for the product.
Candidate 1: The CO2 in the acid gas and additional CO2 generated from the process would be emitted to the atmosphere.

Section 6. Geological Storage Emission Reduction Project Family
June 2007 50
Table 6-7. Case Study #2 Baseline Candidates (Continued) Potential Baseline Candidates for the Disposition of the CO2
from the Gas Processing Facility (Capture)
Potential Baseline Candidates Associated with Transport
Potential Baseline Candidates Associated with the Ultimate
Disposition of the CO2 (Storage)
Candidate 2: The acid gas stream is combusted in incinerators. Some further processing may be required prior to incineration.
Candidate 2: There is no transport component for this baseline candidate.
Candidate 2: The products of combustion including SO2 and CO2 would be released to the atmosphere. Depending on regional SO2 regulations, a flue gas desulfurization (FGD) unit may be required to reduce SO2 emissions.
Candidate 3: The project activity, which includes capture of the exhaust stream from the sour gas processing unit regenerator.
Candidate 3: The project activity, Installation of compression equipment and pipeline infrastructure to transport the CO2 to the geological storage formation.
Candidate 3: The project activity, Installation of injection facilities for long-term storage of the acid gas stream (H2S and CO2) in an abandoned underground reservoir, deep saline formation, or other geological formation.
Candidate 4: Similar to Candidate 3, CO2 and H2S are removed from the natural gas stream.
Candidate 4: As with Candidate 3, this requires the installation of compression equipment and pipeline infrastructure to transport the CO2. The transport requirements and costs would likely be less than Candidate 3.
Candidate 4: Installation of injection facilities for long-term storage of the acid gas stream (H2S and CO2) in the same production reservoir from which they originated.
Candidate 5: CO2 is separated from the sour gas.
Candidate 5: May require compression, dehydration, and/or pipeline to deliver the CO2 to custody transfer.
Candidate 5: CO2 is utilized in another capacity, for example soft drink production or chemical manufacturing.
Candidate 6: CO2 is separated from the sour gas.
Candidate 6: Installation of compression equipment and pipeline infrastructure to transport the CO2 to the EOR, EGR, ECBM, or reservoir location.
Candidate 6: CO2 is used for EOR, EGR, ECBM, or to maintain reservoir pressure.
All of the baseline candidates comply with applicable regulations for this example.13
Baseline Scenario
Table 6-8 applies some common tests or screening procedures to assist in evaluating the baseline candidates.
Table 6-8. Case Study #2 Baseline Scenario Assessment Baseline Scenario
Alternatives Investment Ranking Technology Policy/
Regulatory BenchmarkingCandidate 1: Further processing in a sulfur plant
Moderate costs Existing technologies
Consistent with current, applicable laws or regulations in most regions. Sulfur disposition may be regulated.
Common practice in region
13 Note, acid gas injection is illegal in Australia.
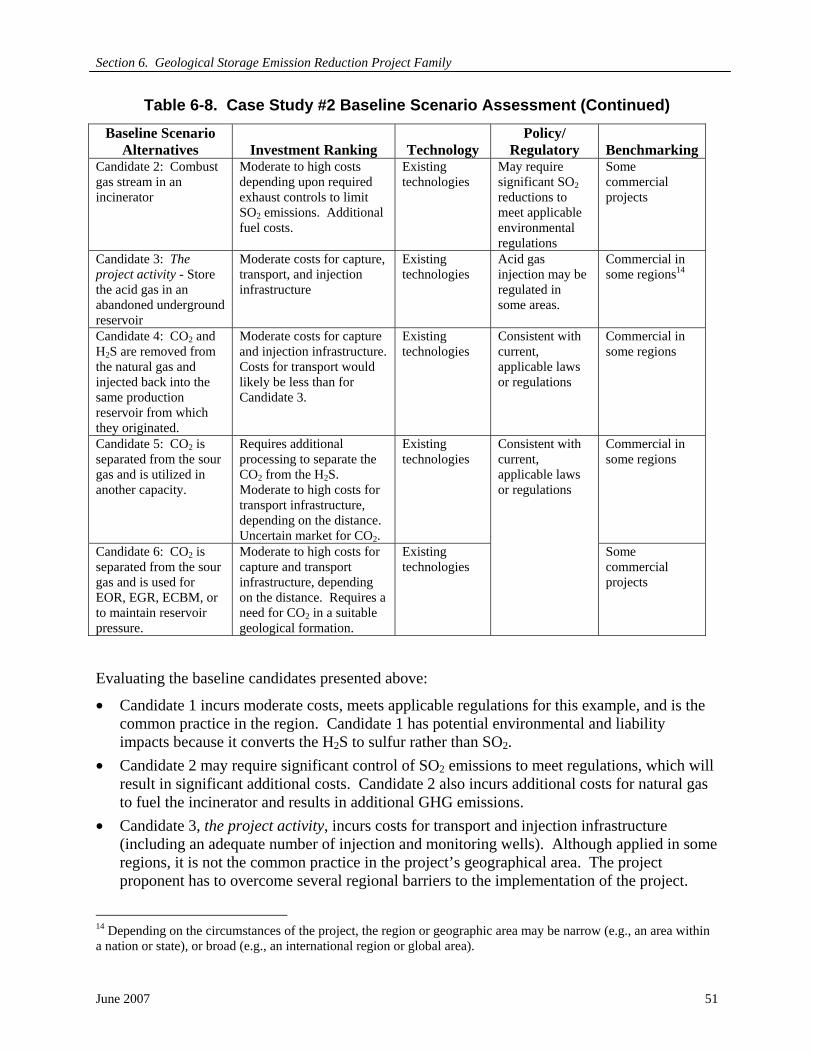
Section 6. Geological Storage Emission Reduction Project Family
June 2007 51
Table 6-8. Case Study #2 Baseline Scenario Assessment (Continued) Baseline Scenario
Alternatives Investment Ranking Technology Policy/
Regulatory BenchmarkingCandidate 2: Combust gas stream in an incinerator
Moderate to high costs depending upon required exhaust controls to limit SO2 emissions. Additional fuel costs.
Existing technologies
May require significant SO2 reductions to meet applicable environmental regulations
Some commercial projects
Candidate 3: The project activity - Store the acid gas in an abandoned underground reservoir
Moderate costs for capture, transport, and injection infrastructure
Existing technologies
Acid gas injection may be regulated in some areas.
Commercial in some regions14
Candidate 4: CO2 and H2S are removed from the natural gas and injected back into the same production reservoir from which they originated.
Moderate costs for capture and injection infrastructure. Costs for transport would likely be less than for Candidate 3.
Existing technologies
Consistent with current, applicable laws or regulations
Commercial in some regions
Candidate 5: CO2 is separated from the sour gas and is utilized in another capacity.
Requires additional processing to separate the CO2 from the H2S. Moderate to high costs for transport infrastructure, depending on the distance. Uncertain market for CO2.
Existing technologies
Consistent with current, applicable laws or regulations
Commercial in some regions
Candidate 6: CO2 is separated from the sour gas and is used for EOR, EGR, ECBM, or to maintain reservoir pressure.
Moderate to high costs for capture and transport infrastructure, depending on the distance. Requires a need for CO2 in a suitable geological formation.
Existing technologies
Some commercial projects
Evaluating the baseline candidates presented above:
• Candidate 1 incurs moderate costs, meets applicable regulations for this example, and is the common practice in the region. Candidate 1 has potential environmental and liability impacts because it converts the H2S to sulfur rather than SO2.
• Candidate 2 may require significant control of SO2 emissions to meet regulations, which will result in significant additional costs. Candidate 2 also incurs additional costs for natural gas to fuel the incinerator and results in additional GHG emissions.
• Candidate 3, the project activity, incurs costs for transport and injection infrastructure (including an adequate number of injection and monitoring wells). Although applied in some regions, it is not the common practice in the project’s geographical area. The project proponent has to overcome several regional barriers to the implementation of the project.
14 Depending on the circumstances of the project, the region or geographic area may be narrow (e.g., an area within a nation or state), or broad (e.g., an international region or global area).
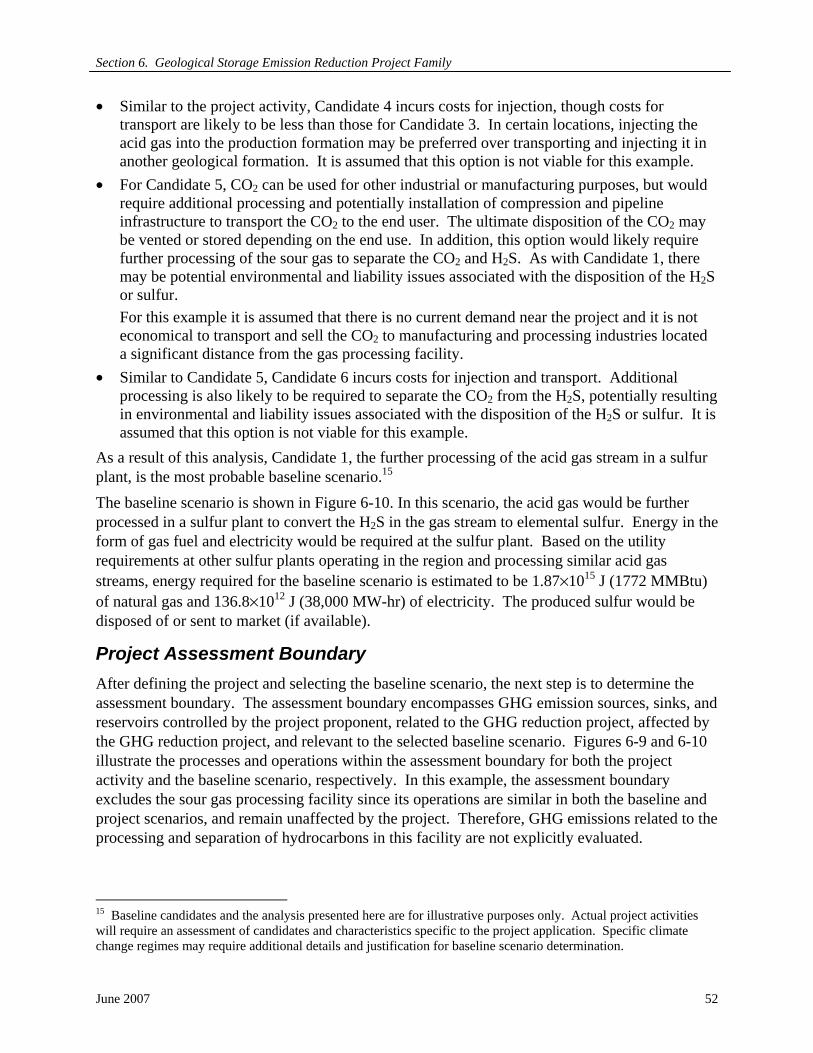
Section 6. Geological Storage Emission Reduction Project Family
June 2007 52
• Similar to the project activity, Candidate 4 incurs costs for injection, though costs for transport are likely to be less than those for Candidate 3. In certain locations, injecting the acid gas into the production formation may be preferred over transporting and injecting it in another geological formation. It is assumed that this option is not viable for this example.
• For Candidate 5, CO2 can be used for other industrial or manufacturing purposes, but would require additional processing and potentially installation of compression and pipeline infrastructure to transport the CO2 to the end user. The ultimate disposition of the CO2 may be vented or stored depending on the end use. In addition, this option would likely require further processing of the sour gas to separate the CO2 and H2S. As with Candidate 1, there may be potential environmental and liability issues associated with the disposition of the H2S or sulfur. For this example it is assumed that there is no current demand near the project and it is not economical to transport and sell the CO2 to manufacturing and processing industries located a significant distance from the gas processing facility.
• Similar to Candidate 5, Candidate 6 incurs costs for injection and transport. Additional processing is also likely to be required to separate the CO2 from the H2S, potentially resulting in environmental and liability issues associated with the disposition of the H2S or sulfur. It is assumed that this option is not viable for this example.
As a result of this analysis, Candidate 1, the further processing of the acid gas stream in a sulfur plant, is the most probable baseline scenario.15 The baseline scenario is shown in Figure 6-10. In this scenario, the acid gas would be further processed in a sulfur plant to convert the H2S in the gas stream to elemental sulfur. Energy in the form of gas fuel and electricity would be required at the sulfur plant. Based on the utility requirements at other sulfur plants operating in the region and processing similar acid gas streams, energy required for the baseline scenario is estimated to be 1.87×10¹⁵ J (1772 MMBtu) of natural gas and 136.8×10¹² J (38,000 MW-hr) of electricity. The produced sulfur would be disposed of or sent to market (if available).
Project Assessment Boundary After defining the project and selecting the baseline scenario, the next step is to determine the assessment boundary. The assessment boundary encompasses GHG emission sources, sinks, and reservoirs controlled by the project proponent, related to the GHG reduction project, affected by the GHG reduction project, and relevant to the selected baseline scenario. Figures 6-9 and 6-10 illustrate the processes and operations within the assessment boundary for both the project activity and the baseline scenario, respectively. In this example, the assessment boundary excludes the sour gas processing facility since its operations are similar in both the baseline and project scenarios, and remain unaffected by the project. Therefore, GHG emissions related to the processing and separation of hydrocarbons in this facility are not explicitly evaluated.
15 Baseline candidates and the analysis presented here are for illustrative purposes only. Actual project activities will require an assessment of candidates and characteristics specific to the project application. Specific climate change regimes may require additional details and justification for baseline scenario determination.
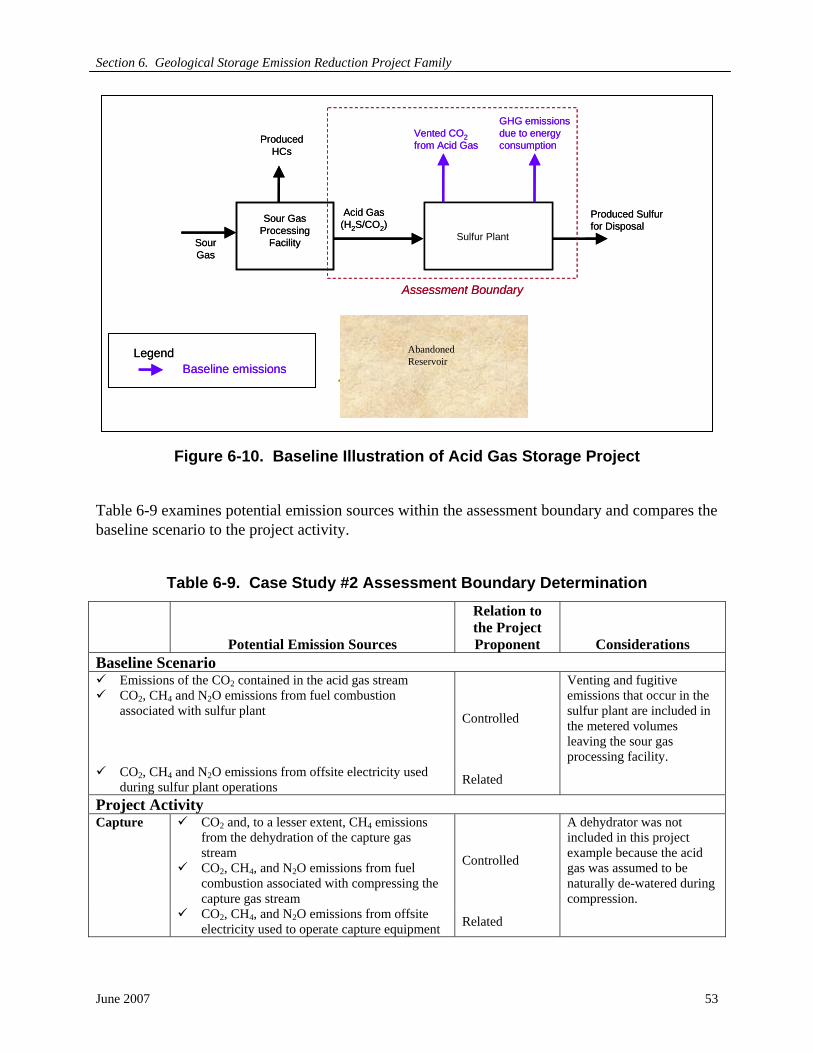
Section 6. Geological Storage Emission Reduction Project Family
June 2007 53
Figure 6-10. Baseline Illustration of Acid Gas Storage Project
Table 6-9 examines potential emission sources within the assessment boundary and compares the baseline scenario to the project activity.
Table 6-9. Case Study #2 Assessment Boundary Determination
Potential Emission Sources
Relation to the Project Proponent Considerations
Baseline Scenario Emissions of the CO2 contained in the acid gas stream CO2, CH4 and N2O emissions from fuel combustion
associated with sulfur plant Controlled
Venting and fugitive emissions that occur in the sulfur plant are included in the metered volumes leaving the sour gas processing facility.
CO2, CH4 and N2O emissions from offsite electricity used during sulfur plant operations Related
Project Activity Capture CO2 and, to a lesser extent, CH4 emissions
from the dehydration of the capture gas stream
CO2, CH4, and N2O emissions from fuel combustion associated with compressing the capture gas stream
Controlled
A dehydrator was not included in this project example because the acid gas was assumed to be naturally de-watered during compression.
CO2, CH4, and N2O emissions from offsite electricity used to operate capture equipment Related
Legend
Sour Gas Processing
Facility
Produced HCs
Sour Gas
Acid Gas (H2S/CO2)
GHG emissions due to energy consumption
Abandoned Reservoir
Sulfur Plant
Vented CO2from Acid Gas
Produced Sulfur for Disposal
Baseline emissions
Assessment Boundary
Legend
Sour Gas Processing
Facility
Produced HCs
Sour Gas
Acid Gas (H2S/CO2)
GHG emissions due to energy consumption
Abandoned Reservoir
Sulfur Plant
Vented CO2from Acid Gas
Produced Sulfur for Disposal
Baseline emissions
Assessment Boundary
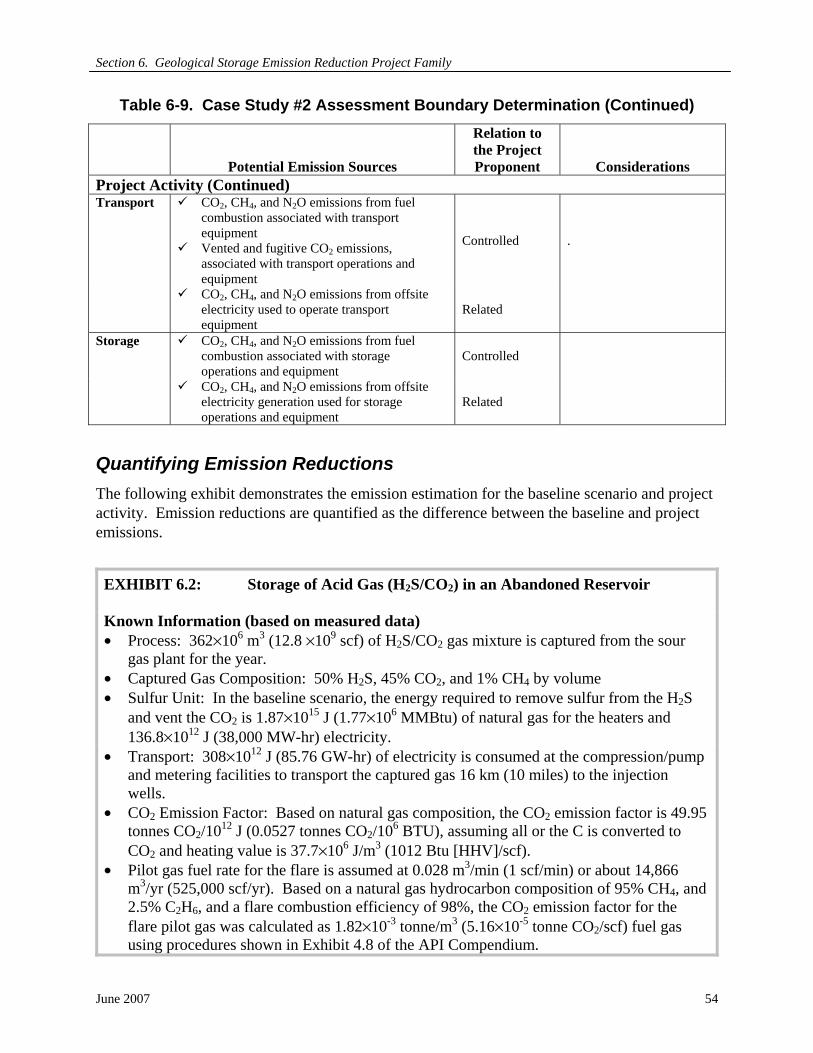
Section 6. Geological Storage Emission Reduction Project Family
June 2007 54
Table 6-9. Case Study #2 Assessment Boundary Determination (Continued)
Potential Emission Sources
Relation to the Project Proponent Considerations
Project Activity (Continued) Transport CO2, CH4, and N2O emissions from fuel
combustion associated with transport equipment
Vented and fugitive CO2 emissions, associated with transport operations and equipment
Controlled .
CO2, CH4, and N2O emissions from offsite electricity used to operate transport equipment
Related
Storage CO2, CH4, and N2O emissions from fuel combustion associated with storage operations and equipment
Controlled
CO2, CH4, and N2O emissions from offsite electricity generation used for storage operations and equipment
Related
Quantifying Emission Reductions The following exhibit demonstrates the emission estimation for the baseline scenario and project activity. Emission reductions are quantified as the difference between the baseline and project emissions.
EXHIBIT 6.2: Storage of Acid Gas (H2S/CO2) in an Abandoned Reservoir Known Information (based on measured data) • Process: 362×106 m3 (12.8 ×10⁹ scf) of H2S/CO2 gas mixture is captured from the sour
gas plant for the year. • Captured Gas Composition: 50% H2S, 45% CO2, and 1% CH4 by volume • Sulfur Unit: In the baseline scenario, the energy required to remove sulfur from the H2S
and vent the CO2 is 1.87×10¹⁵ J (1.77×10⁶ MMBtu) of natural gas for the heaters and 136.8×10¹² J (38,000 MW-hr) electricity.
• Transport: 308×1012 J (85.76 GW-hr) of electricity is consumed at the compression/pump and metering facilities to transport the captured gas 16 km (10 miles) to the injection wells.
• CO2 Emission Factor: Based on natural gas composition, the CO2 emission factor is 49.95 tonnes CO2/1012 J (0.0527 tonnes CO2/106 BTU), assuming all or the C is converted to CO2 and heating value is 37.7×10⁶ J/m3 (1012 Btu [HHV]/scf).
• Pilot gas fuel rate for the flare is assumed at 0.028 m3/min (1 scf/min) or about 14,866 m3/yr (525,000 scf/yr). Based on a natural gas hydrocarbon composition of 95% CH4, and 2.5% C2H6, and a flare combustion efficiency of 98%, the CO2 emission factor for the flare pilot gas was calculated as 1.82×10⁻³ tonne/m3 (5.16×10⁻⁵ tonne CO2/scf) fuel gas using procedures shown in Exhibit 4.8 of the API Compendium.

Section 6. Geological Storage Emission Reduction Project Family
June 2007 55
EXHIBIT 6.2 Continued In addition, monitoring of potential escape routes during the year did not detect any CO2 losses. Baseline Emissions Baseline emissions = VENT1 + CMB1 + FUG1 + IND1 where,
VENT1= Volume of CO2 (and CH4) separated from the sour gas in the gas processing facility, captured and injected in the reservoir (converted to tonnes of CO2 Eq. per year). This volume is released to the atmosphere in the baseline scenario. Vented emissions also include process and equipment vents of CO2 and CH4 emissions at the sulfur plant. However, these emissions also occur in the project activity and therefore cancel out the baseline emissions.
CMB1 = Direct emissions from combustion of natural gas in heaters at the sulfur plant.
FUG1 = Fugitive emissions of CO2 and CH4 at the sulfur plant. These emissions also occur in the project activity and therefore cancel out the baseline emissions.
IND1 = Indirect emissions from electricity usage at the sulfur plant in the baseline scenario.
Baseline Emissions Estimate
Vented Emissions (VENT1): Emissions associated with the baseline vented gas volume are estimated based on the volume of gas captured (362×106 m3 [12.8 Bscf/yr]) and the CO2 and CH4 concentrations in the gas (45 and 1 % by volume, respectively). A global warming potential (GWP) of 21 is used for CH4 to convert emissions to CO2 equivalent (CO2 Eq.). VENT1 = (Metered volume) × [CO2 fraction + 21 × (CH4 fraction)]
Eq.COtonnes976,353kg1000
tonneCHmolekg
CHkg16CHm23.685
CHmolekggasm
CHm0.0121
kg1000tonne
COmolekgCOkg44
COm23.685COmolekg
gasmCOm0.45
gasm10362
2
4
4
43
43
43
2
2
23
23
23
36
=
⎟⎟⎟⎟⎟
⎠
⎞
⎜⎜⎜⎜⎜
⎝
⎛
××××+
×××
××=
Combustion Emissions (CMB1): Combustion emissions result from fuel that would have been used in gas-fired heaters at the sulfur plant. Fuel usage was estimated as 1.87×10¹⁵ J. Using this fuel usage and emission factor for natural gas and the fuel usage, the annual CO2 emissions are calculated as:
215
122
2 COtonnes406,93J1087.1J 10
COtonne95.49emissionsCO =××=
Section 6. Geological Storage Emission Reduction Project Family
June 2007 56
EXHIBIT 6.2 Continued To calculate CH4 and N2O emissions from fuel combustion, emission factors for boilers/heaters are applied (API Compendium, Table 4-4).
415
1244
4
CHtonnes81.1J 1087.1J10
CH tonne107.9
usage)(fuelfactor)(emissionEmissionsCH
=×××=
×=
−
ONtonnes50.0J 1087.1J10
ON tonne107.2EmissionsON 215
1224
2 =×××= −
The direct CO2 equivalent (CO2 Eq.) emissions for combustion sources are calculated using a GWP of 21 for CH4 and 310 for N2O.
( ) ( )( ) ( ) Eq.COtonnes102,5951.031084.121905,49
ON310CH21COCMB
2
2421
=×+×+=×+×+=
Fugitive Emissions (FUG1): Both the project and the baseline involve separating the acid gas stream from the natural gas. Fugitive emissions of CO2 and CH4 are associated with pressurized equipment at the sulfur plant. These emissions also occur in the project activity and therefore cancel out the baseline emissions. Indirect Emissions (IND1): Emissions associated with the electricity that would have been used at the sulfur plant are based on the electricity demand for sulfur removal processes and regional electric generation emission factors. The electricity demand was estimated as 136.8×10¹² J (38,000 MW-hr). For the purpose of this example, the electricity emission factors for the (hypothetical, undefined) region are: 0.2425 tonnes CO2/109 J (0.873 tonnes CO2/MW-hr), 0.0016 tonnes CH4/1012 J (5.76E-6 tonnes CH4/MW-hr), and 0.0036 tonnes N2O/1012 J (1.296E-5 tonnes N2O/MW-hr). The total CO2 Eq. emissions are calculated using a GWP of 21 for CH4 and 310 for N2O.
212
92 CO tonnes174,33J108.136J 10
tonnes2425.0emissionsCO =××=
412
124 CH tonnes22.0J108.136J 10
tonnes0016.0emissionsCH =××=
ON tonnes49.0J108.136J 10
tonnes0036.0emissionsON 212
122 =××=

Section 6. Geological Storage Emission Reduction Project Family
June 2007 57
EXHIBIT 6.2 Continued
( )Eq.COtonnes330,33
ONtonnes0.49310)CHtonnes0.22(21COtonnes33,174 IND
2
2
421
=×+
×+=
Baseline emissions = 353,976 + 93,599 + 33,330 = 480,905 tonnes CO2 Eq. Project Emissions Calculations Project emissions = VENT2 + CMB2 +FUG2 + IND2 where,
VENT2 = Pipeline venting and compressor blowdown emissions from transporting the CO2 to the injection site.
CMB2 = Combustion emissions from flare pilot gas usage, and pipeline venting and compressor blowdown emissions routed to the flare. Note that the gas stream is naturally dewatered during compression and a dehydrator is not necessary to reduce moisture concentrations to levels required to prevent pipeline corrosion. If a dehydrator is required, combustion emissions due to fuel usage by the dehydrator reboiler and vented CH4 emissions from regenerating the glycol should be included.
FUG2 = Pipeline fugitive CO2 emissions from transporting the gas stream to the reservoir site.
IND2 = Indirect emissions for electric-driven compressors and pumps used to transport and inject the acid gas stream in the reservoir.
Since the acid gas stream contains significant concentrations of H2S, piping venting and compressor blowdown emissions will be routed to a flare equipped with a natural gas pilot. Additionally pipeline connections are expected to be tight and well maintained to minimize fugitive emissions. Vented Emissions (VENT2): Vented emissions associated with the project include pipeline vents during normal operations and maintenance/upset conditions. API Compendium Table 5-24 provides an emission factor for pipeline venting/blowdowns that can be converted from a CH4 basis (for natural gas pipelines) to a CO2 basis for this analysis. For conservatism, the transmission pipeline factor is applied. Note that the gas transported in the project contains a small amount of CH4.
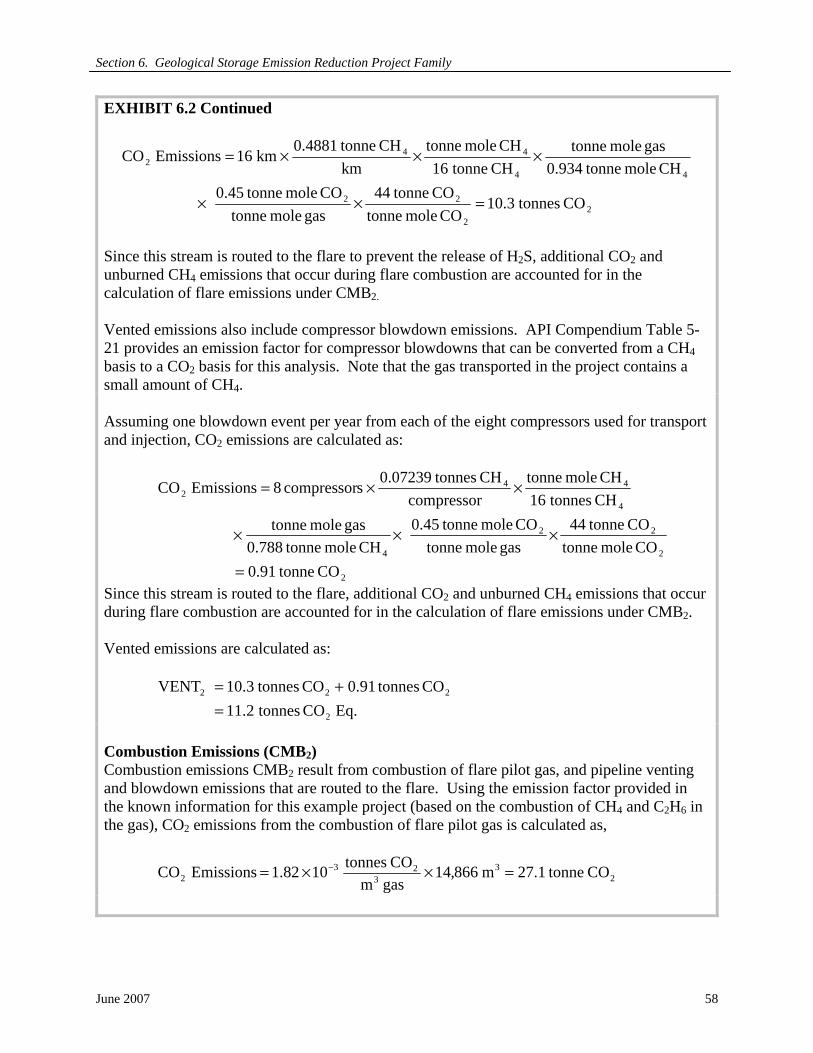
Section 6. Geological Storage Emission Reduction Project Family
June 2007 58
EXHIBIT 6.2 Continued
22
22
44
442
CO tonnes3.10CO mole tonne
CO tonne44gas mole tonne
CO mole tonne0.45CH mole tonne0.934
gas mole tonneCH tonne16
CH mole tonnekm
CH tonne4881.0km16Emissions CO
=××
×××=
Since this stream is routed to the flare to prevent the release of H2S, additional CO2 and unburned CH4 emissions that occur during flare combustion are accounted for in the calculation of flare emissions under CMB2. Vented emissions also include compressor blowdown emissions. API Compendium Table 5-21 provides an emission factor for compressor blowdowns that can be converted from a CH4 basis to a CO2 basis for this analysis. Note that the gas transported in the project contains a small amount of CH4. Assuming one blowdown event per year from each of the eight compressors used for transport and injection, CO2 emissions are calculated as:
2
2
22
4
4
442
CO tonne91.0CO mole tonne
CO tonne44gas mole tonne
CO mole tonne0.45CH mole tonne0.788
gas mole tonneCH tonnes16CH mole tonne
compressorCH tonnes07239.0scompressor 8Emissions CO
=
×××
××=
Since this stream is routed to the flare, additional CO2 and unburned CH4 emissions that occur during flare combustion are accounted for in the calculation of flare emissions under CMB2. Vented emissions are calculated as:
Eq.CO tonnes11.2CO tonnes0.91CO tonnes10.3 VENT
2
222
=+=
Combustion Emissions (CMB2) Combustion emissions CMB2 result from combustion of flare pilot gas, and pipeline venting and blowdown emissions that are routed to the flare. Using the emission factor provided in the known information for this example project (based on the combustion of CH4 and C2H6 in the gas), CO2 emissions from the combustion of flare pilot gas is calculated as,
23
323
2 COtonne27.1m866,14gas mCOtonnes1082.1EmissionsCO =××= −
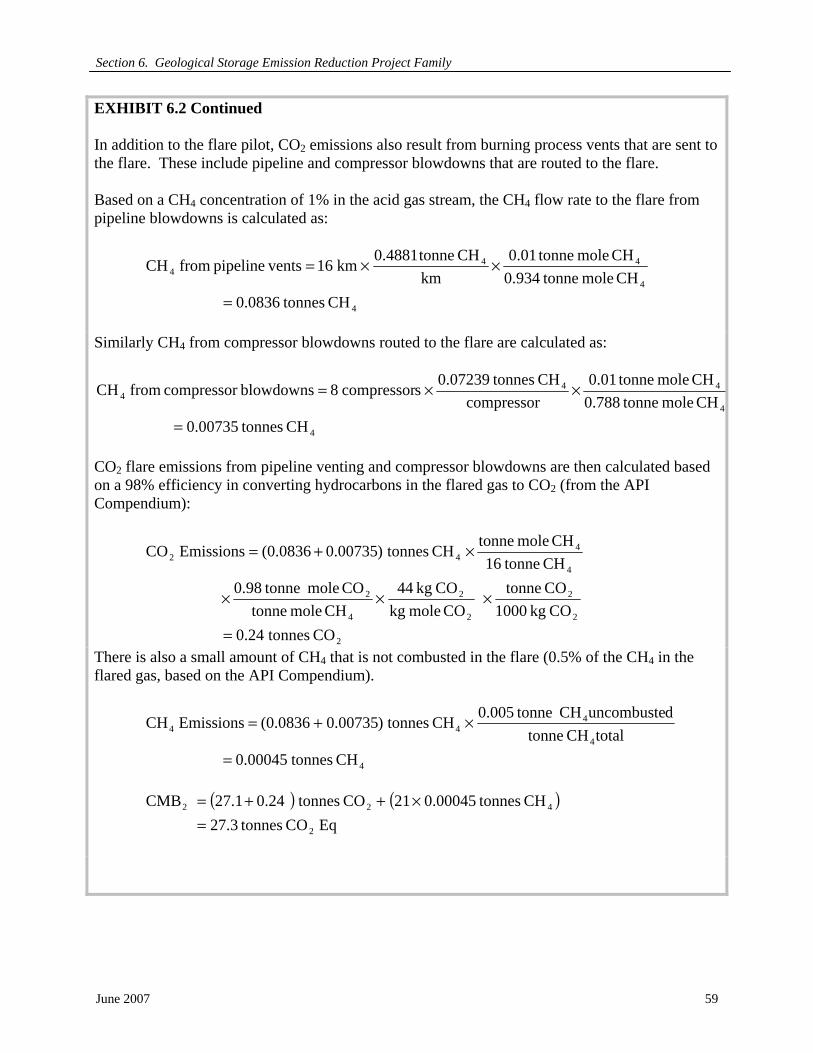
Section 6. Geological Storage Emission Reduction Project Family
June 2007 59
EXHIBIT 6.2 Continued In addition to the flare pilot, CO2 emissions also result from burning process vents that are sent to the flare. These include pipeline and compressor blowdowns that are routed to the flare. Based on a CH4 concentration of 1% in the acid gas stream, the CH4 flow rate to the flare from pipeline blowdowns is calculated as:
4
4
444
CH tonnes0836.0CH mole tonne0.934
CH mole tonne0.01km
CH tonne4881.0km16 ventspipeline from CH
=
××=
Similarly CH4 from compressor blowdowns routed to the flare are calculated as:
4
4
444
CH tonnes00735.0CH mole tonne0.788
CH mole tonne0.01compressor
CH tonnes0.07239scompressor8blowdowns compressor from CH
=
××=
CO2 flare emissions from pipeline venting and compressor blowdowns are then calculated based on a 98% efficiency in converting hydrocarbons in the flared gas to CO2 (from the API Compendium):
2
2
2
2
2
4
2
4
442
CO tonnes0.24CO kg 1000
CO tonneCO mole kg
CO kg 44CH mole tonne
CO mole tonne0.98CH tonne16
CH mole tonneCH tonnes)00735.0(0.0836Emissions CO
=
×××
×+=
There is also a small amount of CH4 that is not combusted in the flare (0.5% of the CH4 in the flared gas, based on the API Compendium).
4
4
444
CH tonnes0.00045totalCH tonne
duncombusteCH tonne0.005CH tonnes)00735.0(0.0836Emissions CH
=
×+=
( ) ( )
Eq CO tonnes27.3CH tonnes0.0004521CO tonnes0.2427.1 CMB
2
422
=×++=

Section 6. Geological Storage Emission Reduction Project Family
June 2007 60
EXHIBIT 6.2 Continued Fugitive Emissions (FUG2): Fugitive emissions for the project include pipeline leaks. API Compendium Table 6-1 provides fugitive pipeline emission factors that can be converted from the default API Compendium CH4 basis to the CH4 content for this analysis. (Note: Due to the H2S content of the acid gas stream, fugitive components would likely be well maintained, thus minimizing or eliminating any emissions.
4
4
444
CH tonnes38.0(default) CH mole 0.934
(project) CH mole 0.01km
CH tonne233.2km16 Emissions CH
=
××=
For CO2, the Draft 2006 IPCC Guidelines for National Greenhouse Gas Inventories Chapter 5 derives a CO2 emission factor based on the CH4 mass-based emission rate, where CO2 emission rate = 1.66 times the CH4 emission rate.
2
4
242
CO tonnes3.59CH tonne
CO tonne1.66km
CH tonne233.2km16 Emissions CO
=
××=
( ) ( )
Eq.CO tonnes3.67CH tonnes38.021CO tonnes3.59 FUG
2
422
=×+=
Indirect Emissions (IND2): The indirect emissions represent the emissions resulting from the generation of electricity required to operate the compression and pump facilities associated with transporting the captured gas stream from the gas plant to the injection site. These emissions are calculated from actual electricity usage data as reflected in the electric utility bills and regional emission factors. For the purpose of this example, the electricity emission factors for the region are: 0.2425 tonnes CO2/109 J (0.873 tonnes CO2/MW-hr), 0.0016 tonnes CH4/1012 J (5.76E-6 tonnes CH4/MW-hr), and 0.0036 tonnes N2O/1012 J (1.296E-5 tonnes N2O/MW-hr) (the same values as used for the baseline scenario). The total CO2 Eq. emissions are calculated using a GWP of 21 for CH4 and 310 for N2O. Emissions = (emission factor) × (electrical usage)
212
92
2 COtonnes690,74J10308J10
COtonne0.2425EmissionsCO =××=
412
124
4 CHtonne0.49J10308J10CHtonnes0016.0EmissionsCH =××=

Section 6. Geological Storage Emission Reduction Project Family
June 2007 61
EXHIBIT 6.2 Continued
ONtonne11.1J10308J10
ONtonnes0036.0EmissionsON 212
122
2 =××=
( ) ( )
Eq. COtonnes044,75ON tonnes11.1310CH tonnes0.4921CO tonnes690,47 IND
2
2422
=×+×+=
Project emissions = VENT2 + CMB2 + FUG2 + IND2 = 11.2 + 27.3 + 67.3 + 75,044 = 75,150 tonnes CO2 Eq. per year Emission Reductions = Baseline Emissions – Project Emissions = 482,408 – 75,150 = 407,258 tonnes CO2 Eq. per year
Monitoring Guidelines on monitoring CCS projects are provided in Section 6.7 with some potential activities addressed in CCS Project Case Study #1. The key messages are that monitoring for CCS is an iterative, risk-based process and monitoring plans should be fit-for purpose. For acid gas injection, the quantities injected are generally small in relation to the amount of oil and/or gas produced. The general principles for risk-based monitoring of the geological storage of acid gases apply, although specific climate change regimes may require additional activities.
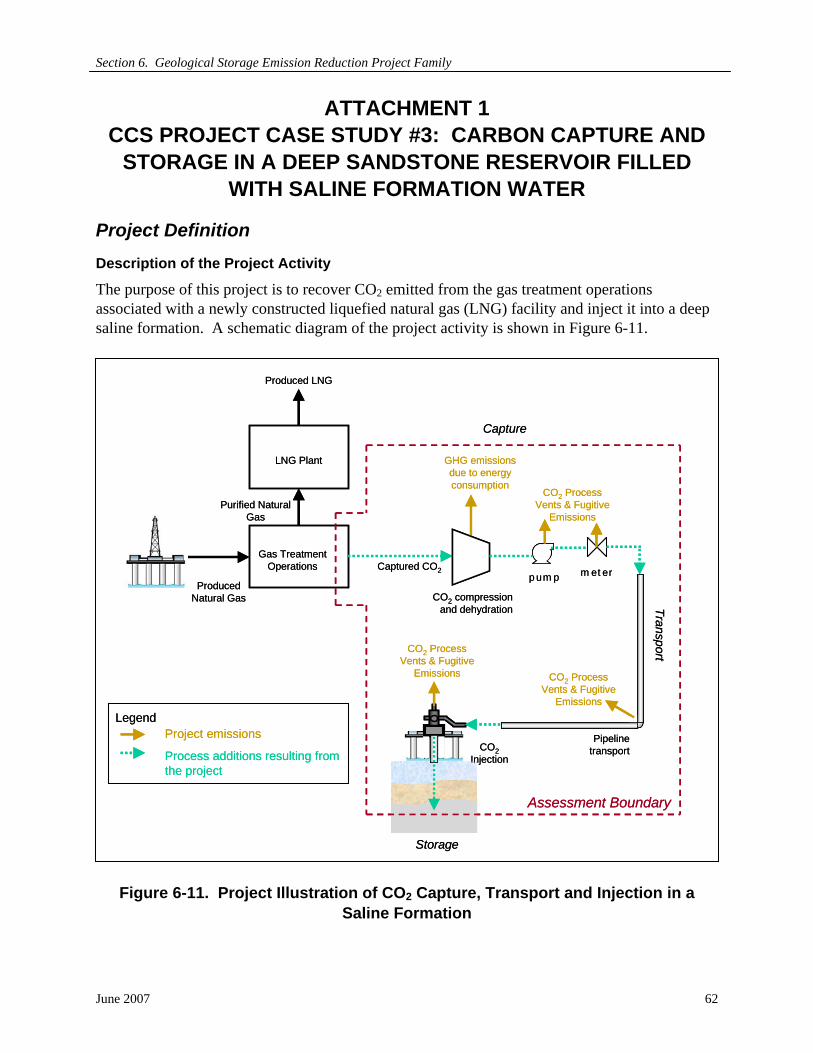
Section 6. Geological Storage Emission Reduction Project Family
June 2007 62
ATTACHMENT 1 CCS PROJECT CASE STUDY #3: CARBON CAPTURE AND
STORAGE IN A DEEP SANDSTONE RESERVOIR FILLED WITH SALINE FORMATION WATER
Project Definition Description of the Project Activity
The purpose of this project is to recover CO2 emitted from the gas treatment operations associated with a newly constructed liquefied natural gas (LNG) facility and inject it into a deep saline formation. A schematic diagram of the project activity is shown in Figure 6-11.
Figure 6-11. Project Illustration of CO2 Capture, Transport and Injection in a Saline Formation
Storage
Project emissions
Process additions resulting from the project
Legend
CO2 compression and dehydration
Gas Treatment Operations
Purified Natural Gas
m et erProduced
Natural Gas
Captured CO2
GHG emissions due to energy consumption
Capture
Transport
p um p
CO2 Process Vents & Fugitive
Emissions
CO2Injection
CO2 Process Vents & Fugitive
Emissions
LNG Plant
Produced LNG
Pipeline transport
CO2 Process Vents & Fugitive
Emissions
Assessment Boundary

Section 6. Geological Storage Emission Reduction Project Family
June 2007 63
This project involves the following:
• 20.8×10⁶ Sm3/day (734×106 scf/day) of natural gas is produced from 9 offshore wells and is piped to an onshore LNG facility. The produced natural gas contains 3.9 to 5.4 mol% CO2, 0-2 mol% H2S, and 81-83 mol% CH4. (The remaining gas constituents are inconsequential to this example.)
• CO2 is separated from the natural gas using an amine unit and amine regeneration prior to cooling the produced gas to form LNG containing 99% CH4.
• Captured CO2 is compressed using multiple engine-driven compressors and electric-driven pumps to transport the CO2 stream 152 km (94 miles) to an offshore CO2 injection well and inject the CO2 into the deep saline formation. Facility fuel and electricity usage records, and CO2 metering records indicate that, on an annual basis, 35.9×10⁶ Sm3 (1.27×10⁹ scf) of fuel gas and 1.27×10¹³ J (3,528 MW-hr) of electricity are consumed at the compression/pump and metering facilities to compress 700×103 tonnes CO2 per year that is captured from the LNG plant.
• The CO2 is injected into a deep saline formation, separated from the ocean floor by a gas bearing formation, an oil bearing formation, and a thick shale formation.
Reservoir Background Extensive reservoir studies associated with the gas production activities provide significant information on the geology and hydrogeology of the reservoir. Figure 6-12 provides a schematic cross-sectional view of the CO2 injection location. CO2 is injected into a deep saline formation. A thick shale layer separates the injection location from the gas production formation. These properties make storage of the CO2 in this reservoir a viable, long-term option and minimize the potential for an accidental release as a result of natural occurrences.
Figure 6-12. CO2 Storage Formation
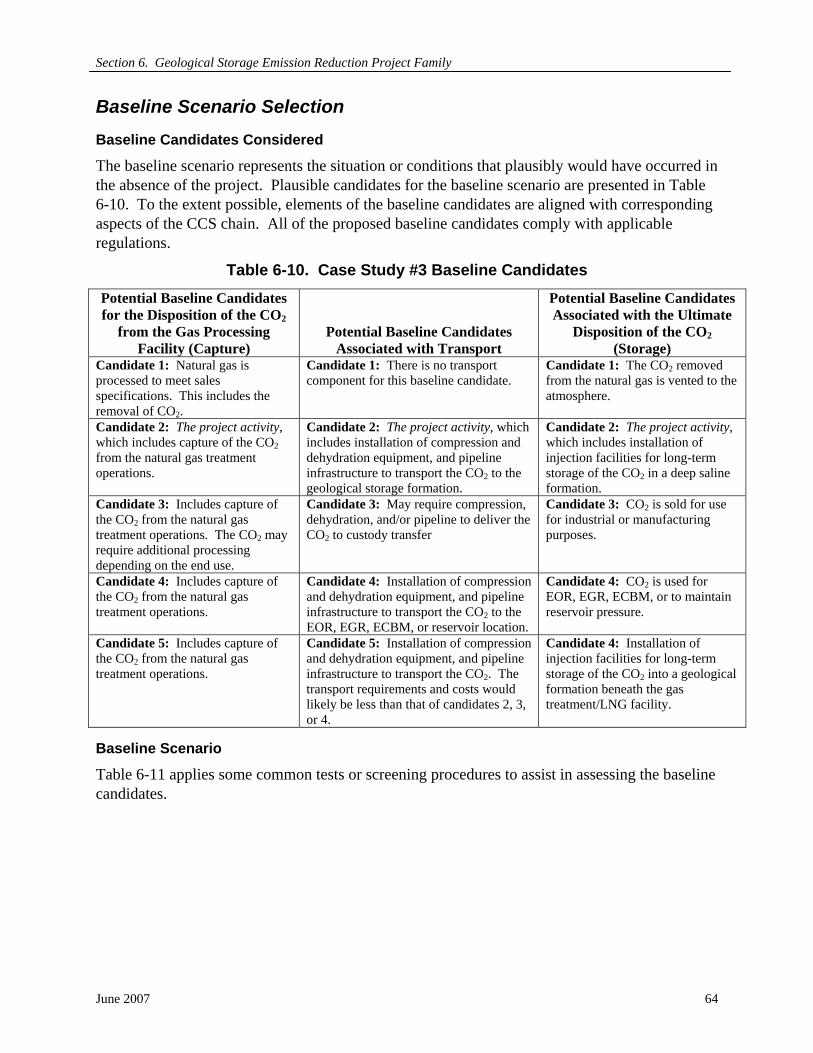
Section 6. Geological Storage Emission Reduction Project Family
June 2007 64
Baseline Scenario Selection Baseline Candidates Considered
The baseline scenario represents the situation or conditions that plausibly would have occurred in the absence of the project. Plausible candidates for the baseline scenario are presented in Table 6-10. To the extent possible, elements of the baseline candidates are aligned with corresponding aspects of the CCS chain. All of the proposed baseline candidates comply with applicable regulations.
Table 6-10. Case Study #3 Baseline Candidates Potential Baseline Candidates for the Disposition of the CO2
from the Gas Processing Facility (Capture)
Potential Baseline Candidates Associated with Transport
Potential Baseline Candidates Associated with the Ultimate
Disposition of the CO2 (Storage)
Candidate 1: Natural gas is processed to meet sales specifications. This includes the removal of CO2.
Candidate 1: There is no transport component for this baseline candidate.
Candidate 1: The CO2 removed from the natural gas is vented to the atmosphere.
Candidate 2: The project activity, which includes capture of the CO2 from the natural gas treatment operations.
Candidate 2: The project activity, which includes installation of compression and dehydration equipment, and pipeline infrastructure to transport the CO2 to the geological storage formation.
Candidate 2: The project activity, which includes installation of injection facilities for long-term storage of the CO2 in a deep saline formation.
Candidate 3: Includes capture of the CO2 from the natural gas treatment operations. The CO2 may require additional processing depending on the end use.
Candidate 3: May require compression, dehydration, and/or pipeline to deliver the CO2 to custody transfer
Candidate 3: CO2 is sold for use for industrial or manufacturing purposes.
Candidate 4: Includes capture of the CO2 from the natural gas treatment operations.
Candidate 4: Installation of compression and dehydration equipment, and pipeline infrastructure to transport the CO2 to the EOR, EGR, ECBM, or reservoir location.
Candidate 4: CO2 is used for EOR, EGR, ECBM, or to maintain reservoir pressure.
Candidate 5: Includes capture of the CO2 from the natural gas treatment operations.
Candidate 5: Installation of compression and dehydration equipment, and pipeline infrastructure to transport the CO2. The transport requirements and costs would likely be less than that of candidates 2, 3, or 4.
Candidate 4: Installation of injection facilities for long-term storage of the CO2 into a geological formation beneath the gas treatment/LNG facility.
Baseline Scenario
Table 6-11 applies some common tests or screening procedures to assist in assessing the baseline candidates.

Section 6. Geological Storage Emission Reduction Project Family
June 2007 65
Table 6-11 Case Study #3 Baseline Scenario Assessment Baseline Scenario
Alternatives Investment Ranking Technology Policy/
Regulatory BenchmarkingCandidate 1: Vent the CO2
No additional costs No additional technology requirements
Consistent with current,
applicable laws or regulations
Common practice in most regions16
Candidate 2 (Project activity): Separate and capture the CO2, transport offshore, and inject into the deep saline formation
Moderate to high costs for capture and transport infrastructure
Existing technologies
Some commercial projects
Candidate 3: Separate and capture the CO2, transport for sale for industrial use
Moderate to high costs for capture and transport infrastructure, depending on the distance. Uncertain market for CO2.
Existing technologies
Commercial in some regions
Candidate 4: Separate and capture the CO2, transport for use in EOR, EGR, or formation pressure maintenance
Moderate to high costs for capture and transport infrastructure, depending on the distance. Requires a need for CO2 in a suitable geologic formation.
Existing technologies
Consistent with current,
applicable laws or regulations
Commercial in some regions
Candidate 5: Separate and capture the CO2, inject the CO2 beneath the separation facility
Moderate costs for capture, minimal costs for transport. Requires a suitable geologic formation.
Existing technologies
Some commercial projects
Based on comparing the baseline candidates presented above:
• Candidate 1 requires no additional gas processing and no additional costs. For this example, it is assumed that venting the CO2 meets applicable regulations and is the common practice in the region.
• Candidate 2, the project activity, requires additional processing of the produced gas to separate and capture the CO2. Pipeline and an offshore injection well are required to transport and inject the gas into the deep saline formation.
• Similar to the project activity, Candidate 3 requires additional processing to separate and capture the CO2, as well as pipeline infrastructure to transport the CO2 to the end user. This scenario may incur additional financial risk due to uncertainty in the market for CO2 in a particular region. The ultimate disposition of the CO2 may be vented or stored, depending on the end use application.
• Similar to the project activity, Candidate 4 requires additional processing to separate and capture the CO2, as well as pipeline infrastructure to transport the CO2 to the end user. In certain locations, using the CO2 for enhanced hydrocarbon recovery may be preferred over injecting it into a saline formation. Candidate 4 requires a hydrocarbon reservoir suitable for enhanced hydrocarbon recovery or a formation
16 Depending on the circumstances of the project, the region or geographic area may be narrow (e.g., an area within a nation or state), or broad (e.g., an international region or global area).
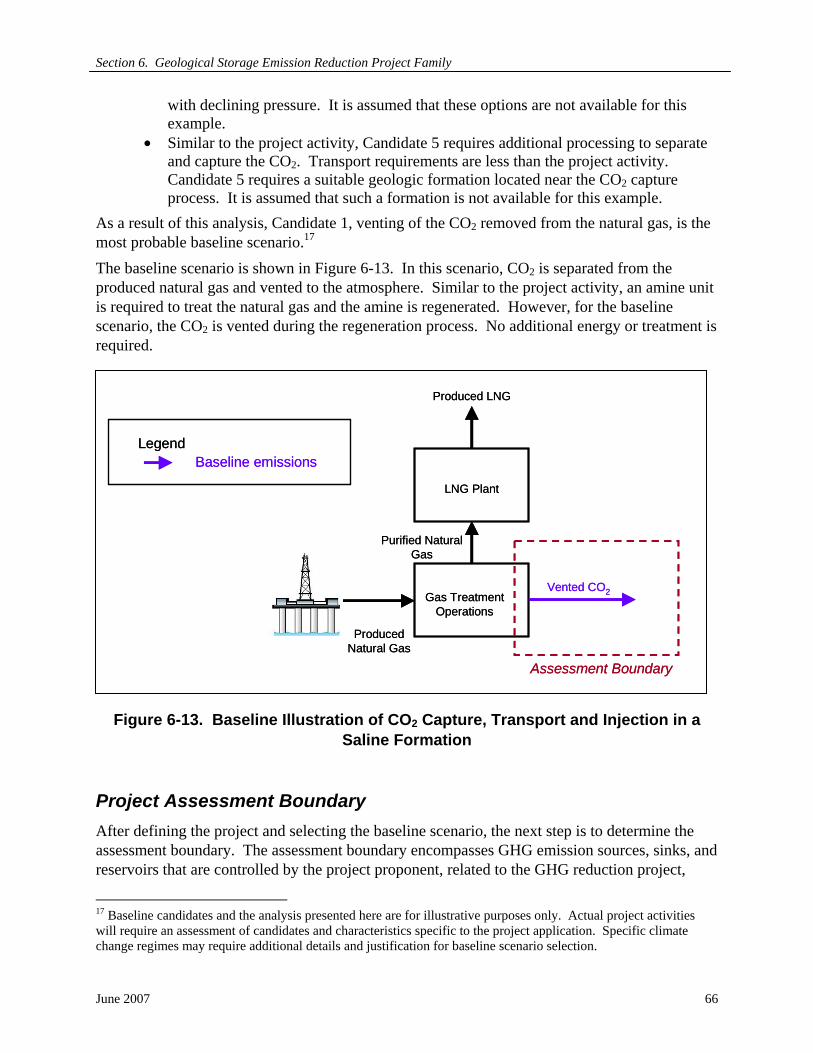
Section 6. Geological Storage Emission Reduction Project Family
June 2007 66
with declining pressure. It is assumed that these options are not available for this example.
• Similar to the project activity, Candidate 5 requires additional processing to separate and capture the CO2. Transport requirements are less than the project activity. Candidate 5 requires a suitable geologic formation located near the CO2 capture process. It is assumed that such a formation is not available for this example.
As a result of this analysis, Candidate 1, venting of the CO2 removed from the natural gas, is the most probable baseline scenario.17 The baseline scenario is shown in Figure 6-13. In this scenario, CO2 is separated from the produced natural gas and vented to the atmosphere. Similar to the project activity, an amine unit is required to treat the natural gas and the amine is regenerated. However, for the baseline scenario, the CO2 is vented during the regeneration process. No additional energy or treatment is required.
Figure 6-13. Baseline Illustration of CO2 Capture, Transport and Injection in a
Saline Formation
Project Assessment Boundary After defining the project and selecting the baseline scenario, the next step is to determine the assessment boundary. The assessment boundary encompasses GHG emission sources, sinks, and reservoirs that are controlled by the project proponent, related to the GHG reduction project,
17 Baseline candidates and the analysis presented here are for illustrative purposes only. Actual project activities will require an assessment of candidates and characteristics specific to the project application. Specific climate change regimes may require additional details and justification for baseline scenario selection.
Gas Treatment Operations
Purified Natural Gas
Produced Natural Gas
Vented CO2
LNG Plant
Produced LNG
Baseline emissionsLegend
Assessment Boundary
Gas Treatment Operations
Purified Natural Gas
Produced Natural Gas
Vented CO2
LNG Plant
Produced LNG
Baseline emissionsLegend
Assessment Boundary
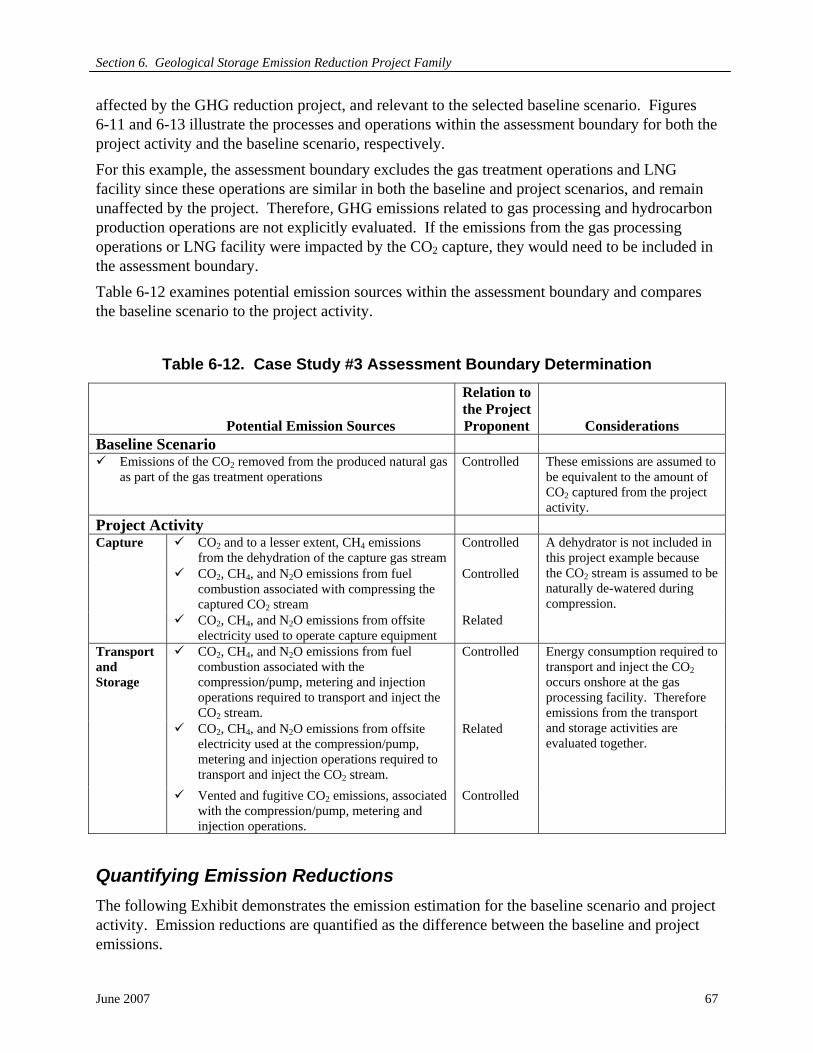
Section 6. Geological Storage Emission Reduction Project Family
June 2007 67
affected by the GHG reduction project, and relevant to the selected baseline scenario. Figures 6-11 and 6-13 illustrate the processes and operations within the assessment boundary for both the project activity and the baseline scenario, respectively. For this example, the assessment boundary excludes the gas treatment operations and LNG facility since these operations are similar in both the baseline and project scenarios, and remain unaffected by the project. Therefore, GHG emissions related to gas processing and hydrocarbon production operations are not explicitly evaluated. If the emissions from the gas processing operations or LNG facility were impacted by the CO2 capture, they would need to be included in the assessment boundary. Table 6-12 examines potential emission sources within the assessment boundary and compares the baseline scenario to the project activity.
Table 6-12. Case Study #3 Assessment Boundary Determination
Potential Emission Sources
Relation to the Project Proponent Considerations
Baseline Scenario Emissions of the CO2 removed from the produced natural gas
as part of the gas treatment operations Controlled These emissions are assumed to
be equivalent to the amount of CO2 captured from the project activity.
Project Activity Capture CO2 and to a lesser extent, CH4 emissions
from the dehydration of the capture gas stream Controlled A dehydrator is not included in
this project example because the CO2 stream is assumed to be naturally de-watered during compression.
CO2, CH4, and N2O emissions from fuel combustion associated with compressing the captured CO2 stream
Controlled
CO2, CH4, and N2O emissions from offsite electricity used to operate capture equipment
Related
Transport and Storage
CO2, CH4, and N2O emissions from fuel combustion associated with the compression/pump, metering and injection operations required to transport and inject the CO2 stream.
Controlled Energy consumption required to transport and inject the CO2 occurs onshore at the gas processing facility. Therefore emissions from the transport and storage activities are evaluated together.
CO2, CH4, and N2O emissions from offsite electricity used at the compression/pump, metering and injection operations required to transport and inject the CO2 stream.
Related
Vented and fugitive CO2 emissions, associated with the compression/pump, metering and injection operations.
Controlled
Quantifying Emission Reductions The following Exhibit demonstrates the emission estimation for the baseline scenario and project activity. Emission reductions are quantified as the difference between the baseline and project emissions.

Section 6. Geological Storage Emission Reduction Project Family
June 2007 68
EXHIBIT 6.3: Capture and Storage of CO2 in a Deep Saline Formation Known Information (based on hypothetical data for this example): • 700×103 tonnes/yr CO2 is captured from the LNG plant, transported offshore, and injected
in the deep saline formation. • Captured Gas Composition: 99 mol% CO2, 1 mol% other non-GHG constituents. • Energy Requirements: 35.9×10⁶ m3 (1.27×10⁹ scf) of fuel gas and 1.27×10¹³ J (3527 MW-
hr) of electricity are consumed at the compression/pump and metering facilities to transport the capture gas 152 km (94 miles) offshore and inject it into the deep saline formation.
• CO2 Emission Factor: Based on fuel gas composition: the CO2 emission factor is 49.95 tonnes/1012 J (0.0527 tonnes CO2/106 BTU), assuming all of the C is converted to CO2, and heating value is 37.7×10⁶ J/m3 (1012 Btu HHV/scf).
• As mentioned previously, the assessment boundary excludes emission sources associated with the gas processing operations and LNG facility. Therefore vented and fugitive emissions for the project activity focus on the transport and injection operations.
• Maintenance activities and upset conditions associated with the transport and injection operations for the project activity include pipeline blowdowns, injection well workovers, compressor blowdowns and starts, and pressure relief valve releases. For this example, it is assumed that one well workover occurred during the course of the year. Vented emissions also include two pressure relief valves (PRVs) and blowdowns and starts for one large compressor.
• Fugitive emission sources for the project activity include the compressor, one meter and associated piping, the pipeline to the injection well, and the injection wellhead.
• The facility operated 8,640 hours during the past year. In addition, monitoring of potential CO2 escape routes during the year did not detect any CO2 losses. Baseline Emissions: Baseline emissions = VENT1 + CMB1 + FUG1 + IND1 where,
VENT1 = Vented CO2 emissions from baseline operations or equipment that would have occurred in the baseline scenario. For this example, this includes the volume of CO2 captured as a result of treating the produced natural gas that would have been released to the atmosphere in the baseline scenario.
CMB1 = Direct combustion emissions that would have occurred in the baseline scenario.
FUG1 = Fugitive CO2 emissions from baseline equipment that would have occurred in the baseline scenario.
IND1 = Indirect emissions that would have occurred from electricity purchased from outside sources in the baseline scenario.
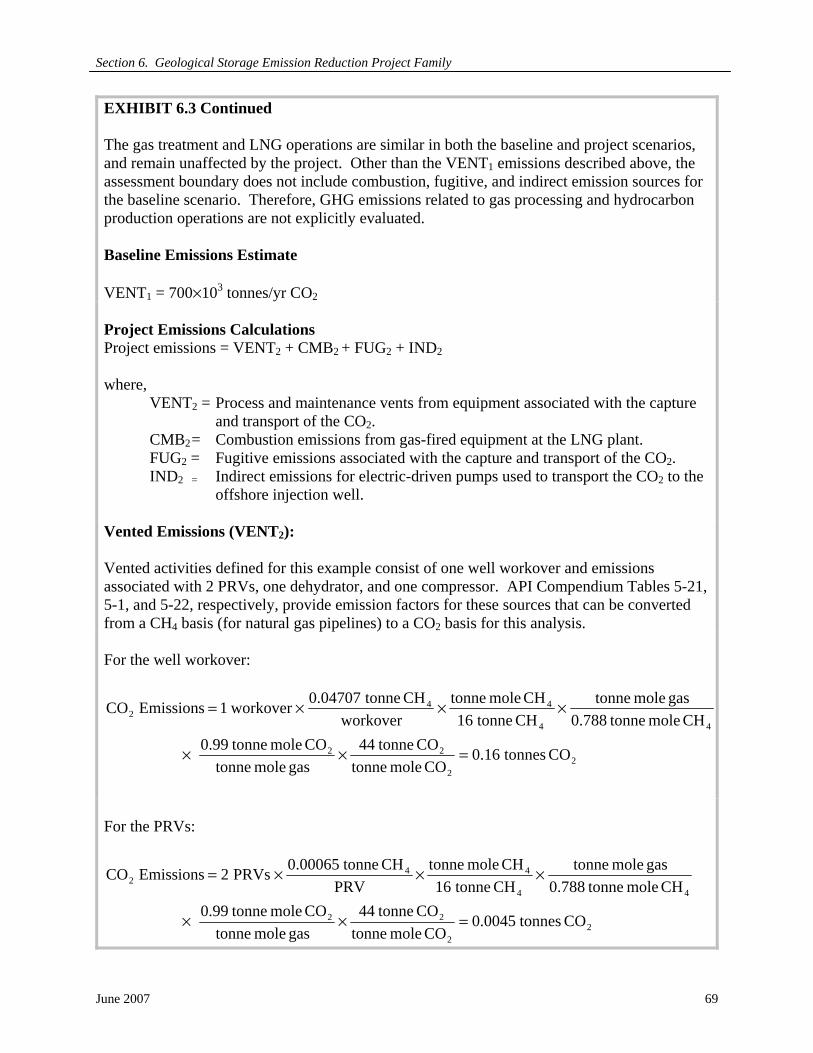
Section 6. Geological Storage Emission Reduction Project Family
June 2007 69
EXHIBIT 6.3 Continued The gas treatment and LNG operations are similar in both the baseline and project scenarios, and remain unaffected by the project. Other than the VENT1 emissions described above, the assessment boundary does not include combustion, fugitive, and indirect emission sources for the baseline scenario. Therefore, GHG emissions related to gas processing and hydrocarbon production operations are not explicitly evaluated. Baseline Emissions Estimate
VENT1 = 700×103 tonnes/yr CO2 Project Emissions Calculations Project emissions = VENT2 + CMB2 + FUG2 + IND2 where,
VENT2 = Process and maintenance vents from equipment associated with the capture and transport of the CO2.
CMB2 = Combustion emissions from gas-fired equipment at the LNG plant. FUG2 = Fugitive emissions associated with the capture and transport of the CO2. IND2 = Indirect emissions for electric-driven pumps used to transport the CO2 to the
offshore injection well. Vented Emissions (VENT2): Vented activities defined for this example consist of one well workover and emissions associated with 2 PRVs, one dehydrator, and one compressor. API Compendium Tables 5-21, 5-1, and 5-22, respectively, provide emission factors for these sources that can be converted from a CH4 basis (for natural gas pipelines) to a CO2 basis for this analysis. For the well workover:
22
22
44
442
CO tonnes16.0CO mole tonne
CO tonne44gas mole tonne
CO mole tonne0.99CH mole tonne0.788
gas mole tonneCH tonne16
CH mole tonneworkover
CH tonne04707.0workover1 EmissionsCO
=××
×××=
For the PRVs:
22
22
44
442
CO tonnes0045.0CO mole tonne
CO tonne44gas mole tonne
CO mole tonne0.99CH mole tonne0.788
gas mole tonneCH tonne16
CH mole tonnePRV
CH tonne00065.0PRVs2 EmissionsCO
=××
×××=

Section 6. Geological Storage Emission Reduction Project Family
June 2007 70
EXHIBIT 6.3 Continued For the dehydrator (Note: the dehydrator for this hypothetical example uses an electric pump to circulate the glycol. These emissions are estimated as part of the total indirects.):
22
22
44
436
4
2
3
2
2
2
222
CO tonnes243CO mole tonne
CO tonne44gas mole tonne
CO mole tonne0.99CH mole tonne0.788
gas mole tonneCH tonne16
CH mole tonneprocessed m 10
CH tonne18667.0CO mole kgm 685.23
CO kg 44CO mole kg
CO tonneCO kg 1000CO tonne000,700 EmissionsCO
=××
×××
×××=
For the compressor blowdowns and starts:
22
2
2
44
4
Blowdowns
4
Starts
42
CO tonnes81.0CO mole tonne
CO tonne44gas mole tonne
CO mole tonne0.99CH mole tonne0.788
gas mole tonneCH tonne16
CH mole tonnecompressor
CH tonne07239.0compressor
CH tonne1620.0compressor1 EmissionsCO
=×
×××
⎟⎟⎠
⎞⎜⎜⎝
⎛+×=
For pipeline venting/blowdowns, the emission factor for production gathering pipelines is applied:
22
22
44
442
CO tonnes93.1CO mole tonne
CO tonne44gas mole tonne
CO mole tonne0.99CH mole tonne0.788
gas mole tonneCH tonne16
CH mole tonnekm
CH tonne00368.0km152 EmissionsCO
=××
×××=
VENT2 = Well workover emissions + PVR emissions + Dehydrator emissions + Compressor emissions + Pipeline emissions. VENT2 = (0.16 + 0.0045 + 243 + 0.81 + 1.93) tonnes CO2 = 246 tonnes CO2
Combustion emissions (CMB2): Project combustion emissions are calculated based on measured fuel consumption rates and fuel analysis data. Based on the fuel gas analysis data, the CO2 emission factor in terms of thermal energy input is 49.95 tonnes/1012 J (0.0527 tonnes CO2/106 Btu) and the fuel heating value is 37.7×10⁶ J/m3 (1012.4 Btu/scf). The emission factor was conservatively estimated by assuming all the carbon in the fuel is converted to CO2 during the combustion process and discharged to the atmosphere, consistent with the API Compendium’s preferred approach.

Section 6. Geological Storage Emission Reduction Project Family
June 2007 71
EXHIBIT 6.3 Continued Using this emission factor and the fuel usage, the annual CO2 emissions are calculated as:
2
122
3
636
2
COtonnes604,67J 10
COtonne95.49m
J 107.37m109.35emissionsCO
=
×××=
To calculate CH4 and N2O emissions from fuel combustion, compressor engine emission factors for 2-stroke gas-fired engines are applied (API Compendium, Table 4-5).
4
124
3
636
4
CHtonnes843J 10
CHtonne623.0m
J 107.37m109.35
factor)(emissionusage)(fuelEmissionsCH
=
×××=
×=
ONtonnes84.2J 10
ONtonne0021.0m
J 107.37m109.35EmissionsON
2
122
3
636
2
=
×××=
The direct CO2 equivalent (CO2 Eq.) emissions for combustion sources are calculated using a GWP of 21 for CH4 and 310 for N2O.
( ) ( )( ) ( )
Eq. COtonnes187,862.8431084321046,67
ON310CH21COCMB
2
2422
=×+×+=×+×+=
Fugitive Emissions (FUG2): Similarly, fugitive emissions for the project include pipeline leaks and other pressurized equipment handling the CO2 stream. API Compendium Table 6-3 provides fugitive emission factors for the specified equipment. Each of the CH4-based emission factors can be converted from a CH4 basis to a CO2 basis for this analysis. For fugitive pipeline emissions the 2006 IPCC Guidelines for National Greenhouse Gas Inventories Chapter 5 derives a CO2 emission factor based on the CH4 mass-based emission rate, where CO2 emission rate = 1.66 times the CH4 emission rate. Compressor emissions:
2
2
22
4
4
442
CO tonnes364CO mole tonne
CO tonne44gas mole tonne
CO mole tonne0.99CH mole tonne0.788
gas mole tonneCH tonne16
CH mole tonnehours 640,8hr-compressor
CH tonne0122.0compressor1 EmissionsCO
=
×××
×××=
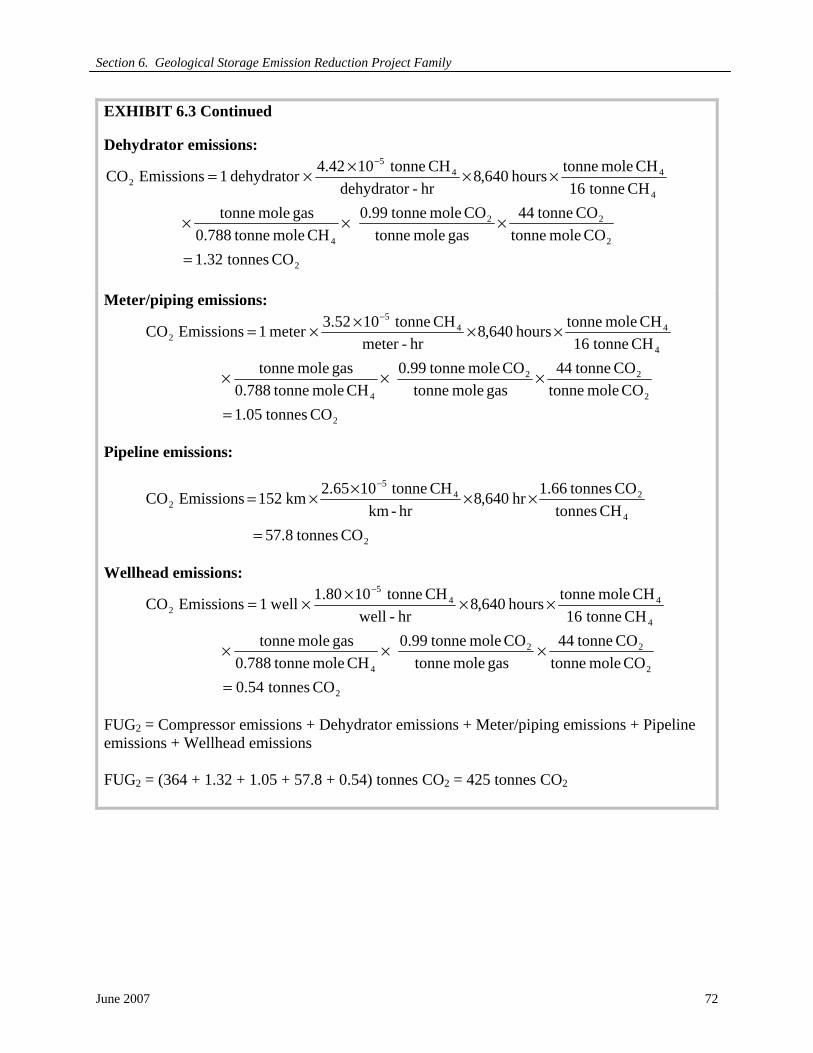
Section 6. Geological Storage Emission Reduction Project Family
June 2007 72
EXHIBIT 6.3 Continued Dehydrator emissions:
2
2
22
4
4
445
2
CO tonnes32.1CO mole tonne
CO tonne44gas mole tonne
CO mole tonne0.99CH mole tonne0.788
gas mole tonneCH tonne16
CH mole tonnehours 640,8hr-dehydratorCH tonne1042.4dehydrator1 EmissionsCO
=
×××
××××=−
Meter/piping emissions:
2
2
22
4
4
445
2
CO tonnes05.1CO mole tonne
CO tonne44gas mole tonne
CO mole tonne0.99CH mole tonne0.788
gas mole tonneCH tonne16
CH mole tonnehours 640,8hr-meter
CH tonne1052.3meter1 EmissionsCO
=
×××
××××=−
Pipeline emissions:
2
4
245
2
CO tonnes8.57CH tonnes
CO tonnes1.66hr640,8hr-km
CH tonne1065.2km152 EmissionsCO
=
××××=−
Wellhead emissions:
2
2
22
4
4
445
2
CO tonnes54.0CO mole tonne
CO tonne44gas mole tonne
CO mole tonne0.99CH mole tonne0.788
gas mole tonneCH tonne16
CH mole tonnehours 640,8hr-well
CH tonne1080.1well1 EmissionsCO
=
×××
××××=−
FUG2 = Compressor emissions + Dehydrator emissions + Meter/piping emissions + Pipeline emissions + Wellhead emissions FUG2 = (364 + 1.32 + 1.05 + 57.8 + 0.54) tonnes CO2 = 425 tonnes CO2

Section 6. Geological Storage Emission Reduction Project Family
June 2007 73
EXHIBIT 6.3 Continued
Indirect Emissions (IND2): Indirect emissions (IND2) are calculated from regional emission factors (for the purpose of this example, the electricity emission factors for the (hypothetical, undefined) region associated with the underground-sourced CO2 are: 0.2425 tonnes CO2/109 J (0.873 tonnes CO2/MW-hr), 0.0016 tonnes CH4/1012 J (5.76E-6 tonnes CH4/MW-hr), and 0.0036 tonnes N2O/1012 J (1.296E-5 tonnes N2O/MW-hr). The indirect emissions represent the emissions resulting from the generation of electricity required to operate the pumping equipment and facilities associated with transporting and injecting the captured CO2 into the deep saline formation. These emissions are calculated from actual electricity usage data as reflected in the electric utility bills. The total CO2 Eq. emissions are calculated using a GWP of 21 for CH4 and 310 for N2O. Emissions = (emission factor) × (electrical usage)
213
92
2 COtonnes080,3J1027.1J 10COtonne0.2425EmissionsCO =××=
413
124
4 CHtonne0203.0J1027.1J 10CHtonnes0016.0EmissionsCH =××=
ONtonne0457.0J1027.1J 10
ONtonnes0036.0EmissionsON 213
122
2 =××=
( ) ( )
Eq. COtonnes095,3ON tonnes0457.0310CH tonnes0203.021CO tonnes080,3IND
2
2422
=×+×+=
Project emissions = VENT2 + CMB2 + FUG2 + IND2 = 246 + 86,187 + 425+ 3,095 = 89,953 tonnes CO2 Eq. per year Emission Reductions = Baseline Emissions – Project Emissions = 700,000 – 89,953 = 610,047 tonnes CO2 Eq. per year
Monitoring Historical information is not available for this project since the LNG operations and project activity of capturing and injecting the CO2 are new. Baseline, project, and post injection monitoring are discussed in the following sections as illustrations of potential monitoring methods for this hypothetical CCS project. Actual

Section 6. Geological Storage Emission Reduction Project Family
June 2007 74
monitoring requirements depend on the specific project characteristics. In addition, particular climate change regimes may specify monitoring requirements. For injection into a saline formation, there are generally fewer pre-existing wells than with injection into an active or abandoned hydrocarbon reservoirs. As a result, the risk of leakage through wells is reduced. Storage in a saline aquifer also provides additional trapping mechanisms, such as residual or capillary trapping, and geochemical mechanisms of solubility and mineral trapping. Therefore, monitoring for this example might focus on the risk of migration.
Baseline Monitoring
Baseline Emissions Monitoring In the baseline scenario, CO2 emissions are equivalent to the quantity of CO2 captured by the project activity. Therefore, baseline emissions monitoring consists of measuring the quantity of CO2 captured. Pre-operational Evaluation Monitoring associated with the pre-operational evaluation of storage reservoir includes the following activities:
• Characterization of sub-surface conditions to determine the effectiveness of the trapping mechanisms and of the shale formation to serve as a seal (illustrated in Figure 6-12);
• Determination of storage capacity; • Characterization of permeable distribution for CO2 injection (not necessary for long-term
monitoring of CO2) and in targeted areas for migration; and • Identification of any other potential escape mechanisms. In assessing the reservoir’s ability to store CO2, seismic monitoring and simulation results were used determine potential pathways for CO2 to escape and estimate the amount of CO2 that could escape from any identified routes.
Operational (Project) Monitoring
Monitoring methods are established to detect anomalies from any areas identified during the baseline period that indicated a risk for loss of containment. During the project’s operational phase, three types of monitoring are used:
1) Monitoring to determine the project activities emissions; 2) Monitoring of the movement of CO2 within the storage formation; and 3) Monitoring of areas of potential escape to demonstrate containment.
Emissions Monitoring The example above demonstrates the type of measurement data needed to quantify the project activity’s emissions and reductions. Temperature and pressure sensors located at the injection well and close to the formation are used to support geological simulations, as well as to ensure that the pressure does not adversely impact the shale layer above the deep saline formation and that injection does not induce fractions in the reservoir formation above the storage location.

Section 6. Geological Storage Emission Reduction Project Family
June 2007 75
The amount of CO2 injected into the formation and the condition of the injection well are additional monitoring data. Risk Management Monitoring The containment of CO2 depends on the migration rate, path, and extent of the shale layer. Baseline data established the areas of potential leaks. Monitoring methods specific to those areas are used to determine the ongoing containment of the formation. The extension of the injected CO2 within the formation is monitored through 2D seismic imaging conducted at the start of injection and repeated periodically.
Post-Injection Monitoring Emission reductions are not quantified after injection has ceased. Data collected during the injection phase will be used to determine the type and extent of monitoring after the production lifetime of the reservoir.

Section 6. Geological Storage Emission Reduction Project Family
June 2007 76
ATTACHMENT 2 – EXAMPLE CCS PROJECTS AND RESEARCH, CURRENT AND PLANNED
Project Country Scale of Project
Lead Organization
Injection Start Date
Approximate average daily injection rate,
tonne/day Total
Storage Storage
Type Sleipner Norway Industrial Statoil, IEA 1996 3000 20 Mt
planned Saline formation
Weyburn Canada Industrial EnCana, IEA May 2000 3000-5000 20 Mt planned
EOR
In Salah Algeria Industrial Sonatrach, BP, Statoil
2004 3000 -4000 17 Mt planned
Depleted HC reservoirs
Salt Creek USA Industrial Anadarko 2004 5000-6000 27 Mt EOR Minami-Nagoaka
Japan Demo Research Institute of Innovative Technology for Earth
2002 Max 40 10,000 tonne planned
Saline formation
Yubari Japan Demo Japanese Ministry of Economy, Trade and Industry
2004 10 200 tonne planned
ECBM
Frio USA Pilot Bureau of Economic Geology of the University of Texas
4-13 Oct. 2004
177 (for 9 days)
1600 tonnes
Saline formation
K12B Netherlands Demo Gaz de France 2004 100 - 1000
~ 8Mt EGR
K14B Gas de France 2004-2005
(22,000 tCO2 total)
Fenn Big Valley
Canada Pilot Alberta Research Council
1998 50 200 tonnes
ECBM
Recopol Poland Pilot TNO-NITG 2003 1 10 tonnes
ECBM
Qinshui Basin
China Pilot Alberta Research Council
2003 30 150 tonnes
ECBM
Snohvit (Snow White)
Norway Industrial Statoil 2006 2,000 Saline formation
Gorgon Australia Planned Industrial
Chevron Planned 2009
10,000 Saline formation
Ketzin Germany Demo GFZ Potsdam 2006 100 60 kt Saline formation
Otway Australia Pilot CO2CRC 2007 150 for 2 years
100 kt Saline and depleted gas
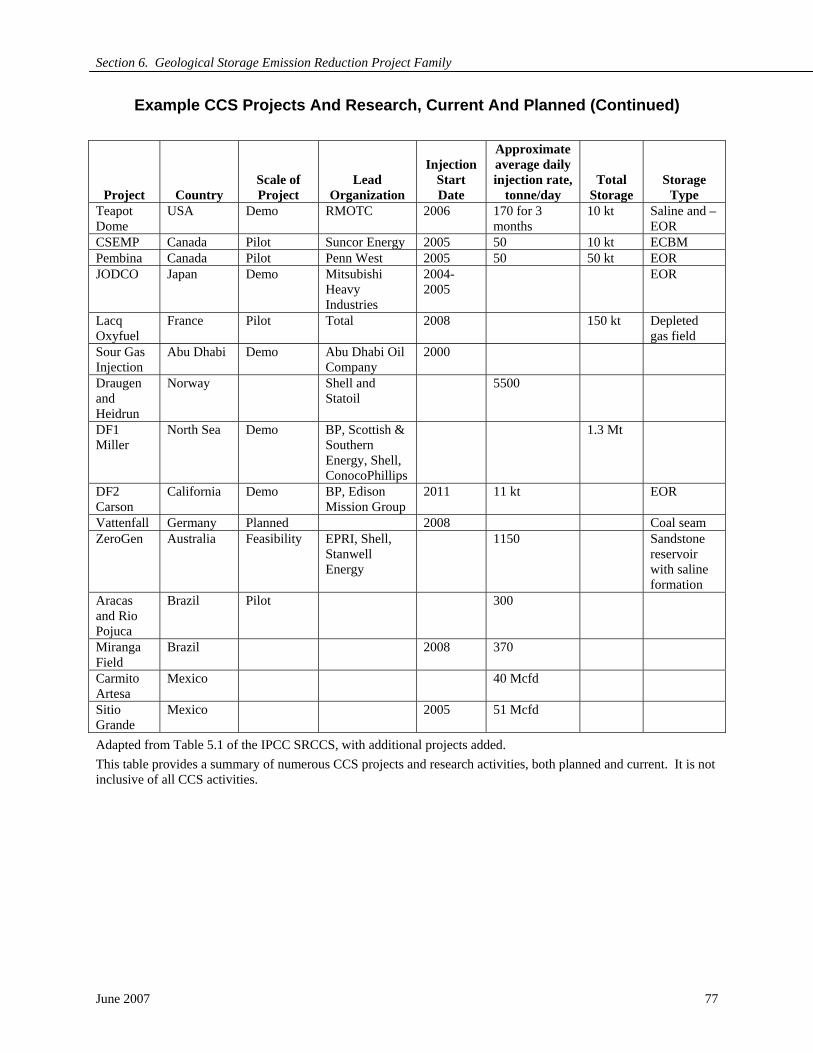
Section 6. Geological Storage Emission Reduction Project Family
June 2007 77
Example CCS Projects And Research, Current And Planned (Continued)
Project Country Scale of Project
Lead Organization
Injection Start Date
Approximate average daily injection rate,
tonne/day Total
Storage Storage
Type Teapot Dome
USA Demo RMOTC 2006 170 for 3 months
10 kt Saline and –EOR
CSEMP Canada Pilot Suncor Energy 2005 50 10 kt ECBM Pembina Canada Pilot Penn West 2005 50 50 kt EOR JODCO Japan Demo Mitsubishi
Heavy Industries
2004-2005
EOR
Lacq Oxyfuel
France Pilot Total 2008 150 kt Depleted gas field
Sour Gas Injection
Abu Dhabi Demo Abu Dhabi Oil Company
2000
Draugen and Heidrun
Norway Shell and Statoil
5500
DF1 Miller
North Sea Demo BP, Scottish & Southern Energy, Shell, ConocoPhillips
1.3 Mt
DF2 Carson
California Demo BP, Edison Mission Group
2011 11 kt EOR
Vattenfall Germany Planned 2008 Coal seam ZeroGen Australia Feasibility EPRI, Shell,
Stanwell Energy
1150 Sandstone reservoir with saline formation
Aracas and Rio Pojuca
Brazil Pilot 300
Miranga Field
Brazil 2008 370
Carmito Artesa
Mexico 40 Mcfd
Sitio Grande
Mexico 2005 51 Mcfd
Adapted from Table 5.1 of the IPCC SRCCS, with additional projects added. This table provides a summary of numerous CCS projects and research activities, both planned and current. It is not inclusive of all CCS activities.

Section 6. Geological Storage Emission Reduction Project Family
June 2007 78
ATTACHMENT 3 – APPLICATIONS AND TECHNOLOGIES FOR CO2 CAPTURE
Current and emerging technologies, categorized into four general types, target the separation of CO2 from gas mixtures containing N2, H2, H2O and CH4 associated with the different applications. The following table demonstrates how these overlap and lists some of the technologies. The choice of a specific capture technology is determined largely by the process conditions under which it operates.
Current and Emerging Capture Applications and Technologies
Capture Technologies
Capture Applications Process Streams Flue gas
Separation Oxy-fuel
Combustion Gasification
Solvents Current – Chemical and physical solvents; Emerging – improved solvents, contacting equipment and process designs
Current – Chemical solvents; Emerging – improved solvents, contacting equipment and process designs
Emerging – Biomimetic solvents
Current – Chemical and physical solvents; Emerging – improved solvents, contacting equipment and process designs
Membranes Current – Polymeric; Emerging – Ceramic, Facilitated transport, and Carbon Contactors
Sorbents
Current – Zeolites and Activated carbon Emerging –
carbonates, and carbon-based sorbents
Emerging – Adsorbents for O2/N2 separation, Perovskites, and Oxygen chemical looping
Cryogenic distillation
Current – Ryan-Holmes process
Current – Liquefaction; Emerging - Hybrid processes
Current – Distillation; Emerging – Improved distillation
Current – Liquefaction; Emerging -Hybrid processes
Reference: IPCC SRCCS, Table 3.1


Carbon C
apture and Geological S
torage Em
ission Reduction P
roject Family
Prepared by: U
RS
Corporation
Part II: Carbon Capture and Geological StorageEmission Reduction Family
Oil and Natural Gas Industry Guidelines for Greenhouse Gas Reduction Projects
International Petroleum Industry Environmental Conservation Association
American Petroleum Institute
Prepared by URS Corporation
May 2007