carbon and energy efficiency - ryanair summary brighter planet, using an advanced flight carbon and...
TRANSCRIPT

1
AIR TRAVEL
EFFICIENCYCARBON AND ENERGY
Case studies • Best practices • Industry trends • Airline rankings

Matthew Kling and Ian HoughCopyright 2011 Brighter Planet, all rights reserved.
ContactBrighter PlanetVermont and San Franciscohttp://brighterplanet.comstaff@ brighterplanet.com802-458-0441
About Brighter PlanetBrighter Planet is a leading innovator of advanced carbon calculation and mitigation tools that enable businesses and their clients to operate more efficiently, reduce their footprints and create a cleaner environment. Brighter Planet serves hundreds of thousands of customers daily, has performed millions of cloud-based carbon calculations, and has helped clients avert hundreds of millions of pounds of carbon dioxide emissions. The company has received the Social Innovation Award from the Financial Times and was named Best Small Business of 2010 by Treehugger.
! 2

Executive sum m ary
Brighter Planet, using an advanced flight carbon and energy m odel, analyzed m ore than a decade of com m ercial airline databases to reveal new details of disparities betw een the m ost and least environm entally friendly airlines for travellers. This report presents our findings, including detailed airline efficiency rankings, an exam ination of the five key drivers of energy efficiency, and an analysis of the huge econom ic and environm ental benefits of the past decade's fuel efficiency im provem ents.
O ur analysis of data covering m ore than 9 billion passenger departures and 12 trillion passenger-m iles flow n show s that carbon efficiency per passenger per m ile varies tenfold across the industry. O ur overarching conclusion is that a sim plistic, traditional approach to air travel carbon accounting has obscured m ajor sustainability opportunities by overlooking carbon efficiency. By using a m ore sophisticated accounting, com panies can significantly reduce the carbon footprints of their travelling em ployees w ithout necessarily cutting flights or increasing costs.
At a tim e w hen businesses increasingly are under pressure by governm ents, shareholders, and the general public to reduce the carbon footprints of their travelers, this research redefines how corporations and travel m anagers should understand and m anage the im pact of air travel.
Key findings:
• Airline efficiency varies dram atically due to aircraft, routes, and payloads. Continental, JetBlue, and Frontier earned the highest efficiency ratings am ong the 20 largest airlines in the U .S. m arket, w ith last-place Am erican Eagle em itting m ore than tw ice as m uch carbon per passenger per m ile. Internationally, Ryanair, Singapore Airlines, and D elta claim ed top rankings for efficiency am ong the 20 largest airlines, w ith SAS rated the w orst.
• Carbon efficiency per passenger per m ile varies tenfold across the industry. This finding runs counter to standard carbon accounting practices that treat flight efficiency as relatively uniform and lead to m ajor inaccuracies and lost opportunities.
• Focusing on efficiency provides new opportunities for cutting carbon footprints. An analysis of m ore than 300,000 em ployee flights at tw o of the largest Am erican corporations revealed that these com panies could cut their travellers’ carbon footprints by as m uch as 40% sim ply by choosing m ore efficient flights serving the sam e routes, w ithout necessarily increasing ticket prices.
• Five key drivers account for the w ide disparity in flight efficiency. Aircraft fuel econom y, passenger load factor, seat density, freight share and distance are critical factors for accurate flight carbon m easurem ent and m anagem ent.
• M arket trends in the aviation industry are driving evolutions in flight efficiency. Air travel efficiency has increased 20% since 2000, an im provem ent that in the U S has saved airlines and travelers m ore than $33 billion on fuel and prevented the release of 670 billion pounds of CO 2e.
! 3

Table of Contents
Introduction 5
U ncovering sustainability potential" 5
Aviation em issions" 6
Efficiency variation" 6
M odeling air travel im pacts" 7
Corporate case studies" 8
Efficiency drivers 9
Aircraft m odel" 10
Seating density" 11
Load factor" 12
Freight share" 13
D istance" 14
Overall efficiency 15
Flight case studies" 16
Airline rankings" 17
Industry trends" 19
Latent opportunity" 21
Best practices" 22
Appendices 23
M ethodology notes" 23
CM 1 overview " 24
References" 24
! 4

Introduction
U ncovering sustainability potential
Corporate travel sustainability m anagem ent is taking off. N early four in ten G lobal 500 com panies
publicly reported carbon em issions from em ployee travel last year, a figure grow ing at about 10%
annually.1 Flights account for the lion’s share of m any com panies’ travel expenditures and travel carbon
footprints and are the leading category for travel sustainability m anagem ent.
As m ore and m ore organizations m ove to m easure, report, and m anage air travel em issions, CSR and
travel m anagers can find them selves on a steep learning curve. W hile there are industry reporting
standards that define acceptable approaches to flight carbon calculation, they provide enorm ous
latitude in the level of detail perm itted, m eaning that an acceptable em issions figure for a single flight
can fall anyw here w ithin a w ide range.
U nder m ost standards, a com pany can calculate em ployee travel em issions by grouping all flights into
three or four distance categories, sum m ing the m iles flow n w ithin each category, and m ultiplying each
sum by an em issions factor. Alternatively, the com pany could perform a detailed analysis of the airline,
aircraft, route, and passenger characteristics for every segm ent of each flight. The latter approach is far
m ore accurate, although m ost organizations not surprisingly choose the form er for its ease and
sim plicity.
But w hile the sim pler approach m ay suffice for basic
sustainability reporting in an early phase of adoption, it
barely scratches the surface of w hat’s possible through
m ature sustainability m anagem ent. The sim ple approach
assum es flights are uniform in their im pact per m ile flow n,
but that’s far from the case. O ur m odeling based on aviation
industry datasets show s that carbon im pact per passenger per m ile varies by a factor of m ore than ten
across the industry. This variation exists not just w ithin the industry as a w hole, but am ong equally-
priced itinerary choices betw een the sam e tw o airports.
O versim plifying flight carbon analysis introduces m ajor inaccuracy that could m ean reported figures
are off by a very w ide m argin. It obscures key footprint trends that vary independently from flight
volum es. And it prevents m ajor sustainability gains possible through m anaging travel program s for
carbon efficiency, because it incorrectly im plies that the only w ay to cut carbon is to reduce air travel.
Broadening the focus from annual carbon totals to also m easure carbon efficiency per m ile can uncover
m ajor opportunities.
! 5
1 Carbon Disclosure Project
“ M ajor carbon variation exists
am ong equally-priced itinerary
choices for a single city pair.
”

Aviation emissions
The com m ercial aviation industry is a large and diverse m arket. W orldw ide, a fleet of 27,000 planes
representing hundreds of aircraft m odels and som e 1,600 airlines shuttles m ore than 4.5 billion
passengers over 1.5 trillion passenger-m iles annually betw een 3,700 airports.2
Com m ercial air travel consum es about 75 billion gallons of jet fuel each year, costing airlines over $140
billion and adding 3 trillion pounds of CO 2e to the atm osphere.3 Flights represent 2% , 3% , and 3% of
global, European, and U S greenhouse gas em issions, respectively, and a far greater portion for m any
businesses.4 W ith air travel, fuel prices, global tem peratures, and econom ic uncertainty all on the rise,
issues surrounding passenger air travel efficiency have never been m ore im portant.
This is not new s. M uch research has been directed tow ard understanding the econom ic and
environm ental effects of air travel. Reports by the Intergovernm ental Panel on Clim ate Change (IPCC),
W orld Resources Institute (W RI), U S Environm ental Protection Agency (EPA), U K D epartm ent for
Environm ent, Food, and Rural Affairs (D EFRA), European Environm ent Agency (EEA), and other
authorities have done m uch to advance our understanding of flight carbon and energy im pacts. But
m ost efforts have treated the aviation industry as a discrete unit or assum ed relative uniform ity in air
travel energy efficiency.
Efficiency variation
This is one of the first studies to fully address the w ide
variability in flight efficiency. The dearth of such inform ation
has been partly responsible for the lack of nuanced
approaches to corporate travel sustainability m anagem ent discussed above, and for the resulting
m issed opportunities in business intelligence and effective green m anagem ent.
The status quo is understandable— ultim ately w e care about air travel’s total im pact, so from the
perspective of a governm ent regulator, a clim ate scientist, or a nascent sustainability program this is
the m ost im portant figure to track. But from a business intelligence perspective, a singular focus on
carbon quantity eclipses w hat can be an equally enlightening m etric— carbon efficiency, m easured in
em issions per passenger per m ile.
Looking at em issions per passenger per m ile norm alizes for size, allow ing us to com pare the
characteristics of disparate routes, planes, airlines, and corporate travel program s, and expose the
underlying com ponents of efficiency. Just as im portantly, an efficiency focus uncovers opportunities to
reduce im pacts in w ays other than sim ply cutting flights.
! 6
2 IATA Economic & Social Benefits of Air Transport; Airports Council International W orld Airport Traffic Report3 ICAO Environmental Report 2010; IATA Industry Facts June 2011
4 ICAO Environmental Report 2010; EEA G HG Inventory; U S EPA G HG Inventory
“ An efficiency focus reveals
opportunities to reduce im pact in
w ays other than cutting flights.
”

The range in flight efficiency is striking, varying by a factor of m ore than ten across the industry. A flight
in the 10th percentile for efficiency uses m ore than 2.5 tim es as m uch fuel per passenger per m ile as a
flight in the 90th percentile. The spread in an individual’s air travel efficiency is greater still, because
seat class choice can increase a passenger’s em issions by a factor of alm ost four.5
G iven this variation, treating flights as uniform should be no m ore than a last resort or a crude
ballparking m easure. To effectively m easure and m anage flight efficiency, travel and sustainability
m anagers should understand and account for the key factors that cause this enorm ous variation.
M odeling air travel impacts
This paper uses detailed m odeling to explore the causes and
consequences of the dram atic variation in flight efficiency. In the
follow ing sections w e identify the variables that determ ine flight
efficiency, analyze their relative im portance, rank airlines by their
average efficiency, and investigate how
efficiency is evolving over tim e. This
insight, coupled w ith proper
intelligence on one’s ow n travel, w ill
help individuals and business travel
m anagers actively consider
sustainability alongside cost and
convenience w hen m anaging and
reporting air travel em issions.
The analysis that underlies this paper
w as perform ed using the Brighter
Planet flight carbon and energy m odel
hosted on the w eb-based CM 1
platform . This m odel has been certified
by the leading validator D et N orske
Veritas as com plying w ith the m ajor
international carbon calculation standards. It goes far beyond the
m inim um requirem ents of those standards, accounting for a flight’s
aircraft, seating density, load factor, freight share, and distance. O ur
findings are based on the m odeled em issions of 130 m illion nonstop
flights from 2000 through 2010. The data for these flights is sourced
from com m ercial flight censuses by the U S Bureau of Transportation
Statistics and the International Civil Aviation O rganization.6
7
5 W e do not include the effect of seat class choice in the analysis for this paper, as we only look at variation between rather than within flights. Brighter Planet does account for seat class in flight calculations elsewhere.6 See appendix for more details on data sources and flight modeling methodology.
av
e
in
in
he
Snapshot:
Data sources
• U S Bureau of Transportation Statistics (BTS)
• International Civil Aviation O rganization (ICAO )
• European Environm ent Agency (EEA)
• International Air Transport Association (IATA)
• U S Federal Aviation Adm inistration (FAA)
• O penFlights.org• Em ployee flight data from
tw o G 500 com panies
Snapshot:
Analysis
• Based on m odeled em issions of 9.7 billion passengers on 130 m illion flights from 2000 to 2010
• Perform ed using Brighter Planet CM 1 cloud-based carbon m odels
• M ethodology certified by D et N orske Veritas for com pliance w ith G reenhouse G as Protocol, ISO 14064-1, and Clim ate Registry G RP standards.
Corporate case studies
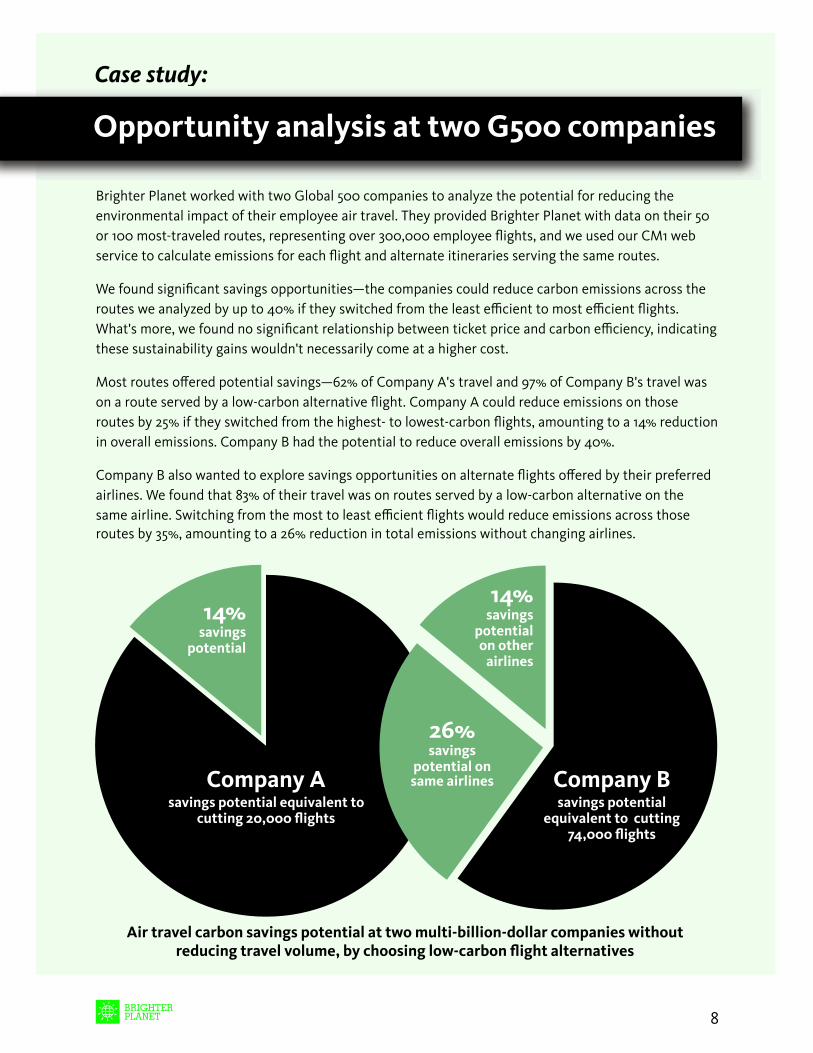
Brighter Planet w orked w ith tw o G lobal 500 com panies to analyze the potential for reducing the
environm ental im pact of their em ployee air travel. They provided Brighter Planet w ith data on their 50
or 100 m ost-traveled routes, representing over 300,000 em ployee flights, and w e used our CM 1 w eb
service to calculate em issions for each flight and alternate itineraries serving the sam e routes.
W e found significant savings opportunities— the com panies could reduce carbon em issions across the
routes w e analyzed by up to 40% if they sw itched from the least efficient to m ost efficient flights.
W hat's m ore, w e found no significant relationship betw een ticket price and carbon efficiency, indicating
these sustainability gains w ouldn't necessarily com e at a higher cost.
M ost routes offered potential savings— 62% of Com pany A's travel and 97% of Com pany B's travel w as
on a route served by a low -carbon alternative flight. Com pany A could reduce em issions on those
routes by 25% if they sw itched from the highest- to low est-carbon flights, am ounting to a 14% reduction
in overall em issions. Com pany B had the potential to reduce overall em issions by 40% .
Com pany B also w anted to explore savings opportunities on alternate flights offered by their preferred
airlines. W e found that 83% of their travel w as on routes served by a low -carbon alternative on the
sam e airline. Sw itching from the m ost to least efficient flights w ould reduce em issions across those
routes by 35% , am ounting to a 26% reduction in total em issions w ithout changing airlines.
8
Corporate case studiesOpportunity analysis at tw o G 500 companies
Case study:
Company Asavings potential equivalent to
cutting 20,000 flights
14%savings
potential
14%savings
potential on other airlines
26%savings
potential on sam e airlines
Air travel carbon savings potential at tw o m ulti-billion-dollar com panies w ithout reducing travel volum e, by choosing low -carbon flight alternatives
Company Bsavings potential
equivalent to cutting 74,000 flights

Efficiency drivers
Five key variables determine a flight's carbon efficiency per passenger per
mile: aircraft model, seating density, load factor, freight share, and distance.
Carbon em issions are directly tied to fuel consum ption, w hich for nonstop flights is is a function of
aircraft m odel and distance. To calculate em issions per passenger per m ile based on a flight’s total
footprint, freight share is used to deduct non-passenger cargo em issions, and rem aining em issions are
then divided by the num ber of passengers on board and the distance flow n. The num ber of passengers
is determ ined by aircraft m odel, seating density, and load factor (the percentage of seats filled).
Brighter Planet's flight carbon and energy m odel uses these five factors to calculate em issions from
passenger air travel. Since m ost passengers know only their flight’s origin, destination, and airline, w e
m aintain a database of nonstop routes taken from the U S BTS T-100 and ICAO TFS that allow s the
m odel to look up the flight’s aircraft, seating density, load factor, and freight share.
This database currently covers U S dom estic flights since 2000
and international flights w orldw ide since 2007. It contains 4.5
m illion nonstop routes covering 130 m illion aircraft departures,
9.7 billion passenger enplanem ents, and 12.8 trillion passenger-
m iles of travel. The m odel also calculates the flight distance
betw een origin and destination, using a m ultiplier to account for
real-w orld routing and circling w hile w aiting for clearance to land.
To exam ine how carbon efficiency and the factors that affect it vary over tim e and throughout the
aviation industry, w e turned CM 1 on itself and calculated the em issions per passenger per m ile, fuel per
capacity pound-m ile, seating density, and distance for all 4.5 m illion nonstop routes in our database.
W hen analyzing the results, w e w eighted each route by the num ber of passengers carried to show the
characteristics of an average passenger's trip.
The follow ing pages cover findings for each of the five key efficiency variables, and how they com e
together to drive overall efficiency variation across the industry and its evolution since 2000.
! 9
“ W e turned CM 1 on itself
to analyze efficiency for
each of the 4.5 m illion
nonstop routes in our
database. ”

Aircraft model
Like cars, planes vary in fuel efficiency. Engine technology, aerodynam ics, size, and other factors affect
the fuel required to haul a pound of cargo one m ile. This variation is significant— an aircraft in the 90th
percentile for efficiency uses less than half the fuel per capacity pound-m ile as one in the 10th
percentile (an aircraft’s capacity pound-m iles is the total quantity of w eight it could carry m ultiplied by
the flight distance).
So w hat m akes som e planes m ore efficient than others? Aircraft size is one factor
— on average, larger planes consum e less fuel per capacity pound-m ile than
sm aller m odels. The scatter plot at left show s the loose but clear relationship of
increasing efficiency w ith aircraft size— a fam iliar relationship for land- and w ater-
based vehicles as w ell. D ot size indicates total passenger volum es, indicating that
m ost travel is on sm all-to-m idsize aircraft, the range through w hich size-
efficiency correlation is strongest.
Based on their fleet m akeup, airlines vary dram atically in their
average aircraft fuel econom y. Am ong the 20 largest airlines,
Cathay Pacific and U nited transport their average passenger on
the m ost efficient planes, w hile Am erican Eagle and ExpressJet
operate the lease efficient fleets.
The average passenger in 2010 flew on a plane 12% m ore
efficient than in 2000. This trend w ill likely continue as aircraft
m anufacturers com pete m ore fiercely on fuel econom y in
response to rising oil prices.
10
AAiiircraffftt modddelllAircraft model
Efficiency driver:
aircraft fuel per capacity pound-mile0
# o
f passe
ng
ers
Cathay Pacific
U nited Airlines
Alaska Airlines
JetBlue Airways
American Airlines
Ryanair
U S Airways
Delta Air Lines
KLM Royal Dutch
Northwest Airlines
Continental Airlines
Southwest Airlines
Lufthansa
Air France
AirTran Airways
easyJet
SkyW est Airlines
ExpressJet Airlines
British Airways
American Eagle
payload capacity (i.e. aircraft size)
lb f
ue
l/lb
-mil
e
0.00039
0.00043
0.00047
2000 2001 2002 2003 2004 2005 2006 2007 2008 2009 2010
0
(mo
re effi
cien
t)
(more efficient)
(mo
re effi
cie
nt)
airc
raft
fu
el p
er
cap
acit
y p
ou
nd
-mil
e
aircraft fuel per capacity pound-mile

Seating density
N ot all 747-800’s are created equal. W hen an airline takes delivery of a new or refurbished aircraft, the
cabin is custom ized according to the desired size and m ix of seats. O ne airline m ight choose to outfit
their new Airbus A320 w ith a spacious first class, an econom y plus class w ith extra legroom , and a
standard econom y class, w hile another m ight outfit the sam e Airbus 320 w ith the m axim um possible
num ber of high-density coach seats. The m ore passengers a given aircraft m odel can accom m odate, the
less fuel used per passenger.
To com pare seating density efficiencies across aircraft of
different sizes, w e calculated a “seat density coefficient”
that indicates how the density of seats on a particular
plane com pares to the industry-w ide average for that
m odel of aircraft. If JetBlue fits 156 seats on its Airbus
A319 w hile the average Airbus A319 accom m odates only
120 seats, then the JetBlue plane’s coefficient w ould be
156/120, or 1.3.
Seating density varies significantly across the aviation
industry. Am ong the 20 largest airlines, the average
passenger on easyJet and Ryanair see the m ost efficient
cabin configurations, w hile British Airw ays and
Lufthansa fit the few est seats onto a given plane.
Seat density is closely tied to seat class— a large first or
business class section dram atically low ers an aircraft’s
seat density. This paper only looks at variation betw een
flights, so w e distinguish betw een aircraft that contain a
larger or sm aller first class section, but don’t address the
effect on an individual’s footprint of choosing a first
class seat versus econom y. But travelers looking to lim it their flight footprint should clearly rem em ber
that econom y seats have a m uch sm aller im pact than business or first class seats. The Brighter Planet
CM 1 flight carbon and energy m odel does take this into account.
11
SSSeattiiing dddensiiittySeating density
Efficiency driver:
seat density coefficient0.8 1.2
easyJet
Ryanair
Cathay Pacific
KLM Royal Dutch
Southwest Airlines
AirTran Airways
JetBlue Airways
ExpressJet Airlines
American Eagle
Delta Air Lines
Northwest Airlines
SkyW est Airlines
U S Airways
American Airlines
Continental Airlines
Alaska Airlines
U nited Airlines
Air France
Lufthansa
British Airways
0.8 1.0 1.2seating density
# o
f passe
ng
ers
(mo
re effi
cien
t)
(more efficient)

Load factor
Passenger load factor— the portion of available seats filled on a given flight— has a m ajor influence on
each passenger’s footprint, because total em issions are divided am ong the passengers on board. Few er
occupied seats m eans a larger share assigned to each person.
The average passenger travels on a flight that’s 80% full,
w hile the average flight is 74% full. But load factor varies
significantly across the aviation industry— a flight in the
90th percentile for load factor is m ore than 1.5 tim es as full
as one in the 10th percentile.
An airline’s average load factor is a m ajor driver of overall
com petitiveness on efficiency per passenger per m ile.
Am ong the 20 largest airlines globally, Ryanair and easyJet
have the highest load factors, or few est em pty seats, w hile
Southw est and Cathay Pacific have the low est load factors.
Seat occupancy rates have risen steadily over the past
decade, increasing from an average of 70% in 2001 to 81% in
2010— an im provem ent of m ore than 1% per year. N o other
efficiency driver has seen this rate of progress. W hile room
rem ains for this trend to continue, load factor gains
eventually w ill com e up against lim its.
U nlike m ost of the other efficiency drivers, load factor varies
seasonally. Average load factor follow s a predictable annual
cycle independent of longer trends, reaching peak efficiency
in sum m er m onths and seeing the largest num ber of em pty
seats in w inter.
12
LLoaddd fffacttorLoad factor
Efficiency driver:
load factor0% 100%50%
2000 2001 2002 2003 2004 2005 2006 2007 2008 2009 2010 J F M A M J J A S O N D
load
fa
cto
r
year month
Ryanair
easyJet
Continental Airlines
Northwest Airlines
Delta Air Lines
U nited Airlines
American Airlines
U S Airways
JetBlue Airways
AirTran Airways
KLM Royal Dutch
Air France
ExpressJet Airlines
Alaska Airlines
SkyW est Airlines
British Airways
American Eagle
Lufthansa
Cathay Pacific
Southwest Airlines
load factor
# o
f passe
ng
ers
(mo
re effi
cien
t)
(more efficient)
50% 75% 100%
84%
76%
68%

Freight share
A full 78% of com m ercial passenger flights carry extra cargo beyond passengers and their baggage—
typically m ail or other com m ercial freight— and this w eight claim s a share of the flight’s footprint,
reducing the share for w hich passengers are responsible.
Flight em issions are allocated betw een passengers and
freight according to w eight. A flight’s “freight share” is the
portion of its total payload com prised of freight, w ith the
rem ainder consisting of passengers and baggage.
W hile the vast m ajority of flights carry extra freight, they
typically carry only a sm all am ount. The average freight share
is less than 5% of total payload, w hich translates to a m inim al
im pact on traveler footprints. But for the sm all portion of
passenger flights that do carry significant am ounts of
com m ercial cargo, it can have an im portant effect on
passenger em issions.
Freight share is getting sm aller by the year. Betw een 2000
and 2010, average freight carried w as cut nearly in half. This
trend corresponds w ith an increase in passenger load factor,
suggesting the possibility that freight is being supplanted by
passengers w ith little net effect on efficiency. But correlation
analysis show s the tw o trends are alm ost entirely
independent (the w eighted correlation coefficient is just
-0.05), w ith freight share decreases happening in different
segm ents of the m arket from load factor increases. Freight
share is generally higher on international flights, so the
declining trend in freight share m ay be accom panied by an
increase in em issions per passenger per m ile on these flights.
13
Freight shareFreight share
Cathay Pacific
British Airways
KLM Royal Dutch
Air France
Lufthansa
U nited Airlines
American Airlines
Continental Airlines
Delta Air Lines
Northwest Airlines
Alaska Airlines
U S Airways
Southwest Airlines
JetBlue Airways
AirTran Airways
ExpressJet Airlines
American Eagle
SkyW est Airlines
Ryanair
easyJet
0% 10% 20% 30%
Efficiency driver:
freight share0% 50%
freight share
3%
4%
5%
6%
7%
2000 2001 2002 2003 2004 2005 2006 2007 2008 2009 2010
# o
f passe
ng
ers
(mo
re effi
cien
t)

Distance
Com m ercial passenger routes cover the full spectrum of distances from short hops to antipodal hauls.
It alm ost goes w ithout saying that distance traveled is the single m ost im portant determ inant of a
passenger’s total flight footprint, and nearly every flight carbon calculator takes it into account. But
w hat’s less intuitive, and less often accounted for, is that distance also affects efficiency— fuel used per
m ile. Takeoff and ascent guzzle far m ore fuel than cruising at altitude, m aking short flights m ore fuel-
intensive than all but the longest intercontinental flights, w here fuel w eight reduces efficiency.
This analysis only looks at nonstop flights, but adding
stopovers betw een origin and final destination has a
double effect on em issions— a stop is certain to increase
the total distance flow n,
and it breaks a single
flight into tw o shorter
flights, decreasing the
efficiency of each.
An aircraft’s fuel use can be m odeled as a com plex m athem atical
equation that accounts for the changes in efficiency over the different
flight stages. As the above chart show s, efficiency on a long trip can be
m any tim es higher than on a short flight.
M ost passengers travel less than tw o thousand m iles, but it’s a long-
tailed distribution, w ith significant num bers of flights at m uch longer
distances. O rganizations w hose em ployees typically fly long distances
w ithout stopovers— and airlines that disproportionately cover longer
routes— end up m ore fuel-efficient than their counterparts.
Average flight length has increased steadily since 2003, due perhaps in
part to airlines shifting aw ay from inefficient shorter routes to keep
pace w ith rising fuel costs. Regardless of the cause, a continuation of
this trend w ould m ean increased efficiency across the industry in
com ing years. Average flight distance also fluctuates seasonally, w ith
peaks in sum m er and w inter.
14
DDiiisttanceDistance
Efficiency driver:
miles0 7000
Airbus A320Boeing 737-400
miles0 2000
ave
rag
e t
rip
fu
el e
con
om
y
Cathay Pacific
Air France
British Airways
KLM Royal Dutch
Lufthansa
U nited Airlines
Continental Airlines
Delta Air Lines
Northwest Airlines
American Airlines
JetBlue Airways
U S Airways
Alaska Airlines
easyJet
AirTran Airways
Ryanair
Southwest Airlines
ExpressJet Airlines
SkyW est Airlines
American Eagle
0 2800
(mo
re effi
cien
t)
(mo
re effi
cie
nt)
(more efficient)
# o
f p
asse
ng
ers
miles
mil
es
year month
2000 2001 2002 2003 2004 2005 2006 2007 2008 2009 20101,130
1,195
1,260
J F M A M J J A S O N D

O verall efficiency
Taken together, diversity in distance, aircraft, seating density,
load factor, and freight share creates significant variation in
overall em issions per passenger per m ile.7 To reiterate,
passenger carbon footprints per m ile vary by m ore than a
factor of ten across the industry, w ith m any flights falling
outside the peak of the bell curve.
Although each of the five factors can theoretically have a
large effect on efficiency, their real w orld im portance is in fact
hardly uniform . The data show that som e factors are m uch
bigger drivers of efficiency variation than others, w ith the
correlation coefficient (m easuring the strength of the
relationship betw een each variable and final flight efficiency)
varying significantly am ong the five factors. Aircraft fuel
econom y show s the strongest correlation w ith em issions per
passenger per m ile, w hile seat density coefficient is the
w eakest predictor of a flight’s overall efficiency.
Selecting flights w ith high load factors and efficient aircraft
m odels is a better strategy for m inim izing em issions than
choosing itineraries based on seating density and freight
share— although accounting for all factors is the only w ay to
ensure robust reporting and m anagem ent. D istance is
typically a given w hen selecting a flight, but it’s w orth noting
that nonstop flights are m ore efficient because relative to
indirect flights they increase efficiency w hile decreasing total
distance.
! 15
7 Factoring in seat class, which is not accounted for here, would make this spread greater still.
emissions per passenger per mile
O verall efficiency
0
0
0.25
0.50
0.75
airc
raft
fu
el e
con
om
y
load
fac
tor
flig
ht
dis
tan
ce
fre
igh
t sh
are
seat
ing
de
nsi
ty
pas
sen
ge
r-w
eig
hte
d c
orr
ela
tio
n c
oe
ffic
ien
t
(more im
portant)
(more efficient)
# o
f p
asse
ng
ers
RELATIVE IM PO RTAN CE IN DRIVIN G FLIGH T
EFFICIEN CY
FLIGH T EFFICIEN CY DISTRIBUTIO N

Flight case studies
The follow ing real-w orld flights show the footprint variation for three sam ple city
pairs. In each case, the least efficient flight em its at least tw ice as m uch as
the m ost efficient. For exam ple, the flight from N .Y. to L.A . on Q antas
has alm ost three tim es the im pact as the JetBlue flight. That's
because the Q antas plane is larger and less efficient,
burning 40% m ore fuel per capacity pound-m ile, and it
is half em pty, only carrying 44 m ore passengers
than the JetBlue flight. The second exam ple
show s the variation that often exists
even w ithin a single airline.
16
Flight case studiesFlight footprint comparison
Case study:
1320 miles
M UM BAI to DUBAI
2640 miles
N EW YORK to LOS AN GELES
FO O TPRIN T (Lb CO 2e)
198320
765 767666
13231220
2207
2976
243 miles
CH ARLOTTE to ATLAN TA
AIRLIN EN AM E
AIRCRAFT M O DEL
AIRCRAFT FUEL/LB-M I
LO ADFACTO R
FREIGH T SH ARE
SEAT DEN SITY
SEATS
Cath
ay Pacifi
cB
747
0.0
00
41
49
%32%
1.0378
Cath
ay Pacifi
cA
3300
.00
034
63%4
2%1.0
268
Cath
ay Pacifi
cA
340
0.0
00
358
5%28
%1.0
283
No
rthw
est
A319
0.0
010
674
%0
%0
.454
US
Airw
aysE
RJ19
00
.00
06
783%
1%1.0
99
De
ltaB
737-80
00
.00
04
69
1%1%
1.016
0
Qan
tasB
747-4
00
0.0
00
396
0%
12%0
.9315
Un
ited
757-200
0.0
00
309
4%
8%
0.6
110
JetB
lue
A320
0.0
00
289
3%2%
1.0150

Airline rankings
Som e airlines are m uch m ore successful at optim izing efficiency than others. This study is far from the
first to rank airlines on sustainability, but few predecessors have accounted for passenger volum es and
all five efficiency drivers to provide as accurate a rating on real-w orld em issions per passenger per m ile.
Am ong the 20 largest airlines by
passenger volum e, the cleanest,
Ryanair, uses barely m ore than a
third the fuel to transport its average
passenger one m ile com pared to the
least efficient, Am erican Eagle. From
a business perspective, as from an
environm ental one, this is nontrivial
— higher efficiency is a boon that
allow s airlines to pass financial and
environm ental savings on to their
custom ers.
Ryanair succeeds by ranking first or
second for efficiency in load factor
and seating density, w hile runner-up
Cathay Pacific ranks first on aircraft
fuel econom y, distance, and freight
share.
It should be kept in m ind that w hile
enorm ous efficiency variation exists
am ong airlines, the sam e is true
w ithin each airline. W hile the airline
averages presented here are
insightful in understanding air travel
dynam ics, using them in calculations
for any specific flight com m its the
sam e error as failing to account for
efficiency variation in the first place.
17
Ryanair
Cathay Pacific
easyJet
Continental Airlines
United Airlines
JetBlue Airw ays
KLM Royal Dutch
Am erican Airlines
Delta Air Lines
Alaska Airlines
US Airw ays
British Airw ays
N orthw est Airlines
AirTran Airw ays
Air France
Lufthansa
Southw est Airlines
ExpressJet Airlines
SkyW est Airlines
Am erican Eagle
0
0.7
5
OVERALL IN DUSTRY
Airline rankingsAirline efficiency rankings
effi
cien
tin
effi
cien
t
Lb CO2e per passenger-mile

! 18
Ryanair
Singapore Airlines
Delta Air Lines
Continental Airlines
N orthw est Airlines
Iberia
Cathay Pacific
easyJet
United Airlines
Am erican Airlines
Asiana Airlines
Air Canada
Japan Airlines
Korean Air
KLM Royal Dutch
British Airw ays
Air France
SW ISS
Lufthansa
SAS
0
0.5
0
Continental Airlines
JetBlue Airw ays
Frontier Airlines
United Airlines
Alaska Airlines
Am erican Airlines
Delta Air Lines
US Airw ays
AirTran Airw ays
N orthw est Airlines
Southw est Airlines
Atlantic Southeast
ExpressJet Airlines
SkyW est Airlines
Com air
Pinnacle Airlines
H aw aiian Airlines
M esa Airlines
Chautauqua Airlines
Am erican Eagle
0
0.7
5
U.S. DOM ESTIC M ARKET
IN TERN ATION AL M ARKET
efficie
nt
inefficie
nt
Passenger air travel in the global international
m arket is, on average, m ore efficient than in the
U S dom estic m arket— again, a discrepancy due
in part to flight distance and aircraft size.
Ryanair, Singapore Airlines, and D elta take the
top spots in this sector w hile SAS, Lufthansa,
and SW ISS bring up the rear as least efficient of
the 20 largest airlines.
In the U S dom estic m arket, the picture is sim ilar.
Am ong the 20 largest airlines, Continental,
JetBlue, and Frontier take the top three spots,
w hile M esa, Chautauqua, and Am erican Eagle
place last. These least efficient airlines are all
regional carriers specializing in shorter flights on
sm aller aircraft— characteristics that predispose
them to inefficiency.
Lb CO2e per passenger-mileLb CO2e per passenger-mile

Industry trends
G lobal air travel efficiency has increased m arkedly over the last decade, driven by im provem ents in
aircraft fuel econom y, load factor, and flight distance, the three top drivers. All told, in 2010 it took 20%
less fuel to transport the average passenger one m ile than in 2000.
As em issions per passenger per m ile has decreased, so too has efficiency variation across the m arket.
W hile the spread betw een the 10th and 90th percentile passengers rem ains very large, it has slow ly
narrow ed, w ith efficiency im proving m ore rapidly am ong the dirtiest flights than the cleanest ones. This
m akes sense, as the least efficient end of the m arket has am ple room for im provem ent in m ultiple
areas, w hereas m ore efficient flights are closer to natural lim its and have less room for im provem ent
outside slow ly evolving variables like aircraft fuel econom y.
Still, the inexorable rise in oil prices, the increased efficiency em phasis by aircraft m anufacturers, the
novel routing and air traffic control technologies currently under developm ent, and the prospect of
airline carbon regulation in Europe m ean potential is strong for sustained or even accelerated efficiency
gains over the com ing decade.
! 19
0.4
0.8
1.1
1.5
1.8
2000 2001 2002 2003 2004 2005 2006 2007 2008 2009 2010
10th percentile
90th percentile
average passenger
median passenger
(mo
re effi
cie
nt)
Lb C
O2e
pe
r p
asse
ng
er
pe
r m
ile
TREN DS IN EFFICIEN CY AN D EFFICIEN CY VARIATIO N

In addition to having im proved year-
over-year, average efficiency also
fluctuates m onth-to-m onth— at peak
efficiency in July, the average
passenger’s trip is 15–20% cleaner per
m ile than in January.8 Load factor and
distance are the m ain drivers of this
cycle, as aircraft, seat density, and
freight share show very little m onthly
variation. The chart at right show s
seasonal efficiency cycles from left to
right, and also show s the
im provem ent in efficiency each year
as lines m ove dow nw ard. (N ote the
tem porary spike follow ing the
Septem ber 11, 2001 terrorist attacks,
due to decreased load factors.)
Efficiency im provem ents betw een 2000
and 2010 m ade a very real im pact on
greenhouse gas em issions volum es,
preventing 670 billion pounds of CO 2e
over that period from U S flights alone—
roughly an entire year’s w orth of U S air
travel. This saved airlines 16 billion
gallons of jet fuel valued at over $33
billion9 , an expense that w ould
presum ably have been passed on to
travelers in the form of substantial
airfare increases at a tim e w hen
travelers and travel providers w ere
already struggling in an ailing econom y.
! 20
8 Studies suggest the phenomenon of higher-impact winter flights may be further exacerbated by seasonal variation in radiative forcing effects, increasing the importance of taking time of year into account when measuring and managing air travel climate impact (Stuber et al. 2006).
9 Based on U S Energy Information Association jet fuel pricing data.
0.7
1.4
J F M A M J J A S O N D
2000
2010
(mo
re effi
cie
nt)
Lb C
O2e
pe
r p
asse
ng
er
pe
r m
ile
0
1,000
2000 2001 2002 2003 2004 2005 2006 2007 2008 2009 2010
bil
lio
n p
ou
nd
s
Footprint w ithout efficiency gains
Actual footprint
ACTUAL AN D PREVEN TED EM ISSIO N S FRO M U.S. DO M ESTIC AN D U.S. IN TERN ATIO N AL FLIGH TS
SEASO N AL CYCLES IN FLIGH T EFFICIEN CY
month

Latent opportunity
Travelers have great potential to achieve sustainability goals by leveraging the variation in efficiency
am ong flights— a potential only a few leading organizations have begun to exploit. By adopting best
practices to optim ize for efficiency in air travel carbon m anagem ent, sustainability officers, travel
m anagers, and individuals can see significant sustainability gains.
Air travel carbon efficiency accounting can be a m ajor part of an organization’s sustainability strategy,
helping increase the legitim acy of reporting, identify carbon savings not apparent in cruder analyses,
and drive em issions reductions through selection of low er-im pact flights during the procurem ent
process.
W ithout an aw areness of efficiency variation, the only
recourse for businesses and individuals to reduce air travel
em issions is a reduction in air travel. W hile cutting flights
can and should be a part of sustainability strategies, it is
often an im practical approach that can lead to resignation
for travelers w ho are forced to fly. Selecting flights based
on efficiency adds a new , com plem entary tool to the
sustainability toolkit, em pow ering travelers to m ore
effectively m anage their im pact.
Prelim inary analysis suggests there’s no clear relationship betw een fuel efficiency and ticket price,
indicating these carbon gains don’t have to com e at higher cost. This could be due to tw o opposing
factors: on the one hand, airlines could be expected to reduce prices on efficient flights w here costs per
passenger are low er, as a com petitive m easure to w in custom ers; on the other hand, the fullest flights,
w hich are relatively efficient because of high load factors, are often priced higher due to supply and
dem and. In the end, the issue of air travel pricing strategies is a very com plex one that dem ands
detailed investigation beyond the scope of this paper.
In addition to slashing their ow n travel footprints, increased traveler focus on flight efficiency also has
the potential to accelerate sustainability progress in the airline industry as a w hole. M ajor
organizations m aking travel procurem ent decisions based not just on price and convenience but also
carbon could add a pow erful m arket signal driving com petition am ong air travel providers. Airlines,
booking agencies, and aircraft m anufacturers that can succeed in m eeting fuel econom y dem ands of
the com ing decades stand to gain enorm ous com petitive advantages.
! 21
“ Selecting flights based on
efficiency adds a new,
com plem entary tool to the
sustainability toolkit,
em pow ering travelers to m ore
aggressively m anage their
im pact.
”

Best practices
22
Best practicesBusiness air travel carbon management
Pursue carbon reduction goals through both increases in air travel
efficiency and reduction in air travel volume.
Implement proactive footprint calculation that allow s carbon to be considered alongside price and convenience during booking.
Engage employees in meeting travel sustainability goals via education and
incentives.
Account for each flight’s unique aircraft, load factor, and other characteristics rather than treating all flights as generic.
Set goals for, measure, and report emissions per passenger per mile in
addition to total emissions.
!POLICY
"TRAVEL
#IN VEN TORY
$REPORTIN G
CORPORATE TRAVEL SUSTAIN ABILITY M AN AGEM EN T
%BOOKIN G
!
%
"
#
$
Best practices:
Appendices
M ethodology notes
The flight carbon and energy m odel used to calculate em issions for this analysis has been review ed in
detail by leading carbon validator D et N orske Veritas, and certified as com pliant w ith the G reenhouse
G as Protocol, ISO 14064, and the Clim ate Registry, three leading international carbon accounting
standards.
Airline industry data used in this analysis com e from BTS and ICAO , the authoritative sources for air
travel data. The com bined database, w ith 4.5 m illion nonstop routes, covers international flights
w orldw ide since 2007 and dom estic flights in the U S since 2000; non-U S dom estic flights and any
international flights not reported to ICAO are not included.
Long-term trend analysis of m arket evolutions since 2000 is based on dom estic and international
flights at U S airports. All other analyses, including airline rankings, are based on U S and global data
from 2007 through 2009, the latest years for w hich com plete data is available.
U nless expressly noted, all averages reported in charts and figures are w eighted by passenger volum e
to reflect the likelihood of any given passenger falling on a given flight.
Brighter Planet uses a m ultiplier of 2.0 in all our flight em issions calculations to account for extra
clim ate im pact beyond the standard w arm ing caused by carbon dioxide. This im pact is caused by the
com plex effects of w ater vapor and engine exhaust at high altitudes. The exact m agnitude of these
effects is still the subject of research, but authorities agree that the net result is increased w arm ing. A
m ultiplier of tw o is a w idely-recom m ended best estim ate10, and w e use it on the basis that it is
preferable to possibly overestim ate the em issions of som e flights than to certainly underestim ate the
em issions of all flights. Since the m ultiplier is a constant applied to every calculation, it does not affect
the concepts, rankings, or trends described in this paper.
! 23
10 Stockholm Environment Institute; G HG Management Institute

CM 1 overview
Brighter Planet CM 1, the softw are platform used to perform the calculations for this report, is a cloud-
based w eb service designed to enable flexible, accurate footprint analysis across a w ide range of
em issions sources. Learn m ore at http://carbon.brighterplanet.com /.
CM 1 flight carbon and energy m odel perform ance for this analysisCM 1 flight carbon and energy m odel perform ance for this analysis
Total nonstop routes processed 4,479,135
Sub-calculations per em issions com putation 21
Em issions com putations per second 63
Total processing tim e 15 hours
External data references 36
References
The sources for outside statistics cited in this report and for raw data pow ering the CM 1 flight carbon and energy m odel are as follow s:
Airports Council International (ACI)• W orld Airport Traffic Report for 2009 (http://w w w .airports.org/cda/aci_com m on/display/m ain/
aci_content07_c.jsp?zn=aci&cp=1-5-54_666_2__)
Carbon D isclosure Project (CD P)• 2010 G lobal 500 Report (https://w w w .cdproject.net/en-U S/Results/Pages/All-Investor-
Reports.aspx)• 2009 G lobal 500 Report (https://w w w .cdproject.net/en-U S/Results/Pages/All-Investor-
Reports.aspx)
European Environm ent Agency (EEA)• Air Pollution Em ission Inventory G uidebook 2009 (http://w w w .eea.europa.eu/publications/em ep-
eea-em ission-inventory-guidebook-2009)• Annual European U nion G reenhouse G as Inventory 1990–2009 and Inventory Report 2011 (http://
w w w .eea.europa.eu/publications/european-union-greenhouse-gas-inventory-2011)
International Air Transport Association (IATA)• Airline Codes (http://w w w .iata.org/ps/publications/Pages/code-search.aspx)• Fact Sheet: Econom ic & Social Benefits of Air Transport (http://w w w .iata.org/pressroom /
facts_figures/fact_sheets/Pages/econom ic-social-benefits.aspx)• Industry Statistics June 2011 (http://w w w .iata.org/pressroom /facts_figures/fact_sheets/
D ocum ents/Industry-Facts-June2011.pdf)
! 24

International Civil Aviation O rganization (ICAO )• Carbon Em issions Calculator M ethodology (http://w w w 2.icao.int/en/carbonoffset/D ocum ents/
ICAO % 20M ethodologyV3.pdf)• Environm ental Report 2010 (http://w w w .icao.int/env/Pubs/EnvReport10.htm )• Traffic by Flight Stage (TFS) (http://icaodata.com /default.aspx)
International O rganization for Standardization (ISO )• Country Codes (http://w w w .iso.org/iso/english_country_nam es_and_code_elem ents)
Kettunen et al. (2005)• Flight Efficiency Studies in Europe and the U nited States (http://w w w .atm sem inar.org/
sem inarContent/sem inar6/papers/p_055_M PM .pdf)
O penFlights.org• Airports D atabase (http://openflights.org/data.htm l#airport)
Stockholm Environm ent Institute (SEI) and G H G M anagem ent Institute (G H G M I)• Kollm uss & Crim m ins (2009): Carbon O ffsetting & Air Travel Part 2: N on-CO 2 Em issions
Calculations (http://sei-us.org/publications/id/13)
Stuber et al. (2006)• The im portance of the diurnal and annual cycle of air traffic for contrail radiative forcing (http://
w w w .nature.com /nature/journal/v441/n7095/abs/nature04877.htm l)
U .S. Bureau of Transportation Statistics (BTS)• Aircraft Type Lookup (http://w w w .transtats.bts.gov/D ow nload_Lookup.asp?
Lookup=L_AIRCRAFT_TYPE)• Carrier Code Lookup (http://w w w .transtats.bts.gov/D ow nload_Lookup.asp?
Lookup=L_CARRIER_H ISTO RY)• D B1B Airline O rigin and D estination Survey (http://w w w .transtats.bts.gov/D atabaseInfo.asp?
D B_ID =125)• Air Carrier Statistics (T-100) (http://w w w .transtats.bts.gov/D atabaseInfo.asp?D B_ID =111)
U .S. Energy Inform ation Adm inistration (EIA)• M onthly Energy Review (http://w w w .eia.gov/m er/contents.htm l)• Annual U .S. Kerosene-Type Jet Fuel Retail Sales by Refiners (http://w w w .eia.gov/dnav/pet/hist/
LeafH andler.ashx?n=PET&s=EM A_EPJK_PTG _N U S_D PG &f=A)
U .S. Environm ental Protection Agency (EPA)• Inventory of U .S. G reenhouse G as Em issions and Sinks: 1990-2008 (http://w w w .epa.gov/
clim atechange/em issions/usgginv_archive.htm l)
U .S. Federal Aviation Adm inistration (FAA)• JO 7340.2B Contractions (http://w w w .faa.gov/air_traffic/publications/atpubs/CN T/5-2.htm )
! 25