capital programme 2010/11 revenue estimates and - lbhf | · · 2017-10-31capital programme...
TRANSCRIPT

Revenue estimates andcapital programme 2010/11
Jane West - DIRECTOR OF FINANCE & CORPORATE SERVICES
Hammersmith & Fulham Council
Jane W
est - DIRECTO
R OF FIN
AN
CE & CO
RPORA
TE SERVICES
Reven
ue estim
ates and
capital p
rog
ramm
e 2010/11
Cv.FD revenue estimates 10-11 1Cv.FD revenue estimates 10-11 1 29/03/2010 10:4529/03/2010 10:45

~ 1 ~
Introduction 3
Revenue Budget Summary 4
General Fund Summary - Change Between Years 5
Capital Budget Summary 8
Budget Book Guidance 12
General Fund Summary 13
Housing Revenue Account Summary 97
Departmental Revenue Estimates
Children’s Services 16
Community Services 31
Environment Services 43
Residents Services 55
Finance & Corporate Services 65
Central Items 83
Housing Revenue Account 95
Capital Programme
General Fund 111
Housing Revenue Account 122
Glossary 125
CONTENTS

~ 2 ~

~ 3 ~
Overall Revenue Budget Hammersmith & Fulham has an integrated business cycle whereby the Medium Term Financial Strategy (MTFS) interlocks with departmental service planning as driven by local and national priorities. The overall revenue budget is built up on a departmental basis, with each Service’s revenue estimates reviewed by the appropriate Scrutiny Committee. The consolidated estimates are presented before the Budget Council for approval. The final product of this process is the Budget Book, otherwise known as the ‘Revenue Estimates & Capital Programme.’ Other publications The council also produces the following two publications which show different aspects of the council’s finances:
• Council Tax and Business Rates booklet • Statement of Accounts
Further details about these can be obtained from: Jane West Director of Finance & Corporate Services London Borough of Hammersmith & Fulham Town Hall, King Street Hammersmith W6 9JU List of Contacts
Children’s Services David McNamara 020 8753 3404
Community Services Mark Jones 020 8753 5079
Environment Services David McNamara 020 8753 3404
Residents Services Gary Hannaway 020 8753 3031
Finance & Corporate Services Pat Gough 020 8753 2542
Housing Revenue Account Peter Benz 020 8753 2805
INTRODUCTION

~ 4 ~
Background to the Budget Strategy For 2010/11 the Council has received a 1.5% increase in central government funding. Under the current funding arrangements, central government grant provides around 65.5% of Hammersmith & Fulham’s net resources with the remaining 34.5% coming from Council Tax. Every 1% increase in the Council’s net expenditure that is not financed by central government equates to a 2.9% increase in Council Tax. Since 2006/07, schools have been funded from the ring-fenced, Dedicated Schools Grant (DSG). The Government is now responsible for determining each local authority’s ‘Dedicated Schools Budget’ (DSB) – the amount spent locally on schools and other services for pupils. Local authorities can opt to top-up such funding through additional contributions. Direct government funding of schools requires LBHF to exclude the DSB from the Council’s budget requirement. The Council facilitates the budget setting process through the implementation of a Medium Term Financial Strategy (MTFS). The MTFS identifies savings and growth items on a rolling three-year basis. These items have been evaluated for each department for 2010/11 and incorporated into the budget. Under Section 25 of the Local Government Act 2003, the Director of Finance & Corporate Services is required to include in budget reports a statement of her view of the adequacy of the reserves for which the budget provides. In a report to Budget Council on 24 February 2010 the Director of Finance & Corporate Services confirmed her satisfaction that the level of the Council’s balances, reserves and provisions proposed in the report for 2010/11 are adequate and sufficient to allow for the risks identified. The Director of Finance & Corporate Services considers that the optimal level of balances should be set at £12 - £15m. It is expected that at the end of 2009/10 there will be approximately £12.7 in general reserves. This is 6.8% of the current budget requirement. There is no proposal to increase these reserves in 2010/11. This will leave them at 6.9% of the Council’s 2010/11 budget requirement of £184.3m. Under Section 25 of the Local Government Act 2003, the Director of Finance & Corporate Services is also required to include a statement of her view of the robustness of the estimates included in budget reports. At Budget Council on 24 February 2010 the Director of Finance & Corporate Services confirmed her satisfaction with the accuracy and robustness of the estimates included in the report. The Budget Requirement The Council’s budget requirement is funded from Revenue Support Grant (RSG), redistributed Non-Domestic Rates (NDR), and Council Tax. RSG and NDR together are known as Formula Grant and this can be used by a local authority for any statutory purpose. In addition, local authorities receive specific grants for particular Government or Agency purposes. The budget requirement is presented net of such ringfenced grants.
REVENUE BUDGET SUMMARY

~ 5 ~
Table 1 – Movement Between 2009/2010 and 2010/2011
£000
2008/09 Budget Requirement 185,764
Less Contribution to General Reserves in 2009/10 (1,337)
Add
Inflation 2,119
Growth 10,442
General Contingency 654
Less
Efficiency Savings and Income Generation (13,297)
Net 2010/11 Budget Requirement £ 184,345
The Medium Term Financial Strategy This rolling plan interconnects the council’s overall strategic priorities with appropriate funding levels and a challenge process that drives forth service innovations and finds efficiencies. This process has for the past three years enabled the council to cut council tax by 3% each year and deliver the same decrease this year. The strategy identifies risks facing the Council and its objectives with plans to respond to these. Areas of risk include future inflation, demographic changes in the Borough, central government funding and debt management. The Council’s departments identified the following efficiency savings and areas of increased income as part of the MTFS process. Table 2 – Departmental breakdown of Efficiency savings and Income generation
£000
Children’s Services (2,165)
Community Services (3,604)
Environment Services (3,516)
Residents Services (1,562)
Finance & Corporate Services
(1,870)
Central Items (580)
Total Efficiencies and Income generation £ (13,297)
16%
27%
26%
12%
14%
4%

~ 6 ~
The Council’s departments identified the following growth requirements in total during the MTFS process. Table 3 – Departmental breakdown of Growth requirements
£000
Children’s Services 1,515
Community Services 840
Environment Services 200
Residents Services 2,037
Finance & Corporate Services
2,157
Central Items 3,693
Total Growth Required £ 10,442
Formula Grant Formula Grant is the collective term for the Revenue Support Grant and redistributed Non Domestic Rates paid by the government to local authorities. It is distributed on the basis of a four block model through the Local Government Finance Settlement. The four block model takes account of each local authority’s relative needs, a central allocation, floor damping and their relative resources. Full details of how the calculations work are set out in the Local Government Finance Report as approved by Parliament each year. The breakdown of the 2010/2011 Formula Grant allocation with a prior year comparison for Hammersmith & Fulham is as follows:
2010/11 £000 2009/10 £000
Revenue Support Grant 15,332 22,345
Redistribution from Non Domestic Rates 105,590 96,808
Net Formula Grant £ 120,922 £ 119,153
Under the current arrangements for Non Domestic Rates, often referred to as Business Rates, the council collects the rates from businesses within its boundaries. The NNDR is based upon local rateable values, which are then multiplied by a uniform ‘multiplier’ set by central government to provide the total amount due. The total amount due, less certain reliefs and other deductions, is paid into a central pool managed by the government, which in turn pays back to local authorities their share of the pool based on a standard amount per head of population. From 2010-11, the Mayor of London will introduce a Supplementary Business Rate on non-domestic properties with a rateable value of over £55,000. This is calculated at 2 pence in the pound and will fund Crossrail, this being a new east-west rail link across London and beyond.
14%
8%
2%
20%
35%
21%

~ 7 ~
Council Tax The Council is obliged by statute to set a balanced budget and has a responsibility to set Council Tax in accordance with the Local Government Act 1992. Council Tax is a tax on property. It is made equitable by classifying domestic properties into various valuation bands and subject to certain reliefs and discounts. In London, not only does each Borough raise council tax, the Greater London Authority (GLA) also precepts council tax. The GLA is made up of London’s Mayor and the Assembly, and it is responsible for budgets and strategy on London transport, spatial development, economic development, the Metropolitan Police and fire services. The combined bill from both organisations is the amount that residents see on their bills. The resource to be raised by this local tax is calculated as follows:
£000
Hammersmith & Fulham Budget Requirement 184,345
Greater London Authority 24,492
less: Formula Grant (120,922)
add: Prior Year Collection Fund deficit 750
Council Tax Requirement £ 88,665
There are eight bands from A to H, arranged in increasing property value. All property bands are expressed as ratios of Band D, A to C being smaller and E to H being larger. Band D is used as the middle band upon which the Council Tax demand is based and all other bands are converted to a ‘Band D equivalent’ by using the appropriate ratio. The Tax Base for the council is the sum of all Band D equivalents multiplied by the tax collection rate. For 2010/11 the Council has formally agreed a Tax Base of 79,052 Band D equivalent properties. The Council may exercise its power to reduce discounts previously given in respect of second homes and empty properties. Eligible residents will be assisted with bills through their access to Council Tax benefit. The movement in the Band D Council Tax amount is set out below:
2009/10 2010/11 Change
Hammersmith & Fulham £ 836.89 £ 811.78 £ (25.11)
Greater London Authority £ 309.82 £ 309.82 nil
Total Council Tax £ 1146.71 £ 1121.60 £ (25.11)
For the fourth successive year, Hammersmith & Fulham has reduced its element of the council tax charge by 3%. This gives residents the fifth lowest council tax in London which is also the fifth lowest in England. Levies Under various statutory Parliamentary Acts and Regulations, the Council is also levied by the following organisations:
Purpose 2009/10 2010/11
Environment Agency Flood Defence 138,744 157,246
Lee Valley Regional Park Regional Park for all Londoners 245,150 241,201
London Pension Fund Authority Pensions Liability from former Greater London Council
1,211,137 1,215,776

~ 8 ~
Introduction This section sets out the 5 year capital programme for 2010/11 to 2014/15, which represents the Council’s investment in a range of services from housing, schools, infrastructure, parks to IT in the Borough. The existing Capital Programme has been updated as part of the 2010/11 budget process and reflects the following:
• Updated capital forecasts, giving a more up-to-date assessment of the amount and timing of capital expenditure,
• The existence of any uncommitted schemes, • The approval of any new schemes, subject to confirmation of specific funding
An important element of the capital programme is the Council’s debt reduction strategy. Since 2006/07, the Council has put in place a debt reduction strategy which has enabled £24m of capital debt to be repaid by the end of 2008/09. By 2010/11, this will have delivered annual revenue savings of £2.9m. The capital programme will seek to consolidate these savings whilst funding essential new investment and key Council priorities. Opportunities for further debt reduction continue to be explored. Investment in Services The proposed capital programme and resource forecast is summarised in Table 4. The overall programme is forecast to be in surplus to the end of 2011/12 and move towards a cumulative deficit of £1.079m by the close of 2014/15. This level of potential future deficit is considered manageable given the overall size of the programme and opportunities for identifying future resources. A full breakdown of the general fund capital schemes is provided on page 111. Table 4 – General Fund Capital Programme Summary
All figures in £000 2010/11 2010/11 – 2014/15
Expenditure
Children’s Services 10,893 18,193
Community Services 2,170 2,170
Environment Services 13,639 40,952
Finance and Corporate Services 1,773 7,973
Resident Services 4,293 6,293
Total Expenditure 32,768 75,581
Resourced by:
Deficit brought forward from 2009/10 160 160
Capital Receipts (10,804) (29,944)
Government Grants (14,428) (14,428)
Section 106 (4,663) (7,226)
Transport for London (2,391) (2,391)
Revenue Contributions (1,000) (5,000)
Borrowing (MRP) 0 (17,600)
Other Income (231) (231)
Total Resources (33,357) (76,660)
Cumulative Balance (Surplus)/ Deficit (589) 1,079
CAPITAL BUDGET SUMMARY

~ 9 ~
Within the capital programme, the Council maintains a core rolling programme. These ensure that the Council continues to make a capital investment in key areas and are summarised in Table 5 below. Table 5 – Core Rolling Programmes
All figures in £000 2010/11 2011/12 2012/13 2013/14 2014/15
Carriageways 1,350 1,350 1,350 1,350 1,350
Footways 750 750 750 750 750
Planned Maintenance 2,500 2,500 2,500 2,500 2,500
Disabled Access 250 250 250 250 250
Private Sector Housing Grants 450 450 450 450 450
Continued investment in Parks 500 500 500 500 500
IT Infrastructure 800 800 800 800 800
Pump priming projects 750 750 750 750 750
Total 7,350 7,350 7,350 7,350 7,350 Future Projects The Council has embarked on a number of major projects that are likely to impact on the capital programme over the next five years. As these projects progress, further amendments will be made to the figures set out in Table 4. These include: Building Schools for the future (BSF) BSF is a largely government funded programme that is intended to deliver transformational teaching and learning environments to secondary age students. Based on pupil numbers, it has been estimated that the Council will eventually incur capital expenditure of £207m of which £190m will be funded by capital grant. The remaining £17m will be funded via a combination of prudential borrowing, Section 106 contributions and land disposals. The BSF team within Children’s Services completed the Outline Business Case (OBS) on 7 October and are currently waiting approval from Partnership for Schools (PfS) in order to proceed to the procurement phase of the programme. Primary and Special Schools Strategy This strategy sets out a five year vision. The funding vehicle for implementation of the Primary Strategy is the government capital grant provided through the Primary Capital Programme (PCP). This is intended to provide capital funding for transformation of the primary estate from 2009/10 over a period of 15 years. The current funding allocation is £3.159m in 2009/10 and £5.537 in 2010/11. King Street Regeneration The Council is currently taking forward proposals for this scheme which includes a major change to the existing Civic Accommodation provision in Hammersmith. At present a developer has been appointed to take forward this scheme. It is hoped that the strategy can be delivered at net nil cost to the Council but this position, particularly in the light of the current economic conditions, will need to be kept under review.

~ 10 ~
White City Collaborative Care Centre (LIFT CO) Work is expected to start during 2010 on the White City Collaborative Care Centre. The centre, based on the old Janet Adegoke Leisure Centre site, will be both a flagship joint health and social care service centre operated in conjunction with H&F Primary Care Trust (PCT). As part of the Council’s priority to increase home ownership in the borough, there will also be a major housing development. The planning permission, subject to the completion of a section 106 legal agreement, is for 175 residential units above the collaborative care centre, comprising of 105 market units and 70 affordable. The 70 affordable units will be a mixture of bed sizes from studio accommodation through to family sized dwellings. The affordable housing will be low cost home ownership tenures affordable to residents in the borough on low to moderate incomes This scheme is expected to play a significant role in regenerating the physical environment in the north of the borough. Decent Neighbourhoods The Community Strategy set out the borough’s ambitions to become a Borough of Opportunity and tackle deprivation through a regeneration programme. Options were developed in 2007/08 for the delivery of housing capital receipts to support these objectives. A summary of the five year forecast is set out in Table 6. Table 6 – Regeneration Programme Summary
All figures in £000 2010/11 2010/11 - 2014/15
Planned Expenditure 6,826 7,747
Resourced By:
Capital Receipts brought forward (13,078) (13,078)
Planned Capital Receipts (7,435) (11,336)
Reimbursement from the General Fund (918) (918)
Total Resources (21,431) (25,332)
Cumulative Balance (Surplus)/ Deficit (14,605) (17,585)
To date, the two most significant schemes approved are Watermeadow Court and the Pennard Road scheme. This represents HRA capital expenditure and will be accounted for accordingly. Other regeneration proposals are expected to be brought forward for consideration in the forthcoming months. In most instances the Council will need to incur some capital expenditure before sites can be brought forward for regeneration. A full breakdown of the planned schemes is provided on page 119. Housing Revenue Account (HRA) Programme The Council is continuing its work to eliminate all non-decent social housing by December 2010 in line with Government targets. The majority of resources are targeted towards this end. Other programmes of work, currently in the design stage such as fire safety improvements, may require some reallocation of resources once figures have been confirmed. From 2011/12 onwards, it is expected that the capital programme will largely be informed by an investment planning process, which is currently underway.

~ 11 ~
Table 7 – HRA Capital Programme Summary
All figures in £000 2010/11 2010/11 - 2013/14
Expenditure
Decent Homes Standard Work 41,183 76,128
Major Voids 1,243 3,011
Internal Component Work (e.g. Lift Schemes)
1,394 8,279
Major Refurbishments 10,543 13,446
Planned Maintenance 1,450 24,544
Minor Works (e.g. water tanks, lighting) 3,443 6,023
Disabled Adaptations 800 4,000
Estates CCTV Programme 100 200
Other 93 93
Total Expenditure 60,254 135,723
Resourced By:
Supported Borrowing (10,755) (10,755)
Major Repairs Allowance (25,486) (89,203)
Expensive Voids (2,000) (2,000)
Leasehold Contributions (14,319) (24,370)
Specific Funding (7,694) (9,395)
Total Resources 60,254 135,723
Cumulative Balance (Surplus)/ Deficit
0 0
A detailed breakdown of the HRA capital programme is provided on page 121. Treasury Management encompasses the Council’s investments, borrowings and cash flows, banking, money & capital market transactions. The Treasury Management function is undertaken in line with the relevant Accounting Codes of Practice and legislation. A key concern is to ensure that all investments are subject to proper levels of security and liquidity. Provided such proper levels are met the Council will seek to achieve the highest possible rate of return. Any borrowings undertaken will only be for an underlying capital purpose and will be in line with the prudential indicators set out in the Council’s annual Treasury Management Strategy. Given the economic events of the past two years and economists’ predictions for the near future, the Treasury Management Strategy has been updated to respond to current conditions and anticipate future changes. This includes choosing when to reschedule the Council’s portfolio of loans and whether to borrow in advance of need to lock-in low interest rates.
TREASURY MANAGEMENT

~ 12 ~
The Council structure From a budgeting perspective, the council is principally divided into the General Fund and the Housing Revenue Account. Each of these budgets is set independently. This is to ensure that council rents are ringfenced to the council’s housing stock and that council tax funds all the other services the Council provides. Within the General Fund and the Housing Revenue Account, there is both revenue expenditure and capital expenditure. The former is mainly for day-to-day operations and the latter for investment in assets. This can be understood diagrammatically: There are seven departments presented in the Budget Book, Children’s Services, Community Services, Environment Services, Finance & Corporate Services, Residents Services, Central Items and the Housing Revenue Account. Each department contains a number of divisions which are coherent groups of staff who provide a set of services. How to read the budget book High level summaries of the General Fund and the Housing Revenue Account are presented on pages 13 and 98. The budgets are presented in a standard ‘subjective analysis’ format according to best practice guidelines from CIPFA. At this level of detail, budgets are summarised into one of 15 categories including ‘Employee Expenses,’ ‘Supplies & Services,’ and ‘Customer & Client Receipts.’ This is followed by departmental summaries which show the budget movements from 2009/10 to 2010/11 for each division. Subsequent to each departmental summary is a divisional page which groups together a coherent set of services. Each divisional page gives you a description of that service and an itemised list of major movements in budgets and staffing between 2009/10 and 2010/11.
BUDGET BOOK GUIDANCE
General Fund Housing Revenue
Account
Revenue Budget
Capital Budget
Revenue Budget
Capital Budget
Total Council Budget

2010/2011 ESTIMATES
CORPORATE SUMMARY
~ 13 ~

18 19 20
Service Area
2009/2010
Estimates
£000
Inflation
£000
Redirected
Resources
£000
Efficiencies
£000
Growth
£000
Other
Adjustments
£000
2010/2011
Estimates
£000
Children's Services 59,482 469 10 (2,025) 1,534 1,854 61,324
Community Services 75,840 1,167 (266) (3,605) 914 11,569 85,616
Environment Services 3,884 363 (592) (3,516) 237 51 427
Residents Services 33,580 (35) 453 (1,562) 2,098 2,473 37,006
Finance & Corporate
Services9,266 155 1,290 (1,133) 2,757 (607) 11,730
Central Items 29,807 0 934 (1,457) 2,904 (5,314) 26,876
Total Departmental
Expenditure211,859 2,119 1,829 (13,298) 10,444 10,026 222,979
Capital Financing (13,964) 0 0 0 0 312 (13,652)
Use of Balances 516 0 (589) 0 0 (2,270) (2,343)
General Grant (12,647) 0 0 0 0 (9,992) (22,639)
Net Expenditure 185,764 2,119 1,240 (13,298) 10,444 (1,924) 184,345
GENERAL FUND
SUMMARY
~ 14 ~

2009/2010
2010/2011
Number of Full Time Equivalent staff
5,534
5,244
SUBJECTIVE ANALYSIS OF ESTIMATES
2009/2010
Estimates
£000
Inflation
£000
Redirected
Resources
£000
Efficiencies
£000
Growth
£000
Other
Variations
£000
2010/2011
Estimates
£000
Expenditure
Employee Expenses
227,878
101
609
(5,294)
3,060
225
226,579
Premises Related Expenditure
39,087
435
(45)
(1,516)
191
(812)
37,340
Transport Related Expenditure
6,076
0(69)
(21)
03,169
9,155
Supplies and Services
91,273
212
(120)
(982)
2,166
(5,160)
87,389
Third Party Payments
129,466
1,320
433
(1,858)
2,885
3,295
135,541
Transfer Payments
164,334
143
00
1,502
2,414
168,393
Support Services
24,018
01,235
00
28,959
54,212
Capital Charges
47,114
0(12)
00
(835)
46,267
GROSS EXPENDITURE
729,246
2,211
2,031
(9,671)
9,804
31,255
764,876
Service Level Agreement Recharges
(61,665)
0(71)
00
(41,108)
(102,844)
Income
Internal Recharge Income
(51,591)
(2)
(272)
(952)
011,459
(41,358)
Government Grants
(293,950)
00
(210)
400
5,000
(288,760)
Other Reimbursements & Contributions
(46,921)
(1)
(127)
(90)
0256
(46,883)
Customer & Client Receipts
(61,327)
(89)
0(2,225)
240
2,157
(61,244)
Interest & Other
(16,626)
00
00
1,861
(14,765)
Use of Balances & Reserves
1,245
0(320)
(150)
0(2,814)
(2,039)
General Grant
(12,647)
00
00
(9,992)
(22,639)
GROSS INCOME
(481,817)
(92)
(719)
(3,627)
640
7,927
(477,688)
NET EXPENDITURE
185,764
2,119
1,240
(13,298)
10,444
(1,924)
184,345
GE
NE
RA
L F
UN
D
SU
MM
AR
Y
~ 1
5 ~


~ 16 ~
Description of service Children’s Services comprises five divisions which reflect the priorities of school improvement; prevention and early intervention; high quality services for those with the most complex needs; strategic commissioning and service development backed by strong quality assurance; all supported by efficient logistical services. In addition a separate project team has been established to deliver the ambitions of the Building Schools for the Future programme. Children’s Services is committed to delivering the corporate priorities of a top quality education for all and aims to create good quality local schools of choice for local children. Similarly it recognises the importance of working with other departments to deliver cross cutting priorities such as tackling crime and reducing anti-social behaviour. Statement of Core Business Children’s Services continues its clear focus on the government’s ‘Every Child Matters’ agenda and the priorities that have been outlined in the government’s Children’s Plan. The department aims for standards that are consistent with those set out in the UN Convention on the rights of the child. The aim of the department is to create a ladder of opportunity which enables young people to pursue happy and full lives, achieving economic wellbeing. The Workforce Development Strategy and the training plan outline how the department will ensure that Hammersmith and Fulham possesses a valued, skilled and sustainable workforce which is well placed to meet the needs of the local community.
Prime objectives of the department Children’s Services has set out its vision to ‘Create a ladder of opportunity which enables children to lead happy and full lives, achieving economic wellbeing’. This will be achieved in partnership with other statutory, voluntary and private sector agencies. Its eight aims are:
• Improving the health and wellbeing of children and young people • Protecting children by providing a safe environment • Identifying need early, working with families before problems escalate • Improving the quality of nurseries and schools for local children • Encouraging young people to lead active and purposeful lives • Improving the health and wellbeing of children and young people
• Maximising the opportunities open to young people when moving on from school • Achieving best use of resources
These have been formed to help us meet identified need, deliver corporate priorities and achieve the goals that are being set out by the Department for Children, Schools and Families through the Government Office for London and the Local Area Agreement. The Children and Young People’s Partnership Board (CYPPB) leads on the corresponding block of the Local Area Agreement. This overarching multi-agency plan sets out how we will continually improve outcomes and services for children and young people in the borough. The CYPPB is chaired by the lead member for Children’s Services and comprises representatives from West London Mental Health Trust, the Primary Care Trust, the Metropolitan Police, the Learning & Skills Council and local head teachers.
CHILDREN’S SERVICES

~ 17 ~

2010/2011 ESTIMATES
CHILDREN'S SERVICES
~ 18 ~

Service Area Analysis
2009/2010
Estimates
£000
Inflation
£000
Redirected
Resources
£000
Efficiencies
£000
Growth
£000
Other
Adjustments
£000
2010/2011
Estimates
£000
Asylum Seekers 891 64 0 0 0 108 1,063
Building Schools for the
Future917 0 71 (100) (22) 575 1,440
Commissioning,
Performance &
Partnership
5,318 2 37 (479) (20) 221 5,079
Complex Needs 30,533 326 22 (277) 1,231 5,515 37,350
Children's Services
Overheads13,119 0 71 (98) 325 (7,528) 5,889
Resources, Strategy &
Policy0 0 0 0 0 0 0
School Improvement &
Standards4,139 74 0 (298) 7 1,360 5,282
School Funding 20 0 (276) 0 0 256 0
Traded Services 708 0 88 (273) 0 (325) 198
Youth & Community 3,837 3 (2) (500) 13 1,673 5,024
TOTAL 59,482 469 10 (2,025) 1,534 1,854 61,324
CHILDREN'S SERVICES
CHANGE BETWEEN YEARS
~ 19 ~

2009/10
2010/11
Num
ber of Full
Tim
e E
quivalent st
aff
3,5
36
3,346
SUBJECTIVE ANALYSIS OF ESTIMATES
2009/2010
Estimates
£000
Inflation
£000
Redirected
Resources
£000
Efficiencies
£000
Growth
£000
Other
Variations
£000
2010/2011
Estimates
£000
Expenditure
Em
plo
yee E
xpense
s132,8
12
101
39
(1,6
31)
850
2,3
85
134,5
56
Pre
mises Relate
d E
xpenditure
9,9
44
00
(35)
19
1,7
00
11,6
28
Tra
nsp
ort R
elate
d E
xpenditure
2,1
67
00
00
2,8
91
5,0
58
Supplie
s and S
erv
ices
28,1
31
0(1
94)
(155)
465
(7,6
11)
20,6
37
Third P
arty P
aym
ents
29,1
16
365
0(1
05)
03,8
71
33,2
46
Tra
nsfer Paym
ents
1,9
49
30
00
(164)
1,7
88
Support S
erv
ices
(4,0
86)
00
00
13,2
23
9,1
37
Capital Charg
es
3,3
20
00
00
(199)
3,1
21
GROSS EXPENDITURE
203,352
469
(155)
(1,925)
1,334
16,096
219,171
Serv
ice L
evel Agre
em
ent Rech
arg
es
(508)
00
00
(11,1
85)
(11,6
93)
Income
Inte
rnal Rech
arg
e Inco
me
(2,5
47)
00
00
642
(1,9
05)
Govern
ment Gra
nts
(125,6
42)
00
0200
(3,2
40)
(128,6
82)
Oth
er Reim
burs
em
ents
& C
ontrib
utions
(11,2
65)
0165
(50)
0(2
,210)
(13,3
59)
Cust
om
er & C
lient Rece
ipts
(3,9
80)
00
(50)
01,6
24
(2,4
06)
Inte
rest
& O
ther
00
00
00
0
Use
of Balance
s & R
ese
rves
72
00
00
126
198
GROSS INCOME
(143,362)
0165
(100)
200
(3,057)
(146,155)
NET EXPENDITURE
59,482
469
10
(2,025)
1,534
1,854
61,324
CH
IL
DR
EN
'S S
ER
VIC
ES
SU
MM
AR
Y
~ 2
0 ~

2009/2
010
2010/2
011
Full
Tim
e E
quivalents
12
12
Subjective Analysis of Estimates
2009/2010
Estimates
£000
Inflation
£000
Redirected
Resources
£000
Efficiencies
£000
Growth
£000
Other
Variations
£000
2010/2011
Estimates
£000
Expenditure
Em
plo
yees
428
00
00
64
492
Pre
mises
00
00
00
0
Tra
nsp
ort
50
00
0(3
) 2
Supplie
s & S
erv
ices
90
00
0(2
) 6
Third P
arty P
aym
ents
2,2
76
64
00
0(7
64)
1,5
76
Tra
nsfer Paym
ents
428
00
00
(100)
328
Support S
erv
ices
00
00
0132
132
Capital Charg
es
00
00
00
0
Gross Expenditure
3,145
64
00
0(673)
2,536
Service Level Agreement Recharges
00
00
00
0
Income
Inte
rnal Rech
arg
e Inco
me
00
00
00
0
Govern
ment Gra
nts
(1,7
64)
00
00
782
(982)
Reim
burs
em
ents
& C
ontrib
utions
(491)
00
00
0(4
91)
Cust
om
er & C
lient Rece
ipts
00
00
00
0
Inte
rest
& O
ther
00
00
00
0
Use
of Balance
s & R
ese
rves
00
00
00
0
Gross Income
(2,255)
00
00
782
(1,473)
Net Expenditure/ (Income)
891
64
00
0108
1,063
Explanation of major items above
£000
FTE
Realig
nm
ent of M
TFS savin
g
60
nil
Pension g
rowth
4nil
Oth
er adju
stm
ents
44
nil
Total
108
0
This D
ivisio
n p
rovid
es se
rvices in
cludin
g social work
, acc
om
modation, su
bsist
ence
and support to U
nacc
om
panied A
sylu
m S
eekin
g C
hild
ren (UASC), a
nd form
er UASC leavin
g c
are
.
CHILDREN'S SERVICES
ASYLUM SEEKERS
~ 2
1 ~

2009/2
010
2010/2
011
Full
Tim
e E
quivalents
320
312
Subjective Analysis of Estimates
2009/2010
Estimates
£000
Inflation
£000
Redirected
Resources
£000
Efficiencies
£000
Growth
£000
Other
Variations
£000
2010/2011
Estimates
£000
Expenditure
Em
plo
yees
14,9
29
24
50
(132)
535
711
16,1
17
Pre
mises
160
00
031
900
1,0
91
Tra
nsp
ort
584
00
00
2,2
03
2,7
87
Supplie
s & S
erv
ices
4,3
68
0(2
8)
0465
(153)
4,6
52
Third P
arty P
aym
ents
11,5
04
298
0(9
5)
0(8
2)
11,6
25
Tra
nsfer Paym
ents
1,1
69
30
00
(68)
1,1
04
Support S
erv
ices
(51)
00
00
2,4
11
2,3
60
Capital Charg
es
121
00
00
(121)
0
Gross Expenditure
32,783
326
22
(227)
1,031
5,801
39,736
Service Level Agreement Recharges
00
00
00
0
Income
Inte
rnal Rech
arg
e Inco
me
00
00
00
0
Govern
ment Gra
nts
(1,1
05)
00
0200
(293)
(1,1
98)
Reim
burs
em
ents
& C
ontrib
utions
(663)
00
00
(187)
(850)
Cust
om
er & C
lient Rece
ipts
(483)
00
(50)
0194
(339)
Inte
rest
& O
ther
00
00
00
0
Use
of Balance
s & R
ese
rves
00
00
00
0
Gross Income
(2,250)
00
(50)
200
(286)
(2,386)
Net Expenditure/ (Income)
30,533
326
22
(277)
1,231
5,515
37,350
Explanation of major items above
£000
FTE
Tra
nsfer to
Com
plex N
eeds of Safe
guard
ing a
nd Q
ualit
y A
ssura
nce
fro
m C
om
missionin
g, Perform
ance
& P
artners
hip
nil
13
MTFS E
ffficiency
and G
rowth
Pro
posa
ls954
nil
Apportio
nm
ent of Serv
ice L
evel Agre
em
ents
(SLAs)
5,3
17
nil
New C
hild
ren's W
ork
forc
e D
evelo
pm
ent Council Team
(gra
nt fu
nded)
nil
6
Budget Reco
very
Plan A
lloca
tion
340
nil
Capital financing (-1
20) and P
ension g
rowth
(97)
(23)
nil
Virtu
al Sch
ool st
affin
g b
udget transferred fro
m C
om
plex N
eeds to
Virtu
al sc
hool
(134)
(6)
Oth
er adju
stm
ents
(in
c Educa
tional Psy
cholo
gists
(21))
36
(21)
Total
6,490
(8)
This D
ivisio
n c
onta
ins th
e follo
win
g serv
ice a
reas:
Conta
ct a
nd A
ssess
ment, F
am
ily S
upport a
nd C
hild
Pro
tect
ion, Perm
anency
, Fam
ily A
ssist, A
dolesc
ent Serv
ices, D
isabilities,
Fost
ering, Safe
guard
ing a
nd Q
ualit
y A
ssura
nce
, and S
enso
ry L
anguage a
nd Im
pairm
ent Team
.
CHILDREN'S SERVICES
CHILDREN'S SOCIAL CARE
~ 2
2 ~

2009/2
010
2010/2
011
Full
Tim
e E
quivalents
71
60
Subjective Analysis of Estimates
2009/2010
Estimates
£000
Inflation
£000
Redirected
Resources
£000
Efficiencies
£000
Growth
£000
Other
Variations
£000
2010/2011
Estimates
£000
Expenditure
Em
plo
yees
2,8
14
237
(326)
(20)
72,5
13
Pre
mises
40
00
00
138
178
Tra
nsp
ort
60
00
03
9
Supplie
s & S
erv
ices
1,4
60
00
(143)
0485
1,8
02
Third P
arty P
aym
ents
1,7
25
00
(10)
0(1
9)
1,6
96
Tra
nsfer Paym
ents
40
00
06
10
Support S
erv
ices
64
00
00
240
304
Capital Charg
es
00
00
00
0
Gross Expenditure
6,114
237
(479)
(20)
859
6,513
Service Level Agreement Recharges
00
00
00
0
Income
Inte
rnal Rech
arg
e Inco
me
00
00
00
0
Govern
ment Gra
nts
(435)
00
00
(559)
(994)
Reim
burs
em
ents
& C
ontrib
utions
(169)
00
00
(251)
(421)
Cust
om
er & C
lient Rece
ipts
(191)
00
00
171
(20)
Inte
rest
& O
ther
00
00
00
0
Use
of Balance
s & R
ese
rves
00
00
00
0
Gross Income
(796)
00
00
(639)
(1,434)
Net Expenditure/ (Income)
5,318
237
(479)
(20)
221
5,079
Explanation of major items above
£000
FTE
Tra
nsfer of Safe
guard
ing a
nd Q
ualit
y A
ssura
nce
to C
hild
ren's S
ocial Care
; Com
plain
ts a
nd A
llegations to
Sch
ool Im
pro
vem
ent & S
tandard
s (S
IS)
nil
(17)
MTFS E
fficiency
and G
rowth
Pro
posa
ls(4
99)
nil
Apportio
nm
ent of SLAs (7
30); P
ension g
rowth
(17), redirect
ion o
f gra
nt (1
02)
645
nil
Adju
stm
ent to
acc
ounting tre
atm
ent of Child
rens & A
dolsce
nt M
enta
l Health S
erv
ices Are
a B
ase
d G
rant
(752)
nil
Budgets
tra
nsferred for Fam
ily Info
rmation S
erv
ice w
ithin
2009/1
0(1
93)
(2)
Movem
ent of Youth
Com
missionin
g into
CPP (491)
491
12
Oth
er adju
stm
ents
& tra
nsfer of Exte
nded S
chools to C
hild
ren, Youth
& C
om
munities Divisio
n66
(4)
Total
(242)
(11)
This D
ivisio
n c
onta
ins th
e follo
win
g a
reas of act
ivity: Com
missionin
g, Gra
nts
, and L
oca
l Safe
guard
ing C
hild
ren's B
oard
. Serv
ices in
this d
ivisio
n to b
e tra
nsferred to O
verh
eads:
Info
rmation M
anagem
ent and P
erform
ance
Managem
ent.
CHILDREN'S SERVICES
COMMISSIONING, PERFORMANCE & PARTNERSHIP (CPP)
~ 2
3 ~

2009/2
010
2010/2
011
Full
Tim
e E
quivalents
47
35
Subjective Analysis of Estimates
2009/2010
Estimates
£000
Inflation
£000
Redirected
Resources
£000
Efficiencies
£000
Growth
£000
Other
Variations
£000
2010/2011
Estimates
£000
Expenditure
Em
plo
yees
2,5
23
0(1
18)
(60)
335
627
3,3
07
Pre
mises
1,8
43
00
(35)
(10)
224
2,0
23
Tra
nsp
ort
10
00
00
1
Supplie
s & S
erv
ices
4,5
19
0189
(4)
0(6
03)
4,1
02
Third P
arty P
aym
ents
30
00
00
(30)
0
Tra
nsfer Paym
ents
18
00
00
(18)
0
Support S
erv
ices
2,0
42
00
00
1,9
82
4,0
24
Capital Charg
es
3,1
83
00
00
(62)
3,1
21
Gross Expenditure
14,159
071
(98)
325
2,120
16,577
Service Level Agreement Recharges
(71)
00
00
(9,7
25)
(9,7
96)
Income
Inte
rnal Rech
arg
e Inco
me
00
00
00
0
Govern
ment Gra
nts
(36)
00
00
36
0
Reim
burs
em
ents
& C
ontrib
utions
(394)
00
00
(81)
(475)
Cust
om
er & C
lient Rece
ipts
(538)
00
00
121
(417)
Inte
rest
& O
ther
00
00
00
0
Use
of Balance
s & R
ese
rves
00
00
00
0
Gross Income
(968)
00
00
76
(892)
Net Expenditure/ (Income)
13,119
071
(98)
325
(7,528)
5,889
Explanation of major items above
£000
FTE
Reorg
anisation o
f Fin
ance
Divisio
n (M
TFS savin
g), rest
ruct
ure
of Fra
mework
i Team
&Tra
nsfer of Rece
ption &
Stu
dent Support
(159)
(11)
Fin
ance
post
to F
inance
& C
orp
ora
te S
erv
ices
nil
(1)
Apportio
nm
ent of Serv
ice L
evel Agre
em
ents
(SLAs)
(-9
,026); C
apital financing a
dju
stm
ent (-78)
(9,0
26)
nil
1,2
11
nil
SLA a
dju
stm
ent and b
udget re
covery
plan
430
nil
MTFS E
fficiency
and G
rowth
Pro
posa
ls227
nil
Capital adju
stm
ent (-78); P
ension g
rowth
(16); A
rea B
ase
d G
rant adju
stm
ent (5
)(5
7)
nil
Oth
er adju
stm
ents
144
nil
Total
(7,230)
(12)
This D
ivisio
n includes th
e d
epartm
enta
l co
sts of Acc
ounta
ncy
, Direct
or's Office a
nd F
ram
ework
i Support &
Develo
pm
ent. Also included a
re D
epartm
enta
l SLA's &
Capital Fin
ancing.
CHILDREN'S SERVICES
CHILDREN'S SERVICES OVERHEADS
Pensions adju
stm
ent, SLA a
dju
stm
ents
and redirect
ion o
f M
TFS E
fficiencies
~ 2
4 ~

2009/2
010
2010/2
011
Full
Tim
e E
quivalents
58
0
Subjective Analysis of Estimates
2009/2010
Estimates
£000
Inflation
£000
Redirected
Resources
£000
Efficiencies
£000
Growth
£000
Other
Variations
£000
2010/2011
Estimates
£000
Expenditure
Em
plo
yees
00
00
00
0
Pre
mises
00
00
00
0
Tra
nsp
ort
00
00
00
0
Supplie
s & S
erv
ices
00
00
00
0
Third P
arty P
aym
ents
00
00
00
0
Tra
nsfer Paym
ents
00
00
00
0
Support S
erv
ices
00
00
00
0
Capital Charg
es
00
00
00
0
Gross Expenditure
00
00
00
0
Service Level Agreement Recharges
00
00
00
0
Income
Inte
rnal Rech
arg
e Inco
me
00
00
00
0
Govern
ment Gra
nts
00
00
00
0
Reim
burs
em
ents
& C
ontrib
utions
00
00
00
0
Cust
om
er & C
lient Rece
ipts
00
00
00
0
Inte
rest
& O
ther
00
00
00
0
Use
of Balance
s & R
ese
rves
00
00
00
0
Gross Income
00
00
00
0
Net Expenditure/ (Income)
00
00
00
0
Explanation of major items above
£000
FTE
Facilit
ies Support
nil
(9)
Sch
ool M
anagem
ent Support
nil
(11)
Plannin
g a
nd D
evelo
pm
ent
nil
(2)
Relie
f Sch
ool Keeper
nil
(36)
Total
0(58)
This d
ivisio
n n
o longer exists
in 2
010/1
1. Serv
ices transferred to o
ther divisio
ns:
Facilit
ies, S
chool M
anagem
ent Support, Relie
f Sch
ool Keepers
, and P
lannin
g D
evelo
pm
ent
CHILDREN'S SERVICES
RESOURCES
~ 2
5 ~
2009/2
010
2010/2
011
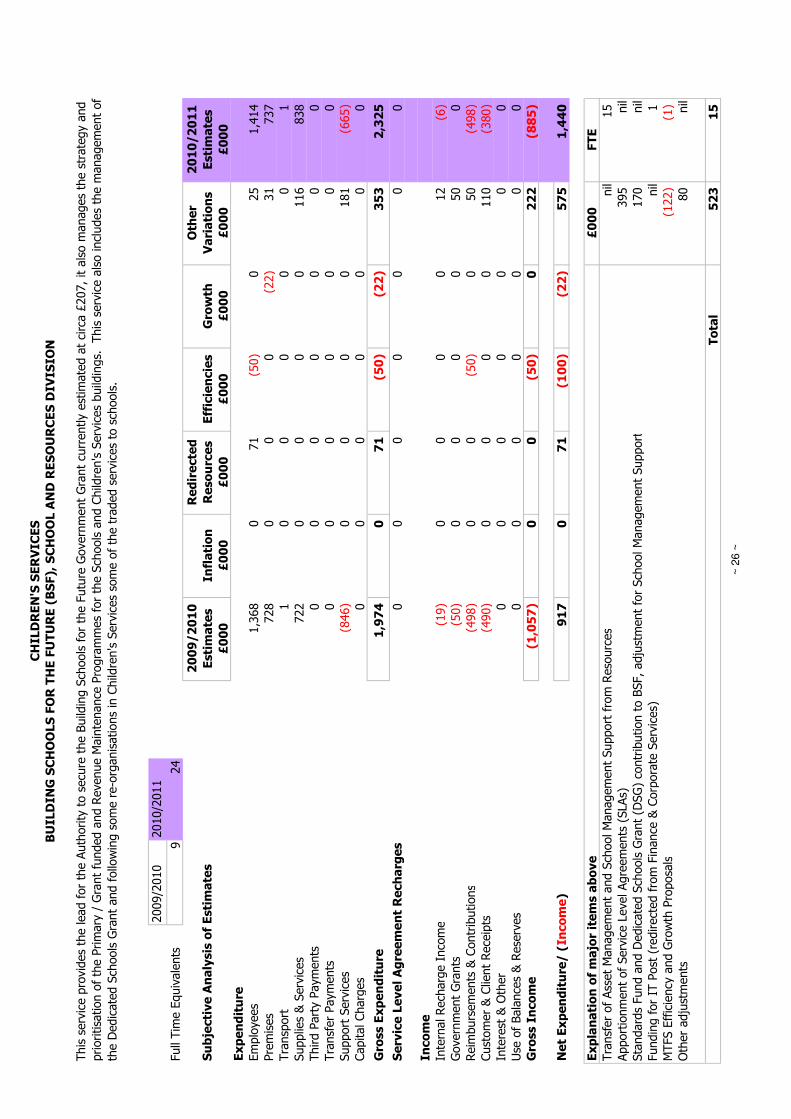
Full
Tim
e E
quivalents
924
Subjective Analysis of Estimates
2009/2010
Estimates
£000
Inflation
£000
Redirected
Resources
£000
Efficiencies
£000
Growth
£000
Other
Variations
£000
2010/2011
Estimates
£000
Expenditure
Em
plo
yees
1,3
68
071
(50)
025
1,4
14
Pre
mises
728
00
0(2
2)
31
737
Tra
nsp
ort
10
00
00
1
Supplie
s & S
erv
ices
722
00
00
116
838
Third P
arty P
aym
ents
00
00
00
0
Tra
nsfer Paym
ents
00
00
00
0
Support S
erv
ices
(846)
00
00
181
(665)
Capital Charg
es
00
00
00
0
Gross Expenditure
1,974
071
(50)
(22)
353
2,325
Service Level Agreement Recharges
00
00
00
0
Income
Inte
rnal Rech
arg
e Inco
me
(19)
00
00
12
(6)
Govern
ment Gra
nts
(50)
00
00
50
0
Reim
burs
em
ents
& C
ontrib
utions
(498)
00
(50)
050
(498)
Cust
om
er & C
lient Rece
ipts
(490)
00
00
110
(380)
Inte
rest
& O
ther
00
00
00
0
Use
of Balance
s & R
ese
rves
00
00
00
0
Gross Income
(1,057)
00
(50)
0222
(885)
Net Expenditure/ (Income)
917
071
(100)
(22)
575
1,440
Explanation of major items above
£000
FTE
Tra
nsfer of Ass
et M
anagem
ent and S
chool M
anagem
ent Support fro
m R
eso
urc
es
nil
15
Apportio
nm
ent of Serv
ice L
evel Agre
em
ents
(SLAs)
395
nil
Sta
ndard
s Fund a
nd D
edicate
d S
chools G
rant (D
SG) co
ntrib
ution to B
SF, adju
stm
ent fo
r Sch
ool M
anagem
ent Support
170
nil
Fundin
g for IT
Post
(re
direct
ed fro
m F
inance
& C
orp
ora
te S
erv
ices)
nil
1
MTFS E
fficiency
and G
rowth
Pro
posa
ls(1
22)
(1)
Oth
er adju
stm
ents
80
nil
Total
523
15
This serv
ice p
rovid
es th
e lead for th
e A
uth
ority
to secu
re the B
uild
ing S
chools for th
e F
utu
re G
overn
ment Gra
nt cu
rrently e
stim
ate
d a
t circ
a £
207, it a
lso m
anages th
e strate
gy a
nd
prioritisa
tion o
f th
e P
rim
ary
/ G
rant fu
nded a
nd R
evenue M
ain
tenance
Pro
gra
mm
es fo
r th
e S
chools a
nd C
hild
ren's S
erv
ices build
ings. This serv
ice a
lso includes th
e m
anagem
ent of
the D
edicate
d S
chools G
rant and follo
win
g som
e re-o
rganisations in
Child
ren's S
erv
ices so
me o
f th
e tra
ded serv
ices to
sch
ools.
CHILDREN'S SERVICES
BUILDING SCHOOLS FOR THE FUTURE (BSF), SCHOOL AND RESOURCES DIVISION
~ 2
6 ~
2009/2
010
2010/2
011
Full
Tim
e E
quivalents
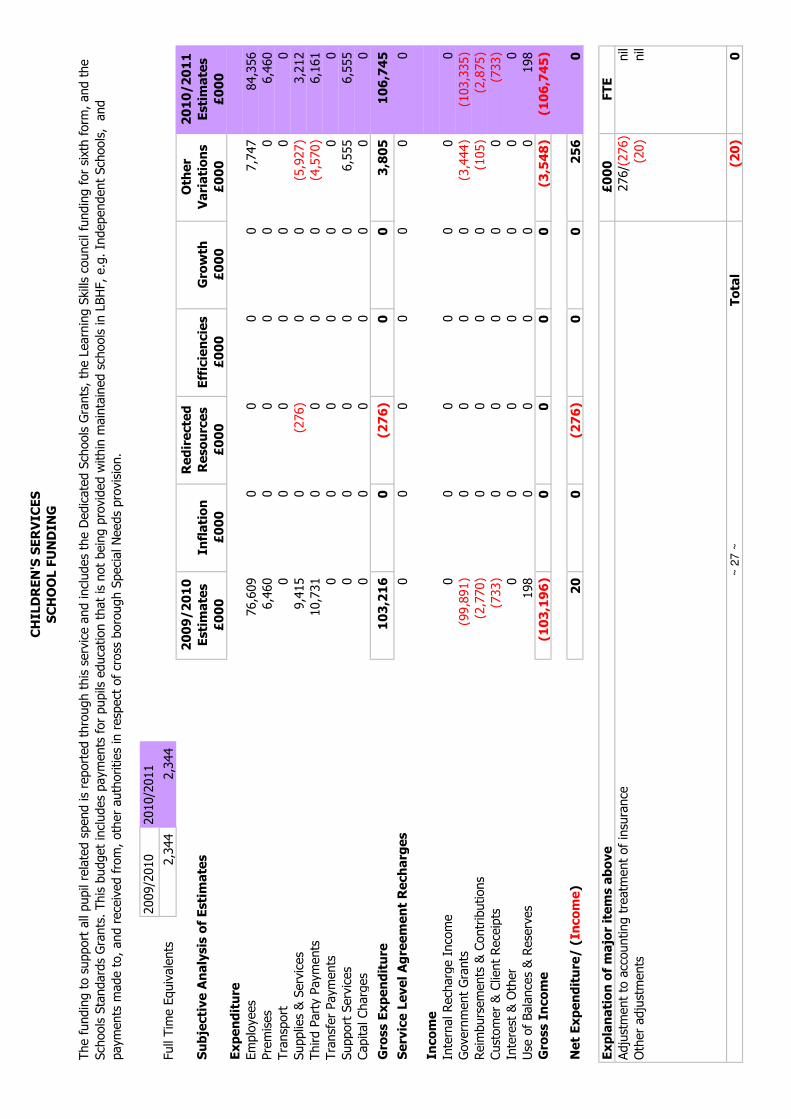
2,3
44
2,3
44
Subjective Analysis of Estimates
2009/2010
Estimates
£000
Inflation
£000
Redirected
Resources
£000
Efficiencies
£000
Growth
£000
Other
Variations
£000
2010/2011
Estimates
£000
Expenditure
Em
plo
yees
76,6
09
00
00
7,7
47
84,3
56
Pre
mises
6,4
60
00
00
06,4
60
Tra
nsp
ort
00
00
00
0
Supplie
s & S
erv
ices
9,4
15
0(2
76)
00
(5,9
27)
3,2
12
Third P
arty P
aym
ents
10,7
31
00
00
(4,5
70)
6,1
61
Tra
nsfer Paym
ents
00
00
00
0
Support S
erv
ices
00
00
06,5
55
6,5
55
Capital Charg
es
00
00
00
0
Gross Expenditure
103,216
0(276)
00
3,805
106,745
Service Level Agreement Recharges
00
00
00
0
Income
Inte
rnal Rech
arg
e Inco
me
00
00
00
0
Govern
ment Gra
nts
(99,8
91)
00
00
(3,4
44)
(103,3
35)
Reim
burs
em
ents
& C
ontrib
utions
(2,7
70)
00
00
(105)
(2,8
75)
Cust
om
er & C
lient Rece
ipts
(733)
00
00
0(7
33)
Inte
rest
& O
ther
00
00
00
0
Use
of Balance
s & R
ese
rves
198
00
00
0198
Gross Income
(103,196)
00
00
(3,548)
(106,745)
Net Expenditure/ (Income)
20
0(276)
00
256
0
Explanation of major items above
£000
FTE
Adju
stm
ent to
acc
ounting tre
atm
ent of in
sura
nce
276/(276)
nil
Oth
er adju
stm
ents
(20)
nil
Total
(20)
0
The fundin
g to support a
ll pupil
relate
d spend is re
ported thro
ugh this serv
ice a
nd includes th
e D
edicate
d S
chools G
rants
, th
e L
earn
ing S
kills co
uncil fu
ndin
g for sixth
form
, and the
Sch
ools S
tandard
s Gra
nts
. This b
udget in
cludes paym
ents
for pupils
educa
tion that is n
ot bein
g p
rovid
ed w
ithin
main
tain
ed sch
ools in L
BHF, e.g
. In
dependent Sch
ools, a
nd
paym
ents
made to, and rece
ived fro
m, oth
er auth
orities in
resp
ect
of cr
oss
boro
ugh S
pecial Needs pro
visio
n.
CHILDREN'S SERVICES
SCHOOL FUNDING
~ 2
7 ~

2009/2
010
2010/2
011
Full
Tim
e E
quivalents
277
287
Subjective Analysis of Estimates
2009/2010
Estimates
£000
Inflation
£000
Redirected
Resources
£000
Efficiencies
£000
Growth
£000
Other
Variations
£000
2010/2011
Estimates
£000
Expenditure
Em
plo
yees
17,9
68
74
0(2
90)
0(1
,175)
16,5
78
Pre
mises
118
00
07
281
407
Tra
nsp
ort
27
00
00
936
Supplie
s & S
erv
ices
1,4
42
00
(8)
01,1
99
2,6
33
Third P
arty P
aym
ents
90
00
0(8
) 1
Tra
nsfer Paym
ents
127
00
00
10
137
Support S
erv
ices
(2,2
57)
00
00
369
(1,8
88)
Capital Charg
es
00
00
00
0
Gross Expenditure
17,434
74
0(298)
7685
17,903
Service Level Agreement Recharges
00
00
00
0
Income
Inte
rnal Rech
arg
e Inco
me
(6)
00
00
(1)
(7)
Govern
ment Gra
nts
(12,1
17)
00
00
327
(11,7
91)
Reim
burs
em
ents
& C
ontrib
utions
(644)
00
00
247
(397)
Cust
om
er & C
lient Rece
ipts
(529)
00
00
102
(427)
Inte
rest
& O
ther
00
00
00
0
Use
of Balance
s & R
ese
rves
00
00
00
0
Gross Income
(13,296)
00
00
674
(12,621)
Net Expenditure/ (Income)
4,139
74
0(298)
71,360
5,282
Explanation of major items above
£000
FTE
MTFS E
ffficiency
and G
rowth
Pro
posa
ls(2
91)
(2)
Apportio
nm
ent of Serv
ice L
evel Agre
em
ents
(SLAs)
1,0
00
nil
Are
a B
ase
d G
rant adju
stm
ent (2
6); P
ension g
rowth
(35)
61
nil
Tra
nsfer of Virtu
al Sch
ool from
Child
ren's S
ocial Care
, Com
plain
ts a
nd A
llegations, V
uln
era
ble C
hild
ren (ABG), a
nd L
illa H
use
t Centre
315
12
Oth
er adju
stm
ents
(16)
nil
Total
1,069
10
This D
ivisio
n u
ndertakes th
e e
valu
ation a
nd inclusion to S
chools w
ithin
the C
hild
rens' S
erv
ice. T
his serv
ice a
rea a
lso includes oth
er gra
nts
and e
xte
rnal fu
ndin
g u
sed to support the
pro
visio
n o
f se
rvices to
Sch
ools a
nd the S
trate
gic M
anagem
ent of th
e d
epartm
ent. In
additio
n it in
cludes transp
ort a
nd m
usic
serv
ices to
sch
ools a
nd g
overn
ment fu
ndin
g for Sch
ool
Sta
ndard
s Funds and A
BG.
CHILDREN'S SERVICES
SCHOOL IMPROVEMENT & STANDARDS
~ 2
8 ~

2009/2
010
2010/2
011
Full
Tim
e E
quivalents
282
109
Subjective Analysis of Estimates
2009/2010
Estimates
£000
Inflation
£000
Redirected
Resources
£000
Efficiencies
£000
Growth
£000
Other
Variations
£000
2010/2011
Estimates
£000
Expenditure
Em
plo
yees
8,1
51
00
(273)
0(5
,462)
2,4
16
Pre
mises
215
00
00
111
326
Tra
nsp
ort
962
00
00
58
1,0
19
Supplie
s & S
erv
ices
2,3
13
0(7
7)
00
(1,5
86)
650
Third P
arty P
aym
ents
221
00
00
5,0
07
5,2
28
Tra
nsfer Paym
ents
40
00
0(4
) 0
Support S
erv
ices
(3,1
63)
00
00
3,1
86
23
Capital Charg
es
00
00
00
0
Gross Expenditure
8,704
0(77)
(273)
01,309
9,663
Service Level Agreement Recharges
(437)
00
00
(1,3
53)
(1,7
90)
Income
Inte
rnal Rech
arg
e Inco
me
(1,9
82)
00
00
1,5
01
(482)
Govern
ment Gra
nts
(50)
00
00
(50)
(100)
Reim
burs
em
ents
& C
ontrib
utions
(5,0
88)
0165
00
(2,1
11)
(7,0
35)
Cust
om
er & C
lient Rece
ipts
(438)
00
00
380
(58)
Inte
rest
& O
ther
00
00
00
0
Use
of Balance
s & R
ese
rves
00
00
00
0
Gross Income
(7,558)
0165
00
(281)
(7,675)
Net Expenditure/ (Income)
708
088
(273)
0(325)
198
Explanation of major items above
£000
FTE
Cleanin
g a
nd c
ate
ring c
ontract
s transfer to
exte
rnal pro
vid
er
nil
(209)
Tra
nsfer of Relie
f Site C
are
fro
m R
eso
urc
es
nil
36
MTFS subst
itution
(170)
nil
Apportio
nm
ent of Serv
ice L
evel Agre
em
ents
(SLAs)
236
nil
Change in a
ccounting tre
atm
ent fo
r new c
ate
ring a
nd c
leanin
g c
ontract
s (S
LA a
dju
stm
ents
)(4
04)
nil
MTFS E
ffficiency
and G
rowth
Pro
posa
ls(2
73)
nil
Oth
er adju
stm
ents
101
nil
Total
(510)
(173)
This a
rea includes Cate
ring C
ontract
Managem
ent, P
ass
enger Tra
nsp
ort w
hich includes th
e p
rovisio
n o
f transp
ort serv
ices fo
r Day C
entres, S
EN, and site c
are
support.
CHILDREN'S SERVICES
TRADED SERVICES SUMMARY
~ 2
9 ~

2009/2
010
2010/2
011
Full
Tim
e E
quivalents
174
163
Subjective Analysis of Estimates
2009/2010
Estimates
£000
Inflation
£000
Redirected
Resources
£000
Efficiencies
£000
Growth
£000
Other
Variations
£000
2010/2011
Estimates
£000
Expenditure
Em
plo
yees
8,0
22
00
(500)
0(1
58)
7,3
64
Pre
mises
379
00
013
14
406
Tra
nsp
ort
581
00
00
622
1,2
03
Supplie
s & S
erv
ices
3,8
82
0(2
) 0
0(1
,139)
2,7
41
Third P
arty P
aym
ents
2,6
20
30
00
4,3
37
6,9
60
Tra
nsfer Paym
ents
199
00
00
10
209
Support S
erv
ices
124
00
00
(1,8
33)
(1,7
09)
Capital Charg
es
16
00
00
(16)
0
Gross Expenditure
15,823
3(2)
(500)
13
1,837
17,174
Service Level Agreement Recharges
00
00
0(1
07)
(107)
Income
Inte
rnal Rech
arg
e Inco
me
(540)
00
00
(870)
(1,4
10)
Govern
ment Gra
nts
(10,1
95)
00
00
(89)
(10,2
84)
Reim
burs
em
ents
& C
ontrib
utions
(547)
00
00
228
(318)
Cust
om
er & C
lient Rece
ipts
(579)
00
00
547
(32)
Inte
rest
& O
ther
00
00
00
0
Use
of Balance
s & R
ese
rves
(126)
00
00
126
0
Gross Income
(11,986)
00
00
(58)
(12,044)
Net Expenditure/ (Income)
3,837
3(2)
(500)
13
1,673
5,024
Explanation of major items above
£000
FTE
Are
a B
ase
d G
rant acc
ounting tre
atm
ent adju
stm
ent
420
nil
Apportio
nm
ent of Serv
ice L
evel Agre
em
ents
(SLAs)
1,3
42
nil
MTFS E
ffficiency
and G
rowth
Pro
posa
ls(4
87)
nil
Pension g
rowth
43
nil
Tra
nsfer of Youth
Com
missionin
g to C
om
missionin
g, Perform
ance
& P
artners
hip
(CPP)
(492)
(12)
Tra
nsfer of Fam
ily Info
rmation S
erv
ice b
udget from
CPP, Facilit
ies su
pport &
Rece
ption S
erv
ice fro
m R
eso
urc
es
193
10
In-y
ear Allo
cation o
f Are
a B
ase
d G
rant from
Overh
eads (P
ositive A
ctivities fo
r Young P
eople - P
AYP)
180
nil
MTFS sta
ff reduct
ions and o
ther adju
stm
ents
(15)
(9)
Total
1,184
(11)
This serv
ice a
rea c
overs
child
care
, Child
ren's C
entres, Inte
gra
ted Y
outh
Serv
ices (includin
g Y
outh
Offendin
g), a
nd serv
ices to
sch
ools. Also included a
re the E
arly Y
ears
paym
ents
for 3 a
nd 4
year old
s in
private
, in
dependent, a
nd v
olu
nta
ry sect
or pro
visio
n.
CHILDREN'S SERVICES
CHILDREN, YOUTH AND COMMUNITIES
~ 3
0 ~


~ 31 ~
Description of service
The purpose of the Community Services Department is to deliver high quality assessment, care co-ordination, social work and specialist community services to disabled and older adults and their carers. This includes a strong focus on the need to ensure the safety of vulnerable adults living within the borough and using services.
The Department commissions and procures a range of housing management, support and social care services within a robust strategic and performance management framework; and ensures that services that are commissioned meet the needs of service users and is of the highest possible quality whilst representing value for money. The department leads on all third sector funding and developments. Statement of Core Business
The core business of the Adult Social Care Division of Community Services is to ensure that the council fulfils its statutory duties in respect of vulnerable adults under the National Assistance Act 1948 and subsequent related legislation. This act requires the council to act as a last resort for people in need. The division fulfils this duty in a manner which is consistent with the priorities of the council. In particular, the division plays a key role in working to make this a borough of opportunity for residents who need our assistance.
The purpose of the Resources Division is firstly to provide effective, high quality, and professional support and advice to the Community Services Department and its internal and external partners, and maximise the value for money delivered from the Department’s financial, human resources, IT, project management, and property resources. Secondly, the Resources Division provides learning and development (training) for the whole Community Services Department, plus Meals on Wheels, Clinical Waste and Removals services in accordance with the priorities of the council.
The purpose of the Quality, Commissioning and Procurement division is to build the department’s ability to understand and respond to the aspirations of local residents by analysing information and using evidence to design services, implement changes and evaluate their effectiveness, and to monitor the performance of the Department. Prime objectives of the department
• Continue the improvements made in relation to the Safeguarding of Vulnerable Adults. • Roll-out the quality assurance framework to cover all services and ensure consistency of
practise, and continue to commission services of the highest possible quality and value for money
• Widen the implementation of “Supporting Your Choice” and personalised budgets following the pilot of the “100 Club”.
• Widen the scope of re-ablement services from a hospital discharge service to one that covers all assessments for care in the home.
• Develop a preventative services strategy with colleagues in the Primary Care Trust, and continue with the implementation of the Third Sector review.
• Maximise the benefits in terms of service delivery and re-design in light of integration with the Primary Care Trust – including the development of Poly-Systems to ensure the most effective and targeted interventions for vulnerable people in the borough.
• Continue to meet and identify efficiency savings in light of the Medium Term Financial Strategy and a reducing financial settlement from Central Government.
• To improve the support provided by our internal services such as HR, IT, finance, programme management, learning and development, performance and information.
COMMUNITY SERVICES

~ 32 ~

2010/2011 ESTIMATES
COMMUNITY SERVICES
DEPARTMENT
~ 33 ~

18 19 20
Service Area Analysis
2009/2010
Estimates
£000
Inflation
£000
Redirected
Resources
£000
Efficiencies
£000
Growth
£000
Other
Adjustments
£000
2010/2011
Estimates
£000
Head of Directorate 243 0 53 0 0 (68) 229
Resources 11,435 3 (177) (323) 20 (9,180) 1,777
Quality, Commissioning &
Procurement9,865 210 (120) (247) 1 10,232 19,941
Adult Social Care 48,842 787 (303) (2,210) 839 6,609 54,563
Housing Options 4,525 166 (2) (775) 0 1,734 5,648
Regeneration and
Housing Strategy453 1 283 (50) 54 846 1,584
New Deal for
Communities477 0 0 0 0 1,396 1,874
TOTAL 75,840 1,167 (266) (3,605) 914 11,569 85,616
COMMUNITY SERVICES DEPARTMENT
CHANGE BETWEEN YEARS
~ 34 ~

2009/2010
2010/2011
Number of Full Time Equivalent staff
673
636
SUBJECTIVE ANALYSIS OF ESTIM
ATES
2009/2010
Estimates
£000
Inflation
£000
Redirected
Resources
£000
Efficiencies
£000
Growth
£000
Other
Variations
£000
2010/2011
Estimates
£000
Expenditure
Employee Expenses
31,852
0255
(1,719)
0(841)
29,543
Premises Related Expenditure
10,374
135
(28)
(137)
74
(1,661)
8,757
Transport Related Expenditure
923
0(66)
00
(3)
855
Supplies and Services
27,221
205
(219)
(281)
01,339
28,268
Third Party Payments
49,757
691
(200)
(1,348)
650
356
49,906
Transfer Payments
6,876
140
00
190
320
7,524
Support Services
5,916
00
00
8,184
14,100
Capital Charges
998
00
00
1,422
2,419
GROSS EXPENDITURE
133,917
1,171
(258)
(3,485)
914
9,116
141,372
Service Level Agreement Recharges
(118)
00
00
(11,860)
(11,978)
Income
L_01Internal Recharge Income
(502)
00
00
(43)
(545)
L_02Government Grants
(18,004)
00
40
09,023
(8,942)
L_03Other Reimbursements & Contributions
(25,342)
0(8)
(10)
02,401
(22,960)
L_04Customer & Client Receipts
(14,111)
(4)
0(150)
02,799
(11,464)
OInterest & Other
00
00
00
0
PUse of Balances & Reserves
00
00
0133
133
GROSS INCOME
(57,959)
(4)
(8)
(120)
014,313
(43,778)
NET EXPENDITURE
75,840
1,167
(266)
(3,605)
914
11,569
85,616
CO
MM
UN
IT
Y S
ER
VIC
ES
DE
PA
RT
ME
NT
SU
MM
AR
Y
~ 3
5 ~

2009/2010
2010/2011
Full Time Equivalents
11
Subjective Analysis of Estimates
2009/2010
Estimates
£000
Inflation
£000
Redirected
Resources
£000
Efficiencies
£000
Growth
£000
Other
Variations
£000
2010/2011
Estimates
£000
Expenditure
Employees
222
053
00
(67)
208
Premises
10
00
01
2
Transport
10
00
00
1
Supplies & Services
50
00
00
(15)
36
Third Party Payments
00
00
00
0
Transfer Payments
00
00
00
0
Support Services
(31)
00
00
13
(18)
Capital Charges
00
00
00
0
Gross Expenditure
243
053
00
(68)
229
Service Level Agreement Recharges
00
00
00
0
Income
Internal Recharge Income
00
00
00
0
Government Grants
00
00
00
0
Reimbursements & Contributions
00
00
00
0
Customer & Client Receipts
00
00
00
0
Interest & Other
00
00
00
0
Use of Balances & Reserves
00
00
00
0
Gross Income
00
00
00
0
Net Expenditure/ (Income)
243
053
00
(68)
229
Explanation of major items above
£000
FTE
Contingency allocation for costs previously charged to Housing Revenue Account
53
nil
Transfer of Customer Care and Complaints budget to Regeneration and Resources
(68)
nil
Total
(15)
0
The division contains the following area of activity - Director's Office.
COMMUNITY SERVICES DEPARTMENT
HEAD OF DIRECTORATE & SUPPORT SERVICES
~ 3
6 ~

2009/2010
2010/2011
Full Time Equivalents
88
82
Subjective Analysis of Estimates
2009/2010
Estimates
£000
Inflation
£000
Redirected
Resources
£000
Efficiencies
£000
Growth
£000
Other
Variations
£000
2010/2011
Estimates
£000
Expenditure
Employees
4,532
0(82)
(273)
0(458)
3,718
Premises
2,353
1(28)
020
(1,811)
535
Transport
165
0(1)
00
(5)
159
Supplies & Services
4,174
2(58)
(50)
0(3,183)
885
Third Party Payments
00
00
040
40
Transfer Payments
50
00
00
5
Support Services
3,643
00
00
2,755
6,398
Capital Charges
70
00
056
63
Gross Expenditure
14,879
3(169)
(323)
20
(2,606)
11,803
Service Level Agreement Recharges
(118)
00
00
(8,912)
(9,030)
Income
Internal Recharge Income
00
00
00
0
Government Grants
(250)
00
00
181
(69)
Reimbursements & Contributions
(519)
0(8)
00
502
(25)
Customer & Client Receipts
(2,557)
00
00
1,655
(902)
Interest & Other
00
00
00
0
Use of Balances & Reserves
00
00
00
0
Gross Income
(3,326)
0(8)
00
2,338
(996)
Net Expenditure/ (Income)
11,435
3(177)
(323)
20
(9,180)
1,777
Explanation of major items above
£000
FTE
Transfer of budgets to Environment Services for Facilities Management
(130)
nil
MTFS efficiencies in staffing
(273)
(6)
MTFS efficiencies from change to mail deliveries and contribution towards cross cutting supplies and services efficiencies
(50)
nil
Re-allocation of internal and external support costs to services (previously held in the Resources Division and now held in Service Divisions)
(9,207)
nil
Total
(9,660)
(6)
The division contains the following areas of activity: Finance, Programme Management, Executive Office, Training Administration, Meals Service, Removals and Building costs.
Corporate Support & Information Technology (SLA's) and other centralised budgets which are fully apportioned to front line services are also reflected in this division.
COMMUNITY SERVICES DEPARTMENT
RESOURCES
~ 3
7 ~

2009/2010
2010/2011
Full Time Equivalents
62
58
Subjective Analysis of Estimates
2009/2010
Estimates
£000
Inflation
£000
Redirected
Resources
£000
Efficiencies
£000
Growth
£000
Other
Variations
£000
2010/2011
Estimates
£000
Expenditure
Employees
3,059
00
(157)
0329
3,231
Premises
310
00
01
242
554
Transport
80
00
00
8
Supplies & Services
20,027
201
(120)
(50)
01,350
21,408
Third Party Payments
1,531
80
(40)
054
1,553
Transfer Payments
37
10
00
40
77
Support Services
1,006
00
00
344
1,350
Capital Charges
102
00
00
(74)
28
Gross Expenditure
26,080
210
(120)
(247)
12,285
28,209
Service Level Agreement Recharges
00
00
0(2,948)
(2,948)
Income
Internal Recharge Income
00
00
00
0
Government Grants
(14,261)
00
00
11,744
(2,517)
Reimbursements & Contributions
(1,931)
00
00
(818)
(2,749)
Customer & Client Receipts
(23)
00
00
(31)
(54)
Interest & Other
00
00
00
0
Use of Balances & Reserves
00
00
00
0
Gross Income
(16,215)
00
00
10,895
(5,320)
Net Expenditure/ (Income)
9,865
210
(120)
(247)
110,232
19,941
Explanation of major items above
£000
FTE
Staffing efficiencies in procurement and commissioning
(157)
(4)
MTFS savings through new contract arrangements
(90)
nil
Health Gain expenditure for Mental Health and Carers Services.
818
nil
Accounting adjustment to transfer the Supporting People Main Programme grant into the Area Based Grant.
11,465
nil
Health Gain funding for Mental Health and Carers Services
(818)
nil
Transfer of Transport budget to Children's Services
(100)
nil
(1,252)
nil
Total
9,866
(4)
The division contains the following areas of activity: Q,C&P Headquarters, Commissioning, Procurement & Contracts, Community Liaison, Information & Performance and Self
Directed Support (SDS).
COMMUNITY SERVICES DEPARTMENT
QUALITY, COMISSIONING & PROCUREMENT (Q,C&P)
Re-allocation of internal and external support costs to services (previously held in the Resources Division) and transfer of 3rd sector budgets to
service departments
~ 3
8 ~

2009/2010
2010/2011
Full Time Equivalents
317
296
Subjective Analysis of Estimates
2009/2010
Estimates
£000
Inflation
£000
Redirected
Resources
£000
Efficiencies
£000
Growth
£000
Other
Variations
£000
2010/2011
Estimates
£000
Expenditure
Employees
15,021
00
(940)
0(942)
13,137
Premises
435
60
0(1)
691
1,131
Transport
723
0(65)
00
3661
Supplies & Services
819
1(38)
(62)
01,685
2,405
Third Party Payments
46,760
658
(200)
(1,198)
650
169
46,839
Transfer Payments
6,071
126
00
190
437
6,824
Support Services
408
00
00
3,910
4,318
Capital Charges
309
00
00
24
333
Gross Expenditure
70,546
791
(303)
(2,200)
839
5,977
75,648
Service Level Agreement Recharges
00
00
00
0
Income
Internal Recharge Income
(502)
00
00
(43)
(545)
Government Grants
(1,310)
00
00
202
(1,108)
Reimbursements & Contributions
(18,612)
00
(10)
0293
(18,330)
Customer & Client Receipts
(1,280)
(4)
00
047
(1,235)
Interest & Other
00
00
00
0
Use of Balances & Reserves
00
00
0133
133
Gross Income
(21,704)
(4)
0(10)
0632
(21,085)
Net Expenditure/ (Income)
48,842
787
(303)
(2,210)
839
6,609
54,563
Explanation of major items above
£000
FTE
Net MTFS Management and Staffing efficiencies and creation of Hospital at Home Service
(940)
(21)
MTFS savings through re-ablement and management of provider market.
(1,198)
nil
MTFS growth for placements, packages and direct payments
840
nil
Transfer of Transport Budget to Children's Services
(65)
nil
Transfer of Mental Health budget to Corporate Finance
(200)
nil
Re-allocation of internal and external support costs to services (previously held in the Resources Division)
6,498
nil
Total
4,935
(21)
The division contains the following areas of activity: ASC Headquarters, Review & Quality Assurance, Community Assessment & Social Care Services, Hospital Assessment &
Disability Services, Learning Disability Services and Mental Health Services.
COMMUNITY SERVICES DEPARTMENT
ADULT SOCIAL CARE (ASC)
~ 3
9 ~

2009/2010
2010/2011
Full Time Equivalents
117
109
Subjective Analysis of Estimates
2009/2010
Estimates
£000
Inflation
£000
Redirected
Resources
£000
Efficiencies
£000
Growth
£000
Other
Variations
£000
2010/2011
Estimates
£000
Expenditure
Employees
4,776
00
(299)
0262
4,739
Premises
6,847
128
0(137)
0(764)
6,074
Transport
21
00
00
021
Supplies & Services
541
0(2)
(119)
0675
1,096
Third Party Payments
1,392
25
0(110)
063
1,371
Transfer Payments
640
13
00
0(49)
603
Support Services
438
00
00
759
1,197
Capital Charges
38
00
00
30
68
Gross Expenditure
14,693
166
(2)
(665)
0976
15,169
Service Level Agreement Recharges
00
00
00
0
Income
Internal Recharge Income
00
00
00
0
Government Grants
(441)
00
40
0(659)
(1,061)
Reimbursements & Contributions
(796)
00
00
352
(444)
Customer & Client Receipts
(8,931)
00
(150)
01,065
(8,016)
Interest & Other
00
00
00
0
Use of Balances & Reserves
00
00
00
0
Gross Income
(10,168)
00
(110)
0758
(9,521)
Net Expenditure/ (Income)
4,525
166
(2)
(775)
01,734
5,648
Explanation of major items above
£000
FTE
MTFS efficiencies in Temporary Accommodation (relating to procurement, void reduction, staffing, management and repairs)
(404)
(5)
MTFS efficiencies from review of Homebuy and Housing Support Services
(150)
(3)
Increased capital contributions towards the costs of the Occupational Therapy service
(100)
nil
MTFS efficiencies resulting from a newly procured contract relating to joint equipment provision
(50)
nil
Other efficiencies
(71)
nil
Reallocation of internal and central overheads formerly held in CSD Resources Division
1,732
nil
Total
957
(8)
This division covers three Housing service areas - Housing Options Central (which includes divisional management, the enhanced housing options project, the adaptations &
occupational therapy team, and the H&F Advice Centre), Accommodation Services (m
ade up of temporary accommodation, housing support, and rehousing) Assessment &
Advice (including the homebuy service, the PATHS team and various other homeless projects)
COMMUNITY SERVICES DEPARTMENT
HOUSING OPTIONS
~ 4
0 ~

2009/2010
2010/2011
Full Time Equivalents
88
90
Subjective Analysis of Estimates
2009/2010
Estimates
£000
Inflation
£000
Redirected
Resources
£000
Efficiencies
£000
Growth
£000
Other
Variations
£000
2010/2011
Estimates
£000
Expenditure
Employees
3,701
0284
(50)
0376
4,311
Premises
368
00
054
13
434
Transport
40
00
00
4
Supplies & Services
743
1(1)
00
1,074
1,817
Third Party Payments
74
00
00
30
103
Transfer Payments
40
00
00
(40)
0
Support Services
452
00
00
403
855
Capital Charges
65
00
00
(10)
54
Gross Expenditure
5,447
1283
(50)
54
1,846
7,578
Service Level Agreement Recharges
00
00
00
0
Income
Internal Recharge Income
00
00
00
0
Government Grants
(148)
00
00
(3,177)
(3,325)
Reimbursements & Contributions
(3,484)
00
00
2,072
(1,412)
Customer & Client Receipts
(1,362)
00
00
105
(1,257)
Interest & Other
00
00
00
0
Use of Balances & Reserves
00
00
00
0
Gross Income
(4,994)
00
00
(1,000)
(5,994)
Net Expenditure/ (Income)
453
1283
(50)
54
846
1,584
Explanation of major items above
£000
FTE
MTFS net savings derived from restructuring the Economic Regeneration function
(50)
(10)
Recruitment of Staff and Apprentices as part of the W
ork Matters Programme
244/(244)
12
Reallocation of corporate and departmental overheads formerly held in CSD Resources Division
846
nil
Corporate allocation to fund NNDR payable on Council properties
54
nil
Total
1,133
2
The Regeneration division provides physical, social and economic initiatives with its partners across W
est London to promote business growth, increase job creation and
employment, attract inward investment and improve skill levels. This work is supported by bidding for external regeneration funds for Hammersmith & Fulham.
COMMUNITY SERVICES DEPARTMENT
REGENERATION & HOUSING STRATEGY
Funding for Strategic Regeneration from corporate savings made by utilising capital receipts related to the Decent Neighbourhoods Programme
in the corporate debt reduction programme
283
nil
~ 4
1 ~

2009/2010
2010/2011
Full Time Equivalents
00
Subjective Analysis of Estimates
2009/2010
Estimates
£000
Inflation
£000
Redirected
Resources
£000
Efficiencies
£000
Growth
£000
Other
Variations
£000
2010/2011
Estimates
£000
Expenditure
Employees
541
00
00
(341)
199
Premises
60
00
00
(33)
27
Transport
10
00
0(1)
1
Supplies & Services
867
00
00
(247)
621
Third Party Payments
00
00
00
0
Transfer Payments
83
00
00
(68)
15
Support Services
00
00
00
0
Capital Charges
477
00
00
1,396
1,873
Gross Expenditure
2,029
00
00
706
2,736
Service Level Agreement Recharges
00
00
00
0
Income
Internal Recharge Income
00
00
00
0
Government Grants
(1,594)
00
00
732
(862)
Reimbursements & Contributions
00
00
00
0
Customer & Client Receipts
42
00
00
(42)
0
Interest & Other
00
00
00
0
Use of Balances & Reserves
00
00
00
0
Gross Income
(1,552)
00
00
690
(862)
Net Expenditure/ (Income)
477
00
00
1,396
1,874
Explanation of major items above
£000
FTE
1,396
nil
Total
1,396
0
The Council acts as the accountable body in working with the North Fulham New Deal for Communities (NDC). This is a Government funded programme which focuses on
generating beneficial economic, health, and environmental outcomes for local residents. The current programme is set to continue until 2011.
COMMUNITY SERVICES DEPARTMENT
NEW DEAL FOR COMMUNIITES
Increase in deferred charges which relates to capital schemes within the NDC programme where expenditure is planned on non-Council
property. This is a notional charge and there is no overall cost to the Council. The Council is the accountable body for the NDC and the poss
employed are external to the Council's establishment.
~ 4
2 ~

~ 43 ~
Description of service The Environment Services Department delivers a wide range of technical, regulatory and enforcement services, including some of the ‘universal’ services used by everyone who lives, works in or visits the borough. Recognising the importance of delivering these services effectively, courteously and with understanding of our customers’ needs, we aim to continually improve standards, and help shape residents’ perceptions of living and working in the borough. The department works collaboratively with others and uses existing expertise to develop new solutions to some of the most pressing environmental issues and to link into local, national and international agendas to help effect positive change. This has involved specific work relating to reducing the impact of Council operations on carbon dioxide emissions. A climate change project management board has been established. Statement of Core Business The department will play a core role in delivering more efficient use of council property assets, particularly office accommodation. We lead on the centralisation of improved facilities management services, the accommodation programme and will provide a key input to the smart working programme for which the director is the corporate sponsor. The department will continue to seek more efficient service delivery options and will continue to drive down costs. The department will further develop performance management and expansion of its use of staff performance incentives to raise productivity levels and reduce net costs. Most of our services have already obtained ISO 9001:2000 Quality Accreditation. The Department is IiP accredited, has Chartermark status for all Parking services and NICIEC and CORGI registration within Building Technical Services. Prime objectives of the department The following objectives help us to achieve our over-riding purpose:
• Planning and transport to support regeneration and decent neighbourhoods • MTFS efficiency savings • Market testing • Optimising capital assets • Providing council buildings used by the public with step free access and wheelchair
accessible toilets
ENVIRONMENT SERVICES

~ 44 ~

2010/11 ESTIMATES
ENVIRONMENT SERVICES
DEPARTMENT
~ 45 ~

18 19 20
Service Area Analysis
2009/2010
Estimates
£000
Inflation
£000
Redirected
Resources
£000
Efficiencies
£000
Growth
£000
Other
Adjustments
£000
2010/2011
Estimates
£000
Highways & Engineering
Services9,897 258 (497) (385) 0 (891) 8,382
Parking (14,384) 28 (176) (195) 17 303 (14,408)
Planning 2,753 (2) (6) (61) 200 1,106 3,991
Public Protection & Safety 5,870 (8) (5) (140) 0 (1,316) 4,400
Building & Property
Management(405) 87 95 (2,421) 19 766 (1,857)
Resources 153 0 (3) (314) 1 83 (81)
TOTAL 3,884 363 (592) (3,516) 237 51 427
ENVIRONMENT SERVICES DEPARTMENT
CHANGE BETWEEN YEARS
~ 46 ~

2009/2010
2010/2011
Number of Full Time Equivalent staff
536
519
SUBJECTIVE ANALYSIS OF ESTIM
ATES
2009/2010
Estimates
£000
Inflation
£000
Redirected
Resources
£000
Efficiencies
£000
Growth
£000
Other
Variations
£000
2010/2011
Estimates
£000
Expenditure
Employee Expenses
25,336
073
(487)
0(893)
24,031
Premises Related Expenditure
10,849
300
0(1,289)
37
(791)
9,106
Transport Related Expenditure
580
0(3)
00
(31)
547
Supplies and Services
10,596
4(662)
(41)
0(941)
8,957
Third Party Payments
7,974
106
0(130)
0(919)
7,031
Transfer Payments
10
00
00
1
Support Services
4,425
00
00
1,720
6,146
Capital Charges
7,573
00
00
(840)
6,733
GROSS EXPENDITURE
67,334
410
(592)
(1,947)
37
(2,695)
62,552
Service Level Agreement Recharges
(7,016)
00
00
(7,800)
(14,817)
Income
L_01Internal Recharge Income
(20,185)
00
(75)
09,030
(11,230)
L_02Government Grants
(276)
00
0200
36
(40)
L_03Other Reimbursements & Contributions
(1,597)
00
00
(58)
(1,656)
L_04Customer & Client Receipts
(34,366)
(47)
0(1,494)
01,522
(34,388)
OInterest & Other
(10)
00
00
16
6
PUse of Balances & Reserves
00
00
00
0
GROSS INCOME
(56,434)
(47)
0(1,569)
200
10,546
(47,308)
NET EXPENDITURE
3,884
363
(592)
(3,516)
237
51
427
EN
VIR
ON
ME
NT
SE
RV
IC
ES
DE
PA
RT
ME
NT
SU
MM
AR
Y
~ 4
7 ~

2009/2010
2010/2011
Full Time Equivalents
105
102
Subjective Analysis of Estimates
2009/2010
Estimates
£000
Inflation
£000
Redirected
Resources
£000
Efficiencies
£000
Growth
£000
Other
Variations
£000
2010/2011
Estimates
£000
Expenditure
Employees
4,726
00
00
(67)
4,660
Premises
923
171
00
0(59)
1,036
Transport
155
00
00
2157
Supplies & Services
1,969
4(497)
00
(81)
1,395
Third Party Payments
5,129
90
0(135)
0(1,287)
3,797
Transfer Payments
00
00
00
0
Support Services
761
00
00
270
1,031
Capital Charges
3,946
00
00
(1,124)
2,823
Gross Expenditure
17,609
265
(497)
(135)
0(2,346)
14,899
Service Level Agreement Recharges
00
00
00
0
Income
Internal Recharge Income
(3,203)
00
00
113
(3,090)
Government Grants
(36)
00
00
36
0
Reimbursements & Contributions
(1,176)
00
00
(58)
(1,235)
Customer & Client Receipts
(3,297)
(7)
0(250)
01,364
(2,192)
Interest & Other
00
00
00
0
Use of Balances & Reserves
00
00
00
0
Gross Income
(7,712)
(7)
0(250)
01,455
(6,517)
Net Expenditure/ (Income)
9,897
258
(497)
(385)
0(891)
8,382
Explanation of major items above
£000
FTE
MTFS Efficiencies
(385)
(3)
Supplies & services - clawback of insurance budgets for incorporation within the Service Level Agreement model
(491)
nil
Capital Charges reduction
(1,124)
nil
Highways Maintenance (Transfer Payment) accounting adjustment
(1,310)
nil
Highways Maintenance (Customer & Client Receipts) accounting adjustment
1,310
nil
Other adjustments
227
nil
Total
(1,773)
(3)
The Council is the statutory highway and traffic authority for all 212 kilometres of public roads within the borough except for those roads that are part of the Transport for
London road network (A4, A40 & A3220). Highways and Engineering is the executive arm
of the Council in respect of procuring and m
anaging the Council's highways and
traffic powers, duties and responsibilities. It also provides transport and parking policy advice and is responsible for the civil engineering service to the Council.
ENVIRONMENT SERVICES DEPARTMENT
HIGHWAYS & ENGINEERING SERVICES
~ 4
8 ~

2009/2010
2010/2011
Full Time Equivalents
146
143
Subjective Analysis of Estimates
2009/2010
Estimates
£000
Inflation
£000
Redirected
Resources
£000
Efficiencies
£000
Growth
£000
Other
Variations
£000
2010/2011
Estimates
£000
Expenditure
Employees
5,022
0(97)
00
52
4,977
Premises
994
12
00
17
(112)
911
Transport
212
00
00
(5)
207
Supplies & Services
1,910
0(79)
00
(16)
1,814
Third Party Payments
1,541
16
05
020
1,582
Transfer Payments
00
00
00
0
Support Services
1,109
00
00
324
1,433
Capital Charges
332
00
00
68
400
Gross Expenditure
11,120
28
(176)
517
331
11,324
Service Level Agreement Recharges
00
00
00
0
Income
Internal Recharge Income
00
00
00
0
Government Grants
00
00
00
0
Reimbursements & Contributions
00
00
00
0
Customer & Client Receipts
(25,504)
00
(200)
0(44)
(25,748)
Interest & Other
00
00
016
16
Use of Balances & Reserves
00
00
00
0
Gross Income
(25,504)
00
(200)
0(28)
(25,732)
Net Expenditure/ (Income)
(14,384)
28
(176)
(195)
17
303
(14,408)
Explanation of major items above
£000
FTE
MTFS Efficiencies
(195)
nil
Transfer of Parking Perm
it Admin staff to Finance & Corporate Services
(176)
(3)
Growth in NNDR
17
nil
Other Adjustments
303
nil
Total
(51)
(3)
The Parking Service Budget covers the activities of the Borough W
ide Parking Area under the Road Traffic Act 1991 and the London Local Authority Acts, together with the
enforecement of controlled Parking Zones and the W
hite City and W
orm
wood Scrubs Off Street Car Parks. Other functions include direct responsibility for the Parking
Attendant Service, enforecement of parking restrictions, bus lanes and m
oving traffic contraventions, collection of monies from pay and display m
achines and the approval
and implementation of parking bay suspensions.
ENVIRONMENT SERVICES DEPARTMENT
PARKING
~ 4
9 ~

2009/2010
2010/2011
Full Time Equivalents
56
55
Subjective Analysis of Estimates
2009/2010
Estimates
£000
Inflation
£000
Redirected
Resources
£000
Efficiencies
£000
Growth
£000
Other
Variations
£000
2010/2011
Estimates
£000
Expenditure
Employees
2,792
00
(50)
021
2,762
Premises
164
00
00
1165
Transport
60
00
00
7
Supplies & Services
547
0(6)
(11)
0(35)
496
Third Party Payments
00
00
00
0
Transfer Payments
00
00
00
0
Support Services
562
00
00
58
620
Capital Charges
46
00
00
1,063
1,109
Gross Expenditure
4,117
0(6)
(61)
01,108
5,159
Service Level Agreement Recharges
00
00
00
0
Income
Internal Recharge Income
(192)
00
00
0(192)
Government Grants
(240)
00
0200
0(40)
Reimbursements & Contributions
(67)
00
00
0(67)
Customer & Client Receipts
(865)
(2)
00
0(2)
(869)
Interest & Other
00
00
00
0
Use of Balances & Reserves
00
00
00
0
Gross Income
(1,364)
(2)
00
200
(2)
(1,168)
Net Expenditure/ (Income)
2,753
(2)
(6)
(61)
200
1,106
3,991
Explanation of major items above
£000
FTE
MTFS Efficiencies
(61)
(1)
MTFS Growth - Planning Delivery Grant reduction
200
nil
Capital Charges - Deferred Grants written out
1,063
nil
Other Adjustments
37
nil
Total
1,239
(1)
The Planning Division provides an integrated policy function for planning, transportation and the environment. This includes responsibility for statutory plans and non-
statutory plans; research; advising on planning applications and development of the council's own land; pre-application advice; and access. The Development Management
Services assesses all applications for planning perm
ission to carry out new development, works to existing buildings and changes of use.
ENVIRONMENT SERVICES DEPARTMENT
PLANNING
~ 5
0 ~

2009/2010
2010/2011
Full Time Equivalents
66
62
Subjective Analysis of Estimates
2009/2010
Estimates
£000
Inflation
£000
Redirected
Resources
£000
Efficiencies
£000
Growth
£000
Other
Variations
£000
2010/2011
Estimates
£000
Expenditure
Employees
3,541
00
(140)
026
3,427
Premises
132
00
00
(25)
106
Transport
44
00
00
044
Supplies & Services
496
0(5)
00
29
521
Third Party Payments
77
00
00
077
Transfer Payments
00
00
00
0
Support Services
719
00
00
91
810
Capital Charges
2,109
00
00
(1,362)
747
Gross Expenditure
7,118
0(5)
(140)
0(1,241)
5,732
Service Level Agreement Recharges
(222)
00
00
(81)
(303)
Income
Internal Recharge Income
(26)
00
00
0(26)
Government Grants
00
00
00
0
Reimbursements & Contributions
(149)
00
00
0(149)
Customer & Client Receipts
(841)
(8)
00
06
(844)
Interest & Other
(10)
00
00
0(10)
Use of Balances & Reserves
00
00
00
0
Gross Income
(1,026)
(8)
00
06
(1,029)
Net Expenditure/ (Income)
5,870
(8)
(5)
(140)
0(1,316)
4,400
Explanation of major items above
£000
FTE
MTFS Efficiencies
(140)
(4)
Capital Charges Adjustment - Deferred Charges Written Out (Improvement Grants)
(1,362)
nil
Other Adjustments
41
nil
Total
(1,461)
(4)
The Public Protection and Safety Division is responsible for many of the Council’s statutory regulatory functions including environmental health, trading standards and
licensing. The division also includes corporate safety, departmental perform
ance and complaint monitoring. The primary objective of the Division is to protect the health,
safety and well being of people who live, work in or visit the borough and where necessary to effect improvements through intervention.
ENVIRONMENT SERVICES DEPARTMENT
PUBLIC PROTECTION & SAFETY
~ 5
1 ~

2009/2010
2010/2011
Full Time Equivalents
136
130
Subjective Analysis of Estimates
2009/2010
Estimates
£000
Inflation
£000
Redirected
Resources
£000
Efficiencies
£000
Growth
£000
Other
Variations
£000
2010/2011
Estimates
£000
Expenditure
Employees
7,315
0170
(213)
0(776)
6,497
Premises
7,292
117
0(1,289)
19
(219)
5,921
Transport
162
0(3)
00
(28)
131
Supplies & Services
1,821
0(72)
00
(209)
1,540
Third Party Payments
1,227
00
00
348
1,575
Transfer Payments
10
00
00
1
Support Services
890
00
00
233
1,123
Capital Charges
1,135
00
00
511
1,646
Gross Expenditure
19,843
117
95
(1,502)
19
(140)
18,434
Service Level Agreement Recharges
(1,195)
00
00
(6,658)
(7,853)
Income
Internal Recharge Income
(15,213)
00
(75)
07,366
(7,922)
Government Grants
00
00
00
0
Reimbursements & Contributions
(5)
00
00
0(5)
Customer & Client Receipts
(3,835)
(30)
0(844)
0198
(4,511)
Interest & Other
00
00
00
0
Use of Balances & Reserves
00
00
00
0
Gross Income
(19,053)
(30)
0(919)
07,564
(12,438)
Net Expenditure/ (Income)
(405)
87
95
(2,421)
19
766
(1,857)
Explanation of major items above
£000
FTE
MTFS Efficiencies
(2,421)
(4)
Enhanced Role of Facilities Management Team
170
nil
Other employee reductions due to Building Control activity related to economic clim
ate
(286)
nil
Reduction in Building Control income due to economic clim
ate
286
nil
Reduction in Borough Construction salaries due to outsourcing
(64)
(2)
Adjustments relating to SLA Recovery
708
nil
Other Adjustments (including NNDR growth of £19k)
66
nil
Total
(1,541)
(6)
This division provides a complete professional architectural, engineering, facilities management and surveying service to all departments of the Council and Hammersmith and
Fulham Homes. The division also incorporates an in house direct labour works practice, undertaking day to day repairs, refurbishment and engineering servicing works to
Council properties. The Building control service enforces the national Building Regulations in the borough. Valuation and Property Services provides a comprehensive valuation
and commercial estate m
anagement service on behalf of the council. Facilities Management oversees running costs and m
aintenance budgets, ensuring that the m
ost efficient
use is made of the property portfolio.
ENVIRONMENT SERVICES DEPARTMENT
BUILDING & PROPERTY MANAGEMENT
~ 5
2 ~

2009/2010
2010/2011
Full Time Equivalents
27
27
Subjective Analysis of Estimates
2009/2010
Estimates
£000
Inflation
£000
Redirected
Resources
£000
Efficiencies
£000
Growth
£000
Other
Variations
£000
2010/2011
Estimates
£000
Expenditure
Employees
1,940
00
(84)
0(149)
1,708
Premises
1,344
00
01
(377)
967
Transport
10
00
00
1
Supplies & Services
3,853
0(3)
(30)
0(629)
3,191
Third Party Payments
00
00
00
0
Transfer Payments
00
00
00
0
Support Services
384
00
00
744
1,129
Capital Charges
50
00
04
8
Gross Expenditure
7,527
0(3)
(114)
1(407)
7,004
Service Level Agreement Recharges
(5,599)
00
00
(1,061)
(6,661)
Income
Internal Recharge Income
(1,551)
00
00
1,551
0
Government Grants
00
00
00
0
Reimbursements & Contributions
(200)
00
00
0(200)
Customer & Client Receipts
(24)
00
(200)
00
(224)
Interest & Other
00
00
00
0
Use of Balances & Reserves
00
00
00
0
Gross Income
(1,775)
00
(200)
01,551
(424)
Net Expenditure/ (Income)
153
0(3)
(314)
183
(81)
Explanation of major items above
£000
FTE
MFTS Efficiencies
(314)
nil
Finance & Accountancy efficiencies budget adjustment for FTE reductions reported last year
(159)
nil
NNDR growth
1nil
Other Adjustments
239
nil
Total
(233)
nil
This division comprises the Director's office as well as the support services provided by the Resources and Finance Groups. Corporate support costs, Inform
ation Technology and
other centralised budgets which are fully allocated to front-line services are also reflected in this area.
ENVIRONMENT SERVICES DEPARTMENT
RESOURCES ~
53
~

Blank
~ 54 ~

~ 55 ~
Description of service Residents Services is a new department created from 1 April 2009 that brings together for the first time the universal services of the Council that have a major impact on the daily lives of the residents of Hammersmith & Fulham. The purpose of the Residents Services Department is to bring together services that help deliver a cleaner, greener, healthier and safer borough. Through our cultural services our purpose is to provide a range of activities that add to the enjoyment and sense of well-being in the community. Through our emergency services our purpose is to work with other emergency partners to ensure business continuity across the Council in response to external events that may cause disruption to the delivery of Council services. Our waste and street scene services ensure that the environment in which our residents both work and live is clean and pleasant. Statement of Core Business The department supports the Decent Neighbourhood agenda and enables local residents to gain experience and opportunities that ultimately help them achieve their aspirations in life. Five of the Councils main priorities are the drivers for our work:
• Tackling Crime and Anti-Social Behaviour • Delivering High Quality, Value for Money Services • Creating a cleaner, greener borough • Setting the framework for a healthy borough • Regenerating the most deprived areas of the borough
Prime objectives of the department The purpose of Residents Services is to deliver its core business outcomes- achieving continuous improvement and higher resident satisfaction levels at each stage- by implementing coordinated plans and actions at departmental, divisional , service and team level. In summary the primary objectives are:
• Improving residents’ satisfaction with services through customer engagement • Providing high quality, value for money services for residents • Tackling crime and anti-social behaviour for a safer environment • Reducing waste, fly-tipping, fly-posting, graffiti and litter and increasing recycling • Developing our commercial waste services • Delivering a new sports and physical activity offer for the borough • Delivering on the Parks & Open Spaces Strategy objectives • Improve parks & open spaces and grounds maintenance
• Defining a programme of 2012 activities for the borough • Redefining and providing a modern and comprehensive public library service • Support the arts and creative industry development • Deliver excellent services and facilities which enhance the quality of life in the borough
RESIDENTS SERVICES

~ 56 ~

2010/2011 ESTIMATES
RESIDENTS SERVICES
DEPARTMENT
~ 57 ~

Service Area Analysis
2009/2010
Estimates
£000
Inflation
£000
Redirected
Resources
£000
Efficiencies
£000
Growth
£000
Other
Adjustments
£000
2010/2011
Estimates
£000
Directors Office 0 0 0 0 0 0 0
Cleaner & Greener
Neighbourhoods17,836 1 (8) (489) 1,535 (97) 18,778
Safer Neighbourhoods 4,197 (1) 627 (312) 163 1,807 6,481
Parks & Culture 11,546 (35) (106) (692) 280 754 11,747
Resources 0 0 (60) (69) 120 9 0
TOTAL 33,579 (35) 453 (1,562) 2,098 2,473 37,006
RESIDENTS SERVICES DEPARTMENT
CHANGE BETWEEN YEARS
~ 58 ~

2009/2010
2010/2011
Num
ber of Full
Tim
e E
quivalent st
aff
338
325
SUBJECTIVE ANALYSIS OF ESTIMATES
2009/2010
Estimates
£000
Inflation
£000
Redirected
Resources
£000
Efficiencies
£000
Growth
£000
Other
Variations
£000
2010/2011
Estimates
£000
Expenditure
Em
plo
yee E
xpense
s13,0
26
046
(756)
270
579
13,1
65
Pre
mises Relate
d E
xpenditure
2,9
25
00
(56)
61
1,7
25
4,6
55
Tra
nsp
ort R
elate
d E
xpenditure
2,3
46
00
(21)
0312
2,6
37
Supplie
s and S
erv
ices
4,7
50
1(1
81)
(114)
02,0
32
6,4
88
Third P
arty P
aym
ents
24,4
86
5589
(275)
1,5
67
(195)
26,1
77
Tra
nsfer Paym
ents
00
00
00
0
Support S
erv
ices
3,3
69
00
00
3,3
76
6,7
45
Capital Charg
es
839
00
00
(89)
750
GROSS EXPENDITURE
51,741
6453
(1,222)
1,898
7,740
60,617
Serv
ice L
evel Agre
em
ent Rech
arg
es
(3,4
79)
00
00
(4,6
60)
(8,1
39)
Income
Inte
rnal Rech
arg
e Inco
me
(5,9
85)
(2)
00
01,8
51
(4,1
36)
Govern
ment Gra
nts
(22)
00
00
(489)
(511)
Oth
er Reim
burs
em
ents
& C
ontrib
utions
(2,0
58)
(1)
0(3
0)
0405
(1,6
84)
Cust
om
er & C
lient Rece
ipts
(6,6
17)
(38)
0(3
10)
200
(2,3
73)
(9,1
38)
Inte
rest
& O
ther
00
00
00
0
Use
of Balance
s & R
ese
rves
00
00
00
0
GROSS INCOME
(14,682)
(41)
0(340)
200
(606)
(15,469)
NET EXPENDITURE
33,580
(35)
453
(1,562)
2,098
2,473
37,006
RE
SID
EN
TS
SE
RV
IC
ES
DE
PA
RT
ME
NT
SU
MM
AR
Y
~ 5
9 ~

2009/2
010
2010/2
011
Full
Tim
e E
quivalents
11
Subjective Analysis of Estimates
2009/2010
Estimates
£000
Inflation
£000
Redirected
Resources
£000
Efficiencies
£000
Growth
£000
Other
Variations
£000
2010/2011
Estimates
£000
Expenditure
Em
plo
yees
157
00
00
40
197
Pre
mises
00
00
019
19
Tra
nsp
ort
10
00
0(1
) 0
Supplie
s & S
erv
ices
33
00
00
(15)
18
Third P
arty P
aym
ents
00
00
00
0
Tra
nsfer Paym
ents
00
00
00
0
Support S
erv
ices
00
00
08
8
Capital Charg
es
00
00
00
0
Gross Expenditure
191
00
00
51
242
Service Level Agreement Recharges
(191)
00
00
(51)
(242)
Income
Inte
rnal Rech
arg
e Inco
me
00
00
00
0
Govern
ment Gra
nts
00
00
00
0
Reim
burs
em
ents
& C
ontrib
utions
00
00
00
0
Cust
om
er & C
lient Rece
ipts
00
00
00
0
Inte
rest
& O
ther
00
00
00
0
Use
of Balance
s & R
ese
rves
00
00
00
0
Gross Income
00
00
00
0
Net Expenditure/ (Income)
00
00
00
0
Explanation of major items above
£000
FTE
All
budget m
ovem
ents
are
due to S
LAs and a
corresp
ondin
g incr
ease
in the D
irect
or re
charg
e to R
SD serv
ices
nil
nil
Total
nil
nil
The D
irect
or's Office c
onsist
s of th
e D
irect
or of Residents
Serv
ices and the relate
d a
dm
inistrative support o
verh
ead that is a
lloca
ted a
cross
the S
erv
ice a
reas or, in the c
ase
of
the D
irect
or, p
art a
lloca
ted to the c
ost
s of CDC.
RESIDENTS SERVICES DEPARTMENT
DIRECTOR'S OFFICE
~ 6
0 ~

2009/2
010
2010/2
011
Full
Tim
e E
quivalents
162
154
Subjective Analysis of Estimates
2009/2010
Estimates
£000
Inflation
£000
Redirected
Resources
£000
Efficiencies
£000
Growth
£000
Other
Variations
£000
2010/2011
Estimates
£000
Expenditure
Em
plo
yees
6,2
22
0(2
2)
(351)
0(5
) 5,8
44
Pre
mises
1,8
07
00
(55)
30
318
2,1
00
Tra
nsp
ort
128
00
00
0128
Supplie
s & S
erv
ices
2,1
50
1(8
4)
(25)
0214
2,2
56
Third P
arty P
aym
ents
4,0
62
00
(125)
50
85
4,0
72
Tra
nsfer Paym
ents
00
00
00
0
Support S
erv
ices
1,7
75
00
00
348
2,1
23
Capital Charg
es
612
00
00
47
659
Gross Expenditure
16,756
1(106)
(556)
80
1,007
17,182
Service Level Agreement Recharges
00
00
00
0
Income
Inte
rnal Rech
arg
e Inco
me
(1,5
96)
00
00
1,0
34
(562)
Govern
ment Gra
nts
00
00
0(7
5)
(75)
Reim
burs
em
ents
& C
ontrib
utions
(367)
(1)
0(3
0)
0114
(284)
Cust
om
er & C
lient Rece
ipts
(3,2
47)
(35)
0(1
06)
200
(1,3
26)
(4,5
14)
Inte
rest
& O
ther
00
00
00
0
Use
of Balance
s & R
ese
rves
00
00
00
0
Gross Income
(5,210)
(36)
0(136)
200
(253)
(5,435)
Net Expenditure/ (Income)
11,546
(35)
(106)
(692)
280
754
11,747
Explanation of major items above
£000
FTE
Redirect
ed R
eso
urc
es - In
sura
nce
Claw b
ack
(£84k) Tra
nsfer 0.5
FTE p
ost
to F
acilit
ies M
anagem
ent (E
NV) fo
r In
tern
al Hall
Hire (£22k)
(106)
nil
(692)
(12)
280
nil
754
nil
Total
236
(12)
Gro
wth
Ite
ms - Under ach
ievem
ent of in
com
e fro
m e
vents
due to licensing rest
rict
ions (£
200k), a
dditio
n to G
rounds M
ain
tenance
Contract
for
Norm
and P
ark
(£50k), N
NDR G
rowth
(£30k)
Oth
er Variations - Pensions gro
wth
(£43k), C
ontrib
ution to A
D C
ust
om
er & C
om
merc
ial Serv
ices post
(£-1
0k), S
LA m
ovem
ent (£
318k P
rem
ises +
£348k S
upport S
erv
ices)
, Capital ch
arg
es (£
47k), O
ther (£
8k)
The P
ark
s & C
ulture
Divisio
n b
rings to
geth
er a range o
f 'u
nivers
al' se
rvices fo
r th
e residents
of Ham
mers
mith &
Fulh
am
, which togeth
er co
ntrib
ute
to the e
njo
ym
ent, learn
ing,
well-
bein
g a
nd d
aily
life o
f th
e p
eople in the b
oro
ugh. The S
erv
ices co
nsist
of Lib
raries & A
rchives, A
rts & E
vents
, and P
ark
s & R
ecr
eation. The D
ivisio
n a
lso h
as re
sponsibility
for
the d
eliv
ery
of th
e G
rounds M
ain
tenance
Contract
and leisure
contract
s.
RESIDENTS SERVICES DEPARTMENT
PARKS & CULTURE
Efficiencies - Rest
ruct
ure
and R
eview o
f Lib
rary
& A
rchives Serv
ice (£301k &
12 F
TEs)
, Fulh
am
Palace
(106k), R
eview D
ivisio
nal M
anagem
ent
Struct
ure
(£68k), R
egistration S
erv
ices (£
15k), P
artners
hip
work
ing w
ith leisure
contract
ors
(£100k), E
vents
(£5k), C
om
munity S
ports Review
(£29k) Gro
unds m
ain
tenance
contract
managem
ent (£
68k)
~ 6
1 ~

2009/2
010
2010/2
011
Full
Tim
e E
quivalents
12
16
Subjective Analysis of Estimates
2009/2010
Estimates
£000
Inflation
£000
Redirected
Resources
£000
Efficiencies
£000
Growth
£000
Other
Variations
£000
2010/2011
Estimates
£000
Expenditure
Em
plo
yees
585
0(5
0)
(39)
120
340
956
Pre
mises
29
00
00
1,3
59
1,3
88
Tra
nsp
ort
00
00
00
0
Supplie
s & S
erv
ices
937
0(1
0)
(30)
0985
1,8
82
Third P
arty P
aym
ents
00
00
00
0
Tra
nsfer Paym
ents
00
00
00
0
Support S
erv
ices
805
00
00
1,8
71
2,6
76
Capital Charg
es
00
00
00
0
Gross Expenditure
2,356
0(60)
(69)
120
4,555
6,902
Service Level Agreement Recharges
(2,3
56)
00
00
(4,5
46)
(6,9
02)
Income
Inte
rnal Rech
arg
e Inco
me
00
00
00
0
Govern
ment Gra
nts
00
00
00
0
Reim
burs
em
ents
& C
ontrib
utions
00
00
00
0
Cust
om
er & C
lient Rece
ipts
00
00
00
0
Inte
rest
& O
ther
00
00
00
0
Use
of Balance
s & R
ese
rves
00
00
00
0
Gross Income
00
00
00
0
Net Expenditure/ (Income)
00
(60)
(69)
120
90
Explanation of major items above
£000
FTE
(60)
(1)
(69)
(1)
120
1
95
Total
04
The R
eso
urc
es Divisio
n h
as re
sponsibility
for th
e d
evelo
pm
ent of th
e D
epartm
ent's financial and p
erform
ance
syst
em
s to
meet co
rpora
te a
nd legal re
quirem
ents
togeth
er with
the p
repara
tion a
nd m
onitoring o
f th
e D
epartm
ent's re
venue a
nd c
apital budgets
. It p
rovid
es appro
priate
pro
fess
ional HR a
dvice a
nd g
uid
ance
to m
anagers
and sta
ff a
nd h
as
resp
onsibility
for all
asp
ect
s of In
form
ation T
ech
nolo
gy w
ithin
the D
epartm
ent. T
he D
ivisio
n a
lso h
as re
sponsibility
for co
ord
inating a
nd im
plem
enting the C
orp
ora
te H
ealth &
Safe
ty a
nd C
om
plain
ts fra
mework
s.
RESIDENTS SERVICES DEPARTMENT
RESOURCES
Redirect
ed R
eso
urc
es - Redirect
ion o
f post
(£-5
0k), C
law b
ack
of In
sura
nce
Budgets
(-£
10k)
Oth
er Variations - Tra
nsfer of Fin
ance
sta
ff fro
m E
NV a
nd C
SD follo
win
g C
ouncil Reorg
anisation (£248k +
5FTE), c
ontrib
ution for AD C
ust
om
er
& C
om
merc
ial Serv
ices post
(£10k), P
ensions gro
wth
(£43k), S
LA m
ovem
ent, C
apital ch
arg
es (£
47), Incr
ease
Rech
arg
es to
RSD serv
ices (£
-
339k)
Efficiencies - Reorg
anisation o
f Reso
urc
es Team
Roles (-£39k &
1 F
TE), R
eview o
f Supplie
s & S
erv
ices (-£30k)
Gro
wth
Ite
ms - Cro
ss C
uttin
g P
rogra
mm
e D
irect
or fo
r Tra
nsform
ing the C
ust
om
er Experience
(120k)
~ 6
2 ~

2009/2
010
2010/2
011
Full
Tim
e E
quivalents
115
110
Subjective Analysis of Estimates
2009/2010
Estimates
£000
Inflation
£000
Redirected
Resources
£000
Efficiencies
£000
Growth
£000
Other
Variations
£000
2010/2011
Estimates
£000
Expenditure
Em
plo
yees
4,1
46
070
(266)
150
77
4,1
77
Pre
mises
460
00
013
57
530
Tra
nsp
ort
74
00
(8)
0(1
) 65
Supplie
s & S
erv
ices
978
0(3
1)
(13)
0859
1,7
93
Third P
arty P
aym
ents
1,7
52
0589
00
(280)
2,0
61
Tra
nsfer Paym
ents
00
00
00
0
Support S
erv
ices
77
00
00
1,1
80
1,2
57
Capital Charg
es
79
00
00
(34)
45
Gross Expenditure
7,566
0628
(287)
163
1,858
9,928
Service Level Agreement Recharges
(932)
00
00
(63)
(995)
Income
Inte
rnal Rech
arg
e Inco
me
(559)
00
00
116
(443)
Govern
ment Gra
nts
(22)
00
00
(414)
(436)
Reim
burs
em
ents
& C
ontrib
utions
(1,6
91)
00
00
291
(1,4
00)
Cust
om
er & C
lient Rece
ipts
(167)
(1)
0(2
5)
020
(173)
Inte
rest
& O
ther
00
00
00
0
Use
of Balance
s & R
ese
rves
00
00
00
0
Gross Income
(2,439)
(1)
0(25)
013
(2,452)
Net Expenditure/ (Income)
4,195
(1)
628
(312)
163
1,808
6,481
Explanation of major items above
£000
FTE
628
nil
(312)
(4)
163
nil
1,8
08
(1)
Total
2,287
(5)
This d
ivisio
n w
ork
s in
colla
bora
tion w
ith o
thers
to reduce
crim
e, fe
ar of cr
ime a
nd a
nti-s
ocial behavio
ur and e
nsu
res busioness
continuity a
nd e
merg
ency
pre
pare
dness
. This
divisio
n includes th
e C
CTV a
nd S
ecu
rity
Serv
ices, S
treet And E
state
Ward
ens, P
ark
s Const
abulary
, th
e C
om
munity S
afe
ty u
nit, Em
erg
ency
Serv
ices, C
oro
ners
and M
ortuary
Serv
ices and the A
nti-S
ocial Behavio
ur unit. The F
TE fig
ure
s belo
w include 2
6 H
RA funded sta
ff. The c
ost
s ass
ociate
d w
ith these
sta
ff a
re included in the H
RA b
udget book
pages and a
re n
ot in
cluded b
elo
w.
RESIDENTS SERVICES DEPARTMENT
SAFER COMMUNITIES
Oth
er Variations - Pensions gro
wth
(£27k), T
ransfer of 1 F
TE P
A p
ost
to R
eso
urc
es Team
(-£
36k), S
LA m
ovem
ent (£
286k P
rem
ises + £
416k
supplie
s & serv
ice (IT
& secu
rity
) + £
1180k S
upport S
erv
ices)
- larg
e m
ovem
ent as SLAs not lo
aded into
origin
al budgets
in 2
009/1
0 b
ut held
centrally
inst
ead, Capital ch
arg
es (-£34k), O
ther (-£31k)
Efficiencies - Em
erg
ency
Serv
ices Review a
nd R
eorg
anisation (£95k, -1
FTE), R
eview o
f secu
rity
contract
(£46k, -2
FTE), W
ard
en &
Anti S
ocial
Behavio
ur Serv
ices Review (£158k, -1
FTE), C
ross
Divisio
n e
xpenditure
efficiencies (£
13k)
Gro
wth
- R
ealig
nm
ent of se
curity
budgets
(£150k), N
NDR g
rowth
(£13k)
Redirect
ed R
eso
urc
es - Dra
w d
own fro
m 2
4/7
Polic
ing A
ppro
priation (£589k), b
udget in
crease
to m
anage secu
rity
sin
gle sta
tus (£
74k), R
em
oval
of budgets
for in
sura
nce
& C
NNs (-£35k)
~ 6
3 ~

2009/2
010
2010/2
011
Full
Tim
e E
quivalents
48
44
Subjective Analysis of Estimates
2009/2010
Estimates
£000
Inflation
£000
Redirected
Resources
£000
Efficiencies
£000
Growth
£000
Other
Variations
£000
2010/2011
Estimates
£000
Expenditure
Em
plo
yees
1,9
16
048
(100)
0127
1,9
91
Pre
mises
629
00
(1)
18
(28)
618
Tra
nsp
ort
2,1
43
00
(13)
0314
2,4
44
Supplie
s & S
erv
ices
652
0(5
6)
(46)
0(1
1)
539
Third P
arty P
aym
ents
18,6
72
50
(150)
1,5
17
020,0
44
Tra
nsfer Paym
ents
00
00
00
0
Support S
erv
ices
712
00
00
(31)
681
Capital Charg
es
148
00
00
(102)
46
Gross Expenditure
24,872
5(8)
(310)
1,535
269
26,363
Service Level Agreement Recharges
00
00
00
0
Income
Inte
rnal Rech
arg
e Inco
me
(3,8
33)
(2)
00
0701
(3,1
34)
Govern
ment Gra
nts
00
00
00
0
Reim
burs
em
ents
& C
ontrib
utions
00
00
00
0
Cust
om
er & C
lient Rece
ipts
(3,2
03)
(2)
0(1
79)
0(1
,067)
(4,4
51)
Inte
rest
& O
ther
00
00
00
0
Use
of Balance
s & R
ese
rves
00
00
00
0
Gross Income
(7,036)
(4)
0(179)
0(366)
(7,585)
Net Expenditure/ (Income)
17,836
1(8)
(489)
1,535
(97)
18,778
Explanation of major items above
£000
FTE
(8)
nil
(489)
(4)
1,5
35
nil
(97)
nil
Total
941
(4)
Gro
wth
Ite
ms - In
crease
d w
ast
e d
isposa
l and landfill
cost
s (£
1,3
42k), A
dditio
ns to
Wast
e M
anagem
ent Contract
(£175k), N
NDR (£18k)
Oth
er Variations - SLA m
ovem
ent (-£26k), P
ensions gro
wth
(£13k), C
apital ch
arg
es (-£102k), S
treet Sce
ne E
stablis
hm
ent (£
35k), a
nd o
ther (-
£17k)
The p
urp
ose
of th
e C
leaner and G
reener Neig
hbourh
oods Divisio
n is to
pro
vid
e e
xce
llent st
reet base
d serv
ices whils
t in
creasing c
ust
om
er sa
tisfact
ion a
nd g
rowin
g o
ur in
com
e
base
. Specifica
lly, we d
eliv
er th
e follo
win
g serv
ices;
Managem
ent and m
onitoring o
f th
e R
efu
se, Recy
clin
g a
nd S
treet Cleansing c
ontract
; W
ast
e d
isposa
l arrangem
ents
via the
West
ern
Rivers
ide W
ast
e A
uth
ority
; Street Sce
ne E
nfo
rcem
ent; G
raffiti Rem
oval and E
nviro-c
rim
e; Licensing a
nd e
nfo
rcem
ent of Street Tra
din
g a
nd M
ark
et M
anagem
ent ;
Enfo
rcem
ent of sk
ips, m
ate
rials, ta
bles and c
hairs on the h
ighway; Fleet M
anagem
ent and M
anagem
ent of Bagley’s L
ane D
epot.
RESIDENTS SERVICES DEPARTMENT
CLEANER & GREENER NEIGHBOURHOODS
Redirect
ed R
eso
urc
es - Corp
ora
te fundin
g for sh
ortfa
ll on A
ssista
nt Direct
or post
(£48k), IT G
rowth
(-£
53k), Insu
rance
Claw b
ack
(-£
3k)
Efficiencies - Tra
de R
efu
se Inco
me (£200k), W
ast
e M
anagem
ent & A
dm
in (£125k), S
treet Sce
ne &
Gra
ffiti (£
130k), T
ransp
ort (£34k)
~ 6
4 ~

~ 65 ~
Description of service The purpose of the Finance & Corporate Services Department is to provide the corporate framework for the delivery of high quality value for money public services, enabling the achievement of the Council’s vision of being a borough of opportunity. Value for Money is the core value of the whole department. All teams within the department recognise that their key purpose is to increase the efficiency of the Council, both directly and indirectly, by assisting other departments to increase their efficiency. Finance & Corporate Services Department also makes a huge contribution to ‘joining up’ the Council. All our teams work closely and constructively with all other departments in the Council to ensure the corporate priorities are being addressed, especially the delivery of value for money. Statement of Core Business The Finance & Corporate Services Department seeks to:
• Champion strong governance, financial management, performance management and customer service.
• Enable effective corporate management and leadership, providing strategic advice and leadership on communication.
• Deliver excellent, cost effective and responsive corporate services internally and externally.
• Enable effective people management and leadership, helping the Council to be an ‘employer of choice’, in accordance with our values.
• Provide the framework for improving efficiency, effectiveness and VFM across the Council and its partners
Prime objectives of the department
• To drive the Medium Term Financial Strategy (MTFS) process and support the delivery of the Council’s MTFS priorities of lower Council Tax and greater value for money
• To manage the performance and governance framework to enable successful programme and project delivery.
• To drive specified cultural and transformational change throughout the Council, which delivers great resident and customer satisfaction through one Council
• To ensure adequate Human Resources and Organisational Development capacity to deliver the Council’s objectives and priorities
• To work proactively to mitigate the impact of the economic downturn on the borough and the Council by identifying a suite of indicators to measure the impact. Also by ensuring that the budget strategy takes account of the impact on the Council’s services and that pressures are adequately budgeted for
• To play a key role in supporting managers responsible for delivery of the projects within the market testing programme, many of whom have no experience of putting services out to competition or developing in-house bids. The successful delivery of this programme is key to the delivery of the Council’s financial strategy.
• To manage the collection and recovery of income to the Council whilst maximising benefit subsidy – in ways that promote the customer service agenda and improve resident satisfaction
FINANCE & CORPORATE SERVICES

~ 66 ~

2010/2011 ESTIMATES
FINANCE & CORPORATE
SERVICES DEPARTMENT
~ 67 ~

Service Area Analysis
2009/2010
Estimates
£000
Inflation
£000
Redirected
Resources
£000
Efficiencies
£000
Growth
£000
Other
Adjustments
£000
2010/2011
Estimates
£000
Business Transformation
Team(37) 0 0 0 0 33 (4)
Electoral Services 656 0 (2) (10) 250 46 940
Corporate Human
Resources45 0 (21) (166) 250 (100) 8
Service Level Agreement
Balances0 0 (2) 0 0 (115) (117)
Executive Services 86 0 28 (31) 0 (46) 37
Communications 278 0 (18) (255) 0 86 91
Legal Services (396) 0 (1) (142) 0 135 (404)
Councillors Services (1) 0 (109) (95) 15 189 (1)
Finance (5) 0 76 (188) 0 207 90
Business Technology &
Bridge Partnership(19) 155 1,118 0 350 (1,819) (215)
Strategy, Policy &
Procurement0 0 101 (20) 0 68 149
H&F Direct 8,660 0 122 (158) 1,892 639 11,155
Organisational
Development(1) 0 (2) (68) 0 70 (1)
TOTAL 9,266 155 1,290 (1,133) 2,757 (607) 11,728
FINANCE & CORPORATE SERVICES DEPARTMENT
CHANGE BETWEEN YEARS
~ 68 ~

2009/2010
2010/2011
Number of Full Time Equivalent staff
451
419
SUBJECTIVE ANALYSIS OF ESTIMATES
2009/2010
Estimates
Inflation
£000
Redirected
Resources
£000
Efficiencies
£000
Growth
£000
Other
Variations
£000
2010/2011
Estimates
£000
Expenditure
Employee Expenses
21,936
0196
(701)
940
(6)
22,365
Premises Related Expenditure
2,565
0(17)
00
313
2,861
Transport Related Expenditure
60
00
00
060
Supplies and Services
12,222
2(26)
(331)
115
1,900
13,882
Third Party Payments
16,144
153
44
0350
182
16,873
Transfer Payments
4,352
00
01,312
05,664
Support Services
5,089
01,164
00
3,113
9,366
Capital Charges
1,229
00
00
(593)
636
GROSS EXPENDITURE
63,597
155
1,361
(1,032)
2,717
4,909
71,707
Service Level Agrerement Recharges
(46,272)
0(71)
00
(5,489)
(51,832)
Income
L_01Internal Recharge Income
(40)
00
00
0(40)
L_02Government Grants
(3,023)
00
00
85
(2,938)
L_03Other Reimbursements & Contributions
(1,305)
00
00
(112)
(1,417)
L_04Customer & Client Receipts
(3,866)
00
(101)
40
0(3,927)
OInterest & Other
175
00
00
0175
PUse of Balances & Reserves
00
00
00
0
GROSS INCOME
(8,059)
00
(101)
40
(27)
(8,147)
NET EXPENDITURE
9,266
155
1,290
(1,133)
2,757
(607)
11,728
FIN
AN
CE
& C
OR
PO
RA
TE
SE
RV
IC
ES
DE
PA
RT
ME
NT
SU
MM
AR
Y
~ 6
9 ~

2009/2010
2010/2011
Full Time Equivalents
98
Subjective Analysis of Estimates
2009/2010
Estimates
£000
Inflation
£000
Redirected
Resources
£000
Efficiencies
£000
Growth
£000
Other
Variations
£000
2010/2011
Estimates
£000
Expenditure
Employees
898
00
00
118
1,016
Premises
18
00
00
624
Transport
00
00
00
0
Supplies & Services
88
00
00
(3)
85
Third Party Payments
00
00
00
0
Transfer Payments
00
00
00
0
Support Services
50
00
00
23
73
Capital Charges
00
00
00
0
Gross Expenditure
1,054
00
00
144
1,198
Service Level Agreement Recharges
10
00
01
2
Income
Internal Recharge Income
00
00
00
0
Government Grants
00
00
00
0
Reimbursements & Contributions
(1,092)
00
00
(112)
(1,204)
Customer & Client Receipts
00
00
00
0
Interest & Other
00
00
00
0
Use of Balances & Reserves
00
00
00
0
Gross Income
(1,092)
00
00
(112)
(1,204)
Net Expenditure/ (Income)
(37)
00
00
33
(4)
Explanation of major items above
£000
FTE
The other variations arise from a net change in pensions and SLAs
33
nil
Reduction of 1 FTE on the Trading Account within this division
nil
(1)
Total
33
(1)
The Business Transformation Team works across the Council with departments on projects and programmes to improve the quality of services and reduce costs.
FINANCE & CORPORATE SERVICES DEPARTMENT
BUSINESS TRANSFORMATION TEAM
~ 7
0 ~

2009/2010
2010/2011
Full Time Equivalents
77
Subjective Analysis of Estimates
2009/2010
Estimates
£000
Inflation
£000
Redirected
Resources
£000
Efficiencies
£000
Growth
£000
Other
Variations
£000
2010/2011
Estimates
£000
Expenditure
Employees
451
00
(10)
150
3594
Premises
26
0(2)
00
731
Transport
00
00
00
0
Supplies & Services
115
00
0100
7222
Third Party Payments
00
00
00
0
Transfer Payments
00
00
00
0
Support Services
64
00
00
29
93
Capital Charges
00
00
00
0
Gross Expenditure
656
0(2)
(10)
250
46
940
Service Level Agreement Recharges
00
00
00
0
Income
Internal Recharge Income
00
00
00
0
Government Grants
00
00
00
0
Reimbursements & Contributions
00
00
00
0
Customer & Client Receipts
00
00
00
0
Interest & Other
00
00
00
0
Use of Balances & Reserves
00
00
00
0
Gross Income
00
00
00
0
Net Expenditure/ (Income)
656
0(2)
(10)
250
46
940
Explanation of major items above
£000
FTE
Net Efficiencies and Growth arising from the Medium Term Financial Strategy
240
nil
Transfer to Environment Services for Facilities Management Services
(2)
nil
Other variations relate to the net growth in pensions and SLA movements
46
nil
Total
284
nil
This area is responsible for the production of the rolling Register of Electors for the Authority. The service also deals with electors' queries and ensures compliance with
relevant legislation.
FINANCE & CORPORATE SERVICES DEPARTMENT
ELECTORAL SERVICES
~ 7
1 ~

2009/2010
2010/2011
Full Time Equivalents
63
58
Subjective Analysis of Estimates
2009/2010
Estimates
£000
Inflation
£000
Redirected
Resources
£000
Efficiencies
£000
Growth
£000
Other
Variations
£000
2010/2011
Estimates
£000
Expenditure
Employees
3,225
00
(80)
250
311
3,706
Premises
164
00
00
21
185
Transport
10
00
00
1
Supplies & Services
944
0(21)
(56)
022
889
Third Party Payments
325
00
00
0325
Transfer Payments
00
00
00
0
Support Services
1,106
00
00
(605)
501
Capital Charges
182
00
00
(47)
135
Gross Expenditure
5,947
0(21)
(136)
250
(298)
5,742
Service Level Agreement Recharges
(5,726)
00
00
198
(5,528)
Income
Internal Recharge Income
00
00
00
0
Government Grants
00
00
00
0
Reimbursements & Contributions
(212)
00
00
0(212)
Customer & Client Receipts
(169)
00
(30)
00
(199)
Interest & Other
205
00
00
0205
Use of Balances & Reserves
00
00
00
0
Gross Income
(176)
00
(30)
00
(206)
Net Expenditure/ (Income)
45
0(21)
(166)
250
(100)
8
Explanation of major items above
£000
FTE
Net Efficiencies and Growth arising from the Medium Term Financial Strategy
84
nil
The redirected resources and other variations arise from the following:
Pensions
25
nil
SLA Changes
(364)
(8)
Capital Financing
(47)
nil
Permanent virements during the year for Trent system, Support Staff and Relationship Managers
286
3
Transfer of Insurance budget for inclusion within the SLA model
(21)
nil
Total
(37)
(5)
This area provides a range of strategic Human Resource functions for the council including employee relations, employment, occupational health, occupational safety, personnel
planning and remuneration. Ths division provides a council-wide service from a single point-of-contact.
FINANCE & CORPORATE SERVICES DEPARTMENT
CORPORATE HUMAN RESOURCES
~ 7
2 ~

2009/2010
2010/2011
Full Time Equivalents
00
Subjective Analysis of Estimates
2009/2010
Estimates
£000
Inflation
£000
Redirected
Resources
£000
Efficiencies
£000
Growth
£000
Other
Variations
£000
2010/2011
Estimates
£000
Expenditure
Employees
00
00
00
0
Premises
1,133
00
00
168
1,301
Transport
00
00
00
0
Supplies & Services
2,381
0(2)
00
1,749
4,128
Third Party Payments
00
00
00
0
Transfer Payments
00
00
00
0
Support Services
1,480
00
00
3,001
4,481
Capital Charges
00
00
00
0
Gross Expenditure
4,994
0(2)
00
4,918
9,910
Service Level Agreement Recharges
(4,994)
00
00
(5,033)
(10,027)
Income
Internal Recharge Income
00
00
00
0
Government Grants
00
00
00
0
Reimbursements & Contributions
00
00
00
0
Customer & Client Receipts
00
00
00
0
Interest & Other
00
00
00
0
Use of Balances & Reserves
00
00
00
0
Gross Income
00
00
00
0
Net Expenditure/ (Income)
00
(2)
00
(115)
(117)
Explanation of major items above
£000
FTE
The redirected resources and other variations arise from SLA balance movements
(117)
nil
Total
(117)
nil
This area records the budgets relating to contracts between various departments and partners for internal services usually between support functions and frontline service
delivery departments. Expenditure budgets are recharged out during budget-setting. When these are passed into other support services, there results a second wave of
expenditure allocation. Such budgets are kept centrally during budget setting and charged out during the year in accordance with BVACOP.
FINANCE & CORPORATE SERVICES DEPARTMENT
SERVICE LEVEL AGREEMENT BALANCES
~ 7
3 ~

2009/2010
2010/2011
Full Time Equivalents
14
14
Subjective Analysis of Estimates
2009/2010
Estimates
£000
Inflation
£000
Redirected
Resources
£000
Efficiencies
£000
Growth
£000
Other
Variations
£000
2010/2011
Estimates
£000
Expenditure
Employees
857
00
(31)
07
833
Premises
49
00
00
352
Transport
00
00
00
0
Supplies & Services
244
00
00
(98)
146
Third Party Payments
60
00
00
6
Transfer Payments
00
00
00
0
Support Services
162
00
00
42
204
Capital Charges
00
00
00
0
Gross Expenditure
1,318
00
(31)
0(46)
1,241
Service Level Agreement Recharges
(1,232)
028
00
0(1,204)
Income
Internal Recharge Income
00
00
00
0
Government Grants
00
00
00
0
Reimbursements & Contributions
00
00
00
0
Customer & Client Receipts
00
00
00
0
Interest & Other
00
00
00
0
Use of Balances & Reserves
00
00
00
0
Gross Income
00
00
00
0
Net Expenditure/ (Income)
86
028
(31)
0(46)
37
Explanation of major items above
£000
FTE
Net Efficiencies arising from the Medium Term Financial Strategy
(31)
nil
The redirected resources and other variations arise from pensions and SLA movements
(18)
nil
Total
(49)
nil
This division provides personnel and administrative support to the Leader of the Council and the Chief Executive who are responsible for ensuring that the Council's policy
objectives and targets are met. The division also includes the Complaints officers and administrative support for the Finance & Corporate Services Department.
FINANCE & CORPORATE SERVICES DEPARTMENT
EXECUTIVE SERVICES
~ 7
4 ~

2009/2010
2010/2011
Full Time Equivalents
21
21
Subjective Analysis of Estimates
2009/2010
Estimates
£000
Inflation
£000
Redirected
Resources
£000
Efficiencies
£000
Growth
£000
Other
Variations
£000
2010/2011
Estimates
£000
Expenditure
Employees
1,042
00
(9)
09
1,042
Premises
118
0(15)
00
(2)
101
Transport
10
00
00
1
Supplies & Services
1,597
0(3)
(175)
012
1,431
Third Party Payments
00
00
00
0
Transfer Payments
00
00
00
0
Support Services
178
00
00
48
226
Capital Charges
91
00
00
(85)
6
Gross Expenditure
3,027
0(18)
(184)
0(18)
2,807
Service Level Agreement Recharges
(1,027)
00
00
104
(923)
Income
Internal Recharge Income
00
00
00
0
Government Grants
00
00
00
0
Reimbursements & Contributions
00
00
00
0
Customer & Client Receipts
(1,722)
00
(71)
00
(1,793)
Interest & Other
00
00
00
0
Use of Balances & Reserves
00
00
00
0
Gross Income
(1,722)
00
(71)
00
(1,793)
Net Expenditure/ (Income)
278
0(18)
(255)
086
91
Explanation of major items above
£000
FTE
Net Efficiencies arising from the Medium Term Financial Strategy
(255)
nil
The redirected resources and other variations arise from the following:
Pensions
9nil
SLA movements
162
nil
Capital Financing
(85)
nil
Transfer to Environment Services for Facilities Management Services
(18)
nil
Total
(187)
nil
Promotes and communicates council services and activities through the media, website, intranet and public information service. Also provides a graphic design service to other
departments, along with Video/ Audio-visual presentations and co-ordination of location film activities.
FINANCE & CORPORATE SERVICES DEPARTMENT
COMMUNICATIONS
~ 7
5 ~

2009/2010
2010/2011
Full Time Equivalents
46
44
Subjective Analysis of Estimates
2009/2010
Estimates
£000
Inflation
£000
Redirected
Resources
£000
Efficiencies
£000
Growth
£000
Other
Variations
£000
2010/2011
Estimates
£000
Expenditure
Employees
2,411
00
(132)
018
2,297
Premises
107
00
00
50
157
Transport
40
00
00
4
Supplies & Services
353
0(1)
(10)
0(11)
331
Third Party Payments
00
00
00
0
Transfer Payments
00
00
00
0
Support Services
136
00
00
78
214
Capital Charges
00
00
00
0
Gross Expenditure
3,011
0(1)
(142)
0135
3,003
Service Level Agreement Recharges
(3,365)
00
00
0(3,365)
Income
Internal Recharge Income
(40)
00
00
0(40)
Government Grants
00
00
00
0
Reimbursements & Contributions
00
00
00
0
Customer & Client Receipts
(2)
00
00
0(2)
Interest & Other
00
00
00
0
Use of Balances & Reserves
00
00
00
0
Gross Income
(42)
00
00
0(42)
Net Expenditure/ (Income)
(396)
0(1)
(142)
0135
(404)
Explanation of major items above
£000
FTE
Net Efficiencies arising from the Medium Term Financial Strategy
(142)
nil
The redirected resources and other variations arise from the following:
Pensions
18
nil
SLA movements
117
nil
Staff Reorganisation
0(2)
Other minor variation
(1)
nil
Total
(8)
(2)
This area provides a comprehensive legal service to all departments of the Council on housing, planning, prosecution, childcare, employment and general legal advice.
FINANCE & CORPORATE SERVICES DEPARTMENT
LEGAL SERVICES
~ 7
6 ~
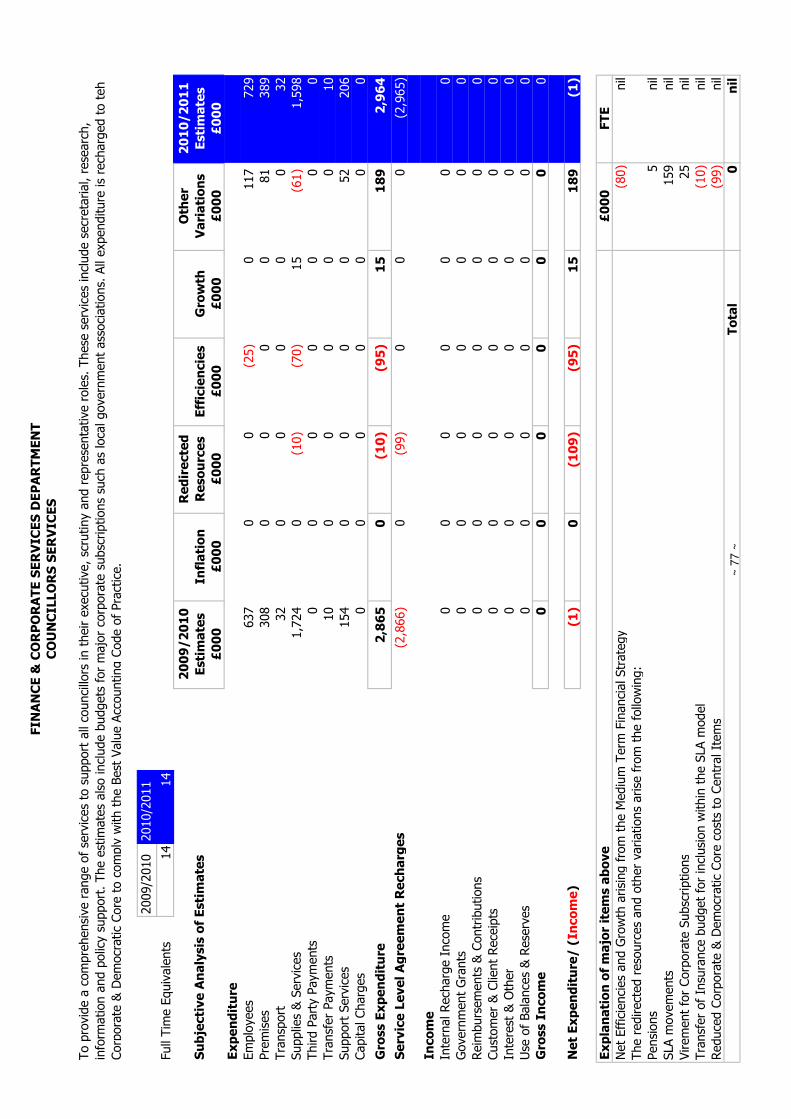
2009/2010
2010/2011
Full Time Equivalents
14
14
Subjective Analysis of Estimates
2009/2010
Estimates
£000
Inflation
£000
Redirected
Resources
£000
Efficiencies
£000
Growth
£000
Other
Variations
£000
2010/2011
Estimates
£000
Expenditure
Employees
637
00
(25)
0117
729
Premises
308
00
00
81
389
Transport
32
00
00
032
Supplies & Services
1,724
0(10)
(70)
15
(61)
1,598
Third Party Payments
00
00
00
0
Transfer Payments
10
00
00
010
Support Services
154
00
00
52
206
Capital Charges
00
00
00
0
Gross Expenditure
2,865
0(10)
(95)
15
189
2,964
Service Level Agreement Recharges
(2,866)
0(99)
00
0(2,965)
Income
Internal Recharge Income
00
00
00
0
Government Grants
00
00
00
0
Reimbursements & Contributions
00
00
00
0
Customer & Client Receipts
00
00
00
0
Interest & Other
00
00
00
0
Use of Balances & Reserves
00
00
00
0
Gross Income
00
00
00
0
Net Expenditure/ (Income)
(1)
0(109)
(95)
15
189
(1)
Explanation of major items above
£000
FTE
Net Efficiencies and Growth arising from the Medium Term Financial Strategy
(80)
nil
The redirected resources and other variations arise from the following:
Pensions
5nil
SLA movements
159
nil
Virement for Corporate Subscriptions
25
nil
Transfer of Insurance budget for inclusion within the SLA model
(10)
nil
Reduced Corporate & Democratic Core costs to Central Items
(99)
nil
Total
0nil
To provide a comprehensive range of services to support all councillors in their executive, scrutiny and representative roles. These services include secretarial, research,
information and policy support. The estimates also include budgets for major corporate subscriptions such as local government associations. All expenditure is recharged to teh
Corporate & Democratic Core to comply with the Best Value Accounting Code of Practice.
FINANCE & CORPORATE SERVICES DEPARTMENT
COUNCILLORS SERVICES
~ 7
7 ~
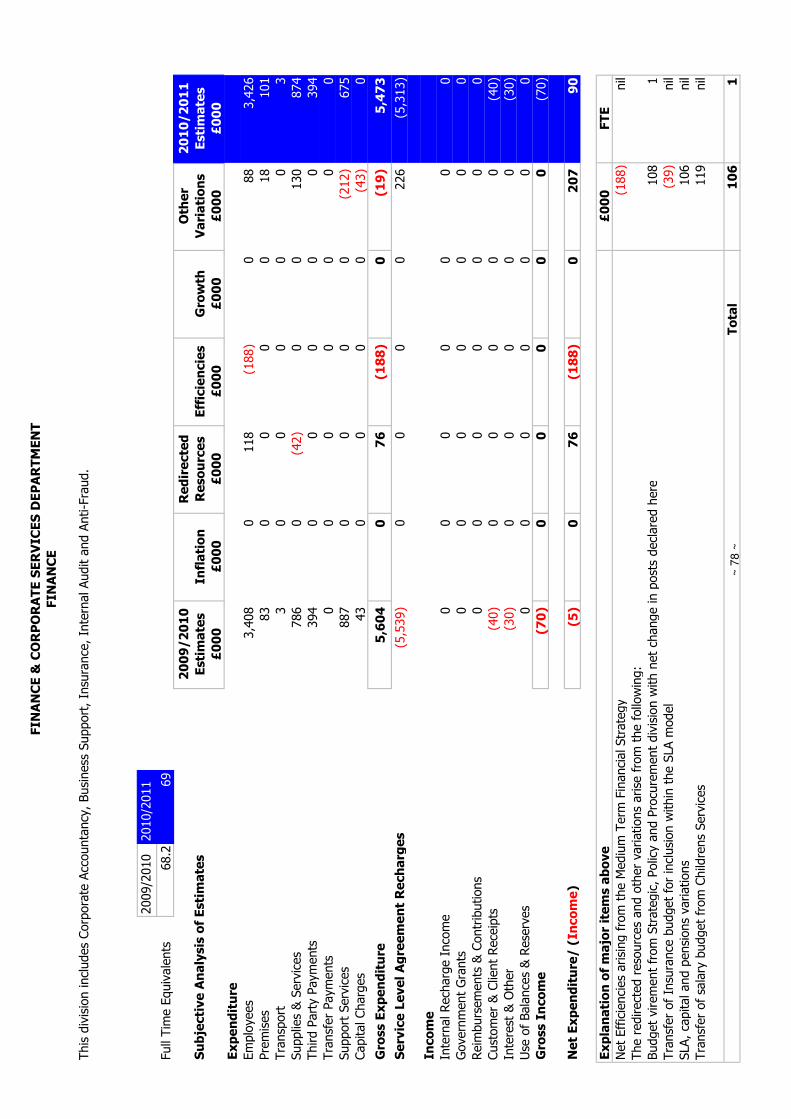
2009/2010
2010/2011
Full Time Equivalents
68.2
69
Subjective Analysis of Estimates
2009/2010
Estimates
£000
Inflation
£000
Redirected
Resources
£000
Efficiencies
£000
Growth
£000
Other
Variations
£000
2010/2011
Estimates
£000
Expenditure
Employees
3,408
0118
(188)
088
3,426
Premises
83
00
00
18
101
Transport
30
00
00
3
Supplies & Services
786
0(42)
00
130
874
Third Party Payments
394
00
00
0394
Transfer Payments
00
00
00
0
Support Services
887
00
00
(212)
675
Capital Charges
43
00
00
(43)
0
Gross Expenditure
5,604
076
(188)
0(19)
5,473
Service Level Agreement Recharges
(5,539)
00
00
226
(5,313)
Income
Internal Recharge Income
00
00
00
0
Government Grants
00
00
00
0
Reimbursements & Contributions
00
00
00
0
Customer & Client Receipts
(40)
00
00
0(40)
Interest & Other
(30)
00
00
0(30)
Use of Balances & Reserves
00
00
00
0
Gross Income
(70)
00
00
0(70)
Net Expenditure/ (Income)
(5)
076
(188)
0207
90
Explanation of major items above
£000
FTE
Net Efficiencies arising from the Medium Term Financial Strategy
(188)
nil
The redirected resources and other variations arise from the following:
Budget virement from Strategic, Policy and Procurement division with net change in posts declared here
108
1
Transfer of Insurance budget for inclusion within the SLA model
(39)
nil
SLA, capital and pensions variations
106
nil
Transfer of salary budget from Childrens Services
119
nil
Total
106
1
This division includes Corporate Accountancy, Business Support, Insurance, Internal Audit and Anti-Fraud.
FINANCE & CORPORATE SERVICES DEPARTMENT
FINANCE
~ 7
8 ~

2009/2010
2010/2011
Full Time Equivalents
10
11
Subjective Analysis of Estimates
2009/2010
Estimates
£000
Inflation
£000
Redirected
Resources
£000
Efficiencies
£000
Growth
£000
Other
Variations
£000
2010/2011
Estimates
£000
Expenditure
Employees
538
0(1)
00
104
641
Premises
104
00
00
(43)
61
Transport
40
00
00
4
Supplies & Services
1,027
220
00
(202)
847
Third Party Payments
15,418
153
44
0350
182
16,147
Transfer Payments
00
00
00
0
Support Services
(1,053)
01,055
00
46
Capital Charges
439
00
00
(230)
209
Gross Expenditure
16,477
155
1,118
0350
(185)
17,915
Service Level Agreement Recharges
(15,511)
00
00
(1,634)
(17,145)
Income
Internal Recharge Income
00
00
00
0
Government Grants
00
00
00
0
Reimbursements & Contributions
(1)
00
00
0(1)
Customer & Client Receipts
(984)
00
00
0(984)
Interest & Other
00
00
00
0
Use of Balances & Reserves
00
00
00
0
Gross Income
(985)
00
00
0(985)
Net Expenditure/ (Income)
(19)
155
1,118
0350
(1,819)
(215)
Explanation of major items above
£000
FTE
MTFS Growth
350
nil
The redirected resources and other variations arise from the following:
Pensions
7nil
SLA movements
(575)
nil
Programme Management Officer Post
97
1
Changes to Capital Financing charges
(230)
nil
Total
(351)
1
The division includes Information Management, Contract Monitoring of the Bridge Partnership and the Project Management Office.
FINANCE & CORPORATE SERVICES DEPARTMENT
BUSINESS TECHNOLOGY & BRIDGE PARTNERSHIP
~ 7
9 ~

2009/2010
2010/2011
Full Time Equivalents
18
15.6
Subjective Analysis of Estimates
2009/2010
Estimates
£000
Inflation
£000
Redirected
Resources
£000
Efficiencies
£000
Growth
£000
Other
Variations
£000
2010/2011
Estimates
£000
Expenditure
Employees
1,087
00
00
(53)
1,034
Premises
38
00
00
(10)
28
Transport
40
00
00
4
Supplies & Services
536
0(8)
(20)
083
591
Third Party Payments
00
00
00
0
Transfer Payments
00
00
00
0
Support Services
(97)
0109
00
226
238
Capital Charges
287
00
00
(196)
91
Gross Expenditure
1,855
0101
(20)
050
1,986
Service Level Agreement Recharges
(1,831)
00
00
18
(1,813)
Income
Internal Recharge Income
00
00
00
0
Government Grants
00
00
00
0
Reimbursements & Contributions
00
00
00
0
Customer & Client Receipts
(24)
00
00
0(24)
Interest & Other
00
00
00
0
Use of Balances & Reserves
00
00
00
0
Gross Income
(24)
00
00
0(24)
Net Expenditure/ (Income)
00
101
(20)
068
149
Explanation of major items above
£000
FTE
Net Efficiencies arising from the Medium Term Financial Strategy
(20)
nil
Budget virement to Finance with transfer of posts
(108)
(2)
The redirected resources and other variations arise from the following:
Pensions
8nil
SLA movements
382
nil
Capital financing
(196)
nil
Area Based Grant movement
83
nil
Total
149
(2)
This division provides policy support and advice to councillors and chief officers, particularly in strategic, legislative and corporate issues. It is responsible for relations with the
health seector and manages the Council's market testing and procurement programmes.
FINANCE & CORPORATE SERVICES DEPARTMENT
STRATEGY, POLICY & PROCUREMENT
~ 8
0 ~
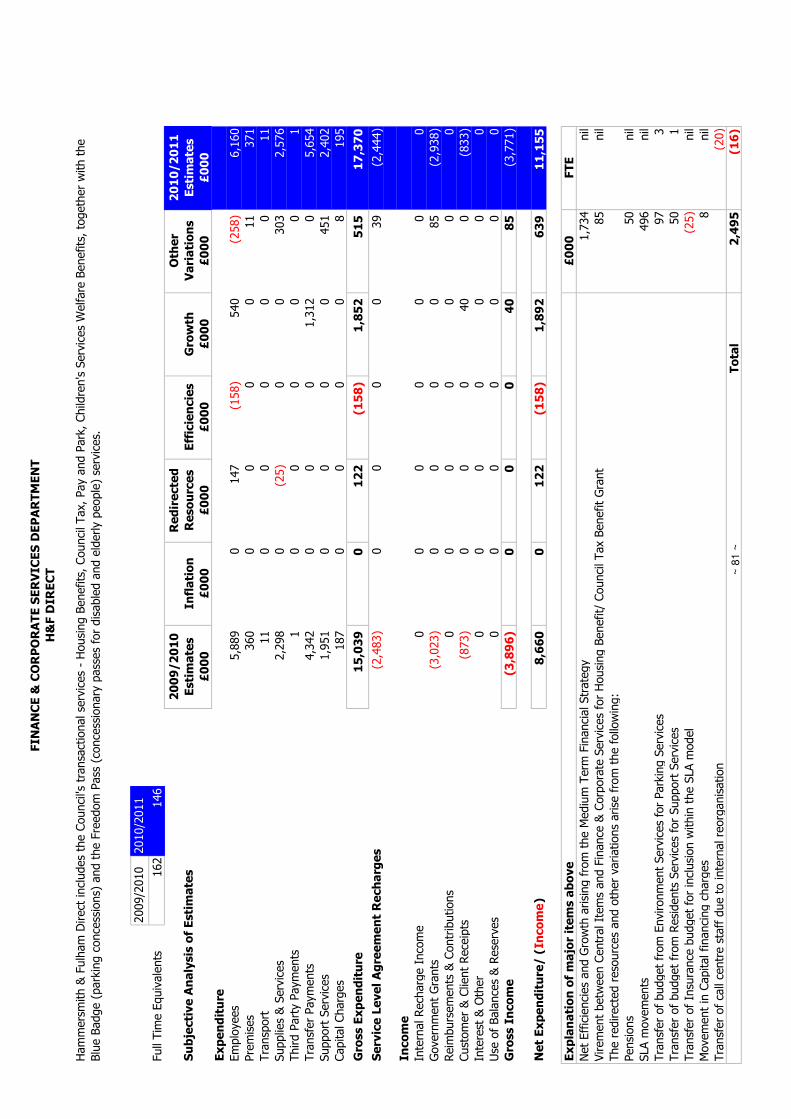
2009/2010
2010/2011
Full Time Equivalents
162
146
Subjective Analysis of Estimates
2009/2010
Estimates
£000
Inflation
£000
Redirected
Resources
£000
Efficiencies
£000
Growth
£000
Other
Variations
£000
2010/2011
Estimates
£000
Expenditure
Employees
5,889
0147
(158)
540
(258)
6,160
Premises
360
00
00
11
371
Transport
11
00
00
011
Supplies & Services
2,298
0(25)
00
303
2,576
Third Party Payments
10
00
00
1
Transfer Payments
4,342
00
01,312
05,654
Support Services
1,951
00
00
451
2,402
Capital Charges
187
00
00
8195
Gross Expenditure
15,039
0122
(158)
1,852
515
17,370
Service Level Agreement Recharges
(2,483)
00
00
39
(2,444)
Income
Internal Recharge Income
00
00
00
0
Government Grants
(3,023)
00
00
85
(2,938)
Reimbursements & Contributions
00
00
00
0
Customer & Client Receipts
(873)
00
040
0(833)
Interest & Other
00
00
00
0
Use of Balances & Reserves
00
00
00
0
Gross Income
(3,896)
00
040
85
(3,771)
Net Expenditure/ (Income)
8,660
0122
(158)
1,892
639
11,155
Explanation of major items above
£000
FTE
Net Efficiencies and Growth arising from the Medium Term Financial Strategy
1,734
nil
Virement between Central Items and Finance & Corporate Services for Housing Benefit/ Council Tax Benefit Grant
85
nil
The redirected resources and other variations arise from the following:
Pensions
50
nil
SLA movements
496
nil
Transfer of budget from Environment Services for Parking Services
97
3
Transfer of budget from Residents Services for Support Services
50
1
Transfer of Insurance budget for inclusion within the SLA model
(25)
nil
Movement in Capital financing charges
8nil
Transfer of call centre staff due to internal reorganisation
(20)
Total
2,495
(16)
Hammersmith & Fulham Direct includes the Council's transactional services - Housing Benefits, Council Tax, Pay and Park, Children's Services Welfare Benefits, together with the
Blue Badge (parking concessions) and the Freedom Pass (concessionary passes for disabled and elderly people) services.
FINANCE & CORPORATE SERVICES DEPARTMENT
H&F DIRECT ~
81
~

2009/2010
2010/2011
Full Time Equivalents
19
11
Subjective Analysis of Estimates
2009/2010
Estimates
£000
Inflation
£000
Redirected
Resources
£000
Efficiencies
£000
Growth
£000
Other
Variations
£000
2010/2011
Estimates
£000
Expenditure
Employees
1,493
0(68)
(68)
0(470)
887
Premises
57
00
00
360
Transport
00
00
00
0
Supplies & Services
129
066
00
(31)
164
Third Party Payments
00
00
00
0
Transfer Payments
00
00
00
0
Support Services
71
(24)
47
Capital Charges
00
00
00
0
Gross Expenditure
1,750
0(2)
(68)
0(522)
1,158
Service Level Agreement Recharges
(1,699)
592
(1,107)
Income
Internal Recharge Income
00
00
00
0
Government Grants
00
00
00
0
Reimbursements & Contributions
00
00
00
0
Customer & Client Receipts
(52)
00
00
0(52)
Interest & Other
00
00
00
0
Use of Balances & Reserves
00
00
00
0
Gross Income
(52)
00
00
0(52)
Net Expenditure/ (Income)
(1)
0(2)
(68)
070
(1)
Explanation of major items above
£000
FTE
Net Efficiencies arising from the Medium Term Financial Strategy
(68)
nil
The redirected resources and other variations arise from the following:
nil
Pensions
1nil
Budget Virement to Childrens' Services for relationship managers
(196)
(3)
Budget Virement to Childrens' Services and Community Services for training budgets
(275)
(5)
SLA movements
538
nil
Total
0(8)
To improve the overall effectiveness of Hammersmith & Fulham council and its ability to respond to an evolving environment. By doing this, we can ensure that staff satisfaction
is improved, productivity is increased, customers receive an excellent and individual experience and ensure that we are positively contributing to our council-wide ambitions.
FINANCE & CORPORATE SERVICES DEPARTMENT
ORGANISATIONAL DEVELOPMENT
~ 8
2 ~

~ 83 ~
Description of service This budget covers corporate financial costs and income. This includes management of borrowings, pensions administration, the corporate and democratic core, levy payments, external audit function and housing & council tax benefit payments. The Corporate & Democratic Core is set out by CIPFA and constitutes the following two strands: Democratic Representation & Management – this relates to policy-making and all Member related activities including their support and advice costs. Corporate Management – this relates to the general running of a Council and the provision of an infrastructure that allows services to be provided. Statement of Core Business The staff who work manage these costs and income largely report within the Finance & Corporate Services Department. However, the items in this department are collated here to facilitate clearer accounting. The remit is to:
• Manage borrowings by anticipating fiscal and money market changes and maximising the opportunity presented by these to meet the council’s needs based on the Medium-Term financial plan
• Monitoring the return on the pension fund and ensuring that it is able to meet future obligations based on current actuarial projections
• Managing the costs of the Corporate & Democratic Core whilst ensuring that customer satisfaction and needs are met.
• Monitoring and influencing the cost of levies • Managing the audit regime for both grants audits and the final Statement of Accounts
• Properly pay Housing & Council Tax benefits based on a thorough understanding of benefit claimants’ needs and current legislation and minimise the net cost, after subsidy, to the Council.
Prime objectives of the department
• Driving forward the Medium Term Financial Strategy as it applies to the area • To ensure that the pension fund accounting arrangements and level of funding is
adequate to meet current and future obligations • Holding budget managers for the Corporate & Democratic Core to account for their costs
and benchmarking this against similar London Boroughs
• Understanding the cost drivers for levies and working in partnership with other London Boroughs where applicable to drive these costs down
• Continuously improving the audit regime and driving down costs for both grants audits and the final Statement of Accounts
• Continuous improvement in Housing & Council Tax benefits processing and accuracy
CENTRAL ITEMS

~ 84 ~

2010/2011 ESTIMATES
CENTRAL ITEMS
~ 85 ~

18 19 20
Service Area Analysis
2009/2010
Estimates
£000
Inflation
£000
Redirected
Resources
£000
Efficiencies
£000
Growth
£000
Other
Adjustments
£000
2010/2011
Estimates
£000
Corporate & Democratic
Core7,908 0 71 (60) 0 (785) 7,134
Levies 1,989 0 0 0 318 0 2,307
Pensions 2,916 0 0 0 1,000 (1,000) 2,916
Housing & Council Tax
Benefits869 0 0 (250) 0 0 619
Net Cost of Borrowing 9,070 0 (284) (877) 0 (258) 7,651
Miscellaneous Items 7,055 0 1,147 (270) 1,586 (3,271) 6,249
TOTAL 29,807 0 934 (1,457) 2,904 (5,314) 26,876
CENTRAL ITEMS
CHANGE BETWEEN YEARS
~ 86 ~

2009/2010
2010/2011
Number of Full Time Equivalent staff
00
SUBJECTIVE ANALYSIS OF ESTIM
ATES
2009/2010
Estimates
£000
Inflation
£000
Redirected
Resources
£000
Efficiencies
£000
Growth
£000
Other
Variations
£000
2010/2011
Estimates
£000
Expenditure
Employee Expenses
2,916
00
01,000
(999)
2,917
Premises Related Expenditure
2,430
00
00
(2,098)
332
Transport Related Expenditure
00
00
00
0
Supplies and Services
8,353
01,162
(60)
1,586
(1,880)
9,161
Third Party Payments
1,989
00
0318
02,307
Transfer Payments
151,156
00
00
2,258
153,414
Support Services
9,305
071
00
(657)
8,721
Capital Charges
33,156
0(12)
00
(536)
32,608
GROSS EXPENDITURE
209,305
01,221
(60)
2,904
(3,912)
209,460
Service Level Agreement Recharges
(4,272)
00
00
(115)
(4,386)
Income
Internal Recharge Income
(22,332)
0(272)
(877)
0(21)
(23,502)
Government Grants
(146,983)
00
(250)
0(415)
(147,648)
Other Reimbursements & Contributions
(5,354)
0(284)
00
(170)
(5,808)
Customer & Client Receipts
1,613
00
(120)
0(1,415)
78
Interest & Other
(3,097)
00
00
1,534
(1,563)
Use of Balances & Reserves
927
0269
(150)
0(801)
245
GROSS INCOME
(175,226)
0(287)
(1,397)
0(1,288)
(178,199)
NET EXPENDITURE
29,807
0934
(1,457)
2,904
(5,314)
26,876
CE
NT
RA
L I
TE
MS
SU
MM
AR
Y
~ 8
7 ~
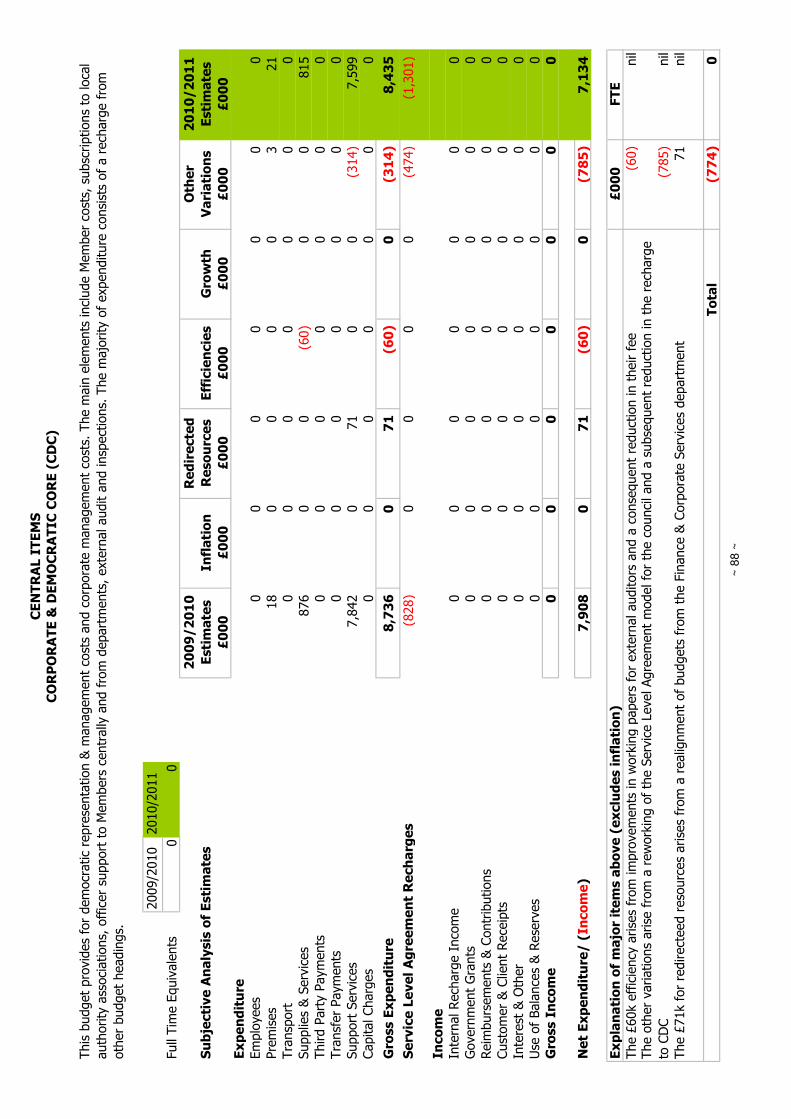
2009/2010
2010/2011
Full Time Equivalents
00
Subjective Analysis of Estimates
2009/2010
Estimates
£000
Inflation
£000
Redirected
Resources
£000
Efficiencies
£000
Growth
£000
Other
Variations
£000
2010/2011
Estimates
£000
Expenditure
Employees
00
00
00
0Premises
18
00
00
321
Transport
00
00
00
0Supplies & Services
876
00
(60)
00
815
Third Party Payments
00
00
00
0Transfer Payments
00
00
00
0Support Services
7,842
071
00
(314)
7,599
Capital Charges
00
00
00
0
Gross Expenditure
8,736
071
(60)
0(314)
8,435
Service Level Agreement Recharges
(828)
00
00
(474)
(1,301)
Income
Internal Recharge Income
00
00
00
0Government Grants
00
00
00
0Reimbursements & Contributions
00
00
00
0Customer & Client Receipts
00
00
00
0Interest & Other
00
00
00
0Use of Balances & Reserves
00
00
00
0Gross Income
00
00
00
0
Net Expenditure/ (Income)
7,908
071
(60)
0(785)
7,134
Explanation of major items above (excludes inflation)
£000
FTE
The £60k efficiency arises from improvements in working papers for external auditors and a consequent reduction in their fee
(60)
nil
(785)
nil
The £71k for redirecteed resources arises from a realignment of budgets from the Finance & Corporate Services department
71
nil
Total
(774)
0
This budget provides for democratic representation & management costs and corporate management costs. The main elements include Member costs, subscriptions to local
authority associations, officer support to Members centrally and from departments, external audit and inspections. The majority of expenditure consists of a recharge from
other budget headings.
CENTRAL ITEMS
CORPORATE & DEMOCRATIC CORE (CDC)
The other variations arise from a reworking of the Service Level Agreement model for the council and a subsequent reduction in the recharge
to CDC
~ 8
8 ~

2009/2010
2010/2011
Full Time Equivalents
00
Subjective Analysis of Estimates
2009/2010
Estimates
£000
Inflation
£000
Redirected
Resources
£000
Efficiencies
£000
Growth
£000
Other
Variations
£000
2010/2011
Estimates
£000
Expenditure
Employees
00
00
00
0Premises
00
00
00
0Transport
00
00
00
0Supplies & Services
00
00
00
0Third Party Payments
1,989
00
0318
02,307
Transfer Payments
00
00
00
0Support Services
00
00
00
0Capital Charges
00
00
00
0
Gross Expenditure
1,989
00
0318
02,307
Service Level Agreement Recharges
00
00
00
0
Income
Internal Recharge Income
00
00
00
0Government Grants
00
00
00
0Reimbursements & Contributions
00
00
00
0Customer & Client Receipts
00
00
00
0Interest & Other
00
00
00
0Use of Balances & Reserves
00
00
00
0Gross Income
00
00
00
0
Net Expenditure/ (Income)
1,989
00
0318
02,307
Explanation of major items above (excludes inflation)
£000
FTE
The £318k growth item arises from an increased levy to the London Pensions Fund Authority
318
nil
Total
318
0
The council pays levies to various third parties including the London Pension Fund Authority, the Environment Agency, Lee Valley Park and the Financial Reporting Council.
CENTRAL ITEMS
LEVIES
~ 8
9 ~

2009/2010
2010/2011
Full Time Equivalents
00
Subjective Analysis of Estimates
2009/2010
Estimates
£000
Inflation
£000
Redirected
Resources
£000
Efficiencies
£000
Growth
£000
Other
Variations
£000
2010/2011
Estimates
£000
Expenditure
Employees
2,916
00
01,000
(1,000)
2,916
Premises
00
00
00
0Transport
00
00
00
0Supplies & Services
00
00
00
0Third Party Payments
00
00
00
0Transfer Payments
00
00
00
0Support Services
00
00
00
0Capital Charges
00
00
00
0
Gross Expenditure
2,916
00
01,000
(1,000)
2,916
Service Level Agreement Recharges
00
00
00
0
Income
Internal Recharge Income
00
00
00
0Government Grants
00
00
00
0Reimbursements & Contributions
00
00
00
0Customer & Client Receipts
00
00
00
0Interest & Other
00
00
00
0Use of Balances & Reserves
00
00
00
0Gross Income
00
00
00
0
Net Expenditure/ (Income)
2,916
00
01,000
(1,000)
2,916
Explanation of major items above (excludes inflation)
£000
FTE
No change
Total
00
This budget provides for the cost of 'added-years' that are payable to the pensions fund for early retirement
CENTRAL ITEMS
PENSIONS
~ 9
0 ~

2009/2010
2010/2011
Full Time Equivalents
00
Subjective Analysis of Estimates
2009/2010
Estimates
£000
Inflation
£000
Redirected
Resources
£000
Efficiencies
£000
Growth
£000
Other
Variations
£000
2010/2011
Estimates
£000
Expenditure
Employees
00
00
00
0Premises
00
00
00
0Transport
00
00
00
0Supplies & Services
00
00
00
0Third Party Payments
00
00
00
0Transfer Payments
150,983
00
00
2,258
153,241
Support Services
00
00
00
0Capital Charges
00
00
00
0
Gross Expenditure
150,983
00
00
2,258
153,241
Service Level Agreement Recharges
00
00
00
0
Income
Internal Recharge Income
00
00
00
0Government Grants
(146,983)
00
(250)
0(415)
(147,648)
Reimbursements & Contributions
(5,354)
00
00
(170)
(5,524)
Customer & Client Receipts
2,223
00
00
(1,673)
550
Interest & Other
00
00
00
0Use of Balances & Reserves
00
00
00
0Gross Income
(150,114)
00
(250)
0(2,258)
(152,622)
Net Expenditure/ (Income)
869
00
(250)
00
619
Explanation of major items above (excludes inflation)
£000
FTE
The efficiency of £250k arises from savings in the Housing Benefits and Council Tax Benefits administration.
(250)
nil
The other variations are budget movements to ensure that income and expenditure and reported in the correct way and sum to nil
Total
(250)
0
All payments of Housing and Council tax benefits as well as the grant receivable from the Department for Work & Pensions are recorded within this budget. The
administration of the Hammersmith & Fulham Tax Benefits are shown with H&F Direct within Finance & Corporate Services.
CENTRAL ITEMS
HOUSING & COUNCIL TAX BENEFITS
~ 9
1 ~

2009/2010
2010/2011
Full Time Equivalents
00
Subjective Analysis of Estimates
2009/2010
Estimates
£000
Inflation
£000
Redirected
Resources
£000
Efficiencies
£000
Growth
£000
Other
Variations
£000
2010/2011
Estimates
£000
Expenditure
Employees
00
00
00
0Premises
00
00
00
0Transport
00
00
00
0Supplies & Services
00
00
00
0Third Party Payments
00
00
00
0Transfer Payments
00
00
00
0Support Services
00
00
00
0Capital Charges
33,156
0(12)
00
(546)
32,598
Gross Expenditure
33,156
0(12)
00
(546)
32,598
Service Level Agreement Recharges
00
00
00
0
Income
Internal Recharge Income
(22,332)
0(272)
(877)
0(21)
(23,502)
Government Grants
00
00
00
0Reimbursements & Contributions
00
00
00
0Customer & Client Receipts
00
00
00
0Interest & Other
(1,754)
00
00
309
(1,445)
Use of Balances & Reserves
00
00
00
0Gross Income
(24,086)
0(272)
(877)
0288
(24,948)
Net Expenditure/ (Income)
9,070
0(284)
(877)
0(258)
7,651
Explanation of major items above (excludes inflation)
£000
FTE
Allocation of investment income from the Decent Neighbourhoods programme to fund Strategic Regeneration
(284)
nil
Efficiencies regarding the debt reduction strategy and loan restructuring
(877)
nil
Realignment of income target
(258)
nil
Total
(1,419)
0
This area encompasses the receipt and payment of interest on investment and loans, premiums and discounts and debt management expenses. It also includes the
estimates for the repayment of the Council's debt.
CENTRAL ITEMS
NET COST OF BORROWING
~ 9
2 ~

2009/2010
2010/2011
Full Time Equivalents
00
Subjective Analysis of Estimates
2009/2010
Estimates
£000
Inflation
£000
Redirected
Resources
£000
Efficiencies
£000
Growth
£000
Other
Variations
£000
2010/2011
Estimates
£000
Expenditure
Employees
00
00
01
1Premises
1,701
00
00
(1,390)
311
Transport
00
00
00
0Supplies & Services
7,206
01,162
01,586
(1,726)
8,228
Third Party Payments
00
00
00
0Transfer Payments
173
00
00
0173
Support Services
1,216
00
00
18
1,237
Capital Charges
00
00
010
10
Gross Expenditure
10,296
01,162
01,586
(3,087)
9,960
Service Level Agreement Recharges
(3,440)
00
00
359
(3,082)
Income
Internal Recharge Income
00
00
00
0Government Grants
00
00
00
0Reimbursements & Contributions
00
(284)
00
0(284)
Customer & Client Receipts
(610)
00
(120)
0258
(472)
Interest & Other
(118)
00
00
0(118)
Use of Balances & Reserves
927
0269
(150)
0(801)
245
Gross Income
199
0(15)
(270)
0(543)
(629)
Net Expenditure/ (Income)
7,055
01,147
(270)
1,586
(3,271)
6,249
Explanation of major items above (excludes inflation)
£000
FTE
1,147
nil
The efficiencies are for a Customer Experience inceom target and a reduction in contributions to the Insurance Fund
(270)
nil
A contingency amount set-aside for a potential grant reduction for Concessionary Fares
1,182
nil
The other variations arise mainly from a reworking of the council's SLA budgets, bringing them up-to-date for 2010-11
(2,867)
nil
Total
(808)
0
These budgets hold Service-Level Agreement balances, NNDR Discretionary Relief, Debt Management budgets and Contingencies
CENTRAL ITEMS
MISCELLANEOUS ITEMS
The redirected resources column mainly arises from a clawback of insurance budgets across the council and their incorporation within the
Service Level Agreement (SLA) model
~ 9
3 ~

Blank
~ 94 ~

~ 95 ~
Description of service The Housing Revenue Account (HRA) is a ring-fenced account within the Council’s General Fund and is required under statute to account separately for local authority housing provision. The account contains solely the costs arising from the management of the Council’s housing stock, funded by tenant rents and service charges, housing subsidy, leaseholder service charges and other housing-related income. Responsibility for delivering HRA services to tenants and leaseholders sits with a number of departments across the Council and with the Council’s arms-length management organisation H&F Homes. The ring-fence was introduced in Part IV of the Local Government and Housing Act 1989, and was designed to ensure that rents paid by local authority tenants accurately reflected the cost of associated services as well as exclusively funding those services. This ring-fence also means that rents cannot be used to subsidise Council Tax. The items that can be credited and debited to the HRA are prescribed by statute, and the Council has no general discretion to transfer items into and out of the HRA. Statement of Core Business H&F Homes is responsible for the management of the Council’s housing stock. This includes responsibility for providing a complete housing management service to estate residents, delivering the Decent Homes improvement programme, ensuring a responsive repairs service, and administering all rental income collection. Within the Council, the Housing Options division is responsible for the provision of temporary accommodation, preventing homelessness, developing an enhanced housing service and tackling overcrowding in the borough. The Housing Strategy division delivers the Council’s Housing Strategy with the intention of creating a “ladder of housing opportunity”. Safer Communities focuses on ensuring the Council’s housing estates are safe places to live, and the Regeneration division is delivering a major programme of estate renewal covering some of the most deprived areas in the borough. The HRA Budget The HRA continues to be under pressure as resources are constrained through Central Government’s rent restructuring and subsidy regime, which influences the level of resources available to the HRA. Key objectives for the medium term are:
• To further increase satisfaction levels by improving the services provided to Council tenants and leaseholders
• To maintain balances at a minimum of 4% of gross revenue expenditure • To generate sufficient efficiencies to allow significant investment in service
improvements in line with the Council’s priorities
• To bring performance on repairs and service charge collection in line with the best in London
• To maintain performance on rent collection at current top quartile levels
HOUSING REVENUE ACCOUNT

~ 96 ~

2010/2011 ESTIMATES
HOUSING REVENUE
ACCOUNT
~ 97 ~

Service Area Analysis
2009/2010
Estimates
£000
Inflation
£000
Redirected
Resources
£000
Efficiencies
£000
Growth
£000
Other
Adjustments
£000
2010/2011
Estimates
£000
HFH Management Fee 26,461 0 0 (2,582) 0 (210) 23,669
Managed Rents and
Charges(67,879) 0 0 0 0 1,700 (66,180)
Managed Repairs 16,450 0 0 (789) 0 (1,208) 14,453
Housing Options 683 0 0 (50) 0 (28) 605
Housing Strategy 426 0 0 (15) 0 (64) 348
Strategic Regeneration 0 0 0 (61) 0 61 0
Safer Neighbourhoods 1,002 0 0 (60) 0 (93) 849
Support Services 3,256 0 0 0 0 509 3,764
Holding Codes 0 0 0 0 0 152 152
Housing Subsidy (12,277) 0 0 0 0 (974) (13,250)
Capital Charges 34,730 0 0 0 0 1,286 36,016
Transfer from Reserves (2,852) 0 0 0 0 2,425 (426)
TOTAL 0 0 0 (3,557) 0 3,557 0
HOUSING REVENUE ACCOUNT
CHANGE BETWEEN YEARS
~ 98 ~

2009/2010
2010/2011
Number of Full Time Equivalent staff
68
58
SUBJECTIVE ANALYSIS OF ESTIMATES
2009/2010
Estimates
£000
Inflation
£000
Redirected
Resources
£000
Efficiencies
£000
Growth
£000
Other
Variations
£000
2010/2011
Estimates
£000
Expenditure
Employee Expenses
2,582
00
(166)
015
2,431
Premises Related Expenditure
24,396
00
(789)
0(4,094)
19,513
Transport Related Expenditure
34
00
00
(2)
32
Supplies and Services
2,026
00
00
532
2,558
Third Party Payments
26,551
00
(2,602)
0(222)
23,727
Transfer Payments
220
00
00
(56)
164
Support Services
1,248
00
00
(33)
1,215
Capital Charges
11,825
00
00
344
12,169
GROSS EXPENDITURE
68,882
00
(3,557)
0(3,516)
61,809
Service Level Agreement Recharges
(4)
00
00
0(4)
Income
Internal Recharge Income
00
00
0(45)
(45)
Government Grants
(12,758)
00
00
(685)
(13,443)
Other Reimbursements & Contributions
(7,374)
00
00
5,943
(1,431)
Customer & Client Receipts
(67,956)
00
00
(1,710)
(69,666)
Interest & Other
22,062
00
00
1,144
23,206
Use of Balances & Reserves
(2,852)
00
00
2,425
(427)
GROSS INCOME
(68,878)
00
00
7,072
(61,806)
NET EXPENDITURE
00
0(3,557)
03,557
0
HO
US
IN
G R
EV
EN
UE
AC
CO
UN
T
SU
MM
AR
Y
~ 9
9 ~

2009/2010
2010/2011
Full Time Equivalents
00
Subjective Analysis of Estimates
2009/2010
Estimates
£000
Inflation
£000
Redirected
Resources
£000
Efficiencies
£000
Growth
£000
Other
Variations
£000
2010/2011
Estimates
£000
Expenditure
Employees
00
00
00
0Premises
00
00
00
0Transport
00
00
00
0Supplies & Services
00
00
00
0Third Party Payments
26,461
00
(2,582)
0(210)
23,669
Transfer Payments
00
00
00
0Support Services
00
00
00
0Capital Charges
00
00
00
0
Gross Expenditure
26,461
00
(2,582)
0(210)
23,669
Service Level Agreement Recharges
00
00
00
0
Income
Internal Recharge Income
00
00
00
0Government Grants
00
00
00
0Reimbursements & Contributions
00
00
00
0Customer & Client Receipts
00
00
00
0Interest & Other
00
00
00
0Use of Balances & Reserves
00
00
00
0Gross Income
00
00
00
0
Net Expenditure/ (Income)
26,461
00
(2,582)
0(210)
23,669
Explanation of major items above
£000
FTE
Stepped efficiencies initiated in 2009/10
(1,629)
nil
Reduction in 2009/10 Invest to Save growth
(385)
nil
Review of support & finance functions
(150)
nil
Further Value for Money programme initiatives
(418)
nil
Centralisation of IT budgets; transferred to Support Services
(150)
nil
Other 2009/10 adjustments
(60)
nil
Total
(2,792)
nil
This budget shows the fee paid by the Council to Hammersmith & Fulham Homes (HFH) for managing its housing stock.
HOUSING REVENUE ACCOUNT
ALMO MANAGEMENT FEE
~ 1
00 ~

2009/2010
2010/2011
Full Time Equivalents
00
Subjective Analysis of Estimates
2009/2010
Estimates
£000
Inflation
£000
Redirected
Resources
£000
Efficiencies
£000
Growth
£000
Other
Variations
£000
2010/2011
Estimates
£000
Expenditure
Employees
00
00
00
0
Premises
00
00
00
0
Transport
00
00
00
0
Supplies & Services
00
00
00
0
Third Party Payments
00
00
00
0
Transfer Payments
190
00
00
(56)
134
Support Services
00
00
00
0
Capital Charges
00
00
00
0
Gross Expenditure
190
00
00
(56)
134
Service Level Agreement Recharges
00
00
00
0
Income
Internal Recharge Income
00
00
00
0
Government Grants
00
00
00
0
Reimbursements & Contributions
(778)
00
00
(158)
(937)
Customer & Client Receipts
(67,291)
00
00
1,914
(65,378)
Interest & Other
00
00
00
0
Use of Balances & Reserves
00
00
00
0
Gross Income
(68,069)
00
00
1,756
(66,315)
Net Expenditure/ (Income)
(67,879)
00
00
1,700
(66,181)
Explanation of major items above
£000
FTE
Increase in dwelling rents in line with Central Government's rent restructuring policy
(1,182)
nil
Inclusion of income from HAFFTRA tenants' levy
(150)
nil
Reduction in 2009/10 guideline rent increase from 6.2% to 3.1% as a result of Central Government's amending subsidy determ
ination
1,782
nil
Reduction in commercial rent budgets following deterioration in economic clim
ate
400
nil
Reduction in dwelling rents income due to increased voids as a result of the Decent Homes programme
500
nil
Reduction in Leaseholder Service Charges achievable
240
nil
Reduction in Sheltered Housing Income due to fall in Supporting People grant funding
170
nil
Other adjustments
(60)
nil
Total
1,700
nil
These budgets are m
anaged by H&F Homes on behalf of the Council. They include rents from tenants, commercial property rents, central heating charges and service charges
to leaseholders.
HOUSING REVENUE ACCOUNT
MANAGED RENTS & CHARGES
~ 1
01
~

2009/2010
2010/2011
Full Time Equivalents
00
Subjective Analysis of Estimates
2009/2010
Estimates
£000
Inflation
£000
Redirected
Resources
£000
Efficiencies
£000
Growth
£000
Other
Variations
£000
2010/2011
Estimates
£000
Expenditure
Employees
00
00
00
0Premises
22,878
00
(789)
0(7,707)
14,382
Transport
00
00
00
0Supplies & Services
31
00
00
41
72
Third Party Payments
00
00
00
0Transfer Payments
00
00
00
0Support Services
00
00
00
0Capital Charges
00
00
00
0
Gross Expenditure
22,909
00
(789)
0(7,666)
14,454
Service Level Agreement Recharges
00
00
00
0
Income
Internal Recharge Income
00
00
00
0Government Grants
00
00
00
0Reimbursements & Contributions
(6,458)
00
00
6,458
0Customer & Client Receipts
(1)
00
00
0(1)
Interest & Other
00
00
00
0Use of Balances & Reserves
00
00
00
0Gross Income
(6,459)
00
00
6,458
(1)
Net Expenditure/ (Income)
16,450
00
(789)
0(1,208)
14,453
Explanation of major items above
£000
FTE
Efficiencies on responsive repairs achieved through enhanced contractor management
(789)
nil
Additional capitalisation of repairs
(1,160)
nil
Reallocation of joint equipment budget to Housing Options within the HRA
(48)
nil
Total
(1,997)
nil
This represents the revenue repairs budget and is managed by H&F Homes on behalf of the Council. It includes reactive repairs, change of tenancy works, gas servicing,
communal repairs, lift maintenance and district heating repairs.
HOUSING REVENUE ACCOUNT
MANAGED REPAIRS
~ 1
02 ~

2009/2010
2010/2011
Full Time Equivalents
31
20
Subjective Analysis of Estimates
2009/2010
Estimates
£000
Inflation
£000
Redirected
Resources
£000
Efficiencies
£000
Growth
£000
Other
Variations
£000
2010/2011
Estimates
£000
Expenditure
Employees
1,138
00
(30)
0(288)
821
Premises
394
00
00
(118)
275
Transport
60
00
0(2)
4
Supplies & Services
110
00
00
4114
Third Party Payments
20
00
(20)
048
48
Transfer Payments
30
00
00
030
Support Services
00
00
00
0
Capital Charges
00
00
00
0
Gross Expenditure
1,698
00
(50)
0(356)
1,292
Service Level Agreement Recharges
00
00
00
0
Income
Internal Recharge Income
00
00
00
0
Government Grants
(419)
00
00
289
(130)
Reimbursements & Contributions
(92)
00
00
(12)
(104)
Customer & Client Receipts
(504)
00
00
51
(453)
Interest & Other
00
00
00
0
Use of Balances & Reserves
00
00
00
0
Gross Income
(1,015)
00
00
328
(687)
Net Expenditure/ (Income)
683
00
(50)
0(28)
605
Explanation of major items above
£000
FTE
Reorganisation of Home Buy Service
(107)
(4)
Efficiencies arising from staffing reorganisations and policy changes
(50)
(1)
Reallocation of joint equipment budget from Managed Repairs
48
nil
Reallocation of Right to Buy Technical Officers Fees from HFH Management Fee
39
nil
Reallocation of Executive Support budgets to Support Services
(8)
nil
Rehousing Occupancy Team funded by Overcrowding Grant
(170)/170
3
Term
ination of Housing Support contracts funded by Supporting People Grant
(370)/370
(9)
Total
(78)
(11)
This budget includes the m
anagement costs and rent income for Hostels and the HRA share of the Housing Management Division, together with the Homebuy Team which
focuses on assisting Council tenants or those on the waiting list, key workers and first time buyers living or working in the Borough to purchase a home.
HOUSING REVENUE ACCOUNT
HOUSING OPTIONS
~ 1
03 ~
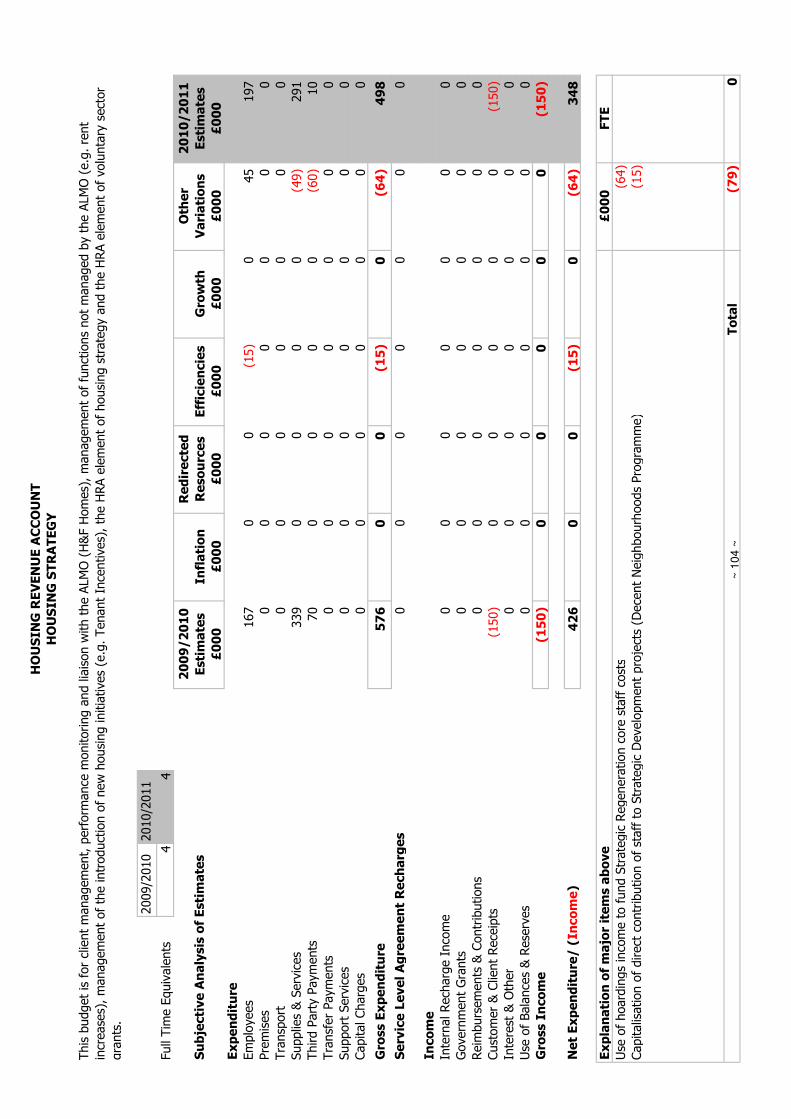
2009/2010
2010/2011
Full Time Equivalents
44
Subjective Analysis of Estimates
2009/2010
Estimates
£000
Inflation
£000
Redirected
Resources
£000
Efficiencies
£000
Growth
£000
Other
Variations
£000
2010/2011
Estimates
£000
Expenditure
Employees
167
00
(15)
045
197
Premises
00
00
00
0
Transport
00
00
00
0
Supplies & Services
339
00
00
(49)
291
Third Party Payments
70
00
00
(60)
10
Transfer Payments
00
00
00
0
Support Services
00
00
00
0
Capital Charges
00
00
00
0
Gross Expenditure
576
00
(15)
0(64)
498
Service Level Agreement Recharges
00
00
00
0
Income
Internal Recharge Income
00
00
00
0
Government Grants
00
00
00
0
Reimbursements & Contributions
00
00
00
0
Customer & Client Receipts
(150)
00
00
0(150)
Interest & Other
00
00
00
0
Use of Balances & Reserves
00
00
00
0
Gross Income
(150)
00
00
0(150)
Net Expenditure/ (Income)
426
00
(15)
0(64)
348
Explanation of major items above
£000
FTE
Use of hoardings income to fund Strategic Regeneration core staff costs
(64)
Capitalisation of direct contribution of staff to Strategic Development projects (Decent Neighbourhoods Programme)
(15)
Total
(79)
0
This budget is for client management, perform
ance m
onitoring and liaison with the ALMO (H&F Homes), management of functions not managed by the ALMO (e.g. rent
increases), management of the introduction of new housing initiatives (e.g. Tenant Incentives), the HRA element of housing strategy and the HRA element of voluntary sector
grants.
HOUSING REVENUE ACCOUNT
HOUSING STRATEGY
~ 1
04 ~

2009/2010
2010/2011
Full Time Equivalents
06
Subjective Analysis of Estimates
2009/2010
Estimates
£000
Inflation
£000
Redirected
Resources
£000
Efficiencies
£000
Growth
£000
Other
Variations
£000
2010/2011
Estimates
£000
Expenditure
Employees
00
0(61)
0406
345
Premises
00
00
00
0
Transport
00
00
00
0
Supplies & Services
00
00
00
0
Third Party Payments
00
00
00
0
Transfer Payments
00
00
00
0
Support Services
00
00
00
0
Capital Charges
00
00
00
0
Gross Expenditure
00
0(61)
0406
345
Service Level Agreement Recharges
00
00
00
0
Income
Internal Recharge Income
00
00
00
0
Government Grants
00
00
00
0
Reimbursements & Contributions
00
00
0(345)
(345)
Customer & Client Receipts
00
00
00
0
Interest & Other
00
00
00
0
Use of Balances & Reserves
00
00
00
0
Gross Income
00
00
0(345)
(345)
Net Expenditure/ (Income)
00
0(61)
061
0
Explanation of major items above
£000
FTE
Funding for core staff sourced from Section 106 funding agreements and use of hoardings rental income
406
6
Use of Section 106 funding
(345)
nil
Efficiency derived from funding core staff costs from external resources
(61)
nil
Total
06
The Strategic Regeneration team is responsible for the delivery and co-ordination of the Decent Neighbourhoods programme. This includes planning for the long term
future
of the Council's own housing stock especially in term
s of the quality and m
ix of the physical stock, tackling socio-economic deprivation, and the quality of estates as places for
people to live.
HOUSING REVENUE ACCOUNT
STRATEGIC REGENERATION
~ 1
05 ~

2009/2010
2010/2011
Full Time Equivalents
28
25
Subjective Analysis of Estimates
2009/2010
Estimates
£000
Inflation
£000
Redirected
Resources
£000
Efficiencies
£000
Growth
£000
Other
Variations
£000
2010/2011
Estimates
£000
Expenditure
Employees
978
00
(60)
0(93)
825
Premises
60
00
00
6
Transport
28
00
00
028
Supplies & Services
36
00
00
036
Third Party Payments
00
00
00
0
Transfer Payments
00
00
00
0
Support Services
00
00
00
0
Capital Charges
00
00
00
0
Gross Expenditure
1,048
00
(60)
0(93)
895
Service Level Agreement Recharges
00
00
00
0
Income
Internal Recharge Income
00
00
00
0
Government Grants
00
00
00
0
Reimbursements & Contributions
(46)
00
00
0(46)
Customer & Client Receipts
00
00
00
0
Interest & Other
00
00
00
0
Use of Balances & Reserves
00
00
00
0
Gross Income
(46)
00
00
0(46)
Net Expenditure/ (Income)
1,002
00
(60)
0(93)
849
Explanation of major items above
£000
FTE
Efficiency generated through restructuring of Wardens service
(60)
(1)
Deletion of 2 posts in 2009/10
(93)
(2)
Total
(153)
(3)
This budget is for the Anti Social Behaviour Unit and Estate W
ardens service, both of which are m
anaged by the Council.
HOUSING REVENUE ACCOUNT
SAFER NEIGHBOURHOODS
~ 1
06 ~

2009/2010
2010/2011
Full Time Equivalents
53
Subjective Analysis of Estimates
2009/2010
Estimates
£000
Inflation
£000
Redirected
Resources
£000
Efficiencies
£000
Growth
£000
Other
Variations
£000
2010/2011
Estimates
£000
Expenditure
Employees
299
00
00
(55)
244
Premises
212
00
00
61
273
Transport
00
00
00
0Supplies & Services
1,501
00
00
536
2,036
Third Party Payments
00
00
00
0Transfer Payments
00
00
00
0Support Services
1,248
00
00
(33)
1,215
Capital Charges
00
00
00
0
Gross Expenditure
3,260
00
00
509
3,768
Service Level Agreement Recharges
(4)
00
00
0(4)
Income
Internal Recharge Income
00
00
00
0Government Grants
00
00
00
0Reimbursements & Contributions
00
00
00
0Customer & Client Receipts
00
00
00
0Interest & Other
00
00
00
0Use of Balances & Reserves
00
00
00
0Gross Income
00
00
00
0
Net Expenditure/ (Income)
3,256
00
00
509
3,764
Explanation of major items above
£000
FTE
Transfer of senior management support costs to General Fund
(55)
(2)
Increase in corporate support recharges
100
nil
Increase in IT support costs (including transfer of H&F Homes IT support costs to Support Services)
464
nil
Total
509
(2)
This budget covers the cost of SLAs charged from central departments to the HRA and internal support services including accountancy, executive support and m
anagement.
HOUSING REVENUE ACCOUNT
SUPPORT SERVICES
~ 1
07 ~

2009/2010
2010/2011
Full Time Equivalents
00
Subjective Analysis of Estimates
2009/2010
Estimates
£000
Inflation
£000
Redirected
Resources
£000
Efficiencies
£000
Growth
£000
Other
Variations
£000
2010/2011
Estimates
£000
Expenditure
Employees
00
00
00
0
Premises
00
00
03,872
3,872
Transport
00
00
00
0
Supplies & Services
00
00
00
0
Third Party Payments
00
00
00
0
Transfer Payments
00
00
00
0
Support Services
00
00
00
0
Capital Charges
00
00
00
0
Gross Expenditure
00
00
03,872
3,872
Service Level Agreement Recharges
00
00
00
0
Income
Internal Recharge Income
00
00
0(45)
(45)
Government Grants
00
00
00
0
Reimbursements & Contributions
00
00
00
0
Customer & Client Receipts
00
00
0(3,675)
(3,675)
Interest & Other
00
00
00
0
Use of Balances & Reserves
00
00
00
0
Gross Income
00
00
0(3,720)
(3,720)
Net Expenditure/ (Income)
00
00
0152
152
Explanation of major items above
£000
FTE
Deficit of expenditure over income on W
ater Rates
152
nil
Total
152
nil
This part of the HRA holds the income and expenditure for tenants' water rates, tenants' insurances, tied accommodation.
HOUSING REVENUE ACCOUNT
HOLDING CODES
~ 1
08 ~

2009/2010
2010/2011
Full Time Equivalents
00
Subjective Analysis of Estimates
2009/2010
Estimates
£000
Inflation
£000
Redirected
Resources
£000
Efficiencies
£000
Growth
£000
Other
Variations
£000
2010/2011
Estimates
£000
Expenditure
Employees
00
00
00
0
Premises
00
00
00
0
Transport
00
00
00
0
Supplies & Services
00
00
00
0
Third Party Payments
00
00
00
0
Transfer Payments
00
00
00
0
Support Services
00
00
00
0
Capital Charges
00
00
00
0
Gross Expenditure
00
00
00
0
Service Level Agreement Recharges
00
00
00
0
Income
Internal Recharge Income
00
00
00
0
Government Grants
(12,277)
00
00
(974)
(13,250)
Reimbursements & Contributions
00
00
00
0
Customer & Client Receipts
00
00
00
0
Interest & Other
00
00
00
0
Use of Balances & Reserves
00
00
00
0
Gross Income
(12,277)
00
00
(974)
(13,250)
Net Expenditure/ (Income)
(12,277)
00
00
(974)
(13,250)
Explanation of major items above
£000
FTE
Net reduction in Management and Maintenance Allowances
29
nil
Increase in subsidy due to Guideline Rent reduction
(272)
nil
Increase in the Major Repairs Allowance
(344)
nil
Increase in subsidy due to changes to Capital Charges
(665)
nil
Decrease in subsidy due to expiry of leased properties
278
nil
Total
(974)
nil
HRA subsidy paid by central Government to support the provision of Social Housing at affordable rents.
HOUSING REVENUE ACCOUNT
HOUSING SUBSIDY
~ 1
09 ~

2009/2010
2010/2011
Full Time Equivalents
00
Subjective Analysis of Estimates
2009/2010
Estimates
£000
Inflation
£000
Redirected
Resources
£000
Efficiencies
£000
Growth
£000
Other
Variations
£000
2010/2011
Estimates
£000
Expenditure
Employees
00
00
00
0
Premises
906
00
00
(202)
703
Transport
00
00
00
0
Supplies & Services
90
00
00
9
Third Party Payments
00
00
00
0
Transfer Payments
00
00
00
0
Support Services
00
00
00
0
Capital Charges
11,825
00
00
344
12,169
Gross Expenditure
12,740
00
00
142
12,881
Service Level Agreement Recharges
00
00
00
0
Income
Internal Recharge Income
00
00
00
0
Government Grants
(62)
00
00
0(62)
Reimbursements & Contributions
00
00
00
0
Customer & Client Receipts
(10)
00
00
0(10)
Interest & Other
22,062
00
00
1,144
23,206
Use of Balances & Reserves
00
00
00
0
Gross Income
21,990
00
00
1,144
23,134
Net Expenditure/ (Income)
34,730
00
00
1,286
36,016
Explanation of major items above
£000
FTE
Reduction in payments due to expiry of select 20 year lease agreements
(301)
nil
Increase in Major Repairs Allowance for Depreciation Charge
344
nil
Increase in capital financing costs due to increases in interest rates and borrowing
1,124
nil
Net reduction in capital charges on premiums & discounts
(424)
nil
Reduction in interest receivable on balances
444
nil
Reduction in income from capitalisation of technical officer fees related to reduction in Right to Buy completions
99
nil
Total
1,286
nil
Capital financing costs incurred by the HRA in relation to capital expenditure, including the Decent Homes programme.
HOUSING REVENUE ACCOUNT
CAPITAL CHARGES
~ 1
10 ~

GENERAL FUND
2010/2011 CAPITAL
PROGRAMME
~ 111 ~

GE
NE
RA
L F
UN
D C
AP
ITA
L P
RO
GR
AM
ME
2010/1
1 T
O 2
014/1
5.
Ref
Sch
em
es (
Fu
nd
ing
Str
eam
in
Bra
cket)
Descri
pti
on
Pri
or
Year
Exp
en
dit
ure
2010/1
1
Bu
dg
et
2011/1
2
Bu
dg
et
2012/1
3
Bu
dg
et
2013/1
4
Bu
dg
et
2014/1
5
Bu
dg
et
To
tal F
utu
re
Exp
en
dit
ure
To
tal S
ch
em
e
Exp
en
dit
ure
£000's
£000's
£000's
£000's
£000's
£000's
£000's
£000's
Ch
ild
ren
's S
erv
ices C
ap
ital P
rog
ram
me.
CH
S1
Henry
Com
pto
n S
chool (M
ain
str
eam
Funded)
The c
onstr
uction o
f a n
ew
independent perf
orm
ing
art
s b
lock p
rovid
ing inte
rnally f
lexib
le p
erf
orm
ing a
rts
auditori
um
with a
pro
fessio
nal sta
ge lig
hting a
nd
audio
syste
m.
1,6
74
26
00
00
26
1,7
00
CH
S2
Devolv
ed F
orm
ula
Capital (G
overn
ment
Gra
nt)
Giv
es m
ain
tain
ed s
chools
dir
ect fu
ndin
g to h
elp
support
the c
apital needs o
f th
eir
buildin
gs. It is
initia
lly a
llocate
d to local education a
uth
ori
ties w
ho
are
then r
equir
ed to a
llocate
the f
undin
g d
irectly to
schools
.
10,5
76
1,3
68
00
00
1,3
68
11,9
44
CH
S3
Youth
Capital F
und (
Govern
ment G
rant)
This
Gra
nt, f
unded b
y the D
CS
F, has b
een
develo
ped to a
llow
young p
eople
betw
een 1
3-1
9
years
old
to a
pply
for
fundin
g to d
evelo
p p
roje
cts
that
incre
ase the n
um
ber
of
'pla
ces to g
o a
nd thin
gs to
do'.
176
88
00
00
88
264
CH
S4
Short
Bre
aks F
undin
g a
llocation
(Govern
ment G
rant)
This
capital gra
nt is
yet to
be a
llocate
d. It is to b
e
used to s
ecure
equip
ment, b
uildin
g a
dapta
tions, and
new
facilitie
s that w
ill support
dis
able
d c
hildre
n’s
short
bre
ak p
rovis
ion.
95
221
00
00
221
316
CH
S5
Pri
mary
Capital P
rogra
mm
e (
Govern
ment
Gra
nt)
This
capital gra
nt has b
een a
llocate
d to indiv
idual
schools
to im
pro
ve the f
acilitie
s o
n o
ffer.
Expenditure
on these p
rogra
mm
es a
re r
eport
ed o
n
an indiv
idual pro
ject basis
.
Rec'd
£2.5
m
in 0
9/1
05,5
37
00
00
5,5
37
5,5
37
CH
S6
Modern
isation G
rant (G
ivern
ment G
rant)
To im
pro
ve the infr
astr
uctu
re o
f th
e s
chool esta
te.
883
92
00
00
92
975
CH
S7
Exte
nded S
chools
(G
overn
ment G
rant)
This
support
s the d
evelo
pm
ent of
exte
nded s
chools
whic
h w
ill off
er
access to a
range o
f serv
ices f
or
childre
n, young p
eople
, th
eir
fam
ilie
s a
nd
com
munitie
s o
ften b
eyond the s
chool day
490
130
00
00
130
620
CH
S8
Earl
y Y
ears
and C
hild C
are
(G
overn
ment
Gra
nt)
To im
pro
ve the q
uality
of
the e
nvir
onm
ent in
earl
y
years
and c
hild c
are
settin
gs b
oth
to s
upport
hig
her
quality
experi
ence a
nd e
nsure
that all c
hildre
n c
an
access s
erv
ices.
1,0
57
1,2
63
00
00
1,2
63
2,3
20
CH
S9
Harn
essin
g T
echnolo
gy (
Govern
ment
Gra
nt)
To s
upport
schools
in d
eliveri
ng the p
riori
ties o
f th
e
govern
ment's H
arn
essin
g T
echnolo
gy s
trate
gy.
654
394
00
00
394
1,0
48
CH
S10
School E
xpansio
n P
lan (
S106/M
ain
str
eam
)E
xpansio
n o
f P
rim
ary
pla
ces in S
epte
mber
2009.
300
01,7
00
00
01,7
00
2,0
00
~ 1
12 ~

GE
NE
RA
L F
UN
D C
AP
ITA
L P
RO
GR
AM
ME
2010/1
1 T
O 2
014/1
5.
Ref
Sch
em
es (
Fu
nd
ing
Str
eam
in
Bra
cket)
Descri
pti
on
Pri
or
Year
Exp
en
dit
ure
2010/1
1
Bu
dg
et
2011/1
2
Bu
dg
et
2012/1
3
Bu
dg
et
2013/1
4
Bu
dg
et
2014/1
5
Bu
dg
et
To
tal F
utu
re
Exp
en
dit
ure
To
tal S
ch
em
e
Exp
en
dit
ure
£000's
£000's
£000's
£000's
£000's
£000's
£000's
£000's
Ch
ild
ren
's S
erv
ices C
ap
ital P
rog
ram
me.
CH
S11
LA
Basic
Needs (
Govern
ment G
rant)
LA
Basic
Needs
01,2
35
00
00
1,2
35
1,2
35
CH
S12
Schools
Access Initia
tive (
Govern
ment
Gra
nt)
Schools
Access In
itia
tive
0149
00
00
149
149
CH
S13
Locally C
oord
inate
d V
A P
rogra
mm
e
(Govern
ment G
rant)
Locally C
oord
inate
d V
A P
rogra
mm
e0
390
00
00
390
390
CH
S14
Buildin
g S
chools
for
the F
utu
re (
Pru
dential
Borr
ow
ing)
Pru
dential B
orr
ow
ing -
BS
F0
05,6
00
00
05,6
00
5,6
00
To
tal
15,9
05
10,8
93
7,3
00
00
018,1
93
34,0
98
Ch
ild
ren
's S
erv
ices F
inan
cin
g S
um
mary
Main
str
eam
26
1,2
50
00
01,2
76
Govern
ment G
rants
10,8
67
00
00
10,8
67
Section 1
06
0450
00
0450
Pru
dential B
orr
ow
ing
05,6
00
00
05,6
00
10,8
93
7,3
00
00
018,1
93
~ 1
13 ~

GE
NE
RA
L F
UN
D C
AP
ITA
L P
RO
GR
AM
ME
2010/1
1 T
O 2
014/1
5.
Ref
Sch
em
es (
Fu
nd
ing
Str
eam
in
Bra
cket)
Descri
pti
on
Pri
or
Year
Exp
en
dit
ure
2010/1
1
Bu
dg
et
2011/1
2
Bu
dg
et
2012/1
3
Bu
dg
et
2013/1
4
Bu
dg
et
2014/1
5
Bu
dg
et
To
tal
Fu
ture
Exp
en
dit
ur
e
To
tal
Sch
em
e
Exp
en
dit
ure
£000's
£000's
£000's
£000's
£000's
£000's
£000's
£000's
Co
mm
un
ity S
erv
ice
s C
ap
ita
l P
rog
ram
me
.
CS
D1
Socia
l E
nte
rprise L
egacy (
ND
C G
rant)
ND
C L
egacy P
roje
ct
1,8
26
1,1
90
00
00
1,1
90
3,0
16
CS
D2
Menta
l H
ealth S
CE
(G
overn
ment
Gra
nt)
To e
nable
adults w
ith m
enta
l health p
roble
ms t
o
reta
in w
ork
and t
o b
ett
er
access s
erv
ices a
nd
impro
ve o
pport
unitie
s f
or
socia
l part
icip
ation
15
124
00
00
124
139
CS
D3
Adult S
ocia
l C
are
SC
E (
Govern
ment
Gra
nt)
Genera
l C
apital E
xpenditure
on t
he a
dult s
ocia
l
care
cate
gory
- p
rogra
mm
e y
et
to b
e d
ete
rmin
ed
210
107
00
00
107
317
CS
D4
Sport
s a
nd H
ealth I
nitia
tive
(ND
C G
rant)
Constr
uct
a f
loodlit
art
ific
ial tu
rf f
acility a
t th
e
Lillie R
oad r
ecre
ation g
round,
as p
art
of
the
wid
er
refu
rbis
hm
ent
of
the p
ark
.
180
160
00
00
160
340
CS
D5
Socia
l C
are
IT
Infr
astr
uctu
re C
apital G
rant
(Govern
ment
Gra
nt)
To d
evelo
p I
T infr
astr
uctu
re in o
rder
to r
oll o
ut
the C
om
mon A
ssessm
ent
Fra
mew
ork
fro
m 2
011
125
68
00
00
68
193
CS
D6
Shepherd
s B
ush T
rain
ing C
entr
e
(ND
C
Gra
nt)
Shepherd
s B
ush T
rain
ing C
entr
e0
400
00
00
400
400
CS
D7
BE
C B
uildin
g
(ND
C G
rant)
Capital im
pro
vem
ent
to B
EC
Buildin
g0
100
00
00
100
100
CS
D8
Managem
ent
and A
dm
in
(ND
C G
rant)
Costs
incurr
ed a
s p
art
of
the N
DC
Capital
Pro
gra
mm
e0
21
00
00
21
21
To
tal
2,1
70
00
00
2,1
70
4,5
26
Co
mm
un
ity S
erv
ice
s F
ina
nc
ing
Su
mm
ary
Main
str
eam
00
00
00
Govern
ment
Gra
nts
299
00
00
299
ND
C G
rants
1,8
71
00
00
1,8
71
2,1
70
00
00
2,1
70
~ 1
14 ~

GE
NE
RA
L F
UN
D C
AP
ITA
L P
RO
GR
AM
ME
2010/1
1 T
O 2
014/1
5.
Ref
Sch
em
es (
Fu
nd
ing
Str
eam
in
Bra
cket)
Descri
pti
on
Pri
or
Year
Exp
en
dit
ure
2010/1
1
Bu
dg
et
2011/1
2
Bu
dg
et
2012/1
3
Bu
dg
et
2013/1
4
Bu
dg
et
2014/1
5
Bu
dg
et
To
tal
Fu
ture
Exp
en
dit
ure
To
tal
Sch
em
e
Exp
en
dit
ure
£000's
£000's
£000's
£000's
£000's
£000's
£000's
£000's
En
vir
on
me
nt
Se
rvic
es
Ca
pit
al
Pro
gra
mm
e.
EN
V1
Air
Pollution d
ispers
ion M
odel (O
ther)
08
00
00
88
EN
V2
Carr
iagew
ays (
Main
str
eam
)B
oro
ugh w
ide p
lanned m
ain
tenance o
f carr
iagew
ays.
Rollin
g
Pro
gra
mm
e:
£1.4
m in 0
9/1
0
1,3
50
1,3
50
1,3
50
1,3
50
1,3
50
Rollin
g
Pro
gra
mm
e
Rollin
g
Pro
gra
mm
e
EN
V3
Hig
hw
ays a
nd F
ootw
ays (
Revenue
Contr
ibutions)
Hig
hw
ays a
nd s
treetlig
hting Im
pro
vem
ents
715
1,0
00
1,0
00
1,0
00
1,0
00
1,0
00
5,0
00
5,7
15
EN
V4
Footw
ays (
Main
str
eam
)B
oro
ugh w
ide p
lanned m
ain
tenance o
f fo
otw
ays.
Rollin
g
Pro
gra
mm
e:
£0.8
m in 0
9/1
0
750
750
750
750
750
3,7
50
3,7
50
EN
V5
Repair
s t
o T
ham
es R
iver
Wall (
Main
str
eam
)R
epair
dam
age t
o r
iver
wall -
need t
o d
em
olish a
nd r
econstr
uct
105
327
00
00
327
432
EN
V6
Shepherd
s B
ush C
om
mon Im
pro
vem
ents
(S106)
Shepherd
s B
ush C
om
mon Im
pro
vem
ents
711
2,1
69
1,9
02
18
00
4,0
89
4,8
00
EN
V7
Norm
and P
ark
Develo
pm
ent
(S106)
The im
pro
vem
ent
of
Norm
and P
ark
is m
ajo
r pri
ori
ty f
or
resid
ents
of
the N
ort
h F
ulh
am
are
a a
nd t
he p
roje
ct
has b
een
identified a
s a
key f
lagship
regenera
tion p
roje
ct
within
the a
rea's
ND
C p
rogra
mm
e
2,9
17
20
00
02
2,9
19
EN
V8
54-1
08 U
xbri
dge R
oad -
Im
pro
vem
ent
(S106)
Gra
nt
support
for
impro
vem
ents
to n
ew
shop-f
ronts
, re
-
insta
tem
ent
of
ori
gin
al arc
hitectu
ral fe
atu
res a
nd o
ther
work
s.
103
1,0
39
00
00
1,0
39
1,1
42
EN
V9
Imperi
al W
harf
- T
raff
ic C
alm
ing (
S106)
Imperi
al W
harf
- T
raff
ic C
alm
ing
516
334
00
00
334
850
EN
V10
Pedestr
ian &
Cycle
1 (
S106)
Pedestr
ian &
Cycle
1142
109
00
00
109
251
EN
V11
Fulh
am
Pala
ce R
oad S
ubw
ay (
S106)
Fulh
am
Pala
ce R
oad S
ubw
ay
85
95
00
00
95
180
EN
V12
168-1
86 F
ulh
am
Pala
ce R
oad (
S106)
168-1
86 F
ulh
am
Pala
ce R
oad
085
00
00
85
85
EN
V13
Ham
mers
mith T
ow
n C
entr
e Im
pro
vem
ent
(S106)
Ham
mers
mith T
ow
n C
entr
e Im
pro
vem
ent
30
470
00
00
470
500
EN
V14
Ari
el W
ay T
raff
ic M
anagem
ent
Measure
s
(S106)
Ari
el W
ay T
raff
ic M
anagem
ent
Measure
s57
250
193
00
0443
500
EN
V15
Fulh
am
Road F
ootw
ays W
ork
s (
S106)
Fulh
am
Road F
ootw
ays W
ork
s0
110
00
00
110
110
EN
V16
Pla
nned M
ain
tenance (
Main
str
eam
)
This
is a
n a
nnual pro
gra
mm
e o
f w
ork
s t
o b
e c
arr
ied o
ut
to
council p
ropert
ies e
xclu
din
g H
ousin
g a
nd S
chools
. T
his
inclu
des t
he r
efu
rbis
hm
ent
or
the r
epla
cem
ent
of
pla
nt
and
equip
ment
to b
uildin
gs a
nd a
rises f
rom
buildin
g s
urv
eys
and
bid
s f
rom
depart
ments
.
Rollin
g
Pro
gra
mm
e:
£2.5
m in 0
9/1
0
2,5
00
2,5
00
2,5
00
2,5
00
2,5
00
Rollin
g
Pro
gra
mm
e
Rollin
g
Pro
gra
mm
e
~ 1
15 ~

GE
NE
RA
L F
UN
D C
AP
ITA
L P
RO
GR
AM
ME
2010/1
1 T
O 2
014/1
5.
Ref
Sch
em
es (
Fu
nd
ing
Str
eam
in
Bra
cket)
Descri
pti
on
Pri
or
Year
Exp
en
dit
ure
2010/1
1
Bu
dg
et
2011/1
2
Bu
dg
et
2012/1
3
Bu
dg
et
2013/1
4
Bu
dg
et
2014/1
5
Bu
dg
et
To
tal
Fu
ture
Exp
en
dit
ure
To
tal
Sch
em
e
Exp
en
dit
ure
£000's
£000's
£000's
£000's
£000's
£000's
£000's
£000's
En
vir
on
me
nt
Se
rvic
es
Ca
pit
al
Pro
gra
mm
e.
EN
V17
Dis
able
d A
ccess t
o O
ffic
e B
uildin
gs
(Main
str
eam
)
Makin
g C
ouncil B
uildin
gs a
ccessib
le in c
om
pliance w
ith
Dis
ability d
iscri
min
ation A
ct
1995.
Rollin
g
Pro
gra
mm
e:
£0.2
5m
in
09/1
0
250
250
250
250
250
Rollin
g
Pro
gra
mm
e
Rollin
g
Pro
gra
mm
e
EN
V18
Renovation G
rants
(M
ain
str
eam
)
Dis
cre
tionary
gra
nts
to c
arr
y o
ut
repair
s a
nd im
pro
vem
ent
work
s
to b
ring p
rivate
pro
pert
ies u
p t
o t
he d
ecent
hom
es s
tandard
, to
impro
ve/
repair
the c
om
mon p
art
s o
f buildin
gs c
onta
inin
g o
ne o
r
more
fla
ts a
nd t
o b
ring e
mpty
hom
es b
ack into
use
Rollin
g
Pro
gra
mm
e:
£0.4
5m
in
09/1
0
450
450
450
450
450
Rollin
g
Pro
gra
mm
e
Rollin
g
Pro
gra
mm
e
EN
V19
Corr
idors
(T
FL)
The h
igh level obje
ctive f
or
corr
idors
is t
o d
evelo
p h
olistic
schem
es f
or
key c
orr
idors
that
addre
ss issues r
ela
ting t
o t
he
sm
ooth
ing o
f tr
aff
ic f
low
, bus r
eliability,
safe
ty,
cycling (
inclu
din
g
park
ing),
public r
ealm
and r
em
oval of
clu
tter.
01,2
46
00
00
1,2
46
1,2
46
EN
V20
Neig
hbourh
oods (
TF
L)
The
hig
hle
velobje
ctive
for
neig
hbourh
oods
isto
carr
yout
local
are
aim
pro
vem
ents
and
als
ow
ork
on
Legib
leLondon,
share
d
space,
reduction
of
str
eet
clu
tter,
and
an
expansio
nof
ele
ctr
ic
charg
ing p
oin
ts.
0798
00
00
798
798
EN
V21
Sm
art
Tra
vel (T
FL)
Sm
art
Tra
vel
297
00
00
297
297
To
tal
13,6
39
8,3
95
6,3
18
6,3
00
6,3
00
23,5
83
En
vir
on
me
nt
Se
rvic
es
Fin
an
cin
g S
um
ma
ry
Main
str
eam
5,6
27
5,3
00
5,3
00
5,3
00
5,3
00
26,8
27
Tra
nsport
for
London
2,3
41
00
00
2,3
41
Section 1
06
4,6
63
2,0
95
18
00
6,7
76
Revenue C
ontr
ibutions
1,0
00
1,0
00
1,0
00
1,0
00
1,0
00
5,0
00
Oth
er
Gra
nts
& C
ontr
ibutions
80
00
08
13,6
39
8,3
95
6,3
18
6,3
00
6,3
00
40,9
52
~ 1
16 ~

GE
NE
RA
L F
UN
D C
AP
ITA
L P
RO
GR
AM
ME
2010/1
1 T
O 2
014/1
5.
Ref
Sch
em
es (
Fu
nd
ing
Str
eam
in
Bra
cket)
Pri
or
Year
Exp
en
dit
ure
2010/1
1
Bu
dg
et
2011/1
2
Bu
dg
et
2012/1
3
Bu
dg
et
2013/1
4
Bu
dg
et
2014/1
5
Bu
dg
et
To
tal
Fu
ture
Exp
en
dit
ure
To
tal
Sch
em
e
Co
st
£000's
£000's
£000's
£000's
£000's
£000's
£000's
£000's
Fin
an
ce
& C
orp
ora
te S
erv
ice
s C
ap
ita
l P
rog
ram
me
.
FC
S1
Sm
art
Work
ing (
Invest
to S
ave)
To d
eliver
the C
ouncil's
Sm
art
er
Work
ing
Pro
gra
mm
e361
223
00
00
223
584
FC
S2
IT I
nfr
astr
uctu
re (
Main
str
eam
Fundin
g)
IT I
nfr
astr
uctu
re
Rollin
g
Pro
gra
mm
e -
new
in 1
0/1
1
800
800
800
800
800
Rollin
g
Pro
gra
mm
e
Rollin
g
Pro
gra
mm
e
FC
S3
Contr
ibution t
o I
nvest
to S
ave F
und
(Main
str
eam
Fundin
g)
Contr
ibution t
o I
nvest
to S
ave F
und
Rollin
g
Pro
gra
mm
e -
new
in 1
0/1
1
750
750
750
750
750
Rollin
g
Pro
gra
mm
e
Rollin
g
Pro
gra
mm
e
To
tal
1,7
73
1,5
50
1,5
50
1,5
50
1,5
50
584
Fin
an
ce
& C
orp
ora
te S
erv
ice
s F
ina
nc
ing
Su
mm
ary
Main
str
eam
1,5
50
1,5
50
1,5
50
1,5
50
1,5
50
7,7
50
Invest
to S
ave F
und
223
00
00
223
1,7
73
1,5
50
1,5
50
1,5
50
1,5
50
7,9
73
~ 1
17 ~

GE
NE
RA
L F
UN
D C
AP
ITA
L P
RO
GR
AM
ME
2010/1
1 T
O 2
014/1
5.
Ref
Sch
em
es (
Fu
nd
ing
Str
eam
in
Bra
cket)
Descri
pti
on
Pri
or
Year
Exp
en
dit
ure
2010/1
1
Bu
dg
et
2011/1
2
Bu
dg
et
2012/1
3
Bu
dg
et
2013/1
4
Bu
dg
et
2014/1
5
Bu
dg
et
To
tal F
utu
re
Exp
en
dit
ure
To
tal
Sch
em
e
Co
st
£000's
£000's
£000's
£000's
£000's
£000's
£000's
£000's
Resid
en
ts S
erv
ices C
ap
ital P
rog
ram
me.
RS
D1
Ravenscourt
Park
(G
overn
ment G
rant)
Pro
vis
ion for
park
im
pro
vem
ents
96
250
00
00
250
346
RS
D2
Park
Investm
ents
(M
ain
str
eam
Fundin
g)
Expenditure
to im
pro
ve the p
ark
s.
Rollin
g
Pro
gra
mm
e -
new
in 1
0/1
1
500
500
500
500
500
Rollin
g
Pro
gra
mm
e
Rollin
g
Pro
gra
mm
e
RS
D3
Bis
hops P
ark
(S
tage 2
and 3
) (M
ain
str
eam
Fundin
g/G
overn
ment G
rant)
Bis
hops P
ark
(S
tage 2
and 3
)413
2,2
72
00
00
2,2
72
2,6
85
RS
D4
Safe
r C
om
munitie
s F
und (
Govern
ment
Gra
nt)
To d
eliver
crim
e a
nd d
isord
er
reduction
activitie
s a
nd a
ct again
st dru
gs m
isuse
152
91
00
00
91
243
RS
D5
Pla
y B
uilder
(Govern
ment G
rant)
Delivery
of 22 n
ew
natu
ral and
adventu
rous p
lay a
reas for
8-1
3 y
ear
old
s290
1,0
85
00
00
1,0
85
1,3
75
RS
D6
Waste
and R
ecycling E
ffic
iency (
Govern
ment
Gra
nt)
Waste
and R
ecycling E
ffic
iency
50
95
00
00
95
145
To
tal
4,2
93
500
500
500
500
4,7
94
Resid
en
ts S
erv
ices F
inan
cin
g S
um
mary
Main
str
eam
2,8
52
500
500
500
500
4,8
52
TF
L G
rant
50
00
00
50
DE
FR
A95
00
00
95
Crim
inal Justice Inte
rvention G
rant
91
00
00
91
Depart
ment fo
r C
hildre
ns,S
chools
and
Fam
ilie
s1,1
35
00
00
1,1
35
English H
erita
ge
65
00
00
65
Herita
ge for
London
50
00
05
4,2
93
500
500
500
500
6,2
93
~ 1
18 ~

DECENT
NEIGHBOURHOODS
2010/2011 CAPITAL
PROGRAMME
~ 119 ~

DE
CE
NT
NE
IGH
BO
UR
HO
OD
S C
AP
ITA
L P
RO
GR
AM
ME
2010/1
1 T
O 2
014/1
5
Ref
Sch
em
es
Descri
pti
on
Pri
or
Years
2010/1
1
Bu
dg
et
2011/1
2
Bu
dg
et
2012/1
3
Bu
dg
et
2013/1
4
Bu
dg
et
2014/1
5
Bu
dg
et
To
tal
Sch
em
e
Co
st
£000's
£000's
£000's
£000's
£000's
£000's
£000's
Decen
t N
eig
hb
ou
rho
od
s C
ap
ital P
rog
ram
me.
DN
C1
Decanting C
osts
/Mis
c.
Decanting o
f te
nants
and leasehold
ers
1,0
80
00
00
01,0
80
DN
C2
Sulg
rave G
ard
ens
Decanting o
f te
nants
and leasehold
ers
1,4
67
00
00
01,4
67
DN
C3
Wate
rmeadow
Court
Decanting o
f te
nants
and leasehold
ers
5,0
00
1,5
00
00
00
6,5
00
DN
C4
Pennard
Road
Land A
cquis
itio
n for
wid
er
regenera
tion
pro
gra
mm
e4,8
80
00
00
04,8
80
DN
C5
Fulh
am
Court
Fulh
am
Court
Esta
te Im
pro
vem
ent
Str
ate
gy: P
hase 1
Physic
al Im
pro
vem
ents
385
3,2
01
885
36
00
4,5
07
DN
C6
Tra
vellers
Site
Matc
h F
undin
g to R
BK
&C
to im
pro
ve the
Sta
ble
Way T
ravellers
Site
0125
00
00
125
DN
C7
Decent H
om
es (
genera
l)R
esourc
e T
ransfe
r fo
r D
ecent H
om
es
Pro
gra
mm
e.
2,9
46
2,0
00
00
00
4,9
46
DN
C8
Pooling C
osts
Pro
vis
ion for
Pooling p
aym
ent to
Depart
ment fo
r C
om
munitie
s a
nd L
ocal
Govern
ment.
600
00
00
0600
To
tal
16,3
58
6,8
26
885
36
00
24,1
05
~ 1
20 ~

HOUSING REVENUE
ACCOUNT
2010/2011 CAPITAL
PROGRAMME
~ 121 ~

Ho
usin
g R
even
ue A
cco
un
t (H
RA
) C
ap
ital P
rog
ram
me 2
010/1
1 t
o 2
014/1
5 b
y S
ch
em
e
Sch
em
es
DE
SC
RIP
TIO
N
2010/1
1 2
011/1
2 2
012/1
3 2
013/1
42014/1
5T
ota
l F
utu
re
Exp
en
dit
ure
£ '000
£ '000
£ '000
£ '000
£ '000
£ '000
SU
PP
LY
IN
ITIA
TIV
ES
: M
AJO
R V
OID
S
Decent H
om
es V
oid
s
Inte
r nal re
furb
ishm
ent of
void
pro
pert
ies to d
ecent hom
es
sta
ndard
1,2
43
01,7
68
00
3,0
11
INT
ER
NA
L C
OM
PO
NE
NT
RE
NE
WA
L
Energ
y S
chem
es
Insta
llation a
nd im
pro
vem
ents
to c
entr
al heating s
yste
ms.
790
510
600
600
600
3,1
00
Lift S
chem
es
Modern
isation a
nd r
epair
s to lifts
604
570
1,0
00
1,5
00
1,5
00
5,1
74
To
tal In
tern
al C
om
po
nen
t R
en
ew
al
1,3
94
1,0
80
1,6
00
2,1
00
2,1
00
8,2
74
MA
JO
R R
EF
UR
BIS
HM
EN
TS
Edw
ard
Woods -
Regenera
tion P
roje
ct
Overc
laddin
g a
nd a
ssocia
ted w
ork
s to 3
tow
er
blo
cks a
t
Edw
ard
Woods E
sta
te a
nd p
rovis
ion o
f C
ontr
olled P
ark
ing
Zones.
9,6
01
2,0
00
403
00
12,0
04
Capitalised R
epair
s
Responsiv
e r
epair
s o
f a c
apital natu
re
942
500
00
01,4
42
To
tal M
ajo
r R
efu
rbis
hem
en
ts10,5
43
2,5
00
403
00
13,4
46
PL
AN
NE
D M
AIN
TE
NA
NC
E
Pre
venta
tive P
lanned M
ain
tenance
Cyclical pain
ting
and p
re-p
ain
t re
pair
s
1,4
50
2,5
00
2,3
36
9,1
29
9,1
29
24,5
44
MIN
OR
PR
OG
RA
MM
ES
Min
or
Pro
gra
mm
es
Im
pro
vem
ent to
esta
tes in r
espect of
the e
nvir
onm
ent,
com
munal w
ate
r ta
nks a
nd s
taff
costs
associa
ted w
ith m
ajo
r
capital w
ork
s.
3,4
43
870
570
570
570
6,0
23
PR
E P
AR
TN
ER
ING
SC
HE
ME
S
Flo
ra G
ard
ens,1
61-1
97
Exte
rnal re
furb
ishm
ent in
clu
din
g r
oofs
, w
indow
s a
nd d
oors
93
00
00
93
EX
PE
ND
ITU
RE
~ 1
22 ~

Sch
em
es
DE
SC
RIP
TIO
N
2010/1
1 2
011/1
2 2
012/1
3 2
013/1
42014/1
5T
ota
l F
utu
re
Exp
en
dit
ure
£ '000
£ '000
£ '000
£ '000
£ '000
£ '000
DE
CE
NT
HO
ME
S P
AR
TN
ER
ING
Fra
mew
ork
Are
a 1
- H
am
mers
mith
Nor t
h
Inte
rnal re
furb
ishm
ent a
nd e
xte
rnal re
furb
ishm
ent in
clu
din
g
doors
, w
indow
s a
nd r
oofs
969
00
00
969
Fra
mew
ork
Are
a 2
- S
hepherd
s B
ush
Inte
rnal re
furb
ishm
ent and e
xte
rnal re
furb
ishm
ent in
clu
din
g
doors
, w
indow
s a
nd r
oofs
. 2,2
91
00
00
2,2
91
Fra
mew
ork
Are
a 3
- H
am
mers
mith
Centr
al
Inte
rnal re
furb
ishm
ent and e
xte
rnal re
furb
ishm
ent in
clu
din
g
doors
, w
indow
s a
nd r
oofs
. 10,1
09
00
00
10,1
09
Fra
mew
ork
Are
a 4
- F
ulh
am
Nort
h
Inte
rnal re
furb
ishm
ent and e
xte
rnal re
furb
ishm
ent in
clu
din
g
doors
, w
indow
s a
nd r
oofs
. 19,7
70
2,1
38
00
021,9
08
Fra
mew
ork
Are
a 5
- F
ulh
am
Centr
al
Inte
rnal re
furb
ishm
ent and e
xte
rnal re
furb
ishm
ent in
clu
din
g
doors
, w
indow
s a
nd r
oofs
. 1,3
22
00
00
1,3
22
Fra
mew
ork
Are
a 6
- S
ands E
nd
Inte
rnal re
furb
ishm
ent and e
xte
rnal re
furb
ishm
ent in
clu
din
g
doors
, w
indow
s a
nd r
oofs
. 4,9
93
309
00
05,3
02
Fra
mew
ork
Are
a 7
- S
heltere
d H
ousin
g
Inte
rnal re
furb
ishm
ent and e
xte
rnal re
furb
ishm
ent in
clu
din
g
win
dow
s
1,7
34
00
00
1,7
34
Additio
nal D
ecent H
om
es E
xpenditure
E
xpenditure
incurr
ed o
n s
treet pro
pert
ies, sheltere
d
win
dow
s a
nd c
ontigency ite
ms
010,5
60
11,4
90
5,0
22
5,4
25
32,4
97
TO
TA
L D
EC
EN
T H
OM
ES
PA
RT
NE
RIN
G41,1
88
13,0
07
11,4
90
5,0
22
5,4
25
76,1
32
GR
AN
D T
OT
AL
H
RA
59,3
54
19,9
57
18,1
67
16,8
21
17,2
24
131,5
23
LB
HF
MA
NA
GE
D
0
CC
TV
Pro
gra
mm
e
Insta
llation o
f C
CT
V o
n C
ouncil E
sta
tes w
ithin
the B
oro
ugh
100
100
00
0200
Dis
able
d A
dapta
tions
Adapta
tions to c
ouncil-o
wned d
wellin
gs
800
800
800
800
800
4,0
00 0
To
tal H
RA
Cap
ital
60,2
54
20,8
57
18,9
67
17,6
21
18,0
24
135,7
23
EX
PE
ND
ITU
RE
~ 1
23 ~

blank
~ 124 ~

~ 125 ~
AREA BASED GRANT (ABG) A new general grant introduced in 2008-09 which replaced a number of specific grants that were paid by a range of government departments. Accounting policies require the grant income to be shown corporately. Expenditure is shown within departmental budgets. ACCOUNTING PERIOD
The timescale during which accounts are prepared. Local authority accounts have an overall accounting period of one year from 1st April to 31st March.
ARMS LENGTH MANAGEMENT ORGANISATION (ALMO) This is a company owned by the council and set up to deliver management services in relation to its housing stock. The council’s ALMO is called Hammersmith & Fulham Homes. BALANCES
The amount of money left over at the end of the year after allowing for all expenditure and income that has taken place. These are also known as financial reserves. BEST VALUE ACCOUNTING CODE OF PRACTICE (BVACOP)
BVACOP sets the financial reporting guidelines for local authorities. It supplements the principles and practice set out in the Code of Practice on Local Authority Accounting (known as the SORP), by establishing practice for consistent reporting. It provides guidance in three key areas
• The definition of total cost • Trading accounts • Service expenditure analysis
BUDGET This is a statement of planned spends for the year as aligned with council, local and national priorities CAPITAL EXPENDITURE Expenditure on the purchase, construction and enhancement of Council assets such as houses, offices, schools and roads. Expenditure can only be treated as ‘capital’ if it meets the statutory definitions and is in accordance with accounting practice and regulations. CIPFA Chartered Institute of Public Finance & Accountancy. CAPITAL FINANCING This term describes the method of financing capital expenditure, the principal methods now being loan financing, leasing, capital receipts and Capital Resource Funds. DEPRECIATION
A provision made in the accounts to reflect the value of assets consumed during the year. Depreciation forms part of the capital charge made to service revenue accounts. DEDICATED SCHOOLS GRANT This is a specific grant that provides the majority of funding for education in schools. It is disbursed on the basis of a basic per pupil amount plus funding for central government priorities.
GLOSSARY
~ 126 ~
EARMARKED RESERVES
These are reserves set aside for a specific purpose or a particular service, or type of expenditure. GENERAL FUND The council’s main revenue account that covers the net cost of all services other than the provision of council housing for rent. GROSS EXPENDITURE, GROSS INCOME AND NET EXPENDITURE
Gross Expenditure and Gross Income arise from the provision of services as shown in the General Fund and exclude the Direct Services/Labour Organisation accounts. Net Expenditure is the cost of service provision after the income is taken into account. HOUSING REVENUE ACCOUNT (HRA)
A statutory account that contains all expenditure and income on the provision of Council housing for rent. The HRA must be kept entirely separate from the General Fund and the account must balance. Local authorities are not allowed to make up any deficit on the HRA from the General Fund. MEDIUM TERM FINANCIAL STRATEGY (MTFS)
This is a financial plan over the medium term whose purpose is to set out how the Council will repond to changes and challenges over that timeframe and to set a context in which improved services and value-for-money will be delivered. NON-DOMESTIC RATE (NDR)
The rates paid by businesses. The amount paid is based on the rateable value set by the Inland Revenue multiplied by a rate in the £ set by the government which is the same throughout the country. The rates are collected by local authorities and paid over to the government. They are then redistributed to local authorities on the basis of relevant population. PRECEPT
A levy made by a body that does not collect local taxation itself, but by statute can require other bodies to collect the required income from local taxpayers on their behalf. In London the precepting body is the Greater London Authority (GLA). RESERVES The amounts held by way of balances and funds that are free from specific liabilities or commitments. The council is able to earmark some of its reserves towards specific projects, whilst leaving some free to act as a working balance. REVENUE EXPENDITURE Expenditure on day to day items such as salaries, wages and running costs. These items are paid for from service income, Formula Grant and Council Tax. Under the Local Government Finance Act all expenditure is deemed to be revenue unless it is specifically classified as capital. SERVICE LEVEL AGREEMENT (SLA)
This is a formal contract between Council departments and partners for internal services. These are mostly between support functions and frontline service delivery departments. TRANSFER PAYMENTS These are payments to individuals for which no goods or services are received in return by the local authority. Examples include council tax benefits, rent rebates and direct payments to health and social care clients.

~ 127 ~
Acknowledgement for photos
- Front Cover picture courtesy of Mr. Z. Dobry - Photograph on page 13 courtesy of Mr. T. Derbyshire - Photograph on page 33 courtesy of H&F News - Photograph on page 45 courtesy of H&F News - Photograph on page 57 courtesy of Mr. L. Quinnell - Photograph on page 67 courtesy of Mr. Z. Dobry - Photograph on page 85 courtesy of Hammerprint Stock photos - Photograph on page 97 courtesy of Hammerprint Stock photos