capital outlay full-time equivalent (fte) student
TRANSCRIPT
Capital Outlay Full-Time Equivalent (FTE)
Student Enrollment Forecasting
Florida Educational Facilities Planners' Association
July 9, 2015
Overview
Importance
CO FTE versus FEFP FTE
The Process
Quality Input Data
Cohort Modeling and Adjustments
COFTE Growth Calculations2

COFTE FactsThe annual COFTE calculation uses all data processed by the last day of state processing for the survey 3 reporting window
Survey amendments made after early April will not be included in the annual COFTE calculation
COFTE is capped at 1.0 FTE per student for each district of instruction

COFTE Forecast UsesNot for allocating funds
For facility planning
5-year educational plant survey cycle-Forecast used for planning during the district’s survey year
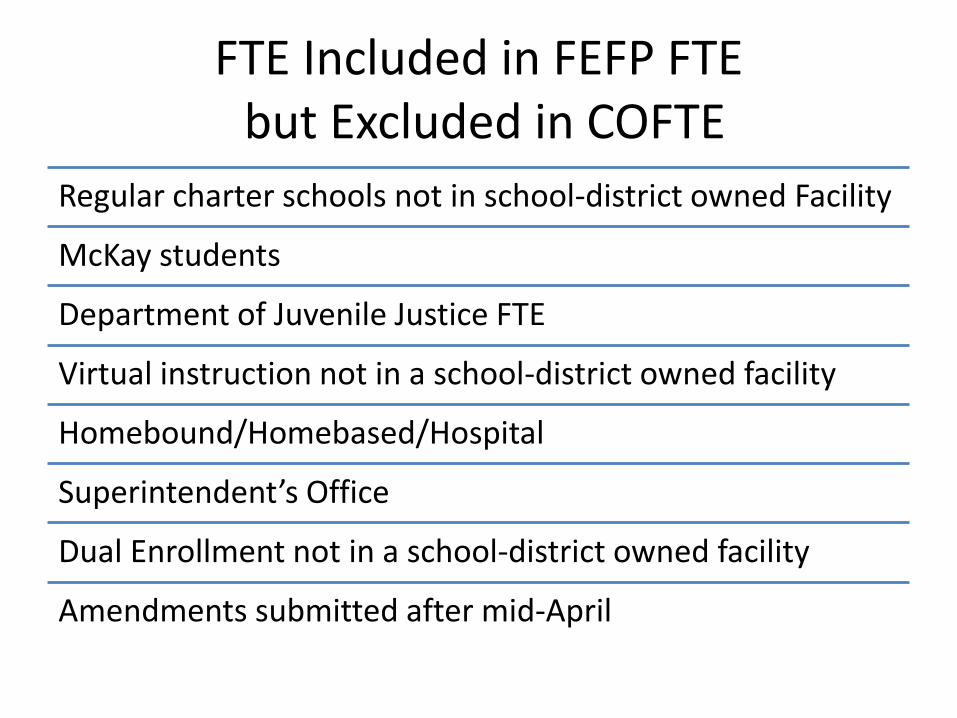
FTE Included in FEFP FTEbut Excluded in COFTE
Regular charter schools not in school-district owned Facility
McKay students
Department of Juvenile Justice FTE
Virtual instruction not in a school-district owned facility
Homebound/Homebased/Hospital
Superintendent’s Office
Dual Enrollment not in a school-district owned facility
Amendments submitted after mid-April

Process for the COFTE Forecast is Joint District-State Responsibility
District
State
Official Forecast
Education Estimating Conference Adoption
Accurate input data
Review preliminary forecast
Adjustments
Accurate FTE processing
Cohort ModelingReview forecast
appeals
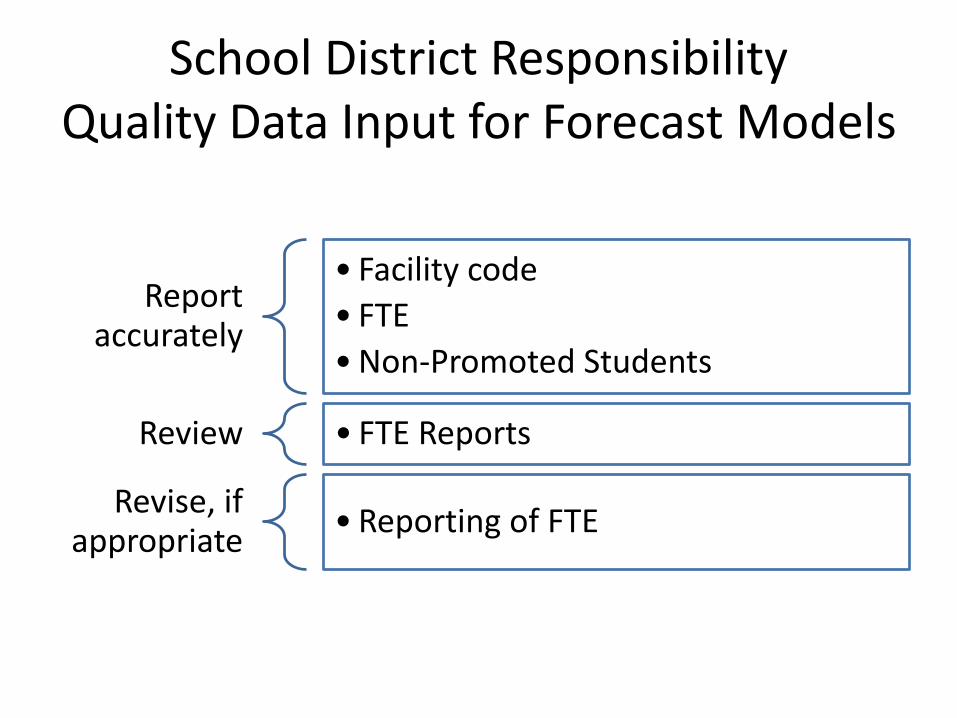
School District Responsibility Quality Data Input for Forecast Models
Report accurately
• Facility code
• FTE
• Non-Promoted Students
Review • FTE Reports
Revise, if appropriate
• Reporting of FTE
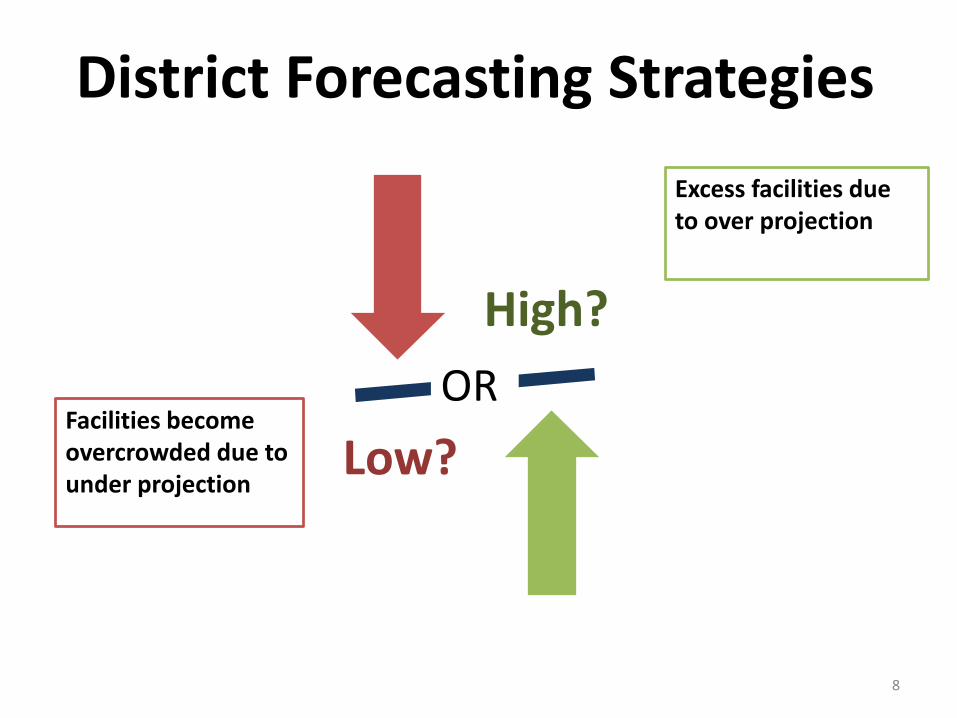
District Forecasting Strategies
High?
Low?
OR
Excess facilities due to over projection
Facilities become overcrowded due to under projection
8
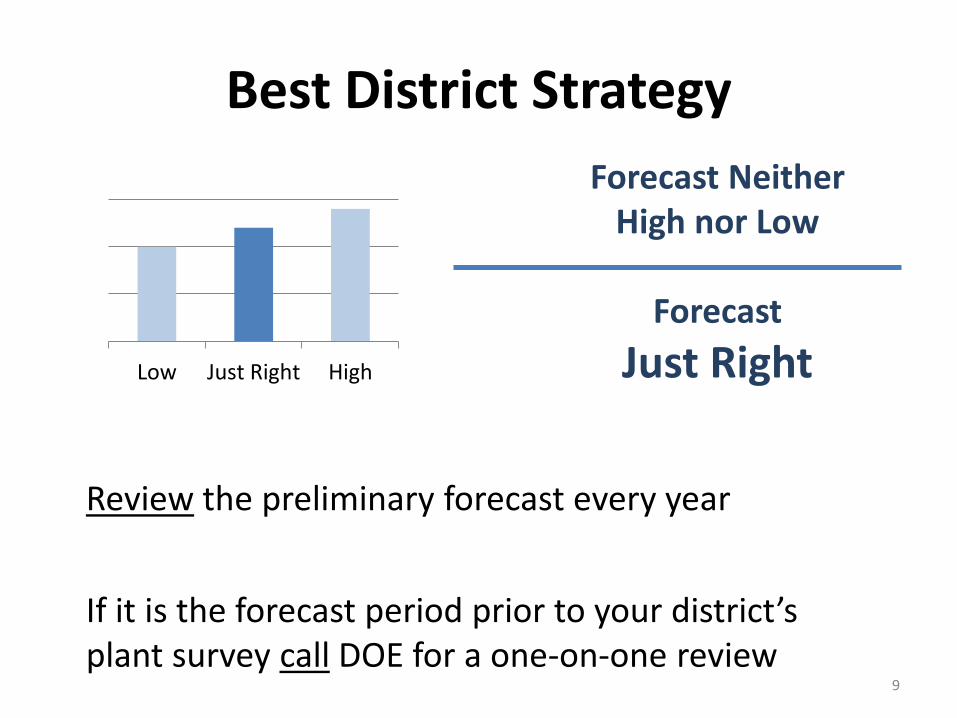
Best District Strategy
Forecast Neither High nor Low
Forecast
Just Right
Review the preliminary forecast every year
If it is the forecast period prior to your district’s plant survey call DOE for a one-on-one review
9
Low Just Right High
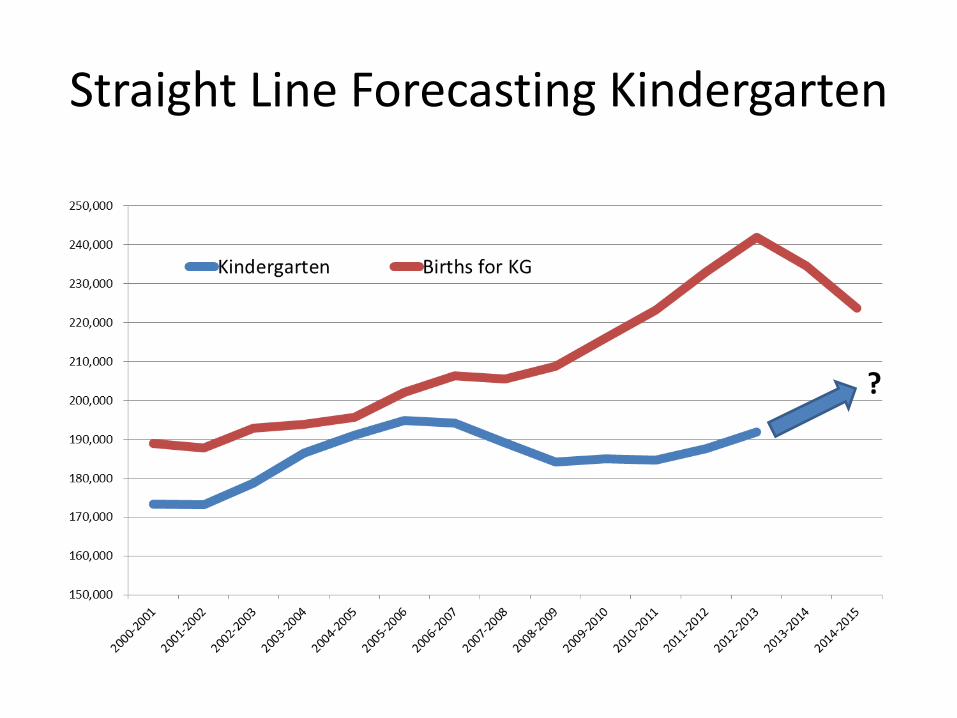
Straight Line Forecasting Kindergarten
?

Cohort Based Relationships
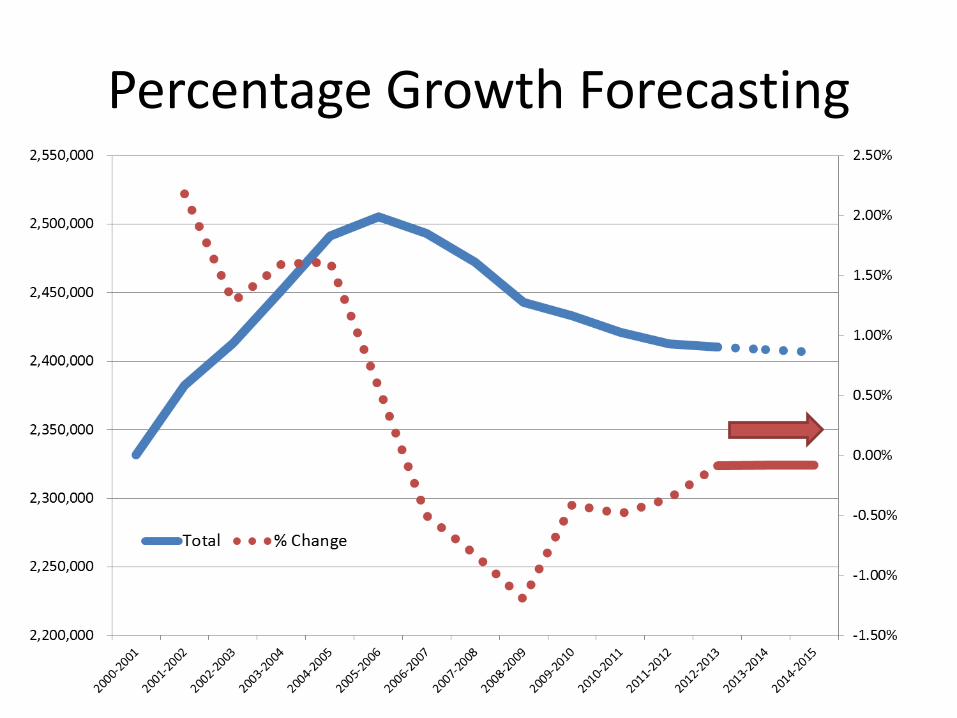
Percentage Growth Forecasting
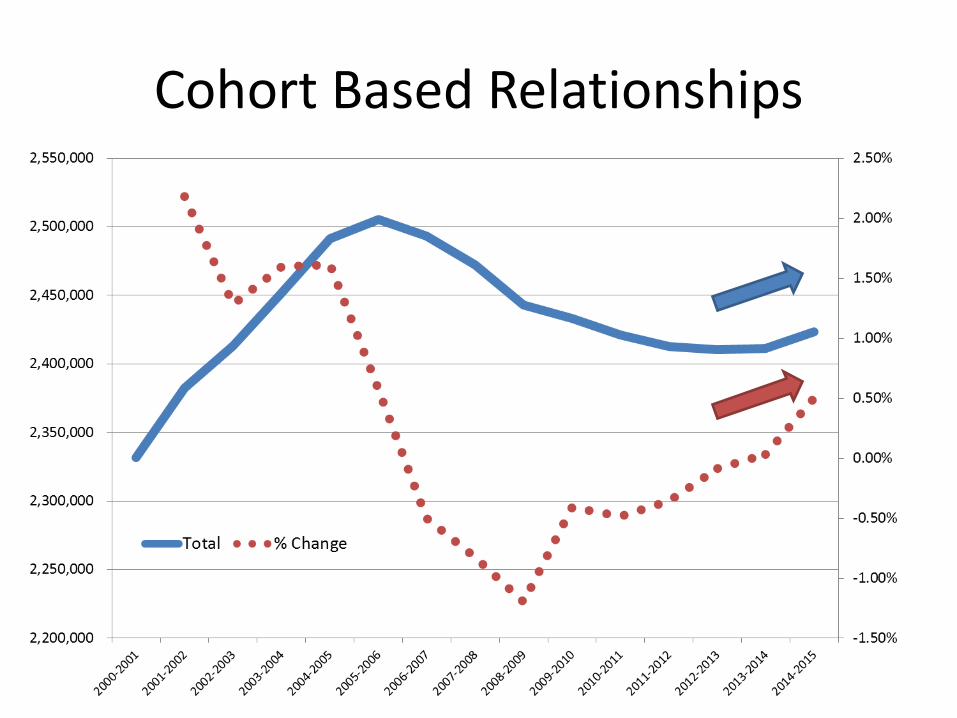
Cohort Based Relationships

Grade 3 Non-Promotions
Students Entering from Private School in Grade 9
KG G1 G2 G3 G4 G5 G6 G7 G8 G9 G10 G11 G12
Cohort Models
14
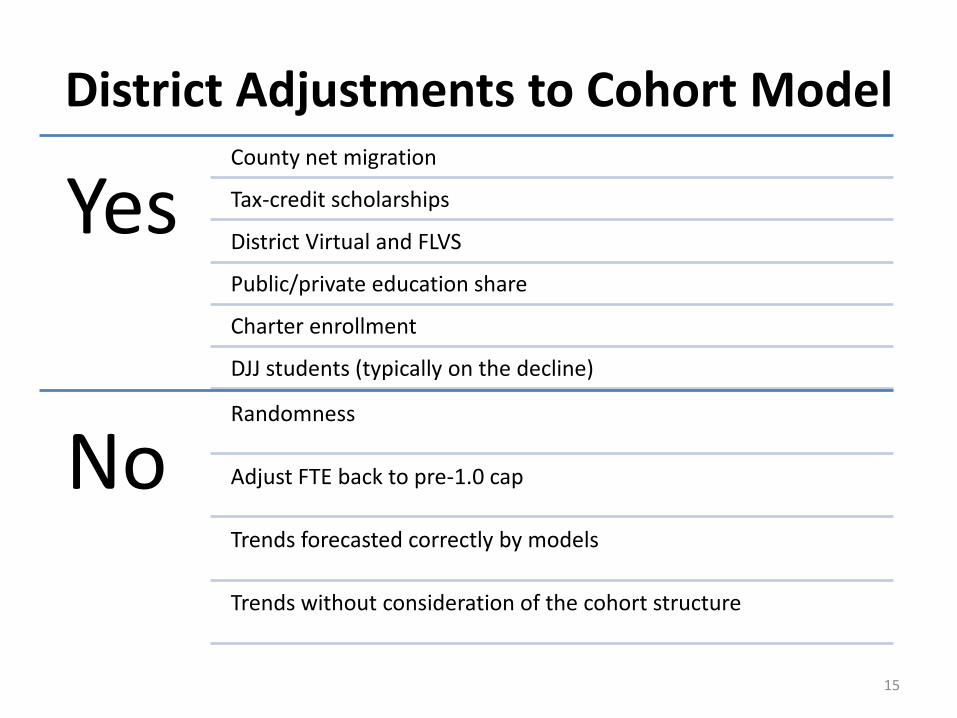
District Adjustments to Cohort Model
15
YesCounty net migration
Tax-credit scholarships
District Virtual and FLVS
Public/private education share
Charter enrollment
DJJ students (typically on the decline)
NoRandomness
Adjust FTE back to pre-1.0 cap
Trends forecasted correctly by models
Trends without consideration of the cohort structure

Simple Extrapolation
Cohort Modeling
Cohort Plus Trend Adjustments
• Cannot model variation
• Can model variation
• Can track some turning points
• Can improve model to track additional turning points

Calculating COFTE Growth
Growth = Selected Year FTE minus the Maximum FTE in prior three years
400450
500
425
0
100
200
300
400
500
600
Last 3 Years Selected Year
COFTE Growth = 50 FTE
Mid
dle
Sch
oo
l CO
FTE
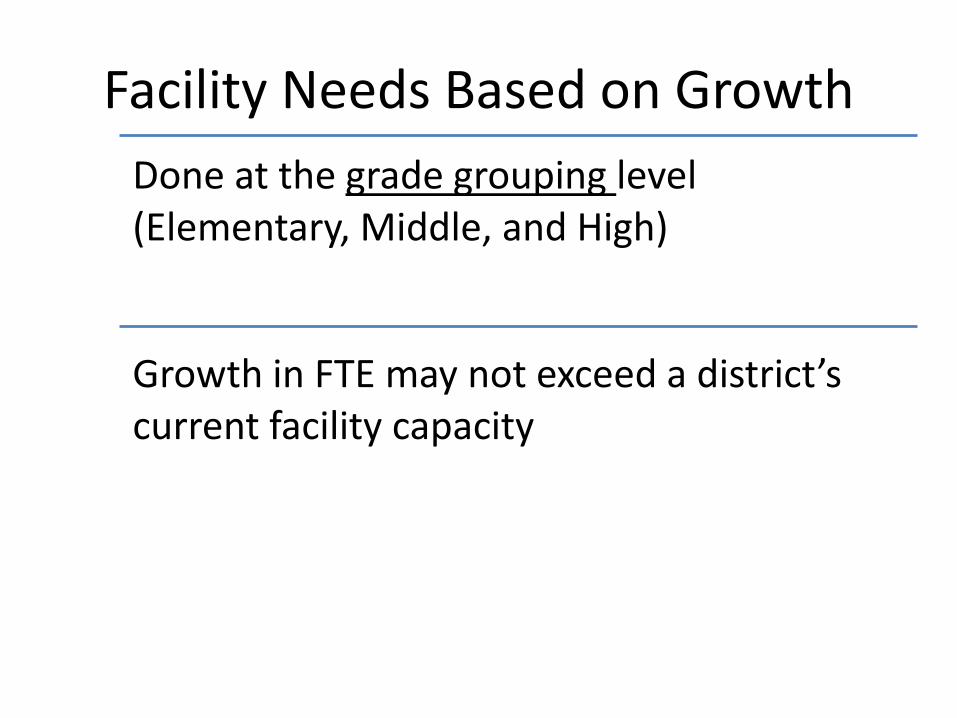
Facility Needs Based on Growth
Done at the grade grouping level (Elementary, Middle, and High)
Growth in FTE may not exceed a district’s current facility capacity

Education Estimating Conference
Unanimous Vote by Principals
• EDR (Economic and Demographic Research)
• House
• Senate
• Governor’s Office
Principals
19
For conference results go to:http://edr.state.fl.us/Content/conferences/index.cfm
Source: s. 216.136 (4), F.S.

Education Conference Schedule
What Why
Dec
New Data
Jan-Feb
Mar-Apr
FEFP FTE Appropriations
Legislative Impact
Capital Outlay Planning
LegislationFuture Forecasts
Governor’s Budget
3rd Calc FTE
District Forecasts
T
I
M
E
July
20
May
June
Appropriations3-Yr PlanDOE LBR
District Revisions 4th Calc FTE
FEFP FTE
FEFP FTE
FEFP FTE
Appropriations
Capital Outlay FTE Capital Outlay FTE

FEFP vs COFTE Forecast
Questions?
FTE Forecasting
Elisabeth Goodman
(850)245-5139
FTE Reports
Kendra Jahnke
(850)245-9912
