capital markets: the reinsurance evolution continues
TRANSCRIPT
This interactive PDF allows you to access information easily, search for a specific item, or go directly to the first page of that section.
TAbSClicking on one of the tabs at the side of the page takes you to the first page of that section.
GUIDE TO bUTTONS
go to table of contents
search this PDF
go to next page
go to previous page
Please note: if you are viewing this content on a tablet or mobile device, functionality for Buttons and Tabs will be disabled.

CAPITAL MARKETSREPORTSEPTEMBER 2014
Capital Markets: the reinsuranCe
evolution Continues

1
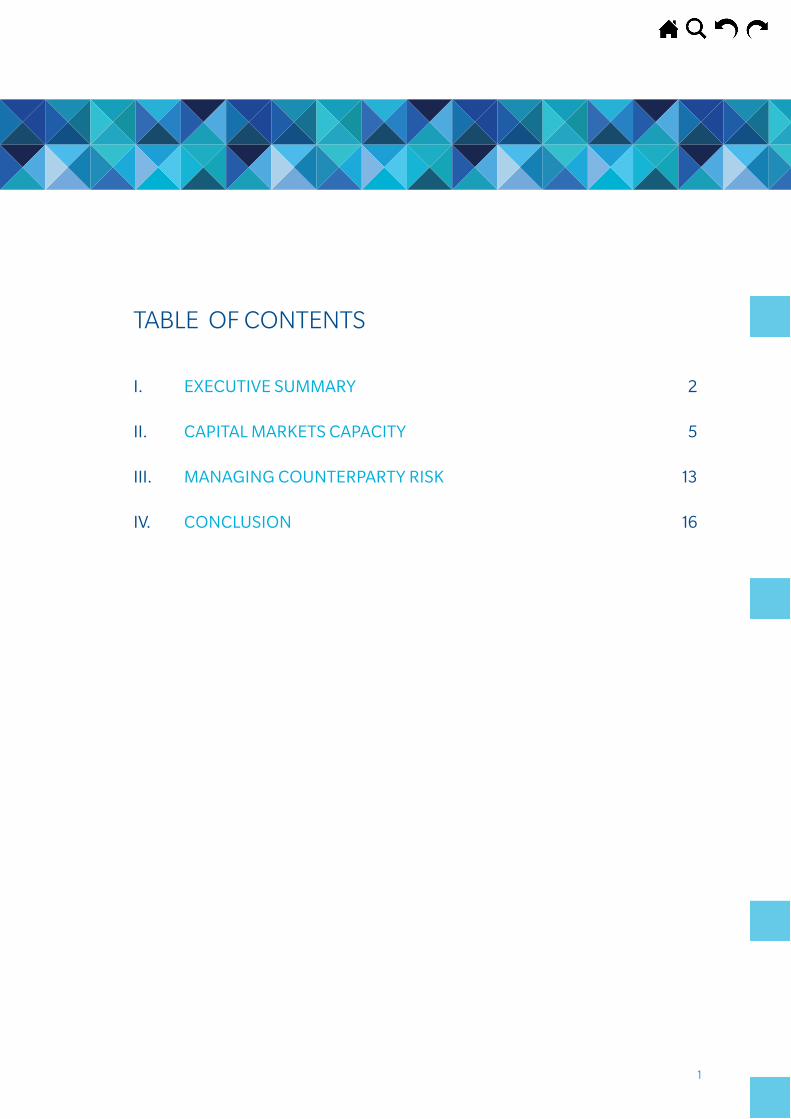
taBle oF Contents
I. EXECUTIVE SUMMARY 2
II. CAPITAL MARKETS CAPACITY 5
III. MAnAgIng COUnTERPARTY RISK 13
IV. COnCLUSIOn 16

2
I. EXECUTIVE SUMMARY
as the quality oF Catastrophe Modeling Continues to inCrease and as Capital Markets investors BeCoMe More CoMFortaBle with innovative terMs and Conditions, More ForMs oF risk May direCtly aCCess the Capital Markets in ils ForM.
3
during the past twelve months, capital has continued to flow into the reinsurance markets in the form of both
insurance-linked securities (ils) and collateralized reinsurance transactions. this report examines the growth in
the ils market during the past year and some of the important evolutionary elements of catastrophe bond structure
and risk transfer. we also explore how the use of capital markets-based capacity provides cost savings for public
entities by helping them build surplus, reduce public debt and limit the risk that natural perils can pose to the state’s
balance sheet. as collateralized markets continue to increase in importance as an alternative to both traditional
reinsurance and ils, guy Carpenter has taken an active role in analyzing counterparty risk and developing specific
structures and strategies to manage this risk. this report also provides an overview of the manner in which
guy Carpenter assists its clients in managing counterparty risk and limiting credit exposure.
one common theme in the development of both ils and collateralized markets is the change in the location of where
the capital to back insurance claims is held. in the case of traditional reinsurance, using a rated carrier, premiums
are paid by a cedent to a reinsurance company, then the reinsurer will pay any claims out of its capital base after the
insured or the cedent has made a claim. in the case of ils structures, the insured or the cedent holds the proceeds
of the security until either the equivalent of claim has occurred or the proceeds are returned to the investor when
the security matures. simplistically, in the case of reinsurance using a rated carrier, the reinsurer holds the money
– in the case of ils and collateralized markets, the insured holds the money or it is held in trust for the insured.
4
this major structural difference between rated and collateralized markets has given rise to well-defined structures
and verifiable parameters as alternatives to the traditional claims process. the continued development of these
structures and parameters will provide for further risk transfer to the collateralized markets. also, as the ils and
collateralized markets continue to innovate in these areas, rated reinsurance markets will utilize some of these same
triggers and techniques, creating another form of convergence between the rated and collateralized markets.
as discussed further in this report, one major innovation that occurred in the past year is the transfer of risk directly
from the risk-bearing entity to the capital markets, without an intervening insurance company. with the issuance
of its MetroCat re ltd. (MetroCat) bond, the Metropolitan transportation authority (Mta) transferred the risk
associated with storm surges and flooding directly to capital markets investors without an insurance company
acting as an intermediary.
as the quality of catastrophe modeling continues to increase and as capital markets investors become more comfortable with innovative terms and conditions, more forms of risk may directly access the capital markets in ils form.
in the case of collateralized markets, the theme of where the capital to pay claims is held has created a new form of
risk analysis. rather than focusing on traditional credit analysis, cedents rely on trust structures and agreements
and the quantity and quality of available collateral as security against claims. this report looks to these elements in
the development of collateralized market security and the role that guy Carpenter plays in assisting its clients in the
formation of effective collateralized reinsurance structures.
5
II. CAPITAL MARKETS CAPACITY
as puBliC entities strive to reduCe puBliC deBt, there is a Clear BeneFit derived FroM liMiting the risk that natural perils Can pose to a state’s BalanCe sheet. at the tiMe oF loss, governMents May Be spared these enorMous Costs and they May have enhanCed FlexiBility to FinanCe eConoMiC and soCial developMent or reduCe taxation.
6
seCtion quote here
gROwTh DOMInATES In 2014
the influx of new capital into the reinsurance industry constitutes the largest change to the sector’s capital structure in recent memory.
over the past 24 months, approximately usd20 billion of new capital has entered the market through investments
in ils, funds and sidecars as well as the formation of hedge fund-related reinsurance companies and collateralized
reinsurance vehicles.
the amount of limit placed utilizing ils and collateralized products continues to grow and some markets are
broadening the line of business and product focus.
utilization of capital markets capacity in the first six months of 2014 saw a continuation of the growth trends seen in
2013. revealing a widening of application, capital markets investors continue to be drawn to the (re)insurance space
primarily due to the advantages it offers as a non-correlating asset class. also, the recent availability of meaningful
risk opportunities continues to drive investors to focus on the insurance-linked security space.
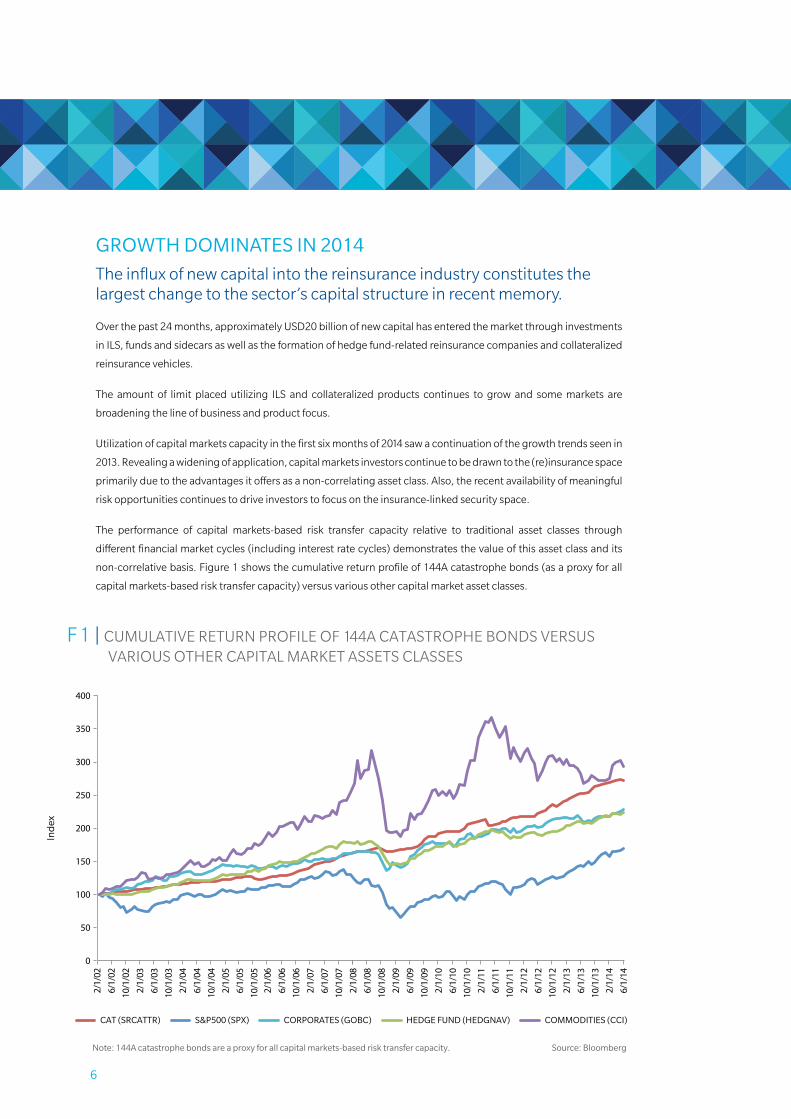
the performance of capital markets-based risk transfer capacity relative to traditional asset classes through
different financial market cycles (including interest rate cycles) demonstrates the value of this asset class and its
non-correlative basis. Figure 1 shows the cumulative return profile of 144a catastrophe bonds (as a proxy for all
capital markets-based risk transfer capacity) versus various other capital market asset classes.
F 3 | PRIVATE CATASTROPHE BONDS
Source: GC Securities Proprietary Database
Note: Does not include catastrophe bonds.
Ris
k C
apit
al A
mou
nt (
USD
Mill
ion
s)
Dea
l Cou
nt
Source: GC Securities
F 2 | 144A CATASTROPHE BONDS
0
5000
10000
15000
20000
25000
2014 YTD20132012201120102009200820072006200520042003200220012000199919981997
Ris
k C
apit
al A
mou
nt (
USD
Mill
ion
s)
Risk Capital Issued Risk Capital Outstanding at Year End
4,289.0 5,085.0
7,677.0
13,416.4
12,538.6
12,508.2
12,195.7
12,342.8
14,839.3
18,576.9
20,542.8
5,701.7
7,083.0
5,855.3
4,599.93,396.03,009.9
7,187.0
4,614.7
1,499.01,142.81,988.2
989.5966.91,142.01,052.5847.2948.2
4,107.1
Source: Bloomberg
F 1 | CUMULATIVE RETURN PROFILE OF 144A CATASTROPHE BONDS VERSUSVARIOUS OTHER CAPITAL MARKET ASSETS CLASSES
2/1/
02
CAT (SRCATTR) S&P500 (SPX) CORPORATES (GOBC) HEDGE FUND (HEDGNAV) COMMODITIES (CCI)
2011 2012 2013 2014 YTD
103.622.8
181.2
483.2
0
1000
900
800
700
600
500
400
300
200
100
0
2
4
6
8
10
12
14
16
Risk Capital Issued Deal Count
F 4 | RATED AND COLLATERALIZED MARKET PARTICIPATION PERCENTAGE OF SIGNED LIMIT
2013
Rated Collateralized
2014
6/1/
02
10/1
/02
2/1/
03
6/1/
03
10/1
/03
2/1/
04
6/1/
04
10/1
/04
2/1/
05
6/1/
05
10/1
/05
2/1/
06
6/1/
06
10/1
/06
2/1/
07
6/1/
07
10/1
/07
2/1/
08
6/1/
08
10/1
/08
2/1/
09
6/1/
09
10/1
/09
2/1/
10
6/1/
10
10/1
/10
2/1/
11
6/1/
11
10/1
/11
2/1/
12
6/1/
12
10/1
/12
2/1/
13
6/1/
13
2/1/
14
6/1/
14
10/1
/13
400
350
300
250
200
150
100
50
0
Note: 144A catastrophe bonds are a proxy for all capital markets-based risk transfer capacity.
Ind
ex
Source: Based on Proprietary Guy Carpenter Database
79%
21%
73%
27%
7
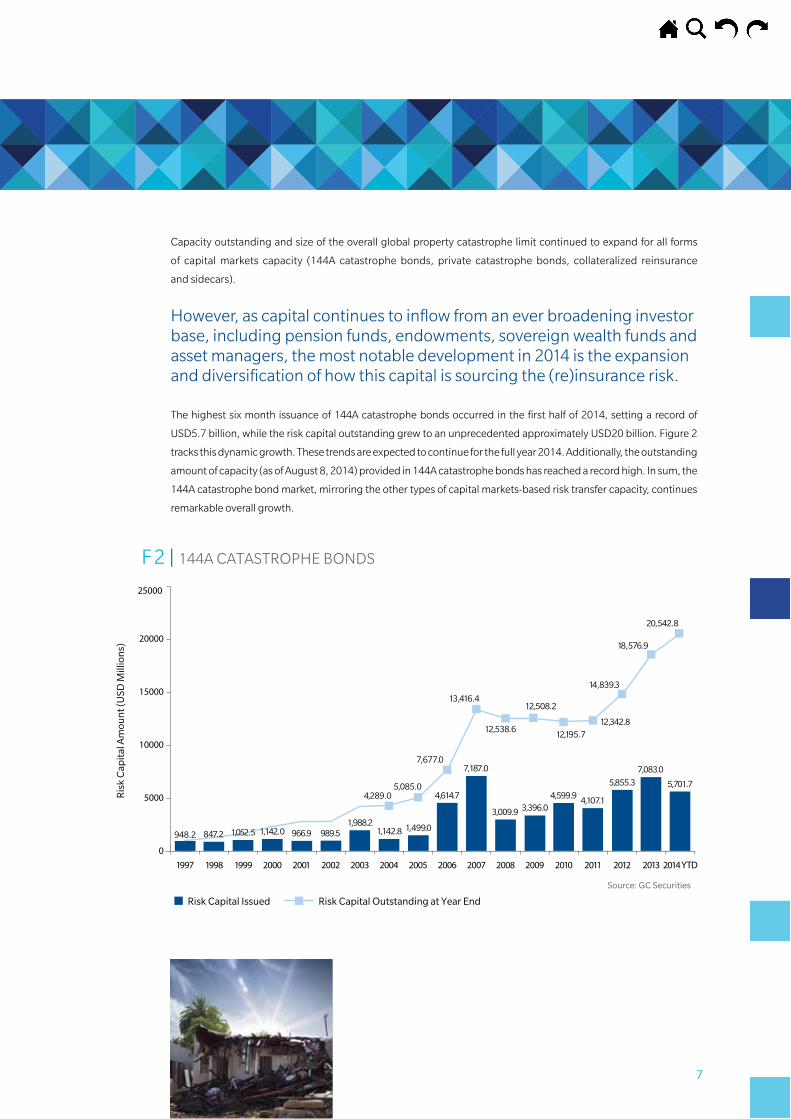
Capacity outstanding and size of the overall global property catastrophe limit continued to expand for all forms
of capital markets capacity (144a catastrophe bonds, private catastrophe bonds, collateralized reinsurance
and sidecars).
however, as capital continues to inflow from an ever broadening investor base, including pension funds, endowments, sovereign wealth funds and asset managers, the most notable development in 2014 is the expansion and diversification of how this capital is sourcing the (re)insurance risk.
the highest six month issuance of 144a catastrophe bonds occurred in the first half of 2014, setting a record of
usd5.7 billion, while the risk capital outstanding grew to an unprecedented approximately usd20 billion. Figure 2
tracks this dynamic growth. these trends are expected to continue for the full year 2014. additionally, the outstanding
amount of capacity (as of august 8, 2014) provided in 144a catastrophe bonds has reached a record high. in sum, the
144a catastrophe bond market, mirroring the other types of capital markets-based risk transfer capacity, continues
remarkable overall growth.
F 3 | PRIVATE CATASTROPHE BONDS
Source: GC Securities Proprietary Database
Note: Does not include catastrophe bonds.
Ris
k C
apit
al A
mou
nt (
USD
Mill
ion
s)
Dea
l Cou
nt
Source: GC Securities
F 2 | 144A CATASTROPHE BONDS
0
5000
10000
15000
20000
25000
2014 YTD20132012201120102009200820072006200520042003200220012000199919981997
Ris
k C
apit
al A
mou
nt (
USD
Mill
ion
s)
Risk Capital Issued Risk Capital Outstanding at Year End
4,289.0 5,085.0
7,677.0
13,416.4
12,538.6
12,508.2
12,195.7
12,342.8
14,839.3
18,576.9
20,542.8
5,701.7
7,083.0
5,855.3
4,599.93,396.03,009.9
7,187.0
4,614.7
1,499.01,142.81,988.2
989.5966.91,142.01,052.5847.2948.2
4,107.1
Source: Bloomberg
F 1 | CUMULATIVE RETURN PROFILE OF 144A CATASTROPHE BONDS VERSUSVARIOUS OTHER CAPITAL MARKET ASSETS CLASSES
2/1/
02
CAT (SRCATTR) S&P500 (SPX) CORPORATES (GOBC) HEDGE FUND (HEDGNAV) COMMODITIES (CCI)
2011 2012 2013 2014 YTD
103.622.8
181.2
483.2
0
1000
900
800
700
600
500
400
300
200
100
0
2
4
6
8
10
12
14
16
Risk Capital Issued Deal Count
F 4 | RATED AND COLLATERALIZED MARKET PARTICIPATION PERCENTAGE OF SIGNED LIMIT
2013
Rated Collateralized
2014
6/1/
02
10/1
/02
2/1/
03
6/1/
03
10/1
/03
2/1/
04
6/1/
04
10/1
/04
2/1/
05
6/1/
05
10/1
/05
2/1/
06
6/1/
06
10/1
/06
2/1/
07
6/1/
07
10/1
/07
2/1/
08
6/1/
08
10/1
/08
2/1/
09
6/1/
09
10/1
/09
2/1/
10
6/1/
10
10/1
/10
2/1/
11
6/1/
11
10/1
/11
2/1/
12
6/1/
12
10/1
/12
2/1/
13
6/1/
13
2/1/
14
6/1/
14
10/1
/13
400
350
300
250
200
150
100
50
0
Note: 144A catastrophe bonds are a proxy for all capital markets-based risk transfer capacity.
Ind
ex
Source: Based on Proprietary Guy Carpenter Database
79%
21%
73%
27%
8
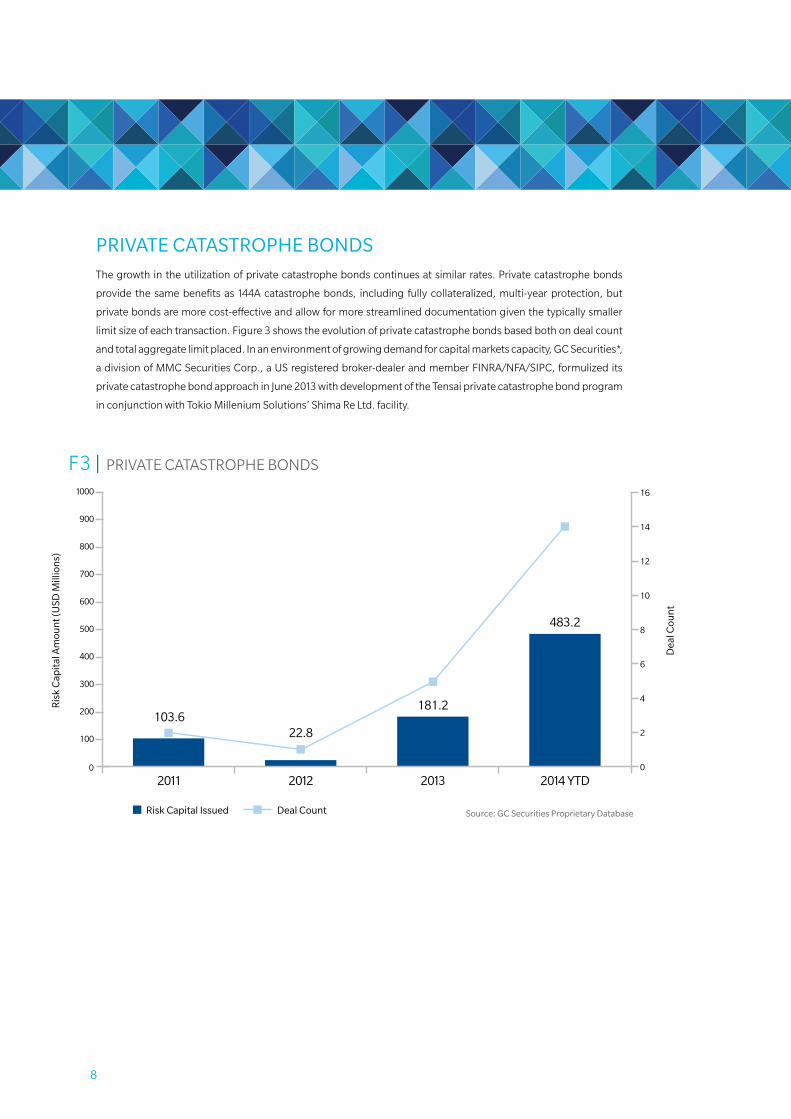
PRIVATE CATASTROPhE BOnDSthe growth in the utilization of private catastrophe bonds continues at similar rates. private catastrophe bonds
provide the same benefits as 144a catastrophe bonds, including fully collateralized, multi-year protection, but
private bonds are more cost-effective and allow for more streamlined documentation given the typically smaller
limit size of each transaction. Figure 3 shows the evolution of private catastrophe bonds based both on deal count
and total aggregate limit placed. in an environment of growing demand for capital markets capacity, gC securities*,
a division of MMC securities Corp., a us registered broker-dealer and member Finra/nFa/sipC, formulized its
private catastrophe bond approach in June 2013 with development of the tensai private catastrophe bond program
in conjunction with tokio Millenium solutions’ shima re ltd. facility.
F 3 | PRIVATE CATASTROPHE BONDS
Source: GC Securities Proprietary Database
Note: Does not include catastrophe bonds.
Ris
k C
apit
al A
mou
nt (
USD
Mill
ion
s)
Dea
l Cou
nt
Source: GC Securities
F 2 | 144A CATASTROPHE BONDS
0
5000
10000
15000
20000
25000
2014 YTD20132012201120102009200820072006200520042003200220012000199919981997
Ris
k C
apit
al A
mou
nt (
USD
Mill
ion
s)
Risk Capital Issued Risk Capital Outstanding at Year End
4,289.0 5,085.0
7,677.0
13,416.4
12,538.6
12,508.2
12,195.7
12,342.8
14,839.3
18,576.9
20,542.8
5,701.7
7,083.0
5,855.3
4,599.93,396.03,009.9
7,187.0
4,614.7
1,499.01,142.81,988.2
989.5966.91,142.01,052.5847.2948.2
4,107.1
Source: Bloomberg
F 1 | CUMULATIVE RETURN PROFILE OF 144A CATASTROPHE BONDS VERSUSVARIOUS OTHER CAPITAL MARKET ASSETS CLASSES
2/1/
02
CAT (SRCATTR) S&P500 (SPX) CORPORATES (GOBC) HEDGE FUND (HEDGNAV) COMMODITIES (CCI)
2011 2012 2013 2014 YTD
103.622.8
181.2
483.2
0
1000
900
800
700
600
500
400
300
200
100
0
2
4
6
8
10
12
14
16
Risk Capital Issued Deal Count
F 4 | RATED AND COLLATERALIZED MARKET PARTICIPATION PERCENTAGE OF SIGNED LIMIT
2013
Rated Collateralized
2014
6/1/
02
10/1
/02
2/1/
03
6/1/
03
10/1
/03
2/1/
04
6/1/
04
10/1
/04
2/1/
05
6/1/
05
10/1
/05
2/1/
06
6/1/
06
10/1
/06
2/1/
07
6/1/
07
10/1
/07
2/1/
08
6/1/
08
10/1
/08
2/1/
09
6/1/
09
10/1
/09
2/1/
10
6/1/
10
10/1
/10
2/1/
11
6/1/
11
10/1
/11
2/1/
12
6/1/
12
10/1
/12
2/1/
13
6/1/
13
2/1/
14
6/1/
14
10/1
/13
400
350
300
250
200
150
100
50
0
Note: 144A catastrophe bonds are a proxy for all capital markets-based risk transfer capacity.
Ind
ex
Source: Based on Proprietary Guy Carpenter Database
79%
21%
73%
27%
9
nEw CEDEnTSnew cedents continued to enter the catastrophe bond space in 2014. seven new sponsors (american strategic
insurance group, everest re, generali, great american, heritage, sompo Japan nipponkoa and texas windstorm
insurance association) utilized the 144a catastrophe bond market for the first time in the first half of 2014.
additionally, several new sponsors entered the private catastrophe bond market. they included, but were not
limited to, the Caribbean Catastrophe risk insurance Facility (CCriF) and achmea.
Cedents are increasingly attracted to capital markets capacity because of its competitive pricing and broadening indemnity coverage (with increasing inclusion of non-modeled perils).
as the focus grows on increased integration and consistency in coverage provided across products, gC securities
has seen a growing request for incorporating certain terms and conditions, for example, hours clauses and
definitions of named storms, from capital markets structures into traditional reinsurance placements. historically,
capital markets-based risk transfer structures have been pushed to mirror traditional reinsurance terms. the
decoupling of pricing and terms and conditions is a key attribute of capital markets-based risk transfer capacity
relative to traditional reinsurance.

10
PUBLIC EnTITIES, InSURERS Of LAST RESORT AnD COMPULSORY CAT POOLS AnD DISASTER fACILITIES
the use of capital markets-based risk transfer capacity by public entities, insurers of last resort, and compulsory catastrophe pools and disaster facilities continues to expand.
these deals included turkey’s turkish Catastrophe insurance pool, Mexico’s Fonden and new Zealand’s
eqC. Most large u.s. insurers of last resort, such as Cea, Citizens (Fl), Citizens (la), north Carolina Joint
underwriting association and the north Carolina insurance underwriting association (nCJua/nCiua), and texas
windstorm insurance association, are utilizing capital markets capacity including collateralized reinsurance and
catastrophe bonds.
given gC securities’ leadership in placing capital markets-based solutions for public entities, insurers of last resort,
and compulsory pools and disaster facilities, we have seen that the use of capital markets-based capacity has
been instrumental in many ways. it provides cost savings to these entities allowing them to utilize such savings
to build surplus or buy needed additional coverage; it improves coverage terms (transforming programs from per
occurrence to annual aggregate responses) and it provides leverage to keep traditional capacity sources honest
and to facilitate their willingness to adjust coverage terms that may not have been feasible without the use of capital
markets-based risk transfer capacity.
11
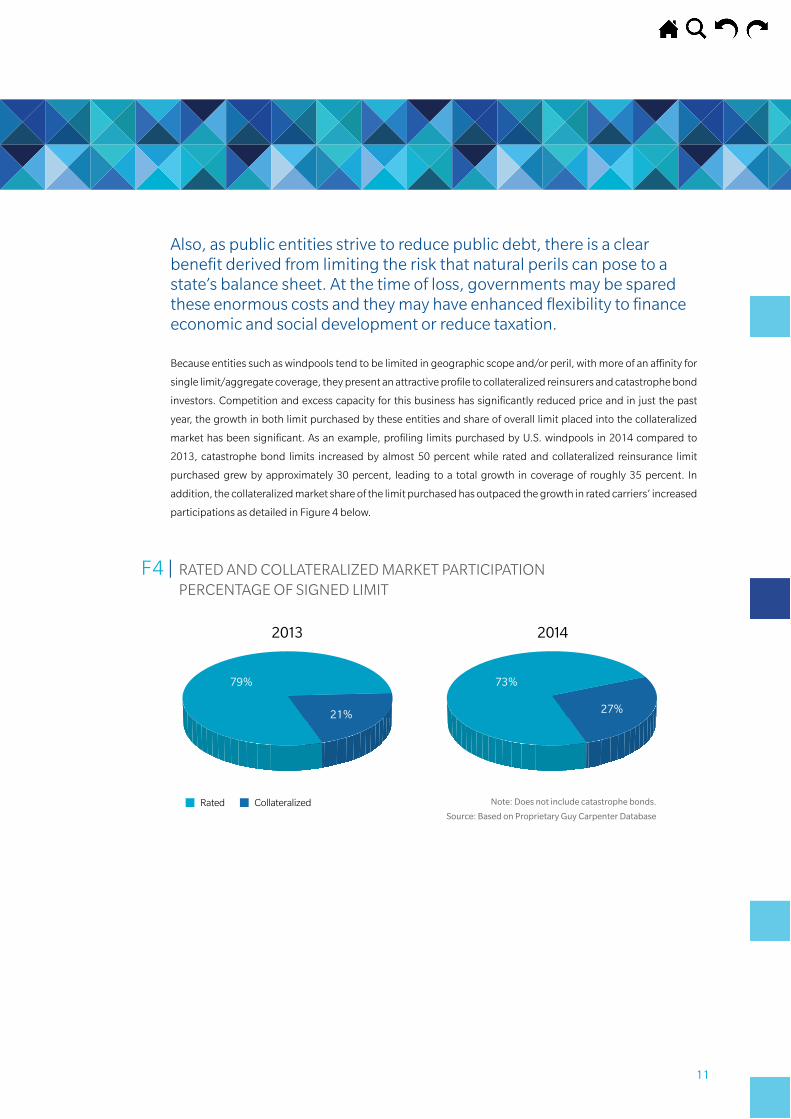
also, as public entities strive to reduce public debt, there is a clear benefit derived from limiting the risk that natural perils can pose to a state’s balance sheet. at the time of loss, governments may be spared these enormous costs and they may have enhanced flexibility to finance economic and social development or reduce taxation.
Because entities such as windpools tend to be limited in geographic scope and/or peril, with more of an affinity for
single limit/aggregate coverage, they present an attractive profile to collateralized reinsurers and catastrophe bond
investors. Competition and excess capacity for this business has significantly reduced price and in just the past
year, the growth in both limit purchased by these entities and share of overall limit placed into the collateralized
market has been significant. as an example, profiling limits purchased by u.s. windpools in 2014 compared to
2013, catastrophe bond limits increased by almost 50 percent while rated and collateralized reinsurance limit
purchased grew by approximately 30 percent, leading to a total growth in coverage of roughly 35 percent. in
addition, the collateralized market share of the limit purchased has outpaced the growth in rated carriers’ increased
participations as detailed in Figure 4 below.
F 3 | PRIVATE CATASTROPHE BONDS
Source: GC Securities Proprietary Database
Note: Does not include catastrophe bonds.
Ris
k C
apit
al A
mou
nt (
USD
Mill
ion
s)
Dea
l Cou
nt
Source: GC Securities
F 2 | 144A CATASTROPHE BONDS
0
5000
10000
15000
20000
25000
2014 YTD20132012201120102009200820072006200520042003200220012000199919981997
Ris
k C
apit
al A
mou
nt (
USD
Mill
ion
s)
Risk Capital Issued Risk Capital Outstanding at Year End
4,289.0 5,085.0
7,677.0
13,416.4
12,538.6
12,508.2
12,195.7
12,342.8
14,839.3
18,576.9
20,542.8
5,701.7
7,083.0
5,855.3
4,599.93,396.03,009.9
7,187.0
4,614.7
1,499.01,142.81,988.2
989.5966.91,142.01,052.5847.2948.2
4,107.1
Source: Bloomberg
F 1 | CUMULATIVE RETURN PROFILE OF 144A CATASTROPHE BONDS VERSUSVARIOUS OTHER CAPITAL MARKET ASSETS CLASSES
2/1/
02
CAT (SRCATTR) S&P500 (SPX) CORPORATES (GOBC) HEDGE FUND (HEDGNAV) COMMODITIES (CCI)
2011 2012 2013 2014 YTD
103.622.8
181.2
483.2
0
1000
900
800
700
600
500
400
300
200
100
0
2
4
6
8
10
12
14
16
Risk Capital Issued Deal Count
F 4 | RATED AND COLLATERALIZED MARKET PARTICIPATION PERCENTAGE OF SIGNED LIMIT
2013
Rated Collateralized
2014
6/1/
02
10/1
/02
2/1/
03
6/1/
03
10/1
/03
2/1/
04
6/1/
04
10/1
/04
2/1/
05
6/1/
05
10/1
/05
2/1/
06
6/1/
06
10/1
/06
2/1/
07
6/1/
07
10/1
/07
2/1/
08
6/1/
08
10/1
/08
2/1/
09
6/1/
09
10/1
/09
2/1/
10
6/1/
10
10/1
/10
2/1/
11
6/1/
11
10/1
/11
2/1/
12
6/1/
12
10/1
/12
2/1/
13
6/1/
13
2/1/
14
6/1/
14
10/1
/13
400
350
300
250
200
150
100
50
0
Note: 144A catastrophe bonds are a proxy for all capital markets-based risk transfer capacity.
Ind
ex
Source: Based on Proprietary Guy Carpenter Database
79%
21%
73%
27%
12
DEVELOPIng TREnDS
Capital markets capacity continues to innovate as highlighted by the recent issuance of a catastrophe bond by the Mta. this issue, MetroCat, which came to market in July 2013, demonstrated the willingness of capital markets investors to assume storm surge and flood risk from named storms in a cost effective manner.
additionally, gC securities’ recent private catastrophe placement from the world Bank’s new catastrophe note
facility for the CCriF shows the application for those sovereigns that need to protect against natural risks but
whose limit needs may be more modest. the CCriF private placement also highlights the willingness of investors
to evaluate and assume risk based on alternative models as opposed to only the large vendor models. we believe
this development will open up further opportunities for both perils and geographic regions where large vendor
models are not available.
Following the success of MetroCat, the application of capital markets capacity to corporate clients has emerged as a growing trend.
in the wake of superstorm sandy, many corporate clients faced difficult post-event renewal cycles for storm surge
risks, as well as business interruption and contingent business interruption-type losses. Many of these clients also
came to the realization that they were exposed and retained significant unreinsured risks. Companies in this situation
are increasingly evaluating and utilizing capital markets-based risk transfer solutions, including catastrophe bonds
and collateralized reinsurance, given their increasing cost-effectiveness and simplified processes. gC securities
expects substantial growth and activity in this area through 2015.
Finally, there is a growing message from insurers and reinsurers regarding how capital markets-based risk transfer
capacity can be utilized to segment certain risks that are best suited for the capital markets. there is also interest
in how they can utilize and rely upon this form of capital on a longer-term basis as a substitute for equity capital.
up to this point insurers and reinsurers have relied upon capital markets-based capacity primarily for property
catastrophe risks (either for existing business or for growth into new areas). Moving forward, there is a question
of the degree of expansion into longer tail, less volatile insurer lines given the growing prevalence of hedge-fund
backed reinsurers seeking to reinsure asset intensive long-tail liabilities. with the dialogue just beginning at the
C-suite level, further innovations are a matter of when…not if.

13
III. MAnAgIng COUnTERPARTY RISK
14
guy Carpenter helps our clients manage the specific counterparty risk elements associated with collateralized
markets. the credit analysis of collateralized markets is different than the analysis of a traditional reinsurer.
the issue of counterparty risk has several components: ability to pay, willingness to pay and concentration of source.
the ability to pay is typically attempted to be captured by ratings methodology and protocols. this focuses
primarily on financial condition of the other party. in normal market conditions a snapshot of financial condition is
useful. however in distressed market conditions ratings tend not to capture rapid deterioration in a timely fashion,
as evidenced by the 2008 financial crisis. the snapshot approach is not well suited to cover the “cliff risk” of a highly
rated entity dropping below investment grade in a single step.
the willingness to pay is a more difficult challenge, whereby the party may have the financial ability to perform but
chooses not to fulfill obligations and/or challenges contract terms. this is an aspect of reinsurance recoverables
that can often increase upon severe loss events. due to the often short form nature of reinsurance documentation,
these challenges are subject to market standards, the courts or relationships to remediate.
Concentration of sourcing is always a concern for enterprise risk. in the context of reinsurance, the over reliance
on rated capacity (unsecured promises to pay) can become a capital sufficiency problem in a catastrophic
event scenario.
how then do we mitigate these risks? we use ratings to assess ability to pay. Market conditions and convention
often determine if we price differentially for ratings strength. the capital markets use collateral/security to mitigate
willingness to pay, by gaining a priority claim on a source of repayment instead of joining the pool of all payees.
Controlling concentrations of counterparty types is critical to managing enterprise risk.
in the context of reinsurance programs, introducing collateralized capacity in the form of collateralized reinsurance or catastrophe bonds is a sound plan to balance the inherent risks of a program comprised solely of unsecured promises to pay from rated entities.
15
fEATURES Of COLLATERAL STRUCTURESa collateralized reinsurance transaction is one in which a market creates a trust account at the inception of the
contract term and funds the account in an amount equal to the contract limit (less certain deductions). this funding
mechanism provides the client with readily accessible funds in the event of a loss that are segregated from the
other assets of the market and remains available even if the market becomes insolvent. a collateralized reinsurance
transaction also requires a pre-negotiated release of assets in the trust fund back to the market if there are no losses
or if loss development is less than the contract limit.
at the time of contract inception, the collateralized market will appoint a bank as trustee to establish a trust account
funded to equal the limit of reinsurance coverage or an amount negotiated and agreed to by the collateralized
market and the client. these trust agreements are negotiated between the bank, the collateralized market and the
client, and must be compliant with local regulations to ensure clients can take proper credit for reinsurance. this
process can take time to draft, review and finalize for signature. guy Carpenter’s vast experience in structuring such
trust accounts can help to streamline the process of establishing a trust account and negotiating a trust agreement
with the bank trustee. occasionally there may be a dual trust requirement on the placement, which may require
a separate Collateral holding agreement for the collateralized market. the guy Carpenter broker will verify that
the necessary wording and documents are in place in relation to the reinsurance placement, the trustees and any
state-specific mandates. guy Carpenter’s extensive experience in structuring collateralized transactions can help
to guide clients and streamline the process.

16
IV. COnCLUSIOn
17
IV. COnCLUSIOnalthough the future direction of capital flows and (re)insurance pricing in the years ahead is impossible to predict,
the new formats and structures for risk transfer created by the ils and collateralized reinsurance markets have
become well-established elements of the risk transfer landscape. guy Carpenter and gC securities are committed
to assisting our clients in navigating and understanding these innovative forms of risk transfer and to finding the
optimal form of risk mitigation from the vast array of potential solutions across all markets.
COnTACTS
Peter JachymManaging directorgC securities+1 917 937 [email protected]
Cory Angerglobal head of ils structuringgC securities+1 917 937 [email protected]
Matthew Daysenior vice presidentguy Carpenter+44 207 357 [email protected]
Chi Humglobal head of ils distributiongC securities+1 917 937 [email protected]
Lara Moweryglobal head of propertyguy Carpenter+1 952 832 [email protected]
Clifford Richstrategic advisory – Market intelligenceguy Carpenter+1 917 937 [email protected]
18
ABOUT gUY CARPEnTERguy Carpenter & Company, llC is a global leader in providing risk and reinsurance intermediary services. with
over 50 offices worldwide, guy Carpenter creates and executes reinsurance solutions and delivers capital market
solutions* for clients across the globe. the firm’s full breadth of services includes line-of-business expertise in
agriculture; aviation; casualty clash; construction and engineering; cyber solutions; excess and umbrella; excess
and surplus lines; healthcare & life; marine and energy; mutual insurance companies; political risk and trade credit;
professional liability; property; retrocessional reinsurance; surety; terrorism and workers compensation. gC Fac®
is guy Carpenter’s dedicated global facultative reinsurance unit that provides placement strategies, timely market
access and centralized management of facultative reinsurance solutions. in addition, gC analytics®** utilizes
industry-leading quantitative skills and modeling tools that optimize the reinsurance decision-making process
and help make the firm’s clients more successful. For more information, visit www.guycarp.com and follow guy
Carpenter on twitter @guyCarpenter.
guy Carpenter is a wholly owned subsidiary of Marsh & Mclennan Companies (nyse: MMC), a global professional
services firm offering clients advice and solutions in the areas of risk, strategy, and human capital. Marsh is a
global leader in insurance broking and risk management; Mercer is a global leader in talent, health, retirement,
and investment consulting; and oliver wyman is a global leader in management consulting. with annual revenue
exceeding $12 billion, Marsh & Mclennan Companies’ 55,000 colleagues worldwide provide analysis, advice, and
transactional capabilities to clients in more than 130 countries. the Company prides itself on being a responsible
corporate citizen and making a positive impact in the communities in which it operates. visit www.mmc.com for
more information.
*securities or investments, as applicable, are offered in the united states through gC securities, a division of MMC
securities Corp., a us registered broker-dealer and member Finra/nFa/sipC. Main office: 1166 avenue of the
americas, new york, ny 10036. phone: (212) 345-5000. securities or investments, as applicable, are offered in
the european union by gC securities, a division of MMC securities (europe) ltd. (MMCsel), which is authorized
and regulated by the Financial Conduct authority, main office 25 the north Colonnade, Canary wharf, london
e14 5hs. reinsurance products are placed through qualified affiliates of guy Carpenter & Company, llC. MMC
securities Corp., MMC securities (europe) ltd. and guy Carpenter & Company, llC are affiliates owned by Marsh
& Mclennan Companies. this communication is not intended as an offer to sell or a solicitation of any offer to buy
any security, financial instrument, reinsurance or insurance product.
Chi hum, Cory anger and peter Jachym are registered representatives of MMC securities Corp.
**gC analytics is a registered mark with the u.s. patent and trademark office.
19
Disclaimerguy Carpenter & Company, llC provides this report for general information only. the information contained herein is based on sources we believe reliable, but we do not guarantee its accuracy, and it should be understood to be general insurance/reinsurance information only. guy Carpenter & Company, llC makes no representations or warranties, express or implied. the information is not intended to be taken as advice with respect to any individual situation and cannot be relied upon as such. please consult your insurance/reinsurance advisors with respect to individual coverage issues.
statements concerning tax, accounting, legal or regulatory matters should be understood to be general observations based solely on our experience as reinsurance brokers and risk consultants, and may not be relied upon as tax, accounting, legal or regulatory advice, which we are not authorized to provide. all such matters should be reviewed with your own qualified advisors in these areas.
readers are cautioned not to place undue reliance on any historical, current or forward-looking statements. guy Carpenter & Company, llC undertakes no obligation to update or revise publicly any historical, current or forward-looking statements, whether as a result of new information, research, future events or otherwise.
this document or any portion of the information it contains may not be copied or reproduced in any form without the permission of guy Carpenter & Company, llC, except that clients of guy Carpenter & Company, llC need not obtain such permission when using this report for their internal purposes.
the trademarks and service marks contained herein are the property of their respective owners.
© 2014 guy Carpenter & Company, llC

20
nOTES


M2370.9.14.800K | CAPITAL MARKETS REPORT | © 2014 gUY CARPEnTER & COMPAnY, LLC | gUYCARP.COM