capital market day at mycronicinvestors.mycronic.com/v2/sites/default/files/cmd/...capital market...
TRANSCRIPT

Capital Market day at Mycronic A Swedish high-tech company offering unique production solutions to the electronics industry 20 November, 2014
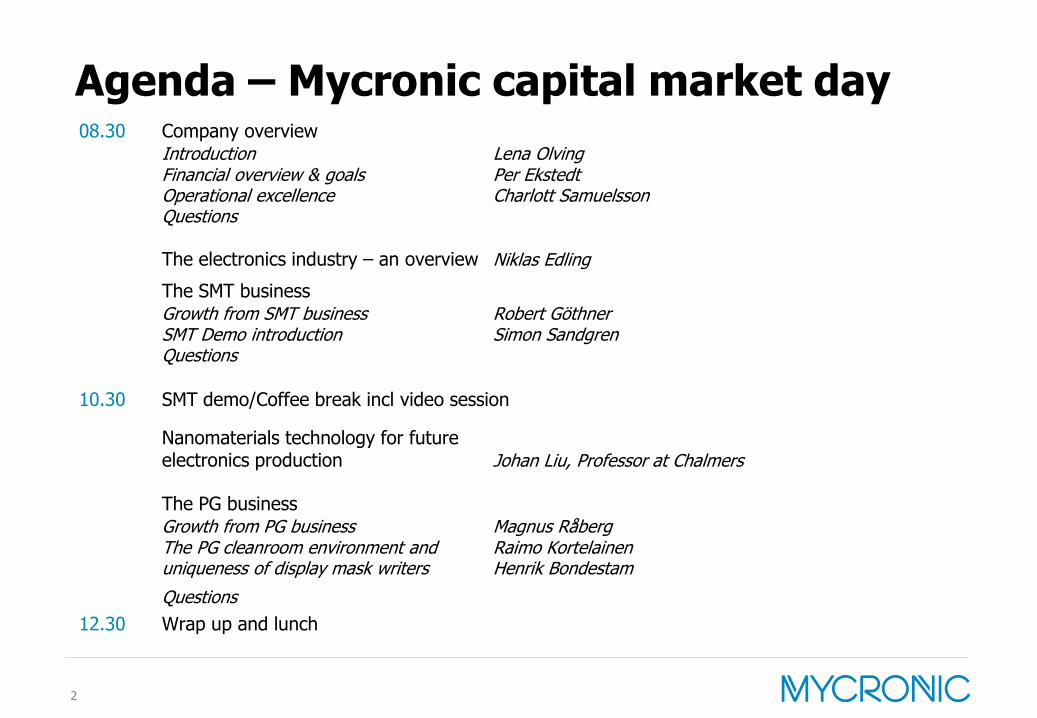
Agenda – Mycronic capital market day 08.30 Company overview Introduction Lena Olving Financial overview & goals Per Ekstedt Operational excellence Charlott Samuelsson Questions
The electronics industry – an overview Niklas Edling
The SMT business Growth from SMT business Robert Göthner SMT Demo introduction Simon Sandgren Questions
10.30 SMT demo/Coffee break incl video session
Nanomaterials technology for future electronics production Johan Liu, Professor at Chalmers
The PG business Growth from PG business Magnus Råberg The PG cleanroom environment and Raimo Kortelainen uniqueness of display mask writers Henrik Bondestam
Questions
12.30 Wrap up and lunch
2

References to videos shown
A day of made of glass: Enabling a future of communication, collaboration and connectivity
A video made by Corning Incorporated, the world leader in specialty glass and ceramics
Link: https://www.youtube.com/watch?v=PfgmlVxLC9w
Large size photomask production: The processes of manufacturing large size photomasks and displays
A video made by SK Electronics, a world leading company in advanced photomask production
Link:http://www.sk-el.co.jp/en/company/movie.html
SK Electronics has provided the video giving us the opportunity to show the manufacturing processes of photomasks and displays.
3

Capital Market day at Mycronic An introduction and company overview Lena Olving, CEO

Mycronic operates in a growing market 1,678 BUSD industry
5
* Expected growth
Source: Prismark, 2014
2,500
2,000
500
1,500
1,000
0
2007 2018
Billion USD

Contributing to everyday life – today and in the future
Mycronic contributes to everyday life
6
Our technology contributes to the manufacturing of displays at a value corresponding to 25% of Sweden’s GDP
Our technology produces around 100 million PCBs corresponding a value of 30 BUSD

Technology trends – driving market
LED lighting CAGR above 30%
Wearable electronics 500 million devices sold 2018, CAGR 50% Trends
Internet of things 20 to 50 billion connections 2020, CAGR 20%-35%
Automotive electronics 244 BUSD 2018, CAGR 6.6%
7

Mycronic in the electronics industry
8
>2,200 customers
supported by solutions from
two business areas SMT and PG. - SMT for mounting components on PCBs - PG for the production of photomasks
520 employees in 11 countries, whereof one third in product development
50 countries market coverage through subsidiaries and distributors
98 % of total revenues
from exports
40 years of high-tech innovation
experience
420 patents strong IP portfolio
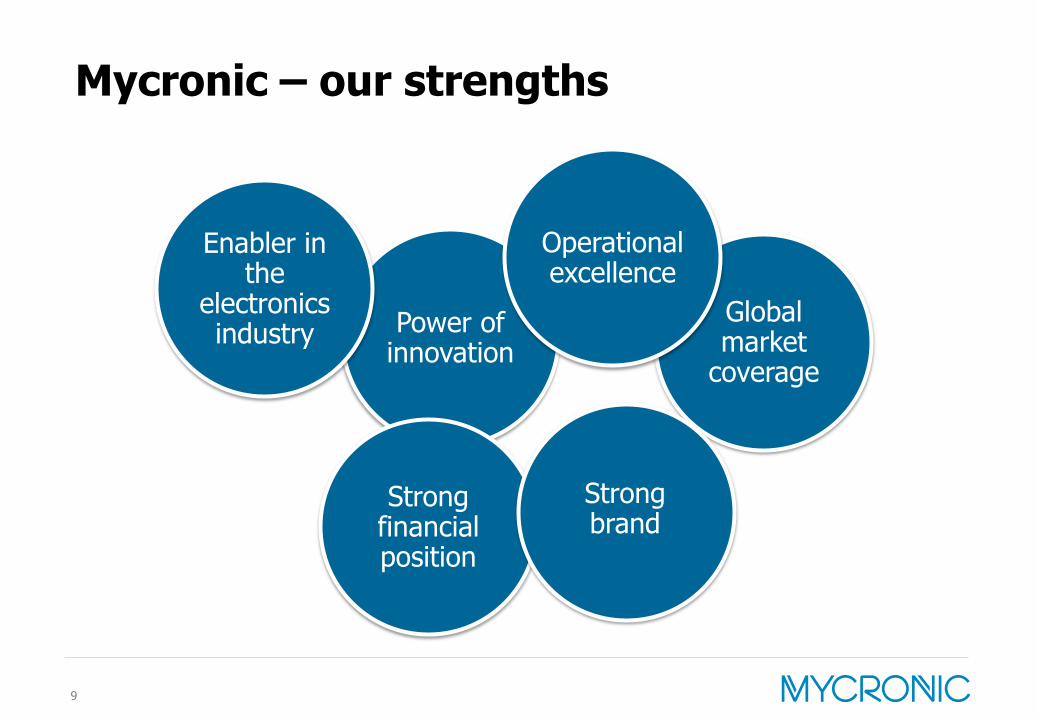
Mycronic – our strengths
9
Power of innovation
Global market
coverage
Enabler in the
electronics industry
Strong financial position
Operational excellence
Strong brand

Mycronic main goal and means
Profitable growth
target to reach 2 BSEK
Means
10
Product road map
Sourcing in LCC
COGS down
Go-to-market

Financial targets For long term growth and profitability Per Ekstedt, CFO
12
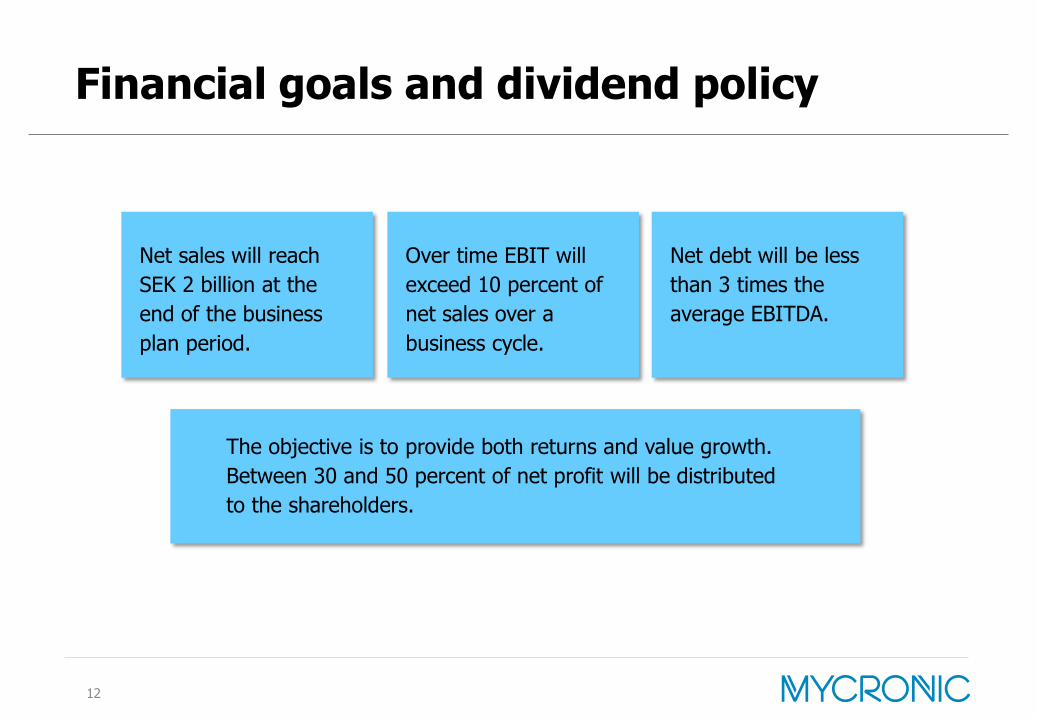
Financial goals and dividend policy
The objective is to provide both returns and value growth.
Between 30 and 50 percent of net profit will be distributed
to the shareholders.
Net sales will reach
SEK 2 billion at the
end of the business
plan period.
Over time EBIT will
exceed 10 percent of
net sales over a
business cycle.
Net debt will be less
than 3 times the
average EBITDA.

Financial summary Q3, 2014
• Strong order intake and order backlog of MSEK 740
• Including seven mask writers in five different segments of the photomask market
• Continued positive SMT sales development
• Stable gross margin
• Profitable at EBIT level five quarters in a row
• Strong cash position
• Product launches
• Launch of MY200 completed
• MY600
• Prexision-80
13

0,0
0,4
0,8
1,2
1,6
2,0
0
200
400
600
800
1 000
1 200
1 400
1 600
1 800
2 000
2 200
Q110 Q210 Q310 Q410 Q111 Q211 Q311 Q411 Q112 Q212 Q312 Q412 Q113 Q213 Q313 Q413 Q114 Q214 Q314
Sales Order intake Book-to-bill
Order intake and net sales Rolling 4 quarters
14
• Order intake rolling 4 quarters at 1,784 MSEK
• Book-to-bill ratio over 1 during 5 quarters in a row
Order intake/sales, MSEK
Book-to-bill
Long-term goal Net sales will reach 2 BSEK at the end of the business plan period.

10%
20%
30%
40%
50%
60%
Q110 Q210 Q310 Q410 Q111 Q211 Q311 Q411 Q112 Q212 Q312 Q412 Q113 Q213 Q313 Q413 Q114 Q214 Q314
Gross margin, 4 quarters rolling
15
Profitability
• Strong gross margin effects the EBIT margin
• Gross margin in Q3 2014 somewhat affected by unfavorable product mix in PG
-30%
-20%
-10%
0%
10%
20%
Q110 Q210 Q310 Q410 Q111 Q211 Q311 Q411 Q112 Q212 Q312 Q412 Q113 Q213 Q313 Q413 Q114 Q214 Q314
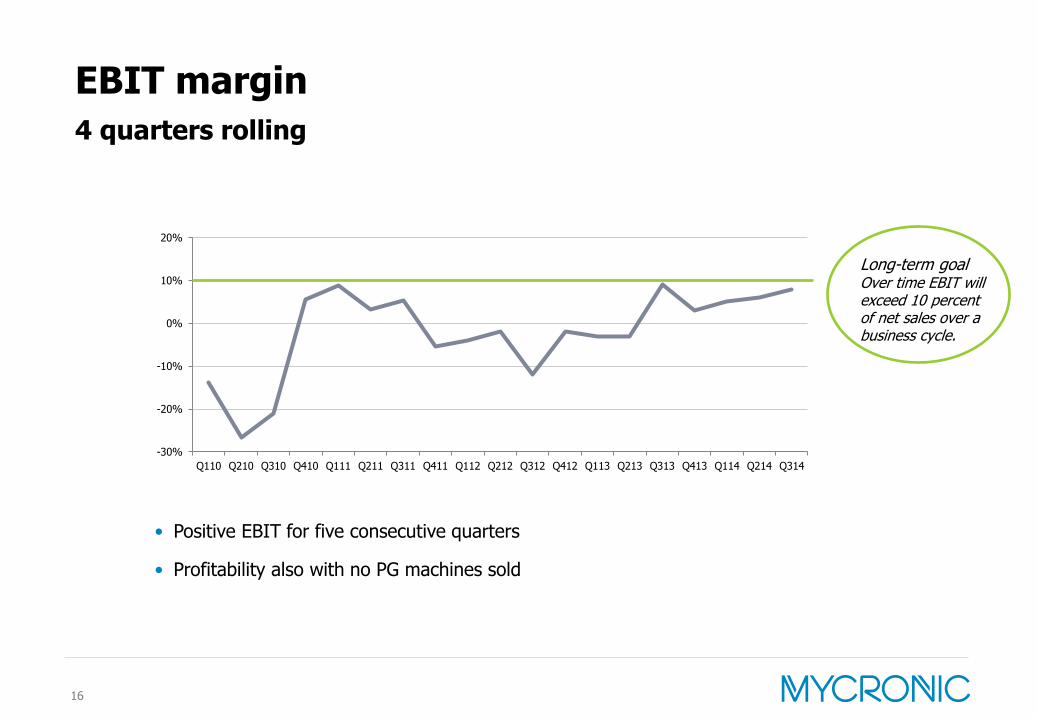
4 quarters rolling
16
EBIT margin
Long-term goal Over time EBIT will exceed 10 percent of net sales over a business cycle.
• Positive EBIT for five consecutive quarters
• Profitability also with no PG machines sold

-150
-100
-50
0
50
100
150
200
250
0
100
200
300
400
500
600
Q110Q210Q310Q410Q111Q211Q311Q411Q112Q212Q312Q412Q113Q213Q313Q413Q114Q214Q314
Cash balance Operating cash flow, 12M rolling
17
4 quarters rolling
Strong cash flow and financial position Cash
bala
nce
Opera
ting c
ash
flo
w
MSEK MSEK
• Dividend of MSEK 245 paid out 6 August, 2014
• Solid cash balance for future growth, both organic and by acquisitions
• Periodically large PG orders with advance payment from customers affects cash
-50 -100
-150

18
Profitable growth
Technological development, operational excellence, go-to-market model and solid aftermarket are drivers to reach the goals
Net sales will reach SEK 2 billion
at the end of the business plan
period.
Over time EBIT will exceed
10 percent of net sales over
a business cycle.
Operational Excellence For long-term profitability
Charlott Samuelsson, SVP Operational excellence

Operational excellence
Operational excellence function added into Corporate management team in June 2014
• Execution of strategy to reach growth and profitability
• Operational Development to achieve excellence
• Change Management to meet challenges
• ICT (Information Communication Technology) to enable business
• Quality to assure success
20
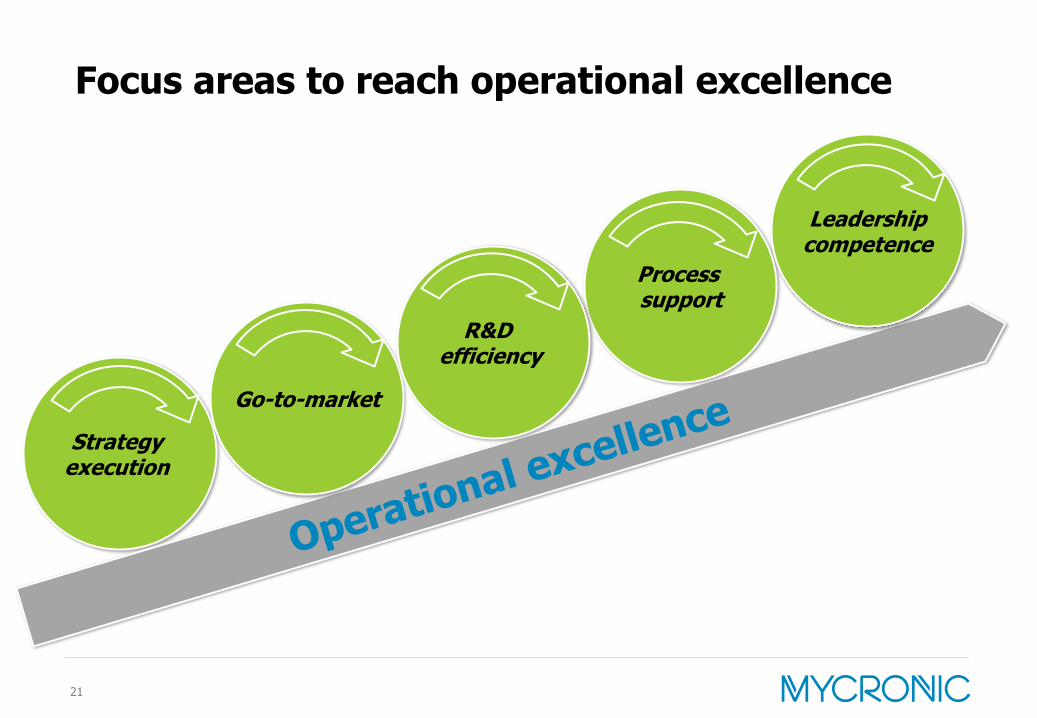
Focus areas to reach operational excellence
21
Strategy execution
Go-to-market
Process support
R&D efficiency
Leadership competence

Total quality cost
Supplier consolidation
Value engineering
New development
Improved Profitability Through reduction of product cost
22
LCC sourcing

Systematic approach
Strategy execution through continuous follow-up
Operational development through measurable tracking
Change management through supporting processes
to reach growth and profitability
23

The electronics industry a growing industry Niklas Edling, SVP Operations and Strategic Product Management

Where is development heading
25
26
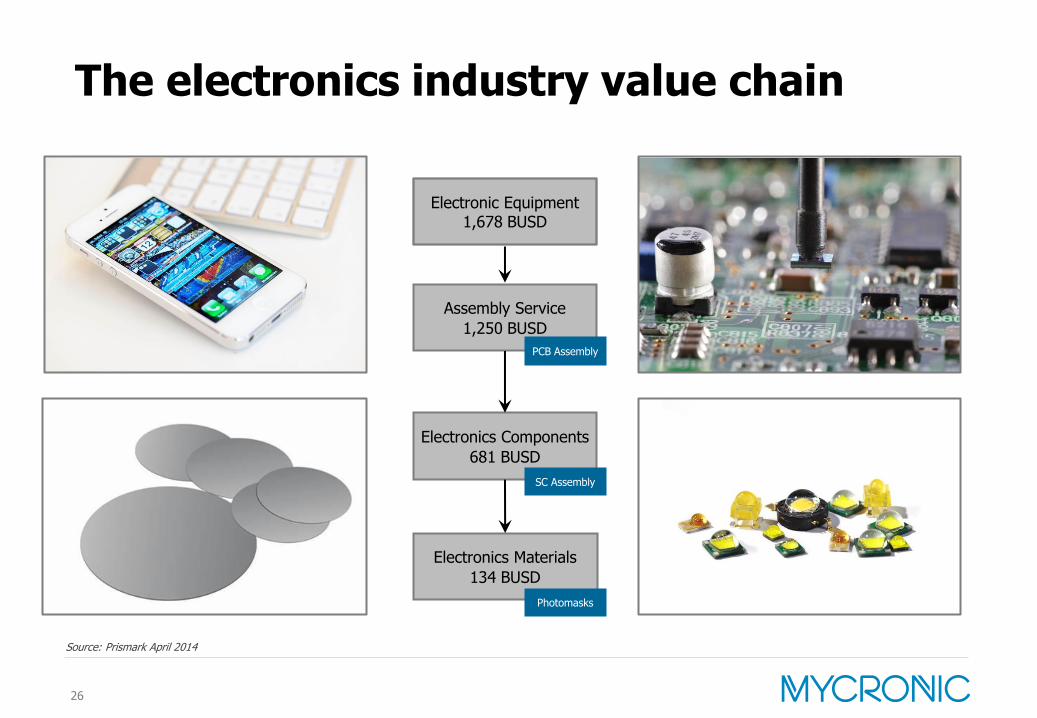
The electronics industry value chain
Electronic Equipment 1,678 BUSD
Assembly Service
1,250 BUSD
Electronics Components
681 BUSD
Electronics Materials
134 BUSD
PCB Assembly
SC Assembly
Photomasks
Source: Prismark April 2014
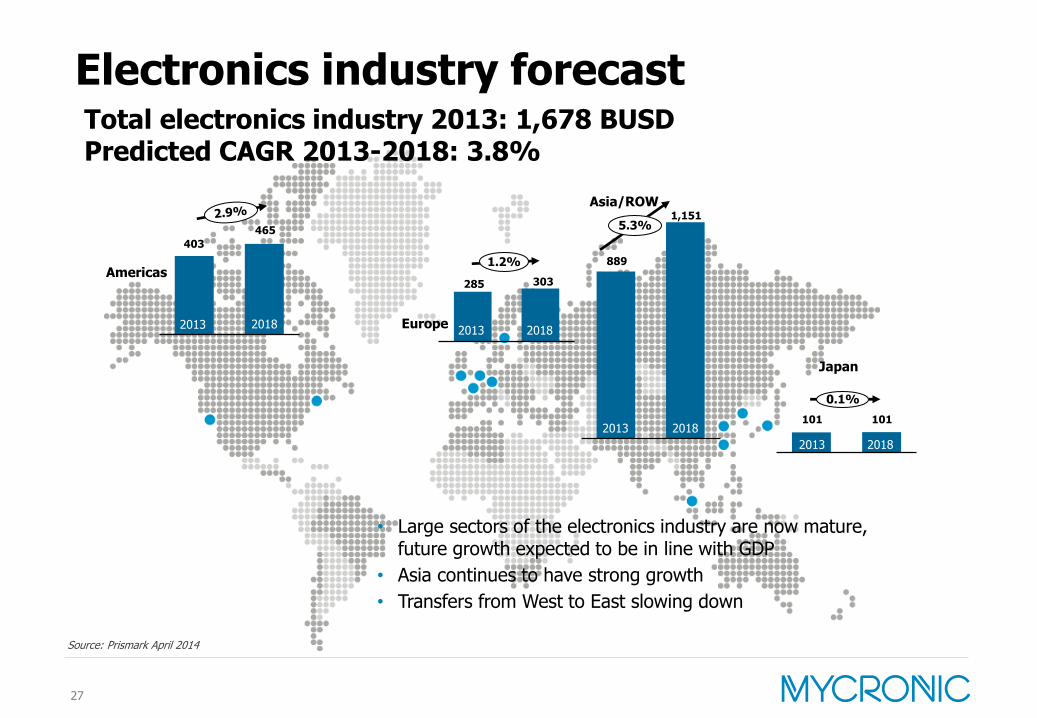
Total electronics industry 2013: 1,678 BUSD Predicted CAGR 2013-2018: 3.8%
Electronics industry forecast
27
403
465
Americas
2018 2013
101 101
2018 2013
Japan
2013 Europe
2018
303 285
1.2% 889
Asia/ROW
5.3% 1,151
2018 2013
• Large sectors of the electronics industry are now mature, future growth expected to be in line with GDP
• Asia continues to have strong growth
• Transfers from West to East slowing down
0.1%
Source: Prismark April 2014

Mobile phones
28
Main driver up until now
Volume
Miniaturization
152
310
2013 2008 2018
2008-2013 2013-2018
Revenue +13% +3%
Units +6% +6%
Revenue BUSD
Functionality
Resolution
355
Source: Prismark April 2014

29
Future technology drivers
Trends
Internet of Things 20Bn to 50Bn connections 2020, CAGR 20%-35%
Wearable Electronics 500M devices sold 2018, CAGR 50%
Automotive Electronics 244 BUSD 2018, CAGR 6.6%
LED lighting CAGR above 30%
for the electronics industry
Source: Prismark April 2014

Internet of Things
30
4
11
2020 2014 2008
Billion units Safety
Quality
Cost
50
Source: The Connectivist May 2014
• Computers • Smart watches • Smart metering
devices
• Toothbrushes • Wind turbines • Traffic Lights • Safety systems

Wearable electronics
31
0 30
2018 2008 2013
Million units
Energy consumption
Cost
500
Product variation
Source: Prismark April 2014

Automotive electronics
32
125
178
2018 2008 2013
Revenue BUSD
2008-2013 2013-2018
Vehicle production +4% +4%
Electronic content per vehicle +2% +3%
Safety
Quality
244
Product variation
Source: Prismark April 2014

LED lighting
33
Panel Area
2023 2021 2011 2013 2025 2015 2017 2019
LED lighting Conventional lighting
Process standardization
Growth
Source: Prismark April 2014
Surface Mount Technology For profitable growth
Robert Göthner, SVP Business area SMT

Offerings
• Jet printing (unique)
• Pick & Place assembly machine
• Component storage system
• Advanced software suite
• Service and support
Solutions are designed to offer high-mix customers cost efficient production and high utilization
Leader in high-mix electronics production
jet printing technology
automated storage
agile assembly equipment
intelligent Agilis feeders
powerful SW tools
35

36
The SMT market by customer segments
• 70% of the worldwide market is in Asia - dominated by high volume production
• China represents 50% of worldwide SMT equipment market
• 30% in NA and EMEA. A higher degree of low/mid volume production of high value electronics
Consumer electronics
Handheld devices
LAPTOP/PCs
Automotive
Telecom/Computers
Industrial applications
Medical
Aviation, Military
High Volume 63%
Volume
Mix
Low Medium High
Hig
h
Lo
w
Me
diu
m
SMT equipment market value 4 BUSD 2013 (Pick & Place, screen printing, soldering, inspection equipment)
Mid volume 29%
Low 8%

Pick & Place - Competitive environment
High volume Low volume Medium volume
• Highly competitive market place
• Top 3 players have 60% market share
• Mid players consolidate/merge - Juki/Sony, Yamaha/Hitachi/iPulse
• Mycronic well positioned in high-mix (low to medium volume)
37

Mycronic market position
• Largest markets • North America
• Germany, France, Scandinavia and UK
• Growing in China
• Market coverage in 50 countries • Strong channel partner network
• 3 application centers
• 24/ support worldwide
• More than 4,500 systems at >2,200 customers
• Industry segments • Industrial electronics, automotive,
medical, military, aviation/space
• Even split between OEM and contract manufacturers
Market leader in the high-mix segment
38

Mycronic’s offering to high-mix customers
• High utilization
• Fast change-overs
• Low number of operators
• Effective inventory control
• High accuracy
• Ability to produce all types of boards
39

Market dynamics and trends
40
Effects on PCB assembly process
Cost pressure in electronics manufacturing
• Cost per placement • Higher speed lines • Higher utilization, quality & yield
Build to order • Higher mix and shorter batches • New product turn around time • Logistics and material handling
Increased complexity and miniaturization
• Component range increase – smaller and bigger • More complex boards • Semiconductor – LED, new packaging/devices
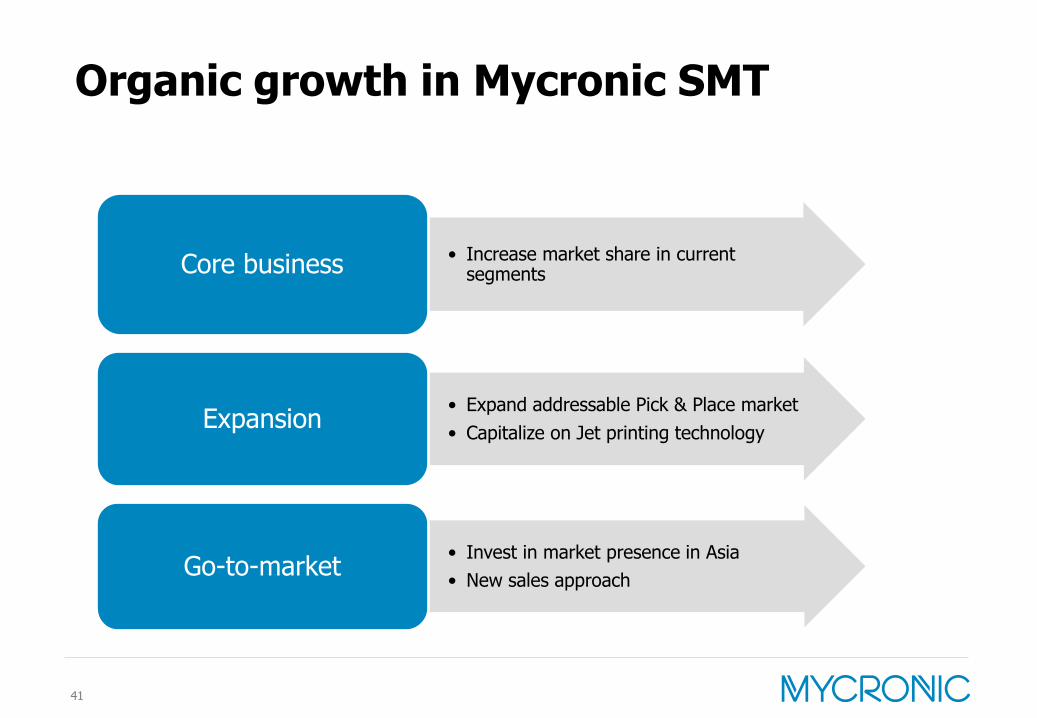
Organic growth in Mycronic SMT
• Increase market share in current segments Core business
• Expand addressable Pick & Place market
• Capitalize on Jet printing technology
Expansion
• Invest in market presence in Asia
• New sales approach Go-to-market
41

Technologies for applying fluids
42
stencil printing – solder paste
• Industry standard technology
• Fast cycle time
• Use of stencils
Solder paste printed on a PCB
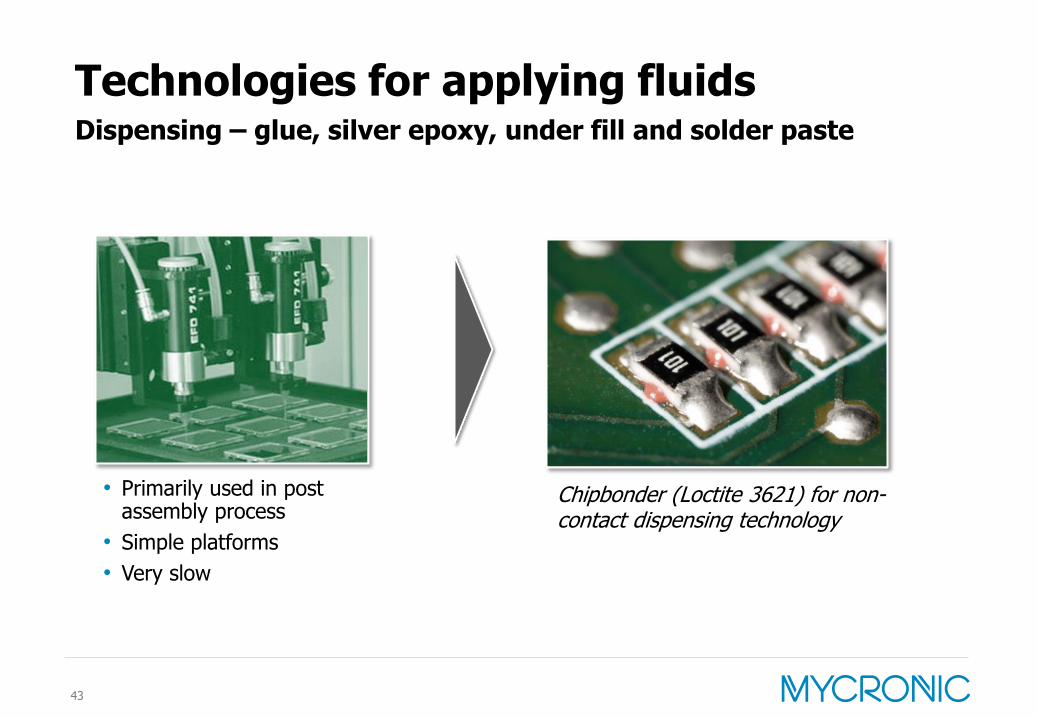
Technologies for applying fluids
43
Dispensing – glue, silver epoxy, under fill and solder paste
Chipbonder (Loctite 3621) for non-contact dispensing technology
• Primarily used in post assembly process
• Simple platforms
• Very slow
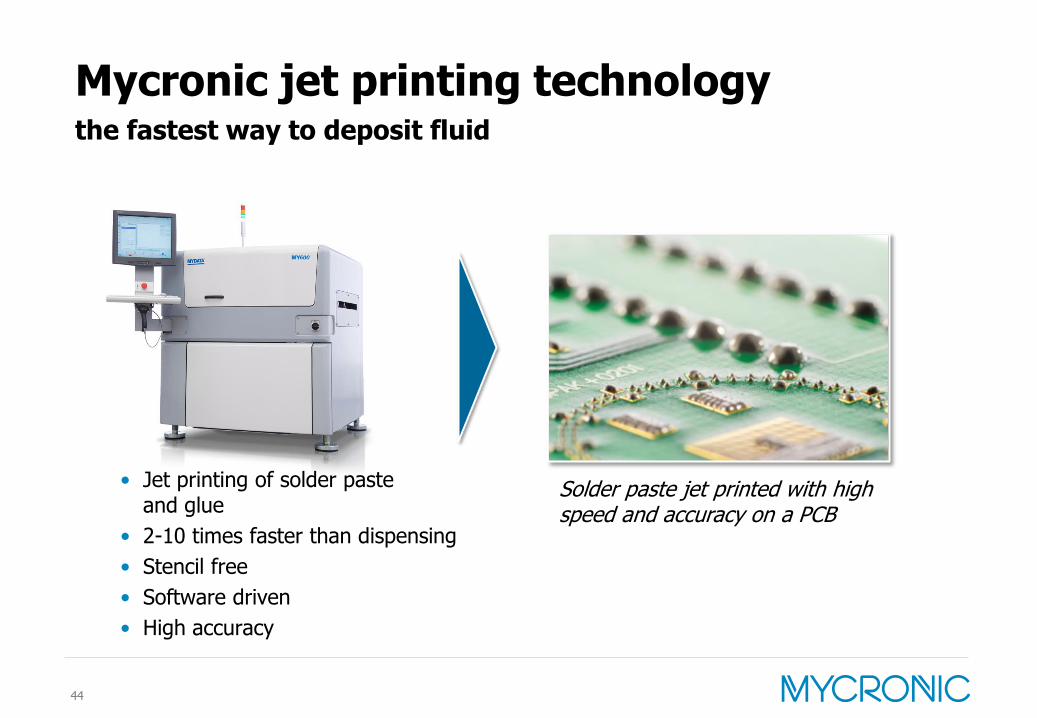
Mycronic jet printing technology
• Jet printing of solder paste and glue
• 2-10 times faster than dispensing
• Stencil free
• Software driven
• High accuracy
the fastest way to deposit fluid
44
Solder paste jet printed with high speed and accuracy on a PCB

Strong technology trends
Technology drivers
• Miniturisation
• Mixing large and small components
• Higher density boards
• 3D electronics and boards
• New semiconductor packaging
• New LED technology
• Hybrid packaging/devices
• Flexible boards
drive need for new capabilities on equipment
45
Stencil printers
Dispensers
• Difficult to do everything on the board
• Very slow, not cost effective
• Accuracy challenging
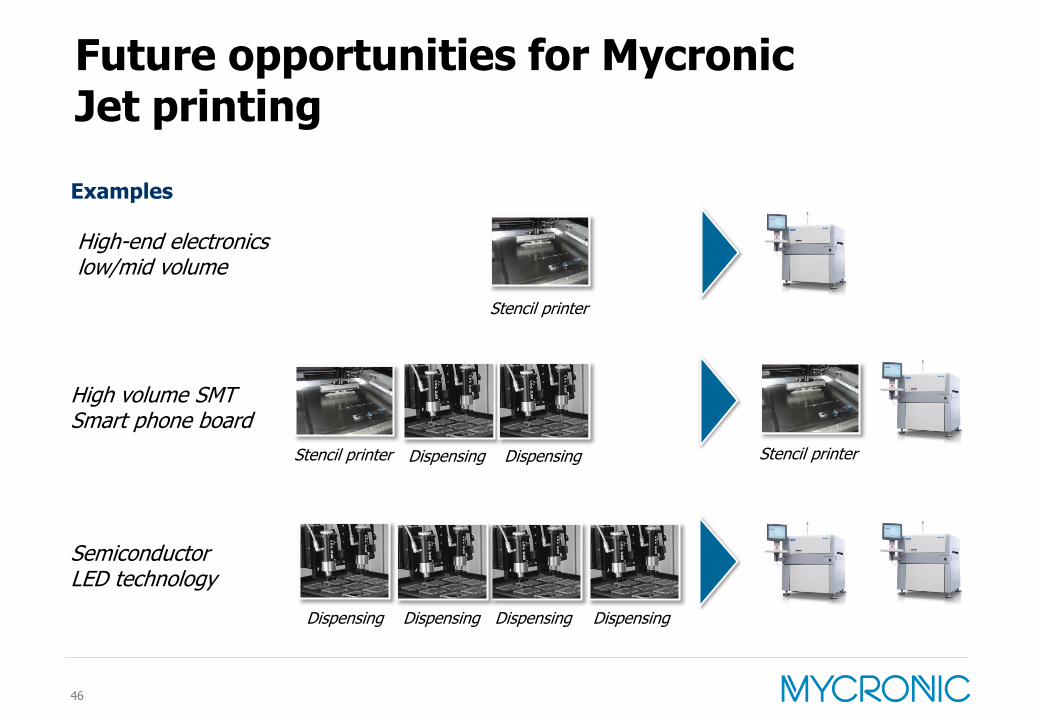
Future opportunities for Mycronic Jet printing
46
Stencil printer
High-end electronics low/mid volume
High volume SMT Smart phone board
Semiconductor LED technology
Stencil printer Stencil printer Dispensing Dispensing
Dispensing Dispensing Dispensing Dispensing
Examples
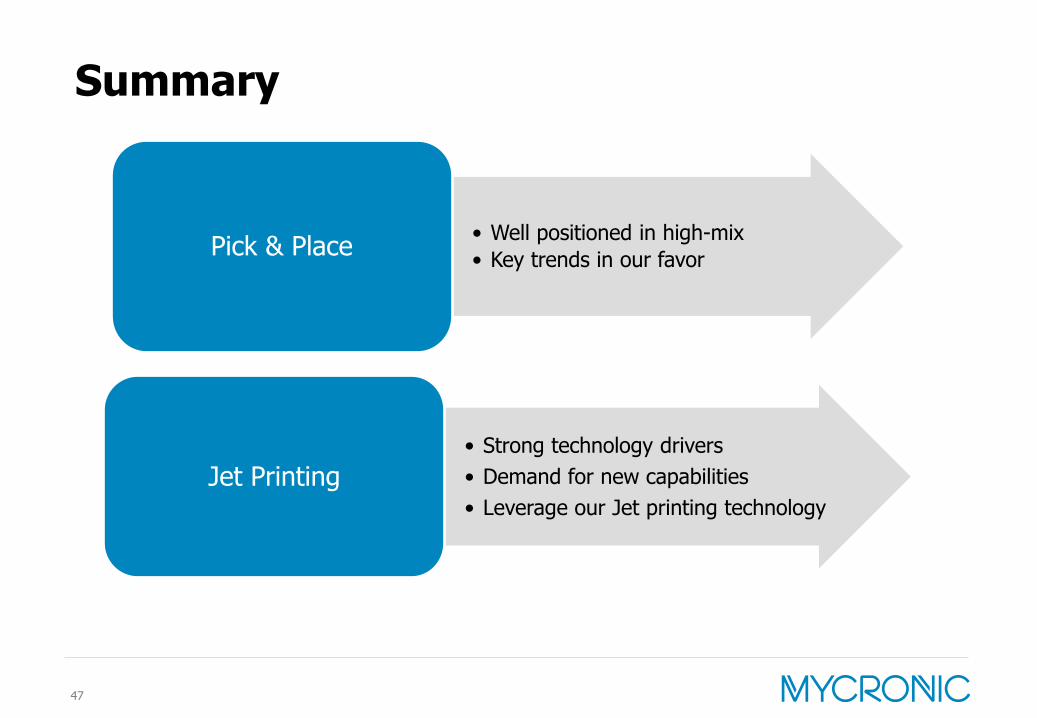
Summary
• Well positioned in high-mix
• Key trends in our favor Pick & Place
• Strong technology drivers
• Demand for new capabilities
• Leverage our Jet printing technology
Jet Printing
47

Mycronic SMT offering – demo introduction
Simon Sandgren, Marketing director Business area SMT

Electronics production SMT assembly process
solder paste application
component assembly
storage of components
0.4×0.2 to 80×80 mm mg to hg
components
products
49
mm2 to m2
g to kg
circuit boards
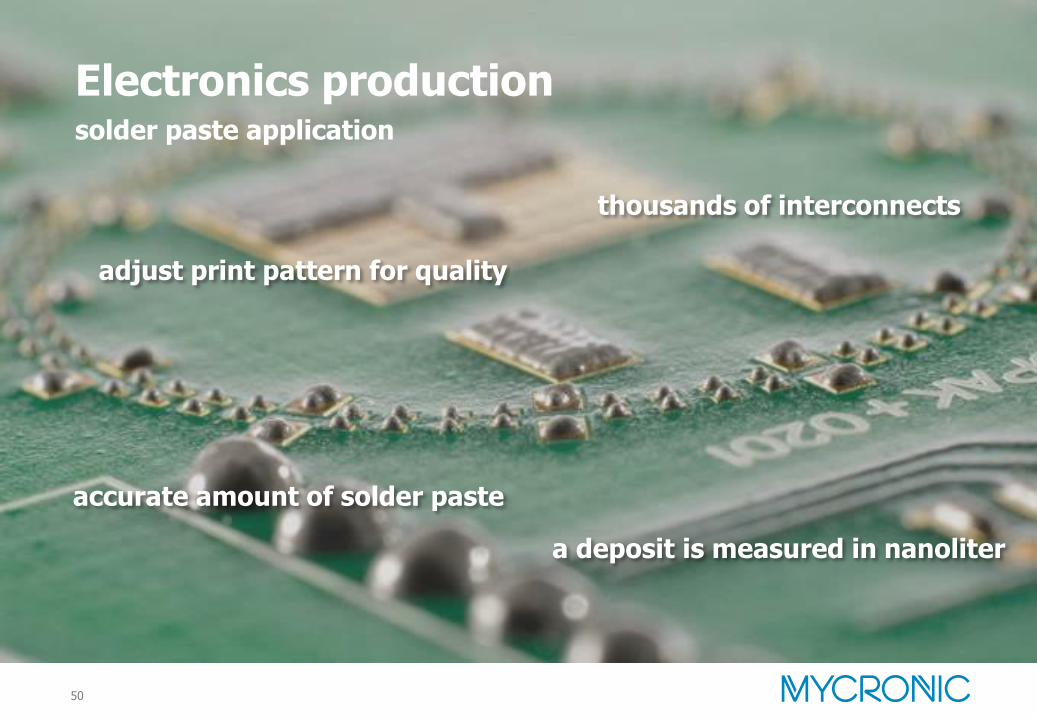
Electronics production solder paste application
thousands of interconnects
accurate amount of solder paste
adjust print pattern for quality
a deposit is measured in nanoliter
50

Mycronic jet printing technology the fastest way to perfect solder joints
*dph = dots per hour
• non-contact • 1,080,000 dph* • on-the-fly • optimize print pattern • software driven
51

Electronics production component assembly
100 different parts on a board
up to 1000 placements
10 placements per second vision inspection
micrometer accuracy
accurate force control
52

Mycronic assembly technology agile solutions boosting productivity
MY200 performance series designed for agile electronics assembly at speeds up to 50,000 cph
advanced machine vision
unmatched set-up times
mount any component on any board
software driven ease of use
test before place
53
Nanomaterials technology for future electronics production – a guest lecture
Johan Liu, Professor in Electronics Production

Johan Liu, Professor in Electronics Production Professor Johan Liu graduated with a master and Ph D degree in Materials Science and Engineering from the Royal Institute of Technology, Stockholm, Sweden in 1984 and 1989 respectively. He served in various positions at the Swedish Institute for Production Research (IVF), Gothenburg as project manager, group leader and division manager between 1989 and 1999. He is since then a full professor in electronics production, Chalmers University of Technology, Sweden. As a member of the Royal Swedish Academy of Engineering Sciences, a Fellow of IEEE and a member of the European Nanoelectronics Association (Aeneas), he has published 2 books, 450 papers in journals, conference proceedings and 15 book chapters. He has 45 patents accepted or filed and has given 45 key note/invited talks during the last 20 years. In addition, he is one of the founding members of the SHT Smart High Tech AB and 3Dtro AB and serves on the Scientific Advisory Board for Henkel, Pacific Region.
55
Pattern Generators
For profitable growth
Magnus Råberg, SVP Business area PG

The photomask
the link between design and mass production of electronics
57
Design data file
Mask writer
Display layers
Aligner, copy process
New product idea
End product
Photomask
Display substrates

10-15 photomasks needed to create a display
Mask Shop
Drivers for photomask demand:
New display designs, R&D work and number of production lines
The manufacturing process What drives demand of photomasks
New product idea
Aligner, copy process
5-15 million mobile displays per month
Panel maker
58

Display
Business area PG offerings Unique position in the display segment
59
Prexision series
Semiconductor
Sigma and Omega
Multi Purpose
FPS
Recurring aftermarket business
• Revenue from service contracts and upgrades
• >90% of systems in use are supported by Mycronic
• >80% on annual service contracts

Mycronic’s Prexision-80 delivers nanometer placement accuracy
Mycronic mask writers offering nanometer precision
1 meter 100 mikrometer 10 cm 1 millimeter 1 cm 100 nanometer 1 mikrometer 10 mikrometer 1 ångström 1 nanometer 10 nanometer
Child Hand Hair Red blood cell Bacteria Virus Hemoglobin
60

0
20
40
60
80
100
120
140
160
180
200
2012 2013 2014 2015 2016 2017
Display market expected to grow
Forecast of total display area produced
• Total display market revenue 130 BUSD
• Display market expected to grow over the coming years
• More advanced displays in mobile applications
• Strong TV market
• Additional products with displays continuously increase
Source: DisplaySearch, October 2014
Million
square meter
61

Driving photomask demand
Display trends Current and future…
TV development 4K & 8K
Display size trend Resolution trend in mobile devices
Flexible displays AMOLED displays Display manufacturing in China
62
31
33
38
41
25
30
35
40
45
2005 2010 2015 2020
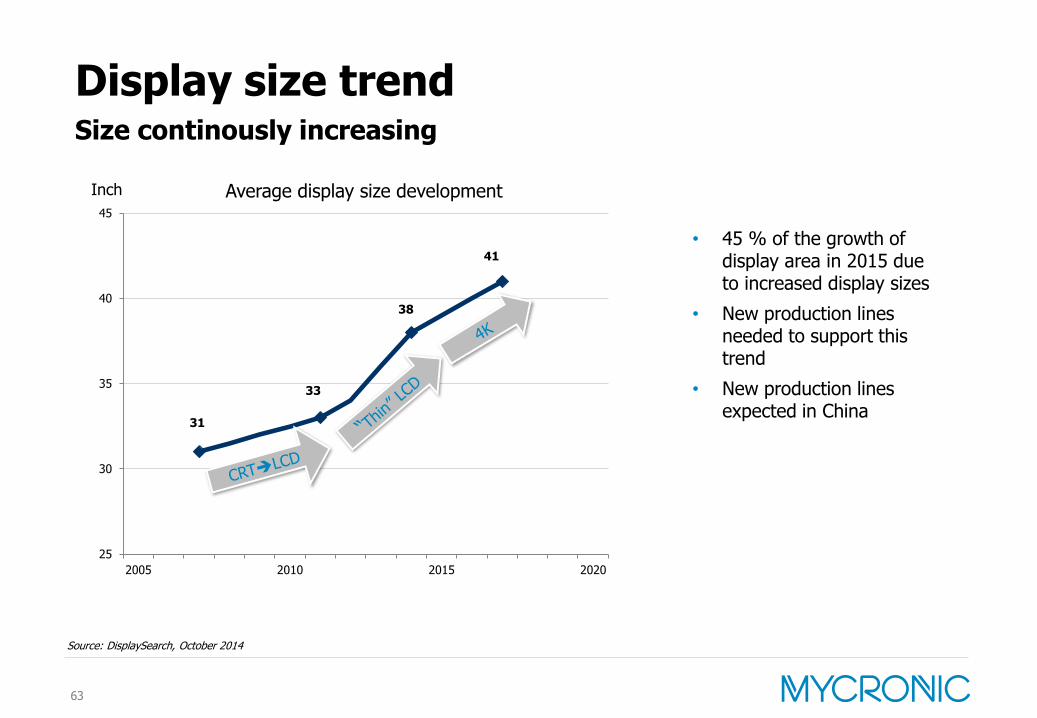
Display size trend Size continously increasing
Inch Average display size development
• 45 % of the growth of display area in 2015 due to increased display sizes
• New production lines needed to support this trend
• New production lines expected in China
Source: DisplaySearch, October 2014
63
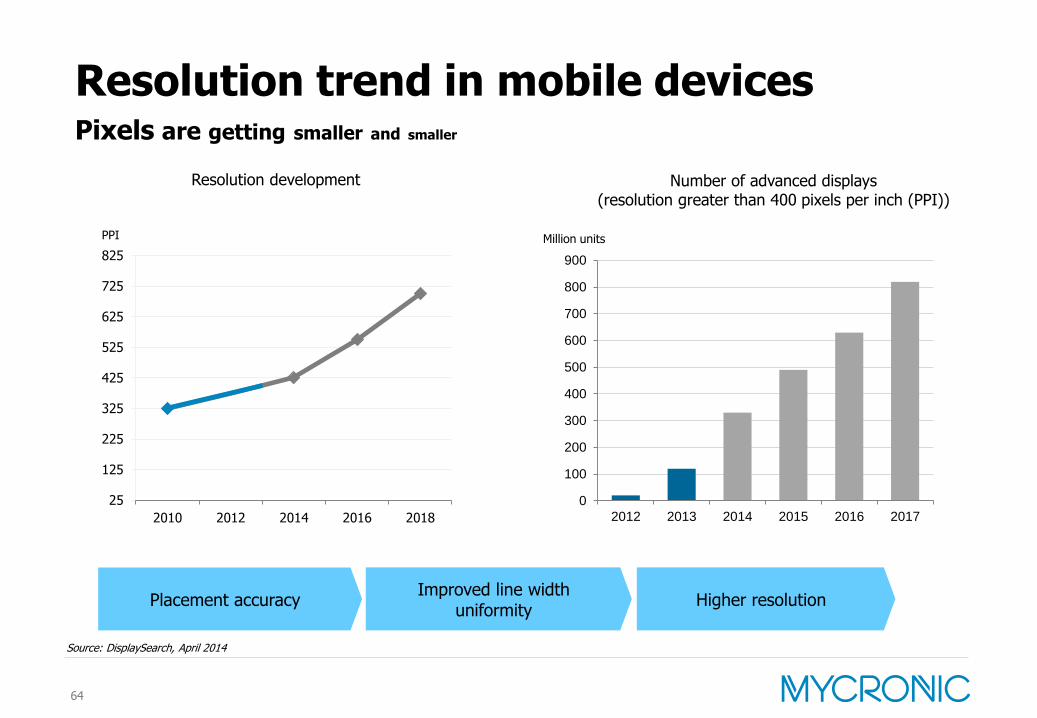
Resolution trend in mobile devices Pixels are getting smaller and smaller
Million units
Number of advanced displays (resolution greater than 400 pixels per inch (PPI))
Source: DisplaySearch, April 2014
0
100
200
300
400
500
600
700
800
900
2012 2013 2014 2015 2016 2017
Placement accuracy Higher resolution Improved line width
uniformity
64
PPI
Resolution development
25
125
225
325
425
525
625
725
825
2010 2012 2014 2016 2018
0
4 000
8 000
12 000
16 000
2003 2005 2007 2009 2011 2013 2015 2017
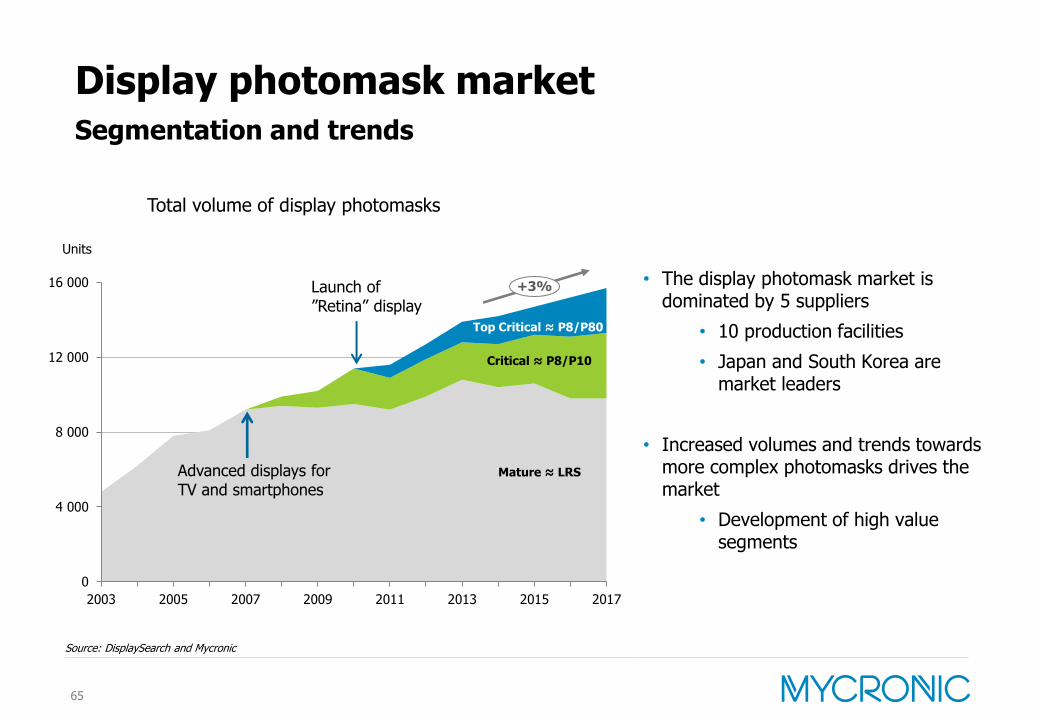
Display photomask market Segmentation and trends
Total volume of display photomasks
Source: DisplaySearch and Mycronic
Units
+3%
Advanced displays for TV and smartphones
Launch of ”Retina” display
Top Critical ≈ P8/P80
Critical ≈ P8/P10
Mature ≈ LRS
• The display photomask market is dominated by 5 suppliers
• 10 production facilities
• Japan and South Korea are market leaders
• Increased volumes and trends towards more complex photomasks drives the market
• Development of high value segments
65

Installed base of display mask writers
66
• 65 display mask writers installed since 2000, whereof 25-30 advanced mask writers
• More than 70% are older than 8 years.
• Still a large market for these photomasks
• Systems are used in controlled environments and are regularly maintained
• Over time it will be harder to support older systems
• A replacement strategy has been initiated to address long term demand
The systems will be replaced over
a long time and under controlled circumstances

Mycronic has unique skills in large photomasks
Mycronic has a unique position
67
supplying the entire display industry with mask writers
Photomasks up to 1800x2000 mm
Photo: Courtesy of SKE Electronics
”The mura challenge” - a Japanese word meaning irregularity ”
Pattern Generators
PG production environment
Raimo Kortelainen, Director Technical center PG Henrik Bondestam, Sr Specialist PG

Mycronic cleanroom environment
69
High requirements on cleanliness – without particles

Restrictions on particles even small particles are big in a cleanroom
1 meter 100 mikrometer 10 cm 1 millimeter 1 cm 100 nanometer 1 mikrometer 10 mikrometer 1 ångström 1 nanometer 10 nanometer
Child Hand Hair Red blood cell Bacteria Virus Hemoglobin
70
Cleanroom classification 1: 1 particle of 0.5 micrometer/cubic foot air

Prexision inside
71

Imagine a photomask big as a football field
...on a football field the mask writer would write lines thinner than a hair
…and would place it with an accuracy better than the size of a blood cell
72
1 micro- meter line
8 micro- meter

• AMOLED Active Matrix Organic Light-Emitting Diode
• CAGR Compound Annual Growth Rate
• COGS Cost Of Goods Sold
• CPH Components Per Hour
• CRT Cathod Ray Tube
• EBIT Earnings Before Interest and Taxes
• EBITDA Earnings Before Interest, Taxes, Depreciation and Amortization
• EMEA Europe, the Middle East and Africa
• GDP Gross Domestic Product
• kCPH kilo Components Per Hour
• LCC Low Cost Countries
• LCD Liquid Crystal Display
• LED Light Emitting Diodes
• OEM Original Equipment Manufacturer
• PCB Printed Circuit Board
• PG Pattern Generator
• PPI Pixels Per Inch
• ROW Rest Of the World
• SC Semiconductor
• SMT Surface Mount Technology
• TFT-LCD Thin Film Transistor-Liquid Crystal Display
Abbreviations