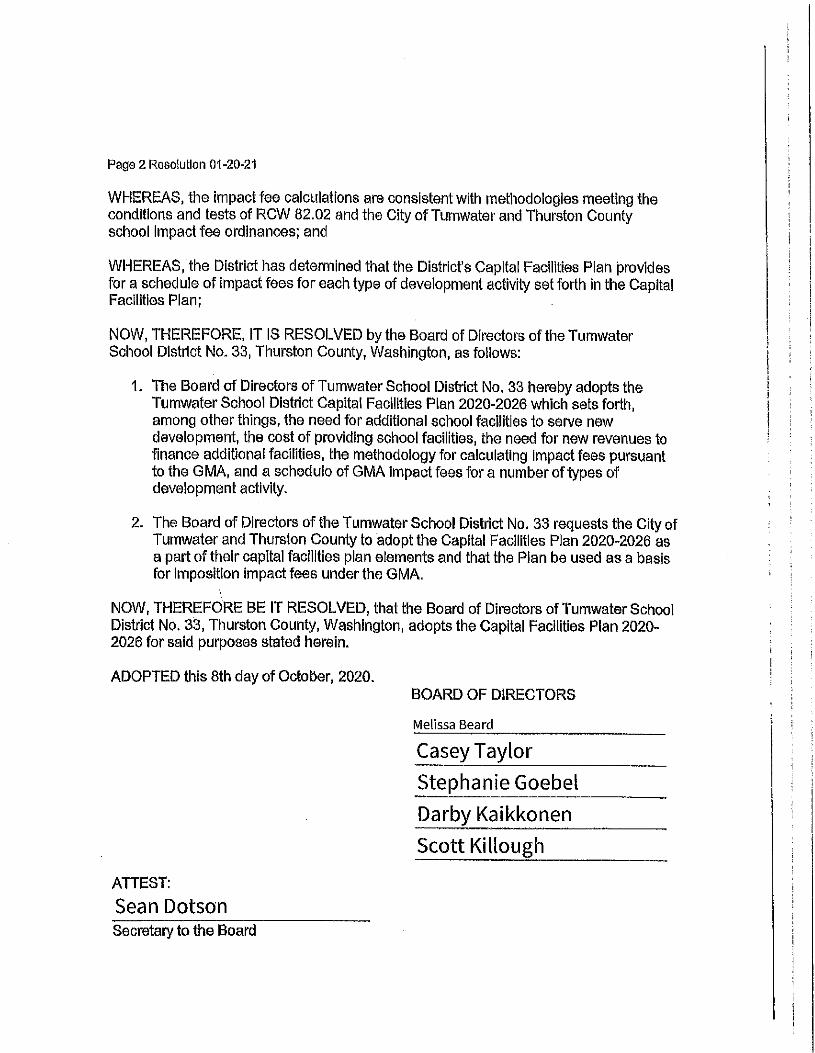
capital facilities plan 2020 2026
TRANSCRIPT

CAPITAL FACILITIES PLAN
2020 – 2026
Tumwater, Washington
October 2020
Please contact the
Capital Projects Department with any questions
360-709-7005

TABLE OF CONTENTS
ADOPTING RESOLUTION
CHAPTER ONE INTRODUCTION / COVID-19 STATEMENT
CHAPTER TWO BACKGROUND-GROWTH LEGISLATION
CHAPTER THREE SCHOOL DISTRICT DESCRIPTION
CHAPTER FOUR ENROLLMENT
CHAPTER FIVE LEVEL OF SERVICE
CHAPTER SIX FINANCING
CHAPTER SEVEN CONSTRUCTION PROGRAM
CHAPTER EIGHT FINANCIAL PLAN
CHAPTER NINE ASSESSED VALUATION
CHAPTER TEN EXISTING DEBT
CHAPTER ELEVEN IMPACT FEE CALCULATION
APPENDIX A
Table 1 Level of Service of Existing Schools
Table 2 District October Enrollment Forecast
Table 3 Demand vs. Supply of School Facilities
Table 4 Development Costs
Table 5 Six-Year Capital Facilities Plan
Table 6 Current Capital Debt
Table 7 Debt Capacity
Table 8 Student Generation Rate Multipliers
APPENDIX B School Impact Fee Calculation
ATTACHMENT A District Map & NEW Attendance Areas
ATTACHMENT B Vacant Property & Conceptual Site Plans
ATTACHMENT C Student Generation Rate Study
ATTACHMENT D District Enrollment Forecast


2
CHAPTER ONE
INTRODUCTION
The six-year Capital Facilities Plan is an annual evaluation of the Tumwater School
District’s capital facilities with a focus on its schools, their capacity and ability to
accommodate population growth. The Plan assesses the impact of school enrollment
growth, including new students from new residential development, on those facilities and
plans accordingly to ensure that adequate school facilities can be provided to meet the
additional demand in a timely manner.
Residential development and school construction typically do not occur in an orderly and
coordinated manner. While the selection of school sites may precede the construction of
new housing, the actual construction of school buildings usually follows the growth in
residential home construction by a number of years. This lag in providing school
facilities is due to a number of limiting factors. These factors are discussed at length
within this document.
SPECIAL STATEMENT ABOUT COVID-19
The impacts of the worldwide Covid-19 pandemic began affecting the Tumwater School
District in March 2020. Schools in the District, along with the rest of Washington State,
were closed and an emergency switch to remote on-line learning was instituted. Through
spring and summer, the District developed plans for three levels of return to learning: all
remote, remote with some in-person instruction and all in-person instruction. On July 31,
2020, Thurston County Public Health recommended all schools in the County use the all-
remote model for the start of school in September, which all school districts in the
County have done.
The effects of the pandemic on future enrollment and capacity as discussed in the Capital
Facilities Plan are uncertain and the 2020 planning is the District’s best estimate given
information known as of the drafting of the Plan. At the same time, the District must
continue to plan for the future, based on the assumption that school operations will return
to a somewhat normal in-person learning model in the near future.
Home building in Tumwater School District remains robust, with the 2019-20 school
year seeing the most new housing built in the last twenty years. Home sales in the District
are strong and the District is seen as desirable place to live and raise children.
In order to estimate future enrollment, the 2019 enrollment by grade level was rolled over
for this year and the methodology used to project the future enrollment for the following
years remains as it has been in previous Capital Facilities Plans. The District plans to
monitor closely how the pandemic may affect enrollment growth, school infrastructure
needs, and capital planning and financing. The next annual update to the Capital
Facilities Plan in 2021 will include any relevant updated information.
.
3
CHAPTER TWO
BACKGROUND-GROWTH LEGISLATION
The Tumwater School District serves residents in the City of Tumwater and portions of
Thurston County. The City of Tumwater has adopted a school impact fee ordinance
pursuant to the Growth Management Act (GMA). Until 2013, Thurston County provided
for school mitigation under the State Environmental Policy Act (SEPA). In 2013, the
County adopted a GMA-based Impact Fee Ordinance that includes school impact fees
and replaces mitigation under SEPA. The basis for both of these programs is discussed
below.
State Environmental Policy Act (SEPA)
In an effort to acknowledge the effect of growth and mitigate those conditions, RCW
43.21C, the State Environmental Policy Act, authorizes local governmental jurisdictions
to impose conditions on the approval of development projects subject to SEPA review.
In addition, RCW 58.17.110 requires local jurisdictions, in their review of subdivision
applications, to determine and make findings that the particular subdivision makes
adequate provisions for, among other things, schools and school grounds. The
subdivision statute allows for dedication of land, provision of public improvements to
serve the subdivision and/or the imposition of mitigation fees as a condition of
subdivision approval. Absent a specific finding of appropriate provisions for schools and
school grounds, a plat must be denied. There are no avenues for securing school
mitigation from projects exempt from SEPA review and not subject to the subdivision
statute.
RCW 82.02.020 specifically prohibits imposition of fees on construction of buildings or
subdivision of land except for impact fees as defined by statutes (RCW 82.02.050-.090)
and except for voluntary agreements. Dedications of land within a proposed plat are not
precluded if such dedications are reasonably necessary as a direct result of the proposed
development.
RCW 82.02.020 allows voluntary agreements in lieu of a dedication of land or to mitigate
an impact as a consequence of development. The voluntary agreements have specific
qualifying provisions.
The State Environmental Policy Act prohibits a jurisdiction from requiring a person to
pay for a system improvement where that person is otherwise required to pay an impact
fee pursuant to RCW 82.02.050 - .090 for those same system improvements. WAC 392-
343-032 states that “mitigation payments as provided for in RCW 43.21C.060 of the
State Environmental Policy Act may be used by the district as local match funding and
may not be substituted for the amount of state assistance that would otherwise be
provided for school capital projects.”
Growth Management Act
The Growth Management Act (GMA) provides an opportunity for school districts to
broaden the source of funds to meet the needs to provide additional school facilities as a

4
result of growth in residential housing. The Act, originally passed in 1990 and amended
in subsequent years, includes elements addressing the impacts of development on
municipal corporations, such as school districts.
RCW 58.17.110, the State Subdivision Act, was amended to require denial of any plat
unless the county legislative body makes written findings that appropriate provisions are
made for schools and school grounds. Dedication of land, provision of public
improvements to serve the subdivision, and/or impact fees imposed under the act may be
required as a condition of subdivision approval.
RCW 82.02.050 through RCW 82.020.090 set forth the legislative intent and authority to
use growth impact fees to assist in capital construction projects.
The intent of the legislation is to ensure adequate public facilities are available to serve
new growth, to establish standards which growth pays a proportionate share of the cost of
those facilities, and that the fees are not arbitrary or duplicative. In addition, the fees are
to be included as part of a capital financing plan which balances impact fees with other
sources of public funds. The fees are to reasonably relate to and benefit new growth.
GMA impact fees are imposed through local ordinances which include a schedule
adopted for each type of development activity. The schedule is based upon a formula
designed to determine the proportionate share of the costs of public facilities necessitated
by new development. In the case of school districts, the local city and/or county must
adopt the district’s plan by reference as a part of the jurisdiction’s comprehensive plan.
The fees collected must be earmarked specifically and retained in special interest-bearing
accounts and spent only in conformance with the capital facilities plan element of the
comprehensive plan. The fees must be expended or encumbered within ten years of
receipt, except for extraordinary reasons, or they are to be refunded to the then current
property owner.
Finally, fees cannot be collected for system improvements under the GMA if fees are
collected under RCW 43.21C.060 (SEPA) for those same improvements.
WAC 362-343-032 addresses the use of impact or mitigation fees by the school district as
it relates to OSPI State Funding. Districts are able to use impact fees and/or mitigation
fees to assist in capital construction projects as part of the local share for those projects
receiving state financial assistance.
Thus, the statutory scheme for school mitigation may involve:
1. Imposition of mitigating conditions under SEPA, based upon adopted
policies, to correct specific adverse environmental impacts identified in
the environmental documents. RCW 43.21C.060.

5
2. Satisfaction of mitigating conditions under SEPA, or the State Subdivision
Act through a voluntary agreement in lieu of dedication of land or to
mitigate a direct impact of a development. RCW 82.02.020.
3. A finding of adequate provision for schools under the State Subdivision
Act based upon dedication of land or provision of improvements for a
subdivision of land. RCW 58.17.110.
4. Imposition of impact fees for system improvements reasonably related and
beneficial to new development, and identified in the capital facilitates
element of a comprehensive plan. RCW 82.02.050-.090.

6
CHAPTER THREE
SCHOOL DISTRICT DESCRIPTION
Tumwater School District is located in the north central portion of Thurston County. It
encompasses 117 square miles and is bordered on the north by the City of Olympia
(served by the Olympia School District), on the east by the City of Lacey (served by
North Thurston Public Schools), the south by the Rochester and Tenino School Districts
and on the west by the Capital Forest. Attachment-A is the map of the current District
boundaries and attendance areas. The District includes the City of Tumwater and its
urban growth area and unincorporated Thurston County. Development occurs principally
within the urban growth area of Tumwater and in scattered locations throughout the
remaining District boundaries. Within the urban growth boundaries, there is area for both
short-term and long-term residential development. The residential population of the
Tumwater School District is currently about 42,200. This is expected to grow to 51,000
by 2025 and 56,300 by 2030.
The District operates six elementary schools, two middle schools, two comprehensive
high schools and one alternative high school. In addition, the District is the host district
of New Market Skills Center, which serves ten school districts and provides specialized
career and technical education (CTE) and science, technology, engineering and math
(STEM) for area high school students. Most of the District schools are located in the
City of Tumwater, with only East Olympia and Littlerock Elementary schools located in
un-incorporated rural Thurston County. Table 1 contains a list of the existing schools,
student capacity, current enrollment, and modular classroom information.
The State began funding and mandating smaller class sizes in elementary schools
beginning with the 2019-20 school year. At grade levels K-3, State-mandated class size is
now seventeen students. While headcount numbers larger than seventeen are allowed in
individual classrooms, the district-wide average must be seventeen or less. This has
affected the capacity of existing and future facilities, as new classrooms spread over the
District’s six elementary schools may be required even without further enrollment
growth. Because of this, elementary school level of service has been adjusted to a
blended average of 22 students per classroom. Middle and high school classroom level of
service remains at 25 students.
As of September 2019, there are thirty-eight portable classrooms in the Tumwater School
District. These are used for a variety of purposes, including temporary classroom capacity
and special pullout programs. Pending funding and construction of new schools, the
District’s policy is to increase interim capacity at its schools with the use of portable
facilities. However, portables are used only as interim solutions and are not considered as
long-term capacity or as meeting the District’s standard of service.
In June 2019, the Tumwater School District Board of Directors adopted new elementary
school attendance boundaries. This was the recommendation of a Boundary Review
Committee that met from October 2018 through April 2019. The intention of the
boundary changes is to balance enrollment with capacity at the six elementary schools.

7
The boundaries of five elementary schools were changed to balance enrollment with
capacity at those schools. Peter G. Schmidt Elementary boundaries were not affected and
the school will continue to require temporary capacity in modular classrooms until a new
elementary can be opening in 2024.
Attachment-D is the map of attendance areas that will take effect for the 2020-21 school
year and beyond.

8
CHAPTER FOUR
ENROLLMENT FORECAST
The Office of the Superintendent of Public Instruction (OSPI) provides enrollment
projections for funding purposes only, based on the "Cohort Survival Method".
Basically, this method of enrollment projection uses historic patterns of student
progression by grade level to measure the portion of students moving from one grade
level up to the next higher cohort or grade. This ratio or survival rate is used in
conjunction with current live birth rates as a base for state-wide enrollment projections.
The OSPI system is useful but has obvious inadequacies in representing the unique
growth conditions of individual school districts. Historically, OSPI projections in
growing school districts tend to underestimate the actual student enrollment growth.
Furthermore, the OSPI projections do not anticipate new student enrollment as a result of
residential development.
To account for special growth conditions within the District, the District has developed a
modified forecast of enrollment. This forecast relies upon growth projections from
Thurston Regional Planning, consultants, and past enrollment trends within the District.
Two factors that cause these projections to be updated yearly are varying kindergarten
enrollment and unanticipated student in-migration. The current six-year enrollment
forecast is shown in Table 2.
As part of the elementary boundary review process, an enrollment forecast was
commissioned that showed that the current enrollment decrease is an anomaly and
enrollment will continue to grow. This forecast is included as Attachment-D. This
forecast is for the schools before the attendance areas are changed.
The number of students per household is the factor that the District uses to plan for new
schools to service the enrollment growth from new development. This factor is
commonly known as the “Student Generation Rate” (SGR). Typically, two different
kinds of dwelling units are studied that generate different numbers of students.
Specifically, single family units generate more students than multi-family units. In
addition, each type of housing unit will generate a different number of students at each
school grade level. For example, more students are generated per dwelling unit at the
elementary level because there are six grades at that level and only three or four grades
each at the upper levels. The SGR study is updated every two years and was last updated
in August 2020 for use in this year’s Capital Facilities Plan update. The next update will
be done in 2022.

9
In order to utilize SGR multipliers that reflect the housing located within the School
District boundaries, the District conducts a Student Generation Rate study. The results of
the 2020 study are included as Attachment C. The following is a summary of the rate
study:
Housing Type TSD Study SGR
Single Family
Elementary 0.301
Middle School 0.172
High School 0.089
Total 0.561
(Total does not add due to rounding)
Multifamily
Elementary 0.050
Middle School 0.050
High School 0.058
Total 0.158
The Tumwater School District SGR multipliers produced as a result of this study and
adopted by the District are also on Table 8 and used in Appendix B to calculate the
school impact fee.

10
CHAPTER FIVE
LEVEL OF SERVICE CAPACITY
Adequate instructional space is generally based on the educational program adopted by
the District. Instructional capacity is the classroom space required for the educational
program in each building. The number of students a building can serve adequately is
determined by the type and number of programs placed in each building, and the number
of regular classrooms it contains. Generally, instructional capacity is determined by
examining the number of regular teaching stations in the buildings and the adopted class
sizes of the educational program. The instructional capacity of two buildings with the
same number of teaching stations or similar square footage may be different as a result of
differences in the design of the school as well as its educational program.
OSPI uses formulae based on square footage of school buildings (see WAC 362-343) for
providing state assistance for school facilities. Those formulae, which are for funding
purposes only, do not represent the amount of space for current program needs. The
purpose of the formulae is to specifically identify the maximum amount of state
assistance to be provided for a project. WAC 362-343-035 sets space allocations for
funding assistance. The allocations have been subject to question for years by school
districts and, although they have been recently adjusted somewhat, they do not represent
actual new construction in this State. Furthermore, even if the District receives State
funding assistance on eligible projects, the District must take into account the timing and
amount of those funds in its capital facility planning process. However, in planning new
schools, the educational program needs must be the driver of the design and capacity of
those facilities.
Level of service capacity is defined as the number of students a school is designed to
accommodate. The capacity standard includes only permanent regular classrooms and is
based solely on the District's calculations. Some districts use a square footage standard to
determine the level of service capacity for a facility. Other districts have adopted a
standard utilizing a given number of students per classroom. This method fits well with
agreements negotiated with teacher organizations relating to the number of students a
teacher is expected to supervise in a classroom. In this District, an average of 25 students
per regular classroom for every grade level has been a standard used for planning
purposes for many years. However, with the change in class sizes at grades K-3,
elementary schools now use a blended average for K-5 of 22 students per regular
classroom.
Based upon the enrollment forecasts and level of service capacities, the demand vs.
supply of existing schools and projected new classrooms is shown on Table 3.
Table 3 projects the need for a new elementary school by 2024 for additional growth-
related capacity.
.

11
CHAPTER SIX
FINANCING
The Washington State Constitution mandates educational opportunity for all children in
Article IX Section 1:
"It is the paramount duty of the State to make ample provision for the education of
all children residing within its borders, without distinction or preference on
account of race, color, caste or sex."
Court cases have subsequently determined that the legislature is responsible for "full
funding of basic education" and the Office of Superintendent of Public Instruction has
been assigned overall responsibility for assuring the operations of public education for
grades kindergarten through 12. The state provides the funds for the basic education
through a formula based on student enrollment and special student needs. The districts,
through use of a local levy which is not to exceed 28 percent of the state authorized
support, may "enrich" the educational program from local property tax sources. Capital
needs are addressed separately.
School districts utilize budgets consisting of a number of discrete funds, including a
general fund for district operations and building and debt service funds for meeting
capital needs.
SOURCES
General Fund
The General Fund constitutes the main operational budget source for the district, utilizing
state apportionment, categorical, and local levy enrichment funds to pay for the
educational program. Salaries, benefits, purchases of goods and services and the like are
the responsibility of the general fund.
Building Fund
The Building Fund is used for capital purposes: to finance the purchase and improvement
of school sites; the construction of new facilities and remodeling or modernization of
existing facilities; and the purchase of initial equipment, library books, and text books for
those new facilities. Revenues accruing to the Building Fund may come from the
General Fund apportionment, sale of properties, contributions, bond sale proceeds, capital
levy collections, impact fees and earmarked state revenues.
Debt Service Fund
The Debt Service Fund is established as the mechanism to pay for bonds. When a bond
issue is passed, the district issues bonds which have a face value and an interest rate.
Property taxes are adjusted to provide the funds necessary to meet the approved periodic
payments of interest and principal. The proceeds from the taxes collected for this
purpose are deposited in the Debt Service Fund and then drawn out for payments at the
appropriate times.

12
Bonds
Bonds are financial instruments having a face value and an interest rate which is
determined at the time and by the conditions of sale. Bonds are backed by the "full faith
and credit" of the issuing government and must be paid from proceeds derived from a
specific increase in the property taxes for that purpose. The increase in the taxes results
in an "excess levy" of taxes beyond the constitutional limit, so the bonds must be
approved by a vote of the people in the jurisdiction issuing them. The total of
outstanding bonds issued by the jurisdiction may not exceed five percent of the assessed
value of property within that jurisdiction at the time of issuance.
Bonds are multiyear financial instruments, generally issued for 10, 20, 25, or 30 years.
Because of their long-lasting impact, they require both a sixty percent super-majority of
votes and a specific minimum number of voters for ratification. The positive votes must
equal or exceed 60 percent of the total votes cast. The total number of voters must equal
or exceed 40 percent of the total number of voters in the last general election.
Proceeds from bond sales are limited by bond covenants and must be used for the
purposes for which the bonds are issued. They cannot be converted to a non-capital or
operating purpose. The life of the improvement resulting from the bonds must meet or
exceed the term of the bonds themselves.
Levies
School Boards can submit levy requests to the voters of the district. They too are
measures which will raise the property tax rate beyond the constitutional limits. Levy
approval differs from the approval requirements for bonds in that a levy measure is
approved with a simple majority of the votes cast.
The Secretary of State issues a schedule of approved election dates each year. The school
board must place its proposed measures on one of those dates. If the measure fails at the
first election, the board can re-submit it to the voters after a minimum period of 45 days.
If the measure fails for a second time during a calendar year (a double levy loss) it cannot
be submitted again during that year.
Capital Levies differ from bonds in that they do not result in the issuance of a financial
instrument and therefore does not affect the "bonded indebtedness" of the district. The
method of financing is an increase in property tax rates to produce a voter-approved
dollar amount. The amount generated from the capital levy is then available to the
district in the approved year. The actual levy rate itself is determined by dividing the
number of dollars approved into the assessed valuation of the total school district at the
time the taxes are set by the County Council.
Capital levies can be approved for a one to six year period at one election. The amounts
to be collected are identified for each year separately and the tax rates set for each
individual year. Like bond issues, capital levies must be used for the specified purpose.
They may not be transferred to operating cost needs.

13
Operating levies are used to supplement the district's educational program offerings.
Note, due to legislative changes, the entire “operating” levy structure has undergone
radical change. These levies are now called “enhancement” levies used to supplement
district education beyond the State definition of “basic education”. Levies generally will
support athletics, art, physical education and other programs not addressed by the state
apportionment for basic education. They also support special categorical funded
programs for disabled, bilingual, early childhood and others. Funds can be transferred
from operating levy sources to help pay for capital needs, although it is very rarely done.
Operating levies are limited in size by the total of approved state apportionment and
categorical funds (a calculation involving not only State funds but some federal pass-
through funds as well). Future “enrichment” levies will be limited by a revised set of
formulas. Operating levies may be approved for one to four years at a single election.
Miscellaneous Sources
Other minor sources of funding include grants, bequests, proceeds from sales of property
and the like. They are usually a small part of the total financing package.
State School Construction Assistance Program (SCAP) Funding
The State of Washington has a Common School Capital Construction Fund. The Office
of Superintendent of Public Instruction (OSPI) is responsible for administration of the
funds and establishes matching ratios on an annual basis. OSPI re-calculates the State
funding assistance percentage each July for every school district in the state, based on
number of students and assessed valuation. The Tumwater School District assistance
percentage as of July 2020 was set at 62.58 percent for eligible project costs.
The percentage is applied is the “Construction Cost Allocation” as determined and set
each July by OSPI with Legislative approval. The construction cost allowance for school
construction costs for July 1, 2020 funded projects is $238.22 per square foot.
The calculation for determining state matching support can be expressed as:
A x B x C = D
Where
A = eligible area (determined by OSPI square foot factors)
B = the construction cost allowance (in dollars per square foot)
C = the school district's funding assistance percentage rate, and
D = the amount of state funding assistance to which the district will be entitled.
The construction cost allowance is utilized here only as an index for funding and must
not be used to estimate or set construction costs. Typically, actual construction costs for
schools are significantly higher than the construction cost allowance. In addition, State
assistance funding does not apply toward many of the costs necessary to complete a
project. State assistance money typically accounts for less than 25% of the total project
cost.

14
Qualifying for SCAP funding involves an application process that has six rounds of
District applications and OSPI approvals. Districts submit information for consideration
to the State Board. If approved, the district project is given a priority ranking number
based upon information provided in the application. The project is then placed on the
funding list along with all other projects submitted. OSPI funds projects at the beginning
of each fiscal year starting at the top of the list with those projects having the highest
priority number and proceeding down the list until the funds allotted for that year are
committed. In short, the higher the priority ranking, the better prospect the district has in
receiving stating matching funds. Failure by the district to proceed with a project in a
timely manner can result in loss of the district's state funding assistance.
Funds for the state funding assistance come from the Common School Construction
Funds. Bonds are sold on behalf of the fund and then retired from revenues accruing
from the sale of renewable resources, primarily timber, from state school lands set aside
by the Enabling Act of 1889. If these sources are insufficient to meet needs, the
legislature can appropriate additional funds, or OSPI can prioritize projects for funding
(Chapter 392, Sections 341-347 of the Washington Administrative Code).
Supply and market conditions affecting timber and wood products has changed over the
past decade or so, resulting in a substantial decrease in state revenue. Efforts in the State
Legislature to supplement timber-generated revenues with general fund moneys have
been only partially successful. School districts have had to wait for assistance funds
because there were more projects on the funding list than money available during the
fiscal year.

15
RESIDENTIAL CONSTRUCTION DEVELOPMENT MITIGATION
Impact Fees
According to RCW 82.02.050, the definition of impact fee is " a payment of money
imposed upon development as a condition of development approval to pay for public
facilities needed to serve new growth and development, and that is reasonably related to
the new development that creates additional demand and need for public facilities, that is
a proportionate share of the cost of the public facilities, and that is used for facilities that
reasonably benefit the new development. 'Impact fee' does not include a reasonable
permit or application fee."
Impact fees can be calculated on the basis of "un-housed student need" which is related to
new residential construction. A determination projected student enrollment growth
within the six year planning period and insufficient permanent school space to serve that
growth allows the district to seek imposition of the fees. The amounts to be charged are
then calculated based on the costs for providing the space and the projected average
number of students in each residential unit as based on the student generation rate
analysis. The School Board must first approve the calculation of the impact fees as a part
of the Board’s adoption of this Capital Facilities Plan and in turn, approval must then be
granted by the other general government jurisdictions having responsibility within the
district -- counties, cities and towns. In the Tumwater School District, those general
government jurisdictions include the City of Tumwater and Thurston County. Both the
City of Tumwater and Thurston County have adopted school impact fee ordinances.
SEPA Mitigation
Prior to the City of Tumwater’s, and now Thurston County’s, adoption of a Growth
Management Act school impact fee ordinance, the District had requested that mitigation
requirements apply to all residential developments throughout the District subject to
SEPA to mitigate the direct impacts of the development on schools. Because all
jurisdictions within the District’s boundaries are now collecting impact fees for schools,
the District will no longer request mitigation for new housing developments located in
the unincorporated areas in the District.
The Capital Facilities Plan is designed to support the use of fees as provided for under the
Growth Management Act. It consists of: (a) an inventory of existing educational
facilities owned by Tumwater School District, showing the locations and capacities of
these facilities: (b) a forecast of the future needs for school facilities; (c) the proposed
capacities of new school facilities; and (d) a plan that will finance proposed new school
facilities within projected funding capacities and clearly identifies sources of public
money for such purposes.
Where necessary, the Six Year Capital Facilities Plan provides for acquisition and
development of new school sites and, in some cases, modernization of existing school
facilities in addition to new construction.

16
CHAPTER SEVEN
CONSTRUCTION PROGRAM
The gap between available space and need increases when residential growth accelerates
while the planning, financing, permitting and construction period for school construction
has lengthened. As a result, school capacities typically lag behind the increase in
housing. Schools are categorized as Elementary, Middle, and High Schools. There will
be variations from district to district of grade configurations, class size, and curriculum
based needs depending on the district's educational program. Adjustments to the
construction cost can be managed according to the choices made by the district and the
effects of inflation.
The first element of project costs consists of the cost of acquiring the site and the
developing of the site. The cost of the site usually consists of the price paid for the land,
costs of the purchase, and cost of easements required for roads and utilities.
Development costs consist of the costs to provide roads, utilities, and other necessary on-
site and off-site improvements to the site in order that a school facility may be built
thereon. These costs are not eligible for State funding assistance and must be paid for by
local funds exclusively. Site costs will vary widely depending on the real estate market
and on the circumstances of the site such as location and availability of utility services.
OSPI has recommended minimum site sizes of five acres for an elementary school plus
one acre for every 100 students and ten acres for grades 7 and above plus one acre per
100 students. This acreage is supposed to provide for the buildings and the appropriate
support facilities such as play fields, athletic facilities, parking, and storage. The District
uses the following as the practical acreage needed for school sites:
Elementary: 10-15 acres
Middle Level: 20-25 acres
High: 45-55 acres
Site sizes above and below these are evaluated and considered based on available land.
The second element is the construction cost that includes the building, site (parking lots,
play fields, site furnishings and private utilities.) and off-site costs (public utilities and
public street improvements) The third part includes the other costs associated with a
construction project which include planning, design, engineering, construction
management, furniture, equipment, agency fees, and sales taxes. The general project cost
estimate for the new elementary school and a typical double-classroom modular unit are
shown in Table 4.
The District anticipates using a mixture of funding sources to meet the costs of building
the schools, including local bond issues, capital levies, State funding assistance and
impact fees. The bond issues are the primary source of local funding, and are dependent
on voter approval. State funding assistance provides the secondary source of school
construction funds. Those funds are available from the State based upon specific project
eligibility, priority ranking by the State and available funds. If the sale of bonds is not
approved by the public or State funding assistance is not available, the District will not be
able to implement the Capital Facilities program as planned. The District may then
17
utilize other means to house the students including purchase of modular classrooms or
any other means available to the district. If the District experiences accelerated growth
above and beyond that expected and/or funds are not available, then the district may not
be able to provide housing for students. This may require a moratorium on any new
housing until funding becomes available.
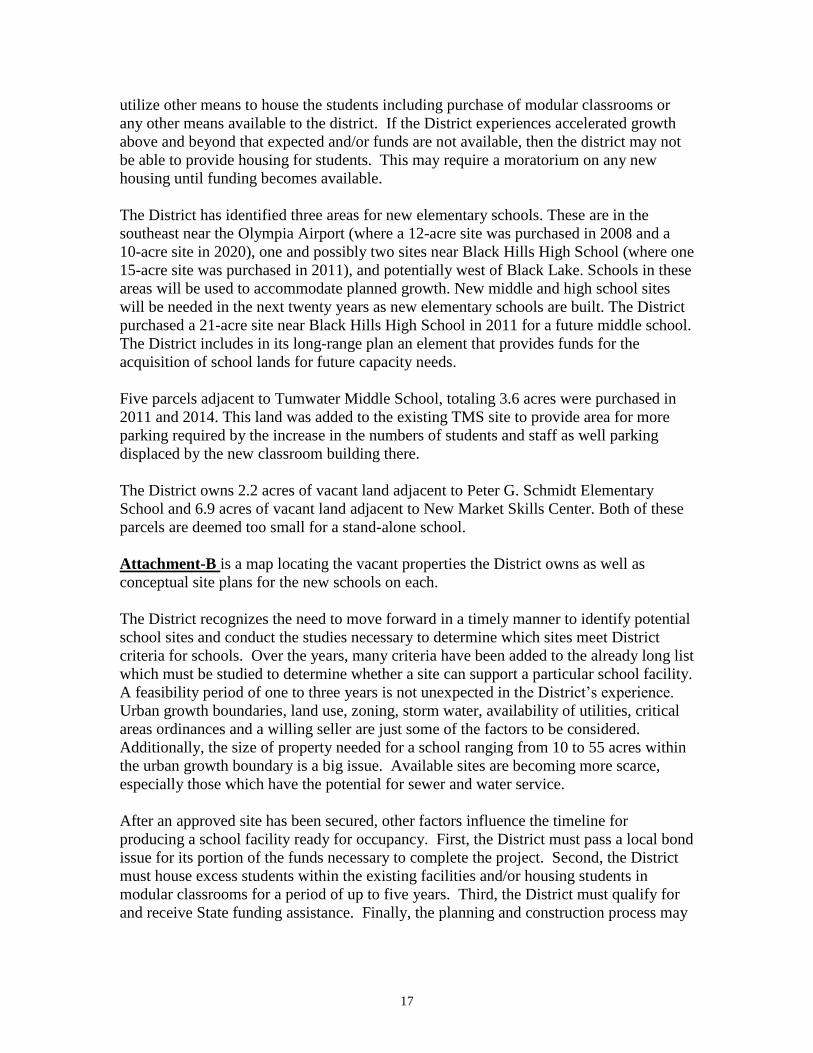
The District has identified three areas for new elementary schools. These are in the
southeast near the Olympia Airport (where a 12-acre site was purchased in 2008 and a
10-acre site in 2020), one and possibly two sites near Black Hills High School (where one
15-acre site was purchased in 2011), and potentially west of Black Lake. Schools in these
areas will be used to accommodate planned growth. New middle and high school sites
will be needed in the next twenty years as new elementary schools are built. The District
purchased a 21-acre site near Black Hills High School in 2011 for a future middle school.
The District includes in its long-range plan an element that provides funds for the
acquisition of school lands for future capacity needs.
Five parcels adjacent to Tumwater Middle School, totaling 3.6 acres were purchased in
2011 and 2014. This land was added to the existing TMS site to provide area for more
parking required by the increase in the numbers of students and staff as well parking
displaced by the new classroom building there.
The District owns 2.2 acres of vacant land adjacent to Peter G. Schmidt Elementary
School and 6.9 acres of vacant land adjacent to New Market Skills Center. Both of these
parcels are deemed too small for a stand-alone school.
Attachment-B is a map locating the vacant properties the District owns as well as
conceptual site plans for the new schools on each.
The District recognizes the need to move forward in a timely manner to identify potential
school sites and conduct the studies necessary to determine which sites meet District
criteria for schools. Over the years, many criteria have been added to the already long list
which must be studied to determine whether a site can support a particular school facility.
A feasibility period of one to three years is not unexpected in the District’s experience.
Urban growth boundaries, land use, zoning, storm water, availability of utilities, critical
areas ordinances and a willing seller are just some of the factors to be considered.
Additionally, the size of property needed for a school ranging from 10 to 55 acres within
the urban growth boundary is a big issue. Available sites are becoming more scarce,
especially those which have the potential for sewer and water service.
After an approved site has been secured, other factors influence the timeline for
producing a school facility ready for occupancy. First, the District must pass a local bond
issue for its portion of the funds necessary to complete the project. Second, the District
must house excess students within the existing facilities and/or housing students in
modular classrooms for a period of up to five years. Third, the District must qualify for
and receive State funding assistance. Finally, the planning and construction process may

18
range from three years for an elementary school to as much as five years for a secondary
school from start to occupancy.
Therefore, it is incumbent on the District to move forward in a timely manner with its
Capital Facilities Plan to acquire and develop needed sites and facilities. As such,
multiple sources of funding are required including existing capital funds, bond issue
funds, mitigation/impact fees, and State funding assistance.
Construction projects that are planned to increase capacity are:
1. Building a new elementary school for added capacity to serve growth at the K-5
level to open in 2024.
2. Adding modular classrooms to elementary schools until a new school is built;
potential addition of modular classrooms at the middle and high school as needed
to provide for interim capacity solutions.
Construction projects planned to update existing facilities are:
1. New Market Skills Center – minor capital improvements funded primarily with
State grants. Five projects were granted State capital budget approval for 2017-19;
five more projects are included in the 2019-21 State capital budget. These projects
will be completed this year. A full renovation of existing facilities and possible
additions is planned to begin in 2025, depending on State funding.
2. Tumwater and Black Hills High Schools – unspecified renovations in a future
bond.
3. Bush and Tumwater Middle Schools – the parts of the original buildings not
included in the additions and renovations to accommodate sixth grade will be
eligible for State construction grants for major renovations in 2024 (BMS) and
2025 (TMS).
4. A capital facilities levy of $10 million was approved by voters in 2020 that will
pay for technology, health, safety and security improvements as well as major
maintenance ova the next three years.

19
CHAPTER EIGHT
FINANCIAL PLAN
The planned project expenditures and revenues are detailed in Table 5. Tumwater School
District needs approximately $127,390,000 to finance its facility needs for the fiscal years
2020-21 through 2025-26.
The capital projects fund balance at the end of the 2019-20 fiscal year is estimated to be
$6,000,000.
In a February 2014 bond referendum, district voters approved the sale of bonds worth
$136,000,000 to fund the 2014-2020 capital facilities plan. The last of these bonds were
sold in 2017. The remaining proceeds from these bonds and State construction grants
received and expected will provide the majority of funds for projects in the current
Capital Facilities Plan.
The District passed a two-year capital levy in February 2020. This will fund $10,000,000
of projects over two calendar years (three fiscal years), mainly technology upgrades and
safety and security projects. Included in this levy would be funds to plan and design a
new elementary school in preparation for a bond referendum in 2022 to finance the
construction of the new school. Other projects would be included in the bond for the next
six year capital plan including major renovations of both middle schools.
State grants are estimated to amount to approximately $24,565,000, including
$12,250,000 solely for New Market Skills Center projects.
The impact fee and mitigation fee portion for the six-year period is $3,000,000.
Miscellaneous revenue from a variety of other sources is estimated to be $600,000 over
the next six years.
2019-20 Ending fund Balance $ 6,000,000
+ Capital Levy 10,000,000
+ Bond Sales (needs voter approval) 85,000,000
+ State Grants 24,565,000
+ Impact Fees 3,000,000
+ Misc. Revenue 600,000
= Total Revenue $ 123,165,000
= Anticipated Available Funds $ 129,165,000
These funds are anticipated to be available to finance the capital projects in the plan. The
planned project expenditures and revenues are detailed in Table 5.

20
CHAPTER NINE
ASSESSED VALUATION
The assessed valuation of the school district is the total value of the real property--land
and improvements, including buildings -- within the district boundaries. The assessed
value is set by the Thurston County Assessor and is as the base to which property tax
rates are applied. The increase in value of the total assessment for the County cannot
exceed an amount equal to 106 percent of the prior year's total value plus the value of
new construction during that period. The total is increased by inflation or increased
market value for existing properties.
The constitutionally approved taxes, which amount to 20 mills or two cents on the dollar,
are applied to the full assessed value and produce funds for a variety of governmental
purposes. Excess levy rates, those beyond the constitutional limits, are imposed to
generate a specific dollar amount, so they may vary from year to year. The higher the
assessed valuation, the lower the rate needed to generate the necessary dollar amount.
School districts which have a high assessed valuation, such as those with large, intensive
commercial developments (i.e. shopping and auto malls, etc.) are able to generate very
substantial bond dollars with very modest tax levy rates. On the other hand, districts with
low assessed valuation are hampered with high tax levy rates to raise even modest bond
funds. The Tumwater School District is largely a rural district with a modest assessed
valuation. As such, care must be taken in managing the bond issue process to maintain
voter confidence and modest tax levy rates.
The district’s total assessed valuation as of January 1, 2020, set by the County Assessor,
was $5,998,182,800, which is an increase of 8% over 2019.

21
CHAPTER TEN
EXISTING DEBT
The Tumwater School District’s current debt is $105,050,000 as shown in Table 6. This
debt was incurred by four bond sales from the 2014 election. Current bond debt will be
paid off in 2032. Table 6 also shows the projected annual payments.
There is a five percent ceiling on outstanding indebtedness, which means that the bonded
indebtedness of the district cannot exceed five percent of the assessed value of the district
at the time of issuance of the bonds. The existing debt therefore reduces the bonding
capacity of the district.
For Tumwater School District, the current availability of bonding capacity is calculated
as:
Total Assessed Value $5,998,182,800
Five Percent of Assessed Value $ 299,909,140
Existing Bonded Indebtedness (Principal Only) $ 105,050,000
Available Bonding Capacity $ 194,859,140
Table 7 compares the debt limit with the outstanding debt. The information contained in
therein indicates that the District as the District pays off existing debt; it also has
adequate debt capacity for timed bond sales for the planned construction projects.

22
CHAPTER ELEVEN
IMPACT FEE CALCULATIONS
The school impact fee formula ensures that new development only pays for the cost of
facilities necessitated by new development. The GMA school impact fee calculations
(Appendix B) examine the costs of housing the students generated by each new single
family dwelling unit and each new multi-family dwelling unit and then reduce that
amount by the anticipated state match and future tax payments. The calculations are
driven by the facilities costs identified in Table 4 for the District’s new planned growth-
related capacity projects (as identified in Table 3). By applying the student generation
factor (as shown in Table 8) to the school project costs, the fee formula only calculates
the costs of providing capacity to serve each new dwelling unit. The resulting impact fee
may be discounted by an additional amount at the discretion of the District Board of
Directors. Importantly, the GMA does not require new development to contribute toward
the costs of providing capacity to address existing needs.

APPENDIX A
TABLES 1-8
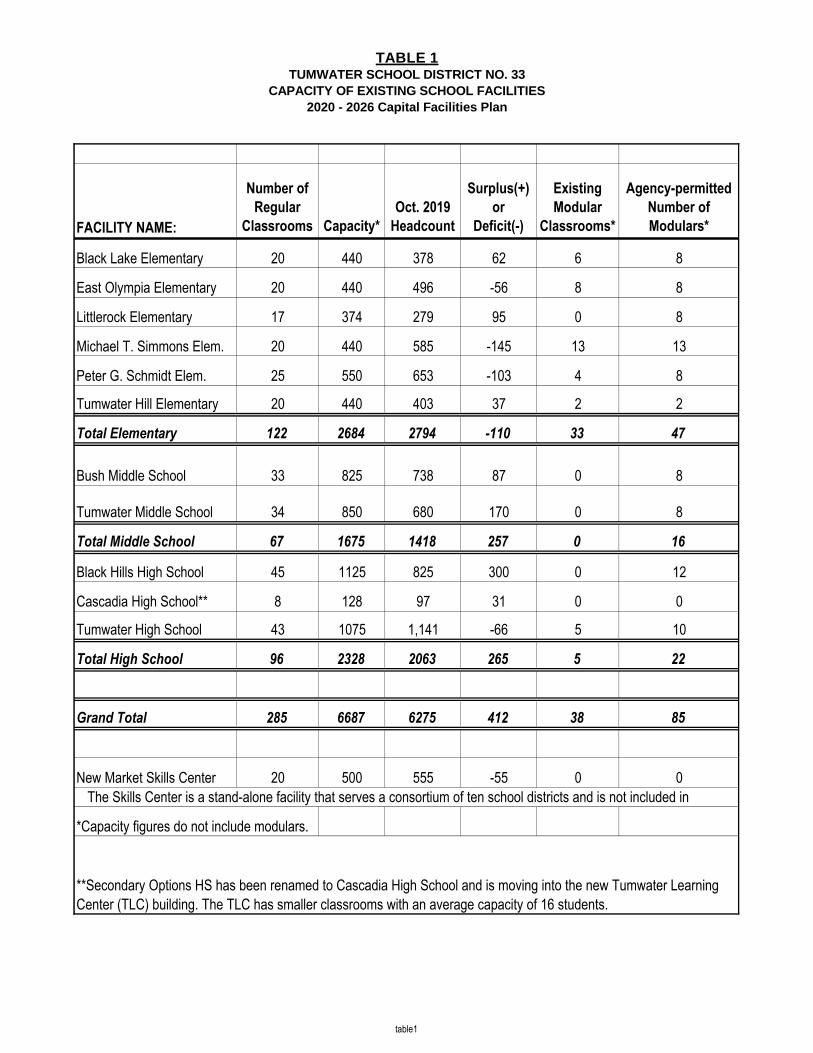
TABLE 1TUMWATER SCHOOL DISTRICT NO. 33
CAPACITY OF EXISTING SCHOOL FACILITIES
2020 - 2026 Capital Facilities Plan
FACILITY NAME:
Number of
Regular
Classrooms Capacity*
Oct. 2019
Headcount
Surplus(+)
or
Deficit(-)
Existing
Modular
Classrooms*
Agency-permitted
Number of
Modulars*
Black Lake Elementary 20 440 378 62 6 8
East Olympia Elementary 20 440 496 -56 8 8
Littlerock Elementary 17 374 279 95 0 8
Michael T. Simmons Elem. 20 440 585 -145 13 13
Peter G. Schmidt Elem. 25 550 653 -103 4 8
Tumwater Hill Elementary 20 440 403 37 2 2
Total Elementary 122 2684 2794 -110 33 47
Bush Middle School 33 825 738 87 0 8
Tumwater Middle School 34 850 680 170 0 8
Total Middle School 67 1675 1418 257 0 16
Black Hills High School 45 1125 825 300 0 12
Cascadia High School** 8 128 97 31 0 0
Tumwater High School 43 1075 1,141 -66 5 10
Total High School 96 2328 2063 265 5 22
Grand Total 285 6687 6275 412 38 85
New Market Skills Center 20 500 555 -55 0 0
*Capacity figures do not include modulars.
The Skills Center is a stand-alone facility that serves a consortium of ten school districts and is not included in
**Secondary Options HS has been renamed to Cascadia High School and is moving into the new Tumwater Learning
Center (TLC) building. The TLC has smaller classrooms with an average capacity of 16 students.
table1

TABLE 2TUMWATER SCHOOL DISTRICT NO. 33
DISTRICT ENROLLMENT FORECAST
2020 - 2026 Capital Facilities Plan
Actual Actual Actual Actual Actual Actual Actual COVID
2013 2014 2015 2016 2017 2018 2019 2020 2021 2022 2023 2024 2025
Kindergarten 368 411 398 457 490 431 462 462 475 489 503 517 532
Grade One 406 393 450 436 501 473 431 431 492 506 521 536 551
Grade Two 405 398 427 459 447 500 468 468 445 508 523 538 553
Grade Three 437 415 423 469 478 439 512 512 483 459 525 539 555
Grade Four 460 444 435 451 492 491 434 434 528 498 474 541 556
Grade Five 458 463 475 443 458 484 487 487 447 544 513 488 557
Grade Six 462 479 482 493 470 467 497 497 506 465 565 533 507
Grade Seven 513 482 494 505 517 462 464 464 512 522 479 583 550
Grade Eight 485 525 495 507 508 512 457 457 475 524 534 490 596
Grade Nine 525 533 560 548 559 539 540 540 497 516 570 581 533
Grade Ten 535 541 550 549 552 552 540 540 549 506 525 580 590
Grade Eleven 527 519 517 540 524 493 503 503 519 528 486 505 558
Grade Twelve 548 551 539 537 540 502 480 480 517 534 543 500 519
K-5 HEADCOUNT 2534 2524 2608 2715 2866 2818 2794 2794 2871 3005 3057 3159 3304
6-8 HEADCOUNT 1460 1486 1471 1505 1495 1441 1418 1418 1493 1510 1578 1606 1653
9-12 HEADCOUNT 2135 2144 2166 2174 2175 2086 2063 2063 2083 2084 2125 2165 2200
TOTAL K-12 6129 6154 6245 6394 6536 6345 6275 6275 6446 6599 6760 6930 7157
Projected
table2

TABLE 3TUMWATER SCHOOL DISTRICT NO. 33
DEMAND VS. SUPPLY OF SCHOOL FACILITIES
2020 - 2026 Capital Facilities Plan
YEAR DEMAND
LEVEL OF
SERVICE
CAPACITY PERCENT
CAPACITY
INCREASE
SURPLUS
OR DEFICIT
CAPACITY
CHANGES
2020 2,794 2,684 104% 0 -110
2021 2,871 2,684 107% 0 -187
2022 3,005 2,684 112% 0 -321
2023 3,057 2,684 114% 0 -373
2024 3,159 3,284 96% 600 125 Add New Elem.
2025 3,304 3,284 101% 0 -20
2026 3,398 3,284 103% 0 -114
2027 3,495 3,284 106% 0 -211
2028 3,595 3,884 93% 600 289 Add New Elem.
2029 3,697 3,884 95% 0 187
2020 1,418 1,675 85% 0 257
2021 1,493 1,675 89% 0 182
2022 1,510 1,675 90% 0 165
2023 1,578 1,675 94% 0 97
2024 1,606 1,675 96% 0 69
2025 1,653 1,675 99% 0 22
2026 1,664 1,675 99% 0 11
2027 1,727 1,675 103% 0 -52
2028 1,837 1,675 110% 0 -162
2029 1,890 1,675 113% 0 -215
2020 2,063 2,328 89% 160 425 Add TLC
2021 2,083 2,488 84% 0 405
2022 2,084 2,488 84% 0 404
2023 2,125 2,488 85% 0 363
2024 2,165 2,488 87% 0 323
2025 2,200 2,488 88% 0 288
2026 2,332 2,488 94% 0 156
2027 2,376 2,488 96% 0 112
2028 2,374 2,488 95% 0 114
HIGH SCHOOL
ELEMENTARY SCHOOL
MIDDLE SCHOOL
table3

TABLE 4TUMWATER SCHOOL DISTRICT NO. 33
SCHOOL FACILITY BUDGETS
2020 - 2026 Capital Facilities Plan
ITEM DESCRIPTION ESTIMATED TOTAL COST
New Elementary School
Architect & Engineer Fees $3,169,000
Other Consultant Fees $528,000
Fees, Permits & Req'd. Studies $1,320,000
Off-site Development Construction $1,320,000
On-Site Development Construction $3,169,000
Building Construction $26,406,000
Furniture & Equipment $1,584,000
Technology & Security Systems $792,000
Contingency (8%) $3,063,000
WSST (9.4%) on Const., Furn., Eqpt. & Sys. $3,128,000
Sub-total Cost $44,479,000
Site Acquisition (TSD owns two future elementary sites) $0
Total Cost $44,479,000
Modular Classrooms for temporary capacity
Architect & Engineering $40,000
Agency Permits & Fees $20,000
Utilities & Site Work $80,000
28 X 64 Double Classroom Unit $130,000
Furniture & Equipment $40,000
Technology & Security Systems $20,000
Contingency(8%) $24,000
WSST (9.4%) on Const., Furn., Eqpt. & Sys. $28,000
Total Cost for Double Classroom $382,000
Total Cost per classroom $191,000
Temporary classrooms needed 2021-2026 17
Total cost of temporary capacity $3,247,000
table4

TABLE 5
TUMWATER SCHOOL DISTRICT NO. 33
SIX-YEAR CAPITAL FACILITY PLAN
2020 - 2026 Capital Facilities Plan
EXPENSE ACTIVITY
Major Projects 2020-2021 2021-2022 2022-2023 2023-2024 2024-2025 2024-2025 6-yr Total
Tumwater Hill Elem. Renovations $250,000 $250,000
New Alternative Learning Center ( Cascadia HS) $100,000 $100,000
Black Hills HS Renovations $400,000 $500,000 $800,000 $1,800,000 $800,000 $800,000 $5,100,000
Tumwater HS Renovations $400,000 $500,000 $800,000 $1,800,000 $800,000 $800,000 $5,100,000
Bush Middle School Renovations $100,000 $2,000,000 $5,000,000 $16,000,000 $23,100,000
Tumwater Middle School Renovations $100,000 $2,000,000 $5,000,000 $7,100,000
New Elementary School #7 $250,000 $250,000 $18,000,000 $25,000,000 $1,000,000 $44,500,000
New Market SC Major Renovations $500,000 $500,000 $1,000,000 $7,000,000 $9,000,000
TOTAL MAJOR PROJECTS $1,400,000 $1,250,000 $20,200,000 $31,200,000 $10,600,000 $29,600,000 $94,250,000
Small Projects 2020-2021 2021-2022 2022-2023 2023-2024 2024-2025 2024-2025 6-yr Total
Site Acquisition $1,000,000 $1,000,000 $2,000,000
Technology Capital Expenses $1,000,000 $1,000,000 $1,000,000 $1,500,000 $1,500,000 $1,500,000 $7,500,000
New Market SC Minor Capital Projects $750,000 $500,000 $500,000 $500,000 $500,000 $500,000 $3,250,000
Modular classrooms $380,000 $380,000 $720,000 $720,000 $720,000 $720,000 $3,640,000
Health, Safety & Security Projects $1,200,000 $3,500,000 $500,000 $500,000 $500,000 $500,000 $6,700,000
Buildings & Grounds Enhancements $750,000 $1,000,000 $200,000 $200,000 $200,000 $200,000 $2,550,000
Small Works Projects $500,000 $500,000 $500,000 $500,000 $500,000 $500,000 $3,000,000
Capital Operations & Bond Costs $750,000 $750,000 $750,000 $750,000 $750,000 $750,000 $4,500,000
TOTAL SMALL PROJECTS $5,330,000 $8,630,000 $5,170,000 $4,670,000 $4,670,000 $4,670,000 $33,140,000
TOTAL EXPENDITURE $6,730,000 $9,880,000 $25,370,000 $35,870,000 $15,270,000 $34,270,000 $127,390,000
REVENUE SOURCE 2020-2021 2021-2022 2022-2023 2023-2024 2024-2025 2024-2025 6-yr Total
Capital Levy (approved Feb. 2020 election) $2,500,000 $5,000,000 $2,500,000 $10,000,000
Future Bond Sales (Requires voter approval) $25,000,000 $35,000,000 $25,000,000 $85,000,000
State Grant - New Elementary School $7,315,000 $2,500,000 $2,500,000 $12,315,000
State Grant - New Market SC Minor Capital Imp. $750,000 $500,000 $500,000 $500,000 $500,000 $500,000 $3,250,000
State Grant - New Market Major Renovation $500,000 $500,000 $1,000,000 $7,000,000 $9,000,000
Impact Fees for capacity-adding projects $500,000 $500,000 $500,000 $500,000 $500,000 $500,000 $3,000,000
Other Miscellaneous Revenue $100,000 $100,000 $100,000 $100,000 $100,000 $100,000 $600,000
TOTAL REVENUE $3,850,000 $31,100,000 $4,100,000 $43,915,000 $4,600,000 $35,600,000 $123,165,000
Ending Fund Balance 2019-20 = $6,000,000 $3,120,000 $24,340,000 $3,070,000 $11,115,000 $445,000 $1,775,000 $1,775,000
Note: Bond sales may vary based upon market conditions, cash flow needs and other variables.
Sales of all 2014-approved bonds totalling $136,000,000 took place before the 2018-2019 school/fiscal year.
table5

TABLE 6TUMWATER SCHOOL DISTRICT NO. 33
CURRENT CAPITAL DEBT
2020 - 2026 Capital Facilities Plan
2014 2015 2016 2017
Year Issue Issue Issue Issue TOTAL
2020 $3,170,000 $3,095,000 $860,000 $6,895,000 $14,020,000
2021 $2,915,000 $2,810,000 $875,000 $210,000 $6,810,000
2022 $3,300,000 $2,895,000 $860,000 $390,000 $7,445,000
2023 $5,305,000 $0 $2,250,000 $595,000 $8,150,000
2024 $4,750,000 $2,590,000 $740,000 $825,000 $8,905,000
2025 $2,120,000 $4,940,000 $1,490,000 $1,080,000 $9,630,000
2026 $2,305,000 $5,190,000 $1,550,000 $1,360,000 $10,405,000
2027 $2,510,000 $2,000,000 $5,010,000 $1,665,000 $11,185,000
2028 $2,725,000 $1,915,000 $5,435,000 $2,015,000 $12,090,000
2029 $2,755,000 $3,775,000 $0 $6,530,000
2030 $2,900,000 $2,785,000 $0 $5,685,000
2031 $2,025,000 $2,025,000
2032 $2,170,000 $2,170,000
Total $29,100,000 $31,090,000 $25,630,000 $19,230,000 $105,050,000
table6

TABLE 7TUMWATER SCHOOL DISTRICT NO. 33
DEBT CAPACITY
2020 - 2026 Capital Facilities Plan
Total Cumulative Assessed 5% of Assessed Debt
YEAR Principal Debt Valuation Valuation Capacity
2020 $14,020,000 $105,050,000 $5,998,182,800 $299,909,140 $194,859,140
2021 $6,810,000 $91,030,000 $6,438,498,510 $321,924,926 $230,894,926
2022 $7,445,000 $84,220,000 $6,631,653,465 $331,582,673 $247,362,673
2023 $8,150,000 $76,775,000 $6,830,603,069 $341,530,153 $264,755,153
2024 $8,905,000 $68,625,000 $7,035,521,161 $351,776,058 $283,151,058
2025 $9,630,000 $59,720,000 $7,246,586,796 $362,329,340 $302,609,340
2026 $10,405,000 $50,090,000 $7,463,984,400 $373,199,220 $323,109,220
2027 $11,185,000 $39,685,000 $7,687,903,932 $384,395,197 $344,710,197
2028 $12,090,000 $28,500,000 $7,918,541,050 $395,927,053 $367,427,053
2029 $6,530,000 $16,410,000 $8,156,097,282 $407,804,864 $391,394,864
2030 $5,685,000 $9,880,000 $8,400,780,200 $420,039,010 $410,159,010
2031 $2,025,000 $4,195,000 $8,652,803,606 $432,640,180 $428,445,180
2032 $2,170,000 $2,170,000 $8,912,387,714 $445,619,386 $443,449,386
Assessed Valuation Growth Rate Projections: 2019 Valuation
2020 Actual 8.02% $5,553,042,420
2021 Preliminary 7.34%
2022 & beyond Estimated 3.00%
table7

TABLE 8
TUMWATER SCHOOL DISTRICT
STUDENT GENERATION RATE
2020 - 2026 Capital Facilities Plan
Single Family Multiplier
Elementary School - Grades K-5 0.3010
Middle School - Grades 6-8 0.1720
High School - Grades 9-12 0.0890
TOTAL* 0.5610
Multifamily Multiplier
Elementary School - Grades K-5 0.0500
Middle School - Grades 6-8 0.0500
High School - Grades 9-12 0.0580
TOTAL 0.1580
STUDY DATE - SPRING 2020
* Total does not add due to rounding
table8
APPENDIX B
SCHOOL IMPACT FEE CALCULATION

SCHOOL IMPACT FEE CALCULATIONS
Tumwater School District
School Site Acquisition Cost:
((Acres x Cost per Acre)/Facility Capacity)xStudent Generation Factor
Student Student
Facility Cost/ Facility Factor Factor Cost/ Cost/
Acreage Acre Capacity SFR MFR SFR MFR
Elementary 15.00 600 0.301 0.050 $0 $0
Middle 25.00 750 0.172 0.050 $0 $0
High 55.00 150 0.089 0.058 $0 $0
TOTAL $0 $0
School Construction Cost:
((Facility Cost/Facility Capacity)xStudent Generation Factor)x(permanent/Total Sq Ft)
Student Student
%Perm/ Facility Facility Factor Factor Cost/ Cost/
Total Sq. Ft.. Cost Capacity SFR MFR SFR MFR
Elementary 94.50% 44,479,000$ 600 0.301 0.050 $21,086 $3,503
Middle 94.50% 750 0.172 0.050 $0 $0
High 94.50% 150 0.089 0.058 $0 $0
TOTAL $21,086 $3,503
Temporary Facility Cost:
((Facility Cost/Facility Capacity)xStudent Generation Factor)x(Temporary/Total Square Feet)
Student Student Cost/ Cost/
%Temp/ Facility Facility Factor Factor SFR MFR
Total Sq. Ft.. Cost Size SFR MFR
Elementary 5.50% $3,247,000 22 0.301 0.050 $2,443 $406
Middle 5.50% $0.00 25 0.172 0.050 $0 $0
High 5.50% $0.00 25 0.089 0.058 $0 $0
$2,443 $406
State Funding Assistance Credit:
Const. Cost Allocation X OSPI Square Footage X Funding Assistance% X Student Factor
Student Student
Area Cost OSPI District Factor Factor Cost/ Cost/
Allowance Footage Match % SFR MFR SFR MFR
Elementary $238.22 90 62.58% 0.301 0.050 $4,039 $671
Middle $238.22 117 62.58% 0.172 0.050
High $238.22 130 62.58% 0.089 0.058
$4,039 $671
Tax Payment Credit: SFR MFR
Average Assessed Value $324,274 $119,633
Capital Bond Interest Rate 2.62% 2.62%
Net Present Value of Average Dwelling $2,820,549 $1,040,573
Years Amortized 10 10
Property Tax Levy Rate $1.8500 $1.8500
Present Value of Revenue Stream $5,218 $1,925
Fee Summary: Single Multi-
Family Family
Site Acquisition Costs $0 $0
Permanent Facility Cost $21,086 $3,503
Temporary Facility Cost $2,443 $406
State Match Credit ($4,039) ($671)
Tax Payment Credit ($5,218) ($1,925)
FEE (AS CALCULATED) $14,273 $1,313
Discount Discount
65% $4,996 10% $1,181Fee with discount applied
September 23, 2020
Impact Fee

ATTACHMENT A
DISTRICT SCHOOL LOCATIONS
WITH NEW ATTENDANCE AREAS MAP

DELPHI ROAD
93RD
AVEN
UE
113TH
AVEN
UE
OLD HIGHWAY 99
70TH
LITTLEROCK ROAD
MAYT
OWN
ROAD
INTERSTATE 554TH
AVE.
BLACK LAKE BLVD.
BLACK
SAPP
ROAD
DELPHI ROAD
WADDELL CR
EEK ROAD
66TH
CROSBY BLVD.
BARNS BLVD.
88TH
AVE
CASE ROAD
89TH
AVE
RICH ROAD
RAINIER ROAD
RIXIE ROAD
LITTLEROCK ROAD
LAKE
TU
MW
AT
ER
KIMMIE STREET
TUMW
ATER
BLVD
3
2
7
9
51
8
4
6 11 12
10
1Bla
ck Lak
e2
East
Olymp
ia3
Little
rock
4Mi
chael
T. Sim
mons
5Pet
er G.
Schm
idt6
Tumw
ater H
ill
7G.W
. Bush
8Tu
mwate
r
9Bla
ck Hil
ls10
Tumw
ater
11Dis
trict
Offic
e12
Trans
portat
ion Ce
nter
Eleme
ntary
Scho
ols
Midd
le Sc
hools
High S
chools
Tumw
ater S
chool
Distri
ct


1
ATTACHMENT B
DISTRICT FUTURE SCHOOL SITES
& CONCEPTUAL SITE PLANS


Elementary School Site at Old 99 & 93rd
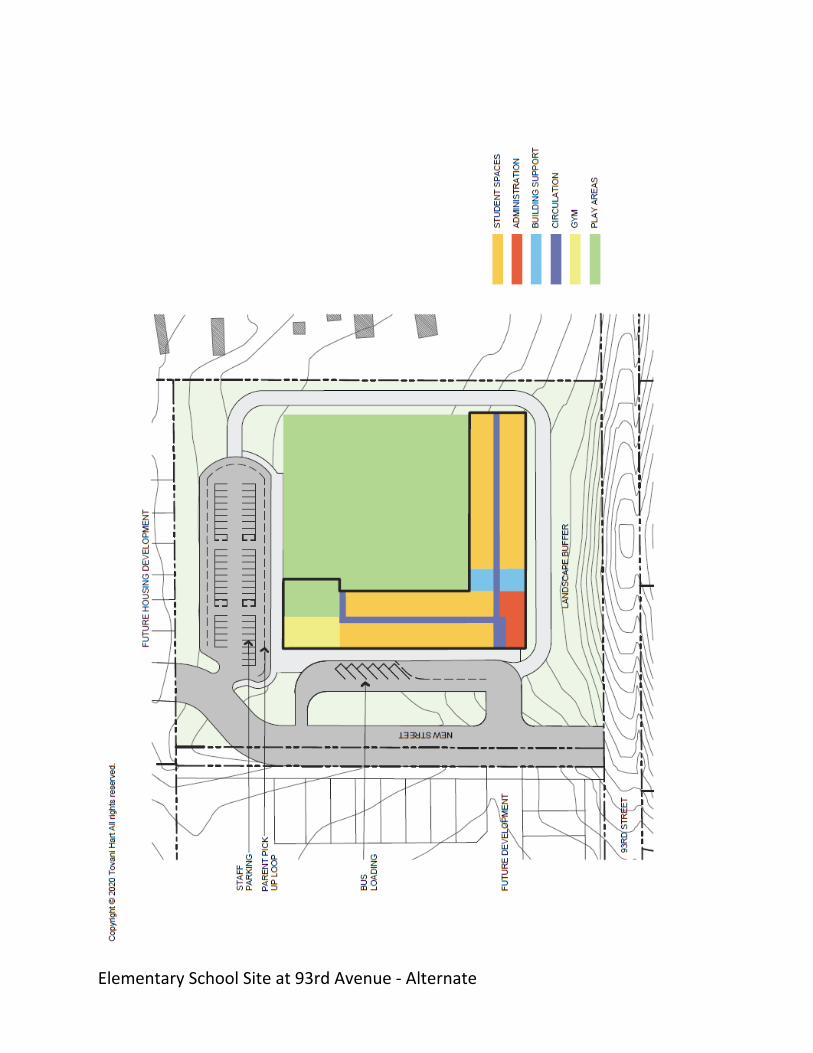
Elementary School Site at 93rd Avenue - Alternate

Elementary School Site at 70th & Kirsop
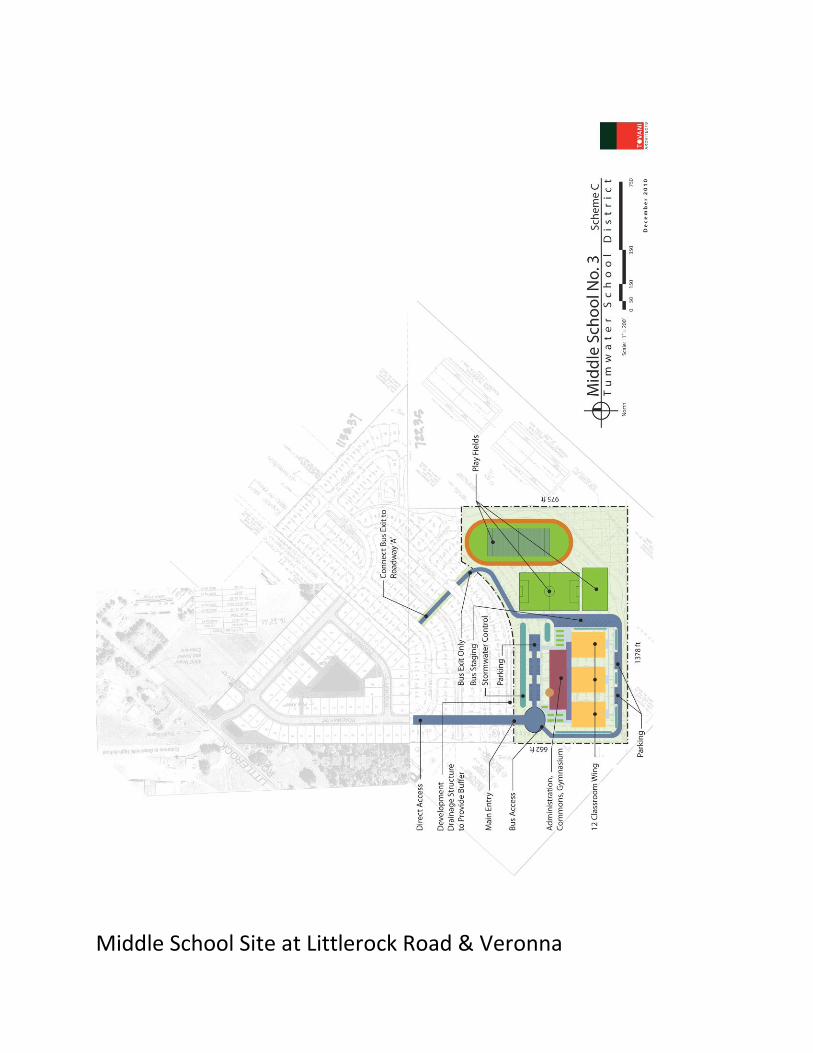
Middle School Site at Littlerock Road & Veronna

ATTACHMENT C
TUMWATER SCHOOL DISTRICT
STUDENT GENERATION RATE STUDY

1
MEMORANDUM
DATE: August 26, 2020
TO: Mel Murray, Director of Facilities, Tumwater School District
FROM: Rebecca Fornaby, Associate, BERK Consulting
Kevin Gifford, Senior Associate, BERK Consulting
Bryce Anderson, Associate, BERK Consulting
RE: Tumwater School Distinct Findings for Student Generation Rates 2020
Findings for Student Generation Rates
This memorandum contains findings for the Tumwater School District’s 2020 student generation rates
(SGR).
To calculate the SGR, BERK used current student address data provided by the District1 and current land
use and property records available from the Thurston County Assessor. BERK geocoded student addresses
using GIS software and matched address points to County property records; each matched address was
as single-family or multifamily, based on County property records.
The SGR was calculated based upon (1) housing units inside the District boundaries and constructed within
the last 5 years (2015 – 2019) and (2) the number of enrolled students currently living at those
addresses. Based on Thurston County Assessor records, the District contains 722 single-family homes and
240 multifamily housing units constructed in the last five years. An estimated 443 students live in these
housing units (405 in single-family homes and 38 in multifamily units).
The resulting findings are presented in the summary tables on the following page.
1 Some provided student addresses either could not be accurately geolocated or corresponded to parcels with no verifiable residential uses present. Addresses corresponding to temporary lodgings (hotels, motels, etc.) were also excluded.128 records were excluded based on these criteria.

Tumwater School District | Student Generation Rates 2020 2
Exhibit 1. 2020 Tumwater School District Student Generation Rates
2020 Tumwater School District Student Generation Rates
Single Family Multifamily
Elementary (K through 5) 0.301 0.050
Middle School (6 through 9) 0.172 0.050
High School (10 through 12) 0.089 0.058
Total 0.561 0.158
Exhibit 2. Tumwater School District Student Generation Rates by Grade Level
2020 Tumwater School District Student Generation Rates by Grade Level
Single Family Multifamily
Kindergarten 0.043 0.008
Grade 1 0.046 0.004
Grade 2 0.062 0.013
Grade 3* 0.055 -
Grade 4 0.047 0.021
Grade 5 0.047 0.004
Grade 6 0.051 0.021
Grade 7 0.037 0.008
Grade 8 0.043 0.013
Grade 9 0.040 0.008
Grade 10 0.037 0.013
Grade 11 0.030 0.038
Grade 12 0.021 0.008
Total (All Grades) 0.561 0.158
* No addresses for 3rd Grade students matched multifamily housing units constructed in the previous 5-year period. As such, a grade-level student generation rate could not be calculated for this group.

1
ATTACHMENT D
TUMWATER SCHOOL DISTRICT
2018 ENROLLMENT FORECAST

1
TUMWATER SCHOOL DISTRICT ENROLLMENT FORECAST
PREPARED BY GREENE GASAWAY PLLC
DECEMBER 18, 2018
This report is prepared by Greene Gasaway PLLC under subcontract with Parametrix. The
contract is to provide a projection of enrollment on a school-by-school basis in order to support
boundary revisions within the district.
Greene Gasaway PLLC (GGA) starts with district-wide projections; district-wide projections are
more common and are more reliable than school-by-school projections since they utilize larger
data sets. Once GGA selects the most likely district-wide projection, school-by-school
projections are made utilizing the same formulas used for the district-wide projections. Finally,
the school-by-school projections are modified to eliminate distortions and to adjust the total of
the school-by-school projections to approximate the district-wide projections.
Analysis of enrollment data in the State of Washington is based on October headcount data.
OSPI established October headcount as the monthly count most likely to represent the maximum
headcount for a school year. Greene Gasaway PLLC (GGA) uses two methods to project
district-wide enrollment; both utilize October headcount. First, a six-year cohort projection is
used to make a six-year enrollment projection. This method approximates the method utilized by
OSPI in projecting enrollment on Form 1049. The method is normally reliable for the near
future, and since OSPI uses Form 1049 in determining eligibility for state assistance funding, it
is an important reference projection. Second, GGA uses a proprietary model that uses residential
construction to generate students in a ratio that is consistent with Thurston Regional Planning
Council’s (TRPC’s) twenty-year projection of housing and population. These long-term
projections are only accurate if the underlying demographic assumptions utilized by the TRPC
demographers are accurate, and only if the anticipated rate of residential construction is close to
what developers eventually construct. The model is adjusted to project near-term enrollment
consistent with near-term cohort projections; twenty-year projections are consistent with TRPC’s
county-wide housing and population ratios. This model is then applied to the data for each
school to generate a school-by-school projection. The total of the school-by school projections is
tracked and the projection of each school is adjusted as required to maintain the total in the range
established by the district-wide projection.
This report analyzes trends in October headcount. It does not seek to project other significant
enrollment information (FTE trends, for example) which provide the basis of state funding of
operations, nor does it seek to analyze capacity nor to analyze the impact of class-size initiatives.
Projecting enrollment depends on analyzing consistent historical data in order to develop trends
which are assumed to remain consistent for a limited time in the future. Unusual events, known
as anomalies, limit our ability to develop historical trends. The economic collapse in the fall of
2008 disrupted most trends that were based on the previous six years. That anomaly has slowly
worked its way out of the data base; but the rate of residential construction has probably been

2
higher than normal since 2015 as pent up demand and historically low mortgage rates have
supported high rates of construction of residential units in recent years. Between 2000 and 2040
Thurston Regional Planning Council (TRPC) projects that an average of 370 residential units
(houses and apartments) will be constructed in Tumwater School District annually. The rate is
projected to be above average between 2016 and 2030 and below average the remainder of the
period. To the extent that the rate of growth in student enrollment corresponds to the rate of
occupancy of new residential units, we would expect faster growth in enrollment between 2016
and 2030 than during other periods between 2000 and 2040. There is a second trend which
influences our thinking about the rate of growth in school enrollment in Tumwater School
District, TRPC believes that the county is experiencing a baby-boom echo, or really a second
echo. We believe that the peak of this echo occurred between 2010 and 2015 which means that
enrollment between 2015 and 2030 would reflect larger classes in lower grades driving
enrollment growth initially in elementary grades, then progressively through middle school
grades and high school grades. The back side of the echo would be perceived as decreasing birth
rates and slower enrollment gains even with strong rates of construction.
In September 2018 Tumwater School District experienced another anomaly which significantly
impacted enrollment. The October 2018 enrollments do not follow the previous trends. It may
be that the nine-day teacher’s strike changed the decisions that parents and students made
regarding which school they chose to attend; it may be other events which have not yet been
identified created an anomaly. It is too early to tell how this anomaly will play out longer term,
but in the October 2018 headcount, the enrollment is significantly below what was anticipated
based on the October 2017 headcount. In the fall of 2017, OSPI projected (or would have
projected) Tumwater School District enrollment for 2018 at 7,172 students and for 2025 at 9,441
students. In October 2018, OSPI actually recorded 6,924 students and projected enrollment for
2025 at 7,596 students; 248 students fewer in 2018, and 1,845 students fewer in 2025.

3
GRAPH OF OCTOBER HEADCOUNT ENROLLMENT AS PROJECTED BY COHORT
METHODOLOGY BASED ON 2017 AND 2018 COUNTS
For the purposes of this report, Greene Gasaway assumes that the trends established in the years
2000 through 2017 will remain in place through 2040, and that the enrollment of October 2018
was, in fact, a one year anomaly which will gradually be overwhelmed by the underlying trends.
0
1000
2000
3000
4000
5000
6000
7000
8000
9000
10000
2012 2013 2014 2015 2016 2017 2018 2019 2020 2021 2022 2023 2024 2025
ENR
OLL
MEN
T -
OC
TOB
ER H
EAD
CO
UN
T
YEAR
TUMWATER SCHOOL DISTRICT2017 & 2018 COHORT ENROLLMENT PROJECTION
2017 COHORT PROJECTION
2018 COHORT PROJECTION

4
Since 1995 Greene Gasaway PLLC (GGA) has prepared enrollment projections for Thurston
County school districts. Over that time span, GGA has developed proprietary programs to
project school age populations that are consistent with TRPC’s housing and population
projections and that are based on the number of housing units constructed. This “model”
generally projects a continuation of the baby-boom echo over generations, and fewer students per
residential unit over time. It is generally consistent with a stable birth rate. GGA’s opinion of
future enrollment from 4 years to 20 years in the future is heavily influenced by the results of our
“modeling”.
Thurston Regional Planning Council provides demographic data not readily available in other
counties. TRPC provides county-wide population projections by five-year age cohort; the
cohorts from 0 to 20 provide an approximation of the school-age population in the county.
TRPC also provides projections of population and number of residential units by smaller
geographic areas. Upon request of a member organization, TRPC provides this data by
geographic areas requested by the member; TRPC provided population and housing data by
current elementary school boundary for Tumwater School District as part of this study.
GGA “modeling” is calibrated to roughly correspond to projections of population and number of
residential units projected by TRPC.
Current TRPC projections indicate an increase in the school-age population of approximately
22% between 2015 and 2040. The increase will be driven by both a baby-boom echo and by
increasing population due to-migration from outside of the county. The school districts will
experience this increase by a more rapid increase in elementary enrollment, followed by a more
rapid increase in middle school enrollment, followed by a more rapid increase in high school
enrollment. Enrollment growth at each grade grouping will slow as the effects of the baby-boom
growth moves through the system into older grades.
TRPC is projecting a decrease in the percent of the population that will be of school age; in other
words, the population will increase faster than the number of children of school age. Currently
TRPC estimates that nearly 16% of the population is of school age. By 2040, TRPC estimates
that this percent will fall to slightly below 14% of the county’s population. TRPC is projecting a
38% increase in county population, but only a 22% increase in school-age population. By
comparison, in 1980, TRPC estimates that the percent of the county population of school age
was approximately 21% of the population.
Translating the data to Tumwater School District (TSD), TRPC projects that population of TSD
will grow much faster than the county average; TRPC projects an increase in the population of
Tumwater School District of nearly 62% between 2015 and 2040. If TSD has the same percent
of the population of school-age as the county as a whole, approximately 15%, the school-age
population of the district would increase to approximately 9,500 students by 2040.

5
This report will provide district-wide and school-by-school projections for each of the schools
whose enrollments are geographically based. Secondary Options and Skills Center will not be
projected since enrollment at these facilities are not based on their service area. Over time,
however, as the school-age population increases, demand for services at these facilities are likely
to increase in proportion to the increase in the county’s school-aged population.
GRAPH OF OCTOBER HEADCOUNT ENROLLMENT AS PROJECTED BY TRPC DATA
(GGA METHODOLOGY)
0
2000
4000
6000
8000
10000
12000
20
12
20
13
20
14
20
15
20
16
20
17
20
18
20
19
20
20
20
21
20
22
20
23
20
24
20
25
20
26
20
27
20
28
20
29
20
30
20
31
20
32
20
33
20
34
20
35
20
36
20
37
20
38
20
39
20
40
ENR
OLL
MEN
T -
OC
TOB
ER H
EAD
CO
UN
T
YEAR
TUMWATER SCHOOL DISTRICTMODEL ENROLLMENT PROJECTION
2017 COHORT PROJECTION2018 COHORT PROJECTIONMODEL PROJECTED ENROLLMENT WITHOUT SECONDARY OPTIONS
6
Greene Gasaway PLLC has reviewed the school-by-school enrollment data provided by
Tumwater School District and begun to correlate that data with the data provided by the
Thurston Regional Planning Council. Enrollment data reflects not only the underlying
geographic data of where people choose to live, often because of educational services available,
but also choices that students and parents make regarding where to obtain those services.
Students can choose to attend public school, or any one of a number of other options. Students
can choose to attend their local school, or any other school to which they can obtain admittance.
Discrepancy in cohorts or divergence of enrollment data from population data often has an
explanation in rational decision-making by students or their parents.
Following are some of our initial observations of the TRPC data:
TRPC projects that the annual construction of residential units over the next 20
years will exceed the annual rate of construction of the last 15 years by over 20%.
TRPC projects that the annual construction of residential units will be highest in
the Michael T. Simmons Elementary School (MTS) service area, but the
construction of residential units in the Black Lake Elementary School (BL), East
Olympia Elementary School (EO), Tumwater Middle School (TMS), and Black
Hills High School (BHHS) service areas will also be above the district average.
TRPC projects that the annual construction of residential units in the Littlerock
Elementary School (LR) service area will slow significantly, and that the annual
construction in the Peter G. Schmidt Elementary School (PGS), Bush Middle
School (BMS) and Tumwater High School (THS) service areas will slow slightly.
TRPC anticipates that the number of students per residential unit will decrease
over time. The percent increase in enrollment is, therefore, expected to be less
than the percent increase in the number of residential units.
TRPC projects that the portion of multifamily units with decrease slightly by
2040.
Following are some of our initial observations of the Tumwater School District enrollment data:
data:
BL and THE have fewer students than what would be expected based on the
number of residential units in their service areas. We have maintained that
expectation in our projections
PGS has a higher enrollments than what would be expected based on the number
of residential units in their service areas. We have maintained that expectation in
our projections
BMS and THS have higher enrollments than what would be expected based on
the number of residential units in their service areas. We have maintained that
expectation in our projection.
TMS and BHHS have higher enrollments than what would be expected based on
the number of residential units in their service areas. We have maintained that
expectation in our projections.

7
Greene Gasaway PLLC has modeled the enrollment for the district and for each of the schools in
the district that have a geographical service area. We have not studied the Secondary Options or
Skills Center enrollments. We have plotted the anticipated enrollment for each facility on a
graph that also plots the 2017 and the 2018 cohort projection for that facility. In most cases the
model projects an enrollment between the 2017 cohort and the 2018 cohort. In service areas
with little projected residential development, the model projection flattens or dips. In service
areas with a great deal of projected residential development, the model shows large increases in
projected enrollment through the early 2030’s. The characteristics of the Thurston Regional
Planning Council’s population projection is such that little growth in enrollment is expected
between 2030 and 2040. The increase in population in that time period will be largely driven by
a larger proportion of older citizens living longer.
0
1000
2000
3000
4000
5000
6000
7000
8000
9000
10000
20
12
20
13
20
14
20
15
20
16
20
17
20
18
20
19
20
20
20
21
20
22
20
23
20
24
20
25
20
26
20
27
20
28
20
29
20
30
20
31
20
32
20
33
20
34
20
35
20
36
20
37
20
38
20
39
20
40
HEA
DC
OU
NT
-O
CTO
BER
EN
RO
LLM
ENT
YEAR
TUMWATER SCHOOL DISTRICTMODEL TOTAL
PROJECTED ENROLLMENT WITHOUT SECONDARY OPTIONS
2017 TOTAL 2018 COHORT ENROLLMENT MODEL WITHOUT SECONDARY OPTIONS

8
Graphing the model projection by grade-grouping; K-5, 6-8, 9-12; shows a diminishing baby-
boom echo structure with elementary enrollment increasing more rapidly initially, followed by
growth in the middle school grades and the high school grades.
0
1000
2000
3000
4000
5000
6000
7000
8000
9000
10000
20
12
20
13
20
14
20
15
20
16
20
17
20
18
20
19
20
20
20
21
20
22
20
23
20
24
20
25
20
26
20
27
20
28
20
29
20
30
20
31
20
32
20
33
20
34
20
35
20
36
20
37
20
38
20
39
20
40
HEA
DC
OU
NT
-O
CTO
BER
EN
RO
LLM
ENT
YEAR
TUMWATER SCHOOL DISTRICTMODEL TOTAL
PROJECTED ENROLLMENT WITHOUT SECONDARY OPTIONS
ENROLLMENT MODEL - ELEMENTARYENROLLMENT MODEL - MIDDLE SCHOOLENROLLMENT MODEL - HIGH SCHOOLENROLLMENT MODEL WITHOUT SECONDARY OPTIONS

9
Greene Gasaway PLLC has projected the enrollment of each facility using the 2017 cohort, the
2018 cohort and the enrollment model. The enrollment model generally falls between the 2017
cohort and the 2018 cohort. Graphing only the model projection for each facility by grade-
grouping provides a visualization of the relative growth anticipated in each service area.
Elementary school, middle school and high school graphs follow.
0
100
200
300
400
500
600
700
800
900
1000
20
12
20
13
20
14
20
15
20
16
20
17
20
18
20
19
20
20
20
21
20
22
20
23
20
24
20
25
20
26
20
27
20
28
20
29
20
30
20
31
20
32
20
33
20
34
20
35
20
36
20
37
20
38
20
39
20
40
HEA
DC
OU
NT
-O
CTO
BER
EN
RO
LLM
ENT
YEAR
TUMWATER SCHOOL DISTRICTELEMENTARY SCHOOL PROJECTED ENROLLMENT
BLACK LAKE ES EAST OLYMPIA ES LITTLEROCK ES
MICHAEL T SIMMONS ES PETER G. SCHMIDT ES TUMWATER HILL ES

10
0
200
400
600
800
1000
1200
14002
01
2
20
13
20
14
20
15
20
16
20
17
20
18
20
19
20
20
20
21
20
22
20
23
20
24
20
25
20
26
20
27
20
28
20
29
20
30
20
31
20
32
20
33
20
34
20
35
20
36
20
37
20
38
20
39
20
40
HEA
DC
OU
NT
-O
CTO
BER
EN
RO
LLM
ENT
YEAR
TUMWATER SCHOOL DISTRICTMIDDLE SCHOOL PROJECTED ENROLLMENT
BUSH MS TUMWATER MS

11
The graphs for each facility show the 2017 cohort, the 2018 cohort and the model projection.
The cohort projections only extend to 2025. Cohort projections are only used to project about
six years into the future. The model projections extend to 2040. Thurston Regional Planning
Council provides population and residential unit projections to 2040. Model projections are only
accurate to the extent that the underlying assumptions are accurate.
0
200
400
600
800
1000
1200
1400
1600
18002
01
2
20
13
20
14
20
15
20
16
20
17
20
18
20
19
20
20
20
21
20
22
20
23
20
24
20
25
20
26
20
27
20
28
20
29
20
30
20
31
20
32
20
33
20
34
20
35
20
36
20
37
20
38
20
39
20
40
HEA
DC
OU
NT
-O
CTO
BER
EN
RO
LLM
ENT
YEAR
TUMWATER SCHOOL DISTRICTHIGH SCHOOL PROJECTED ENROLLMENT
BLACK HILLS HS TUMWATER HS

12
0
100
200
300
400
500
600
700
20
12
20
13
20
14
20
15
20
16
20
17
20
18
20
19
20
20
20
21
20
22
20
23
20
24
20
25
20
26
20
27
20
28
20
29
20
30
20
31
20
32
20
33
20
34
20
35
20
36
20
37
20
38
20
39
20
40
HEA
DC
OU
NT
-O
CTO
BER
EN
RO
LLM
ENT
YEAR
BLACK LAKE ELEMENTARY SCHOOLPROJECTED ENROLLMENT
2017 COHORT 2018 COHORT ENROLLMENT MODEL

13
0
100
200
300
400
500
600
700
800
20
12
20
13
20
14
20
15
20
16
20
17
20
18
20
19
20
20
20
21
20
22
20
23
20
24
20
25
20
26
20
27
20
28
20
29
20
30
20
31
20
32
20
33
20
34
20
35
20
36
20
37
20
38
20
39
20
40
HEA
DC
OU
NT
-O
CTO
BER
EN
RO
LLM
ENT
YEAR
EAST OLYMPIA ELEMENTARY SCHOOLPROJECTED ENROLLMENT
2017 COHORT 2018 COHORT ENROLLMENT MODEL

14
0
50
100
150
200
250
300
350
400
4502
01
2
20
13
20
14
20
15
20
16
20
17
20
18
20
19
20
20
20
21
20
22
20
23
20
24
20
25
20
26
20
27
20
28
20
29
20
30
20
31
20
32
20
33
20
34
20
35
20
36
20
37
20
38
20
39
20
40
HEA
DC
OU
NT
-O
CTO
BER
EN
RO
LLM
ENT
YEAR
LITTLEROCK ELEMENTARY SCHOOLPROJECTED ENROLLMENT
2017 COHORT 2018 COHORT ENROLLMENT MODEL

15
0
200
400
600
800
1000
12002
01
2
20
13
20
14
20
15
20
16
20
17
20
18
20
19
20
20
20
21
20
22
20
23
20
24
20
25
20
26
20
27
20
28
20
29
20
30
20
31
20
32
20
33
20
34
20
35
20
36
20
37
20
38
20
39
20
40
HEA
DC
OU
NT
-O
CTO
BER
EN
RO
LLM
ENT
YEAR
MICHAEL T. SIMMONS ELEMENTARY SCHOOLPROJECTED ENROLLMENT
2017 COHORT 2018 COHORT ENROLLMENT MODEL

16
0
200
400
600
800
1000
1200
14002
01
2
20
13
20
14
20
15
20
16
20
17
20
18
20
19
20
20
20
21
20
22
20
23
20
24
20
25
20
26
20
27
20
28
20
29
20
30
20
31
20
32
20
33
20
34
20
35
20
36
20
37
20
38
20
39
20
40
HEA
DC
OU
NT
-O
CTO
BER
EN
RO
LLM
ENT
YEAR
PETER G. SCHMIDT ELEMENTARY SCHOOLPROJECTED ENROLLMENT
2017 COHORT 2018 COHORT ENROLLMENT MODEL

17
0
100
200
300
400
500
600
7002
01
2
20
13
20
14
20
15
20
16
20
17
20
18
20
19
20
20
20
21
20
22
20
23
20
24
20
25
20
26
20
27
20
28
20
29
20
30
20
31
20
32
20
33
20
34
20
35
20
36
20
37
20
38
20
39
20
40
HEA
DC
OU
NT
-O
CTO
BER
EN
RO
LLM
ENT
YEAR
TUMWATER HILL ELEMENTARY SCHOOLPROJECTED ENROLLMENT
2017 COHORT 2018 COHORT ENROLLMENT MODEL

18
0
200
400
600
800
1000
12002
01
2
20
13
20
14
20
15
20
16
20
17
20
18
20
19
20
20
20
21
20
22
20
23
20
24
20
25
20
26
20
27
20
28
20
29
20
30
20
31
20
32
20
33
20
34
20
35
20
36
20
37
20
38
20
39
20
40
HEA
DC
OU
NT
-O
CTO
BER
EN
RO
LLM
ENT
YEAR
BUSH MIDDLE SCHOOLPROJECTED ENROLLMENT
2017 COHORT 2018 COHORT ENROLLMENT MODEL

19
0
200
400
600
800
1000
1200
14002
01
2
20
13
20
14
20
15
20
16
20
17
20
18
20
19
20
20
20
21
20
22
20
23
20
24
20
25
20
26
20
27
20
28
20
29
20
30
20
31
20
32
20
33
20
34
20
35
20
36
20
37
20
38
20
39
20
40
HEA
DC
OU
NT
-O
CTO
BER
EN
RO
LLM
ENT
YEAR
TUMWATER MIDDLE SCHOOLPROJECTED ENROLLMENT
2017 COHORT 2018 COHORT ENROLLMENT MODEL
20
0
200
400
600
800
1000
1200
1400
1600
18002
01
2
20
13
20
14
20
15
20
16
20
17
20
18
20
19
20
20
20
21
20
22
20
23
20
24
20
25
20
26
20
27
20
28
20
29
20
30
20
31
20
32
20
33
20
34
20
35
20
36
20
37
20
38
20
39
20
40
HEA
DC
OU
NT
-O
CTO
BER
EN
RO
LLM
ENT
YEAR
BLACK HILLS HIGH SCHOOLPROJECTED ENROLLMENT
2017 COHORT 2018 COHORT ENROLLMENT MODEL

21
0
200
400
600
800
1000
1200
1400
16002
01
2
20
13
20
14
20
15
20
16
20
17
20
18
20
19
20
20
20
21
20
22
20
23
20
24
20
25
20
26
20
27
20
28
20
29
20
30
20
31
20
32
20
33
20
34
20
35
20
36
20
37
20
38
20
39
20
40
HEA
DC
OU
NT
-O
CTO
BER
EN
RO
LLM
ENT
YEAR
TUMWATER HIGH SCHOOLPROJECTED ENROLLMENT
2017 COHORT 2018 COHORT ENROLLMENT MODEL
****END****