capital debt affordability committee - conduit street · capital debt affordability committee ......
TRANSCRIPT

Capital Debt Affordability Committee Treasurer Nancy K. Kopp, Chair
Louis L. Goldstein Treasury Building 80 Calvert Street, Assembly Room
Annapolis, MD 21401
Agenda
September 2, 2015 2:00 PM
1) Treasurer’s Opening Comments
2) 2015 Legislative Session General Assembly Actions
Department of Legislative Services: Patrick Frank, Manager – 2015 Legislative Session
3) Review of the Size and Condition of Tax Supported Debt: Summary of fiscal year 2015 bond issuances Amount issued in prior five fiscal years Amount outstanding Amount authorized but unissued Current projections for new issuances Debt service projections Status of refunding potential
A) General Obligation Bonds
State Treasurer’s Office: Nikki Griffith, Deputy Director of Debt Management
B) Capital Leases State Treasurer’s Office: Calvin Harding, Lease Administrator
C) GARVEE Bonds Maryland Transportation Authority: Alison Williams, Debt Management Director
D) Maryland Stadium Authority Maryland Stadium Authority: David Raith, Chief Financial Officer
E) Bay Restoration Bonds Maryland Water Quality Financing Administration: Jag Khuman, Director
F) Consolidated Transportation Bonds Maryland Department of Transportation, Office of Finance: David Fleming, Chief Financial Officer
4) Status of Affordability Ratios State Treasurer’s Office: Nikki Griffith, Deputy Director of Debt Management


2015 Legislative Session General Assembly Action

2015 Legislative Session General Assembly Highlights Bonds Authorized by the General Assembly • New General Obligation (GO) Bond Debt Authorized Totals $1,045 Million: The
Capital Debt Affordability Committee (CDAC) limits GO bond debt service to 8% of State revenues and debt outstanding to 4% of revenues. In recent years, debt service expenditures have approached the limit. To keep within the limit, the State may need to adjust GO bond authorizations if the Board of Revenue Estimates (BRE) adjusts out-year revenues downward. Actions taken in the last year reflect this dynamic:
o In October 2014, CDAC recommended limiting GO bond authorizations to
$1,170 million;
o In December 2014, BRE reduced its fiscal 2015 to 2020 revenue estimates. In response, the Spending Affordability Committee (SAC) reduced the debt limit to $1,095 million;
o The State Treasurer estimated that authorizations should not exceed $1,045
million;
o The administration introduced a capital budget totaling just under $995 million; and
o The capital budget bill (House Bill 71/Chapter 495) authorizes $1,045 million in
net GO debt, $1,064 million in new GO debt offset by deauthorizing $19 million in previously authorized GO debt.
• Qualified Zone Academy Bonds (QZABs): House Bill 110 (Chapter 401) authorizes
$4.6 million in QZABs. This is the federal allocation that must be issued by the end of calendar 2015. QZABs support the Aging Schools Program.
• New Academic Revenue Debt Authorization Totals $54.5 Million: CDAC and SAC
recommended that academic revenue bond debt issued in fiscal 2014 be limited to $34.5 million.1 In House Bill 1182 (Chapter 471), the General Assembly increased the authorization by $20.0 million to support a new bioengineering building at the University of Maryland, College Park. The project is also supported by $20.0 million in private donations and $1.9 million in institutional funds. The legislation includes the
1 This $34.5 million provides $17.0 million for facilities renewal projects budgeted within the USM system office; $12.5 million for the New Academic Commons building at Salisbury University; and $5.0 million for campus-wide building system and infrastructure improvements at the University of Maryland, College Park (UMCP).

Department of Legislative Services
2
legislature’s intent that the planned fiscal 2017 and 2018 authorizations be reduced by $10.0 million each, to reflect that the funds are provided in fiscal 2016.
Uses of Bond Authorizations • GO Bonds Support Program Open Space to Mitigate Programmatic Effects of
Depositing Transfer Tax Revenues in the General Fund: Transfer tax revenues support the State’s land conservation programs. The Budget Reconciliation and Financing Act (BRFA) of 2013 (Chapter 425) authorized the transfer of $77.7 million in transfer tax revenues to the general fund in fiscal 2016. In addition, the administration’s BRFA of 2015 (Chapter 489) increased the amount of this transfer by $37.7 million in transfer tax revenues into the general fund for a total of $115.4 million. As enacted, the budget provides $87.2 million for land conservation programs. This includes $38.9 million in GO bonds and $43.4 million in bond sale premiums (details are discussed in the next bullet). Though substantial, this amount is less than the $115.4 million in lost transfer tax revenues.
• Bond Premiums to Support Capital Projects: Since 2001, the State has been generating
substantial bond sale premiums with each GO bond sale to institutional investors. These surplus proceeds are attributable to market conditions. Section 8-132 of the State Finance and Procurement Article require that any premium remaining (after the expenses of the bond sale are paid) is deposited into the Annuity Bond Fund (ABF). The capital budget authorized $48.4 million fiscal 2015 and 2016 bond sale premiums for additional capital projects;2 $18.4 million from the March 2015 bond sale and $30.0 million from July 2015 bond sale. The July bond sale generated a $43.7 million premium, of which $30.0 million supports capital projects and the remaining $13.7 million is deposited into the ABF to support GO bond debt service costs.
Watershed Implementation Plan Is Not Recognized by Spending Plans • Watershed Implementation Plan: The Transportation Infrastructure Investment Act of
2013 (Chapter 429) requires the Governor to include a total of $395 million in the fiscal 2015 to 2019 operating budgets or Capital Improvement Program (CIP) to support the State Highway Administration’s efforts to comply with the Watershed Implementation Plan. In the fiscal 2016 capital budget, the administration included $65 million in GO bonds. The legislation requires an additional $85 million in fiscal 2017, $100 million in fiscal 2018, and $100 million in fiscal 2019. The General Assembly adopted committee narrative expressing the intent that GO bonds or unbudgeted bond premium revenues be used to satisfy the funding commitment for these watershed implementation projects.
2 Projects funded are $21.6 million for State Program Open Space, $0.4 million for local Program Open Space, $9.4 million for the Rural Legacy Program, and $17.0 million for the Maryland Agricultural Land Preservation Program.

Department of Legislative Services
3
The administration does not include fiscal 2017 to 2019 funding for the project in the operating budget forecast, Capital Improvement Plan, or Transportation Trust Fund.

General Obligation Bonds

1
2015 Update on
Maryland General Obligation Bonds
for the
Capital Debt Affordability Committee
September 2, 2015

2
Topics of Discussion
1) FY 2015 and 2016 YTD General Obligation (GO) Bond Issuances
2) Amount of GO Bonds Issued in Prior Five Fiscal Years
3) Outstanding GO Debt and Amounts Authorized but Unissued
4) Current Projections for Future Issuances
5) Summary of Projected Debt Activity
6) Status of Refunding Potential 7) Use of Variable Rate Debt, Derivatives and GICS

3
Fiscal Year 2015 GO Bond Issuances
Series Dates of Sales
($ in millions)
Overall True Interest Cost
(TIC) Tax-Exempt: New Money Competitive
Tax-Exempt: New Money Negotiated
Tax-Exempt: Refunding
Competitive Taxable
Taxable: Federal Tax
Credit
2014 Second Series A 8/5/14 $50.4
2.58% 2014 Second
Series B 8/5/14 $449.6
2014 Second Series C 8/5/14 $649.7 1.88%
2014 QZAB 12/18/14 $4.6 0.00%(a)
2015 First Series A 3/17/15 $518.0 2.64%
2015 First Series B 3/17/15 $365.4 2.14%
Fiscal Year 2015 General Obligation Bond Issues Totaled $2.04 Billion
(a) The 2014 Qualified Zone Academy Bonds (QZABs) are special, federally-authorized taxable bonds where the bondholders receive federal tax credits in lieu of interest payments.

4
Fiscal Year 2016 Year To Date GO Bond Issuances
Series Dates of Sales
($ in millions)
Overall True Interest Cost
(TIC) Tax-Exempt: New Money Competitive
Tax-Exempt: New Money Negotiated
Tax-Exempt: Refunding
Competitive Taxable
Taxable: Federal Tax
Credit
2015 Second Series A 8/3/15 $450.0 2.83%
1.35% 2015 Second Series B 8/3/15 $50.0
Fiscal Year 2016 YTD General Obligation Bond Sales Total $500 Million

5
GO Bonds Issued in Prior Five Fiscal Years (2011 – 2016 YTD)
$6.65 billion in General Obligation Bonds issued since July 1, 2011:
$6.39 billion in tax-exempt bonds (decrease of $943 million from previous 5 years) • $4.40 billion in tax-exempt, new money bonds (69%) • $2.0 billion in tax-exempt, refunding bonds (31%)
$260.3 million in taxable bonds (decrease of $584 million from previous 5 years)
• $213.4 million in taxable bonds (82%) • $46.9 million in special taxable Federal subsidy bonds (18%)
• $40.4 million in taxable, direct subsidy Qualified Zone Academy Bonds (QZABs), last issuance in FY 2015
• $6.5 million in taxable, direct subsidy Qualified Energy Conservation Bonds (QECBs), last issuance in FY 2012

6
Outstanding GO Debt and Amounts Authorized but Unissued
General obligation debt outstanding:
• $8.82 billion was outstanding as of August 3, 2015, the most recent general obligation bond sale
• $8.68 billion was outstanding as of June 30, 2015 • Since June 30, 2015:
• $500 million issued • $358 million retired
$2.06 billion of general obligation debt was authorized but unissued as of
August 3, 2015 (which includes the FY 2016 authorization amount of $1.05 billion).

Current Projections for Future Issuances – October 2014 CDAC Report
For planning purposes only, the Committee in October 2014 recommended a $75 million increase in GO Bond authorizations for FY 2017 – 2020. The following authorizations and issuances incorporate those increases:
7
Fiscal Year Authorizations Issuances 2016 $1,170 $1,056 2017 $1,180 $1,125 2018 $1,275 $1,193 2019 $1,315 $1,239 2020 $1,355 $1,285

Events Following the October 2014 CDAC Report
At the December 2014 meeting, the Board of Revenue Estimates voted to reduce FY 2015 and FY 2016 revenue estimates.
In response, STO re-analyzed the debt affordability ratios. The Treasurer sent a letter to the Governor and General Assembly, which was
shared with the CDAC members. The letter noted that the original authorization would now exceed the 8.0% debt service to revenue guideline and that to remain within the guidelines, the FY 2016 authorization would have to be limited to $1,045 million.
The Spending Affordability Committee recommended an authorization amount of $1,095 million.
The Governor’s Proposed Capital Budget included a $995 million GO authorization for FY 2016.
The final authorization amount for FY 2016 approved in the 2015 Legislative Session was $1,045 million. 8

Current Projections for Future Issuances – Following 2015 Legislative Session
The $1,045 million authorization amount for FY 2016 was reduced from the CDAC recommended amount, therefore reducing planned issuance in out years. The table below still includes an additional $75 million in FY 2017 – FY 2020 for planning purposes.
9
Fiscal Year Authorizations Issuances 2016 $1,045 $1,018 $500 issued 8/3 2017 $1,180 $1,094 ($ in millions) 2018 $1,275 $1,168 2019 $1,315 $1,221 2020 $1,355 $1,274
Annual authorizations are expected to be issued over a 5 year period, based on historical patterns.

Current Projections for Future Issuances – CDAC Baseline
The table below does not include an additional $75 million in FY 2017 – FY 2020, rather it is based on the CDAC baseline authorization (3% annual growth rate) for planning purposes.
10
Based on the December 2014 assumptions, these authorization levels would result in adherence to the affordability benchmarks.
Fiscal Year Authorizations Issuances
2016 $1,045 $1,018 $500 issued 8/3
2017 $1,105 $1,071 ($ in millions)
2018 $1,200 $1,126
2019 $1,240 $1,164
2020 $1,280 $1,206
Annual authorizations are expected to be issued over a 5 year period, based on historical patterns.

Current Projections for Future Issuances – FY 2016 Capital Budget
The table below is based on the projected authorizations in the Governor’s Proposed FY 2016 Capital Budget.
11
Based on the December 2014 assumptions, these authorization levels would result in adherence to the affordability benchmarks.
Fiscal Year Authorizations Issuances
2016 $1,045 $1,018 $500 issued 8/3
2017 $1,029 $1,047 ($ in millions)
2018 $1,059 $1,063
2019 $1,073 $1,061
2020 $1,025 $1,045
Annual authorizations are expected to be issued over a 5 year period, based on historical patterns.

Fiscal Year
Debt Outstanding Start of Year
New Issues Redeemed
Debt Outstanding End of Year Debt Service
2016 $8,677 $1,018 $735 $8,960 $1,121
2017 $8,960 $1,094 $786 $9,268 $1,188
2018 $9,268 $1,168 $836 $9,600 $1,257
2019 $9,600 $1,221 $853 $9,968 $1,295
2020 $9,968 $1,274 $902 $10,331 $1,362
2021 $10,331 $1,307 $918 $10,719 $1,403
2022 $10,719 $1,333 $962 $11,086 $1,468
2023 $11,086 $1,351 $1,013 $11,418 $1,540
2024 $11,418 $1,380 $1,055 $11,743 $1,600
Summary of Projected Debt Activity with additional $75 million
12 Future Issuances assume a 5.0% interest rate. All dollars in millions All debt matures within 15 years and principal payments begin in year 3. Calculations incorporate the August 3, 2015 GO Bond sale.
For planning purposes only, the additional $75 million in GO Bond authorizations for FY 2017 – 2020 are included in the following debt outstanding and debt service projections.

Fiscal Year
Debt Outstanding Start of Year
New Issues Redeemed
Debt Outstanding End of Year Debt Service
2016 $8,677 $1,018 $735 $8,960 $1,121
2017 $8,960 $1,071 $786 $9,245 $1,188
2018 $9,245 $1,126 $836 $9,535 $1,256
2019 $9,535 $1,164 $853 $9,845 $1,291
2020 $9,845 $1,206 $900 $10,142 $1,355
2021 $10,142 $1,255 $915 $10,482 $1,389
2022 $10,482 $1,300 $955 $10,822 $1,449
2023 $10,822 $1,333 $1,002 $11,149 $1,515
2024 $11,149 $1,380 $1,040 $11,489 $1,572
Summary of Projected Debt Activity CDAC Baseline (3% annual growth)
13 Future Issuances assume a 5.0% interest rate. All dollars in millions All debt matures within 15 years and principal payments begin in year 3. Calculations incorporate the August 3, 2015 GO Bond sale.
The following debt outstanding and debt service is projected for GO Bonds, using CDAC baseline assumptions for authorizations.

Fiscal Year
Debt Outstanding Start of Year
New Issues Redeemed
Debt Outstanding End of Year Debt Service
2016 $8,677 $1,018 $735 $8,960 $1,121
2017 $8,960 $1,047 $786 $9,221 $1,188
2018 $9,221 $1,063 $836 $9,449 $1,255
2019 $9,449 $1,061 $853 $9,657 $1,287
2020 $9,657 $1,045 $899 $9,794 $1,344
2021 $9,794 $1,130 $910 $10,014 $1,367
2022 $10,014 $1,211 $944 $10,277 $1,414
2023 $10,277 $1,280 $981 $10,571 $1,467
2024 $10,571 $1,380 $1,011 $10,939 $1,514
Summary of Projected Debt Activity Governor’s Proposed FY 2016 Capital Budget
14 Future Issuances assume a 5.0% interest rate. All dollars in millions All debt matures within 15 years and principal payments begin in year 3. Calculations incorporate the August 3, 2015 GO Bond sale.
The following debt outstanding and debt service is projected for GO Bonds, using the Governor’s Proposed FY16 Capital Budget assumptions for authorizations.

15
Status of Refunding Potential
An analysis is prepared by the State’s financial advisor before each bond sale to determine the financial feasibility of a refunding.
Benchmarks are 3% net present value savings and an Opportunity Cost Index (OCI) which is greater than 70%. The OCI is a measure of the refunding savings in comparison to projected savings in the future.
The two refunding issues in FY 2015 generated $80.1 million in debt service savings on a net present value (NPV) basis.
The State has been aggressive in pursuing refunding savings, resulting in a debt service savings of $138 million over the past five fiscal years to date.

16
Use of Variable Rate Debt, Bond Insurance, Derivatives, and Guaranteed Investment
Contracts (GICS)
The State is authorized to issue variable interest rate bonds in an amount no more than 15% of the outstanding general obligation indebtedness. The State has not issued any variable rate debt as of August 31, 2015 and has not executed any derivatives. The State did not enter into any new GICs related to the issuance of general obligation bonds in FY 2015.
Because of the State’s strong credit profile, perception in the market and maintenance of its AAA credit rating, there has been no need for bond insurance.


Capital Leases

1
An Update of Tax-Supported Leases
for the 2015 Capital Debt Affordability
Committee

2
Topics of Discussion
Status of • Capital Lease Guidelines • Tax-Supported Leases in the CDAC Analysis • Tax-Supported Energy Leases that are included in the CDAC
Analysis • Tax-Supported Energy Leases that are not included in the
CDAC Analysis • Capital Equipment and Energy Lease Activity in Fiscal Year
2015 • Projections of Future Tax-Supported Lease Financings

Capital Lease Guidelines
• STO on behalf of BPW, determines the size, timing, and method to finance capital assets for State agencies and manages the lease procurement and payment of debt service.
• Capital Facility Lease terms range from 15 – 25 years. • Energy Performance Contract (EPC) Leases for energy conservation
projects at State facilities are limited to a 15 year term and require the ESCO to post a bond to guarantee the energy savings.
– DGS in cooperation with STO monitors whether the guarantee continues to cover debt service on an annual basis.
– If the guarantee lapses or falls below the annual debt service amount, the lease is included in tax-supported debt ratios.
• Capital Equipment Lease terms are limited to 3, 5 or 10 years. • Equipment is required to:
– Have a useful life at least as long as the financing term and the cost should be a material amount;
– Be re-possessable and easily identifiable.
3

4
Tax-Supported Leases in the CDAC Analysis
The following table summarizes the current tax-supported leases for FY 2015 included in the 2015 CDAC Affordability Analysis.
*Maryland Stadium Authority reports the Stadium Authority Capital leases in their debt.
FY 2015 Tax-Supported Lease Financings Outstanding
State Agency Equipment and Facilities Financed
Principal Amount
Outstanding as of 6/30/15
Debt Service for FY 2015
State Treasurer’s Office on behalf of State Agencies
Capital Equipment Leases Various communications, computers and other equipment
$12,024,552* $5,173,409*
State Treasurer’s Office on behalf of State Agencies
Energy Performance Projects 4,442,882* 2,991,938*
Department of Transportation Headquarters Office Building 16,690,000 2,792,175 MAA Shuttle Buses - BWI 2,500,000 1,410,800
Department of General Services Hilton Street Facility 670,000 240,924 Prince George’s County Justice Center 16,853,163 1,515,793
Transportation Authority State office parking facility 17,845,000 1,524,255 Lottery Ocean Downs and Perryville 8,555,000 8,679,574 Department of Health and Mental Hygiene
Public Health Lab 158,200,000 13,988,313
Total Tax-Supported Leases $237,780,597 $38,317,181

5
Tax-Supported Energy Leases included in the CDAC Analysis
Energy lease project Debt Service for FY 2015
Debt Outstanding as of 6/30/2015
UMS – Baltimore Campus (UMBC) $643,600 $615,987
DGS - State Office Complex 908,233 1,285,631
DHMH - Rosewood Center 383,326 546,283
DHMH - Rosewood Center 156,934 294,729
St. Mary's College of Maryland 205,295 927,858
Veterans Affairs 56,638 461,491
DHMH – Springfield Hospital 637,912 310,903
Total $2,991,938 $4,442,882
The following table summarizes the current tax-supported Energy leases in the 2015 CDAC Analysis for FY 2015.

6
Tax-Supported Energy Leases that are not included in the CDAC Analysis
The following table summarizes the current tax-supported Energy leases not included in the 2015 CDAC Analysis for FY 2015.
* The listing does not include the Maryland Stadium Authority projects.
Energy lease project * Debt Service for FY 2015 Debt Outstanding as of
6/30/2015
DGS – District Court & Multi – Service Centers
$388,320 $549,837
Maryland School for the Deaf 291,257 412,919
DPSCS – Hagerstown Prison 488,395 1,997,033
DHMH- Deer’s Head Hospital 255,946 928,292
Spring Grove Hospital 1,896,641 12,486,789
Spring Grove Hospital (Modification) 138,649 1,004,452
Department of Agriculture 194,960 1,429,662
DGS - Multi-Service Centers 1,588,714 12,425,270
University of Baltimore 649,125 5,338,303
UMCP 1,836,990 14,806,969
UMCES (Horn Point Lab) 148,783 1,190,846
State Police 483,258 3,902,785
Workforce Technology 169,101 1,327,398
DPSCS – Jessup 1,713,906 8,769,717
Maryland Aviation Administration 1,600,404 14,551,728
State Highway Administration 1,828,852 16,974,807
Maryland Transit Administration 493,823 4,583,501
Maryland Port Administration 1,006,742 9,759,979
Total $15,173,866 $112,440,287

7
Capital Equipment and Energy Lease Activity in Fiscal Year 2015
Equipment • Provides financing of capital equipment to state agencies. • Capital Equipment lease contracts financed $3.8 million during Fiscal Year 2015.
Summary of the Lease Terms for Equipment
Financed in Fiscal Year 2015
3-yr leases $1,628,706 5-yr leases 2,172,468
Total $3,801,174
Energy • Provides financing for energy conservation projects for State agencies. • Lease payments are made from the participating agencies’ annual utility appropriations using savings achieved through the
implementation of energy performance contracts. • No Energy lease financings were closed in Fiscal Year 2015.
Summary of the Lease Terms for Energy Projects
Financed in Fiscal Year 2015
Energy lease $0 Total $0

8
Projections of Future Tax-Supported Lease Financings
in the CDAC Analysis
Types of Financing Period CDAC projections as of June 2015* Equipment Leases (1) Fiscal Years 2016 – 2020 (1) $20 million for FY 2016, $10
million for FY 2017, and $5 million in FY 2018 – 2020.
Energy Leases (2) Fiscal Years 2016 - 2020 $13.0 million for FY 2016, $24 million for FY 2017 and $0 through FY 2020.
Other Capital Leases (3) Fiscal Years 2016 - 2020 $33.0 million in FY 2018.
(1) Fiscal Year 2016- 2018 based on agency survey’s received May 2015. (2) DGS estimates that approximately $13.0 million in energy projects will be financed in FY 2016.
Maryland Environmental Services estimates that approximately $24 million in energy projects will be financed in FY 2017. All of the projected Energy Lease financings include projects that will have surety bond guarantees that equal or exceed the debt service payments through out the term of the lease; therefore, these projects are not included in the CDAC Affordability Analysis.
(3) MDOT and MEDCO expect to issue $33 million in Lease Revenue bonds for the State Center parking garage in FY 2018.
* Preliminary, subject to change.


GARVEE Bonds

1
Grant Anticipation Revenue Vehicles (“GARVEE”) Bonds
Purpose
Grant Anticipation Revenue Vehicles (“GARVEE”) Bonds are authorized by State statute
to leverage federal aid to finance the cost of transportation facilities. GARVEEs were used as a
part of the funding plan for the Intercounty Connector (“ICC”) project, in addition to various
other debt instruments and cash. The use of GARVEEs for the ICC allowed the project to be
constructed sooner than otherwise would have been possible and with less reliance on the State’s
available funds.
Security
GARVEE bonds are secured by a pledge of federal transportation funds received by the
State which approximate $465.8 million annually. In addition, there is a subordinate pledge of
certain State Transportation Trust Fund (“TTF”) tax sources. The GARVEEs were also
structured to include debt service reserve funds for additional security.
Limitations to Debt Issuance
Statute limits the total amount that can be issued for GARVEEs to an aggregate principal
amount of $750.0 million, with a maximum maturity of 12 years. Under State law, the proceeds
could only be used for the ICC. Legislation enacted by the 2005 General Assembly specified that
GARVEE bonds be considered tax-supported debt.
Current Status:
Debt Outstanding as of June 30, 2015: $349,440,000
Ratings
GARVEEs are currently rated AAA by Standard and Poor’s, Aa1 by Moody’s Investors
Service and AA by Fitch Ratings.
Use of Variable Rate Debt, Bond Insurance, Derivatives and Guaranteed Investment
Contracts
The GARVEE bonds are fixed rate bonds, and were issued without bond insurance due to
the subordinate pledge of the TTF and the availability of debt service reserve funds. The
Authority has not used derivatives or guaranteed investment contracts.
Trends in GARVEE Debt A total of $750.0 million in GARVEE bonds have been issued by the Maryland
Transportation Authority. The first issuance occurred in May 2007 and totaled $325.0 million
with a true interest cost of 3.99%. In December 2008, the Authority sold the remaining $425.0
million of GARVEE bonds with a true interest cost of 4.31%. GARVEE debt outstanding and
required debt service for the past five fiscal years and projections until the debt is repaid are
shown in Graph 4.1. The final GARVEE bond matures on March 1, 2020 and no further
issuances are projected, except in the event of a refunding opportunity.

2

CDAC 2015
MARYLAND TRANSPORATION AUTHORITY Refunding of the Parking Lease Revenue Bonds (Calvert Street
Parking Garage Project) Series 2005
Background The Maryland Transportation Authority (Authority) issued $23,760,000 of Parking Lease Revenue Bonds in July 2005 to finance the construction of the Calvert Street Parking Garage. The Department of General Services (DGS) operates and maintains the garage. In June 2015, Davenport & Company, the Authority’s financial advisory firm, issued a Request for Proposal to determine if a direct bank loan would be the most efficient way to refund the Series 2005 Bonds for debt service savings. A bid by TD Bank, N.A. was deemed to be very competitive and in the best interests of the State. The direct bank loan was done on an expedited basis with lower issuance costs and at a very attractive interest rate. The Refunding Bonds were sold on July 10, 2015, and the Series 2005 Bonds were redeemed on August 17, 2015.
Refunding Results
Refunding Bonds issued on August 5, 2015: $18,011,000 True Interest Cost (TIC): 2.62% Par Amount of Series 2005 Bonds redeemed: $17,845,000 Average Coupon of Series 2005 Bonds: 4.25% NPV Savings: $2.3 Million Percentage Savings: 13% of refunded bonds Final Maturity: July 1, 2032 Pledged Revenue: Rental payments are due from DGS for the use of the garage, which are subject to annual appropriation, and serve as a pass-through to the bond trustee to pay debt service to bondholders. Structure: The Refunding Bonds are fixed rate bonds with serial principal payments, and no credit enhancement or reserve funds due to the State’s excellent credit rating. Ratings: Unrated

Maryland Stadium Authority

Maryland Stadium Authority Briefing
Capital Debt Affordability Committee
September 2, 2015

Maryland Stadium Authority
Debt Issued over the past five years
Fiscal
Year
Amount Purpose
2011 $6,630,000 Refunding of the Ocean City Bonds
2012 $105,450,000 $11.1 million - Revenue Bond for Warehouse and Oriole
Park Improvements
$94.35 million - Series 2011 Refunding Bonds (Terminate
Swap with AIG for Series 1998A and 1999)
2013 $26,990,000 $14.1million – Series 2012 Hippodrome Performing Arts
Center Refunding Bonds
$12.9 million - Series 2012 Montgomery County
Conference Center Refunding Bonds
2014 $8,635,000 Refund the Series 2010 Revenue Bond for Oriole Park
Improvements
2015 $9,535,000 Refund the Series 2011 Revenue Bond for Oriole Park
Improvements, reduce the outstanding balance refunded
by $500,000 by negotiating a lower debt service reserve

Maryland Stadium Authority
Amount of Outstanding Debt and Revenues
Fis
cal
Yea
r
Amount
Outstanding
Tax
Supported
Bonds and
Equipment
Revenue
Bond
Energy
(not tax
supported
debt)
Debt Service
for Tax
Supported
and
Equipment
Revenues
(Lottery/
Camden Yards
Operating
Revenue and $2
ticket charge)
2013 $219,601,249 $193,005,129 $19,435,000 $7,161,120 $34,488,483 $24,602,696
2014 $185,442,082 $168,862,603 $10,010,000 $6,569,479 $32,760,702 $23,440,000
2015 $168,421,865 $145,021,979 $17,455,000 $5,944,886 $31,447,251 $21,851,391
2016 $146,291,738 $125,181,285 $15,825,000 $5,285,453 $26,394,035 $21,837,615
2017 $124,627,623 $105,883,444 $14,155,000 $4,589,179 $25,034,455 $21,893,973
2018 $102,100,220 $85,806,273 $12,440,000 $3,853,947 $24,956,432 $21,817,415
2019 $79,034,063 $65,281,548 $10,675,000 $3,077,515 $24,496,590 $21,359,802
2020 $55,027,509 $43,910,000 $8,860,000 $2,257,509 $24,396,585 $21,258,143
2021 $44,306,417 $35,920,000 $6,995,000 $1,391,417 $10,328,763 $7,193,770
2022 $33,076,576 $27,520,000 $5,080,000 $476,576 $10,342,102 $7,201,477
2023 $23,385,000 $20,275,000 $3,110,000 $0 $8,766,383 $7,211,633
2024 $13,700,000 $12,615,000 $1,085,000 $0 $8,775,074 $7,215,824
2025 $6,080,000 $6,080,000 $0 $0 $7,434,296 $7,434,296

Maryland Stadium Authority
Fixed Rate Debt Ratings
Series S&P Moody’s Fitch
2004 AA+ Aa2 AA
2011 AA+ Aa2 AA
2012 HPAC AA+ Aa2 AA
2012 MCCC AA+ Aa2 AA

Maryland Stadium Authority Maryland Stadium Authority
Summary of Swaps and Variable Rate Demand Bonds
as of June 30, 2015, 2015
Sports Facilities Lease Revenue Refudning Bonds
Football Stadium Issue
Series Name Series 2007
Tax Status Tax-Exempt
Dated Date 2/8/2007
Original Issue Par 73,500,000
Current Outstanding 51,385,000
Maturity 3/1/2008 – 2026
Remarketing Agent Goldman Sachs & Co.
Current Remarketing Rate 5 Basis Points
Liquidity/LOC Provider SBPA: Sumitumo
LOC Expiration 12/15/2019
Current LOC Fee 36 Basis Points
Current Reset Frequency 7-Day
Date of Last Reset 8/19/2014
Reset Rate 0.06%
Hedges Synthetic Fixed Rate (MSA paid Fixed Amounts = 5.69% - 5.8%,
receives SIFMA)
Counterparty Barclays
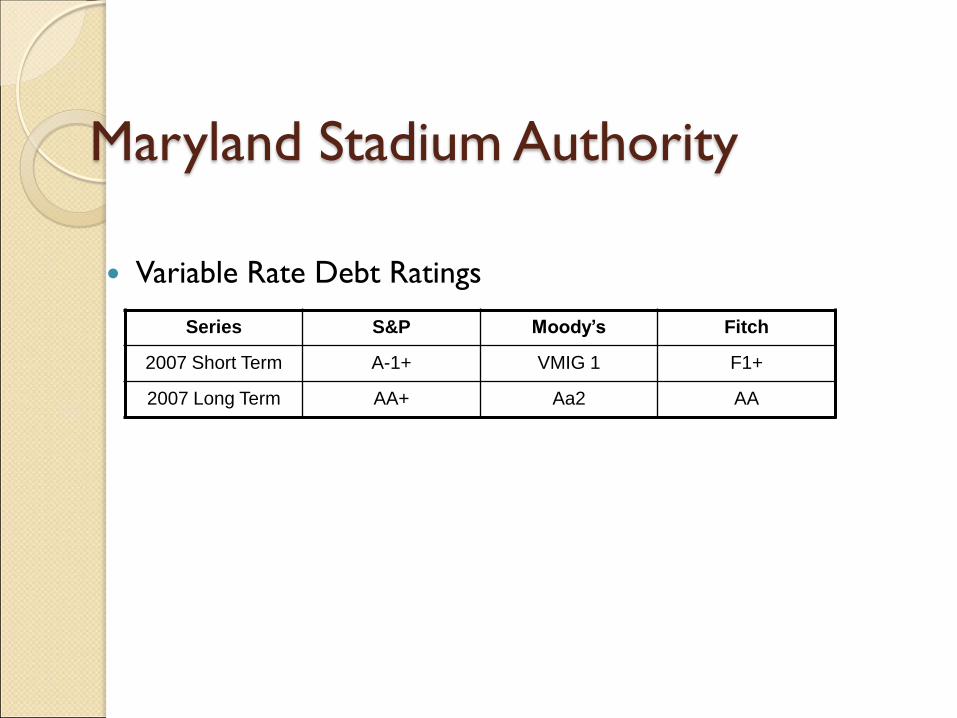
Maryland Stadium Authority
Variable Rate Debt Ratings
Series S&P Moody’s Fitch
2007 Short Term A-1+ VMIG 1 F1+
2007 Long Term AA+ Aa2 AA

Maryland Stadium Authority Current projections for new issuances
◦ FY 2016
Issue $320 million in Baltimore City Public School Revenue Bonds
Proceeds to be used for Year 1 projects
2-3 new schools
5-7 renovated schools
Revenue bond secured by the funds received from:
Lottery
Baltimore City Insurance Subsidy
Baltimore City Bottle Tax, Table Games and Facility Rental
Baltimore City Public Schools
◦ FY 2017
Issue $270 million in Baltimore City Public School Revenue Bonds
Proceeds to be used for the balance of the Year 1 projects ($70 million) and the Architect and Pre-construction of the Year 2 projects ($200 million)
Structured the same way as the first series, unless we don’t receive a AA blended credit

Maryland Stadium Authority
Baltimore City Public Schools Construction and Revitalization Program
Revenue Bond, Series 2015
◦ Financing Plan Approved by MSA board 9/1
◦ Submitted to budget committees for a 45 day review and comment period on or
about 9/2
◦ Presentation for an indicative rating with Moody’s in early September 2015
Seeking a AA credit rating on the blended security of all three (3) revenue
sources
◦ Full rating presentation late September or early October 2015
◦ Board of Public Works approval 10/21
◦ Negotiated sale on or about 11/15 Par Amount of $320 million
Project premium of between $40 million and $50 million
Tax-exempt and CRA
30 year debt
5% coupon
Average annual debt service is $21 million


Bay Restoration Bonds

Department of the Environment
Bay Restoration Fund (BRF) Capital Debt Affordability Committee Briefing
September 2, 2015
Jag Khuman, Director Maryland Water Quality Financing Administration
1800 Washington Boulevard Baltimore, MD 21230
410-537-3119
www.mde.maryland.gov/wqfa

FY Amount ($ Million) Primary Purpose 2008 50.00 Provide grants for the Enhanced 2009 - Nutrient Removal (ENR) 2010 - upgrades at the 67 major Waste 2011 - Water Treatment Plants (Estimated 2012 - Total ENR Capital Cost $1.25 billion) 2013 - 2014 100.00 2015 - Page 2
Bay Restoration Fund
Debt Issued in Prior Fiscal Years

Series 2008 Series 2014 Debt Issued: $50,000,000 $100,000,000 Issue Date: 4/29/2008 5/14/2014 Ratings: Aa2 (Moody’s) Aa2 (Moody’s) AA (S&P) True Interest Cost: 4.03% 2.55% Interest: Fixed Rate Fixed Rate Final Bond Maturity: 3/1/2023 3/1/2029 Security: BRF (WWTP) Fee BRF (WWTP) Fee Debt Service Reserve: None None Optional Redemption: After 3/1/2018 After 3/1/2024 Refunding Potential: Low Savings Low Savings Page 3
Bay Restoration Fund
Existing Bonds/Refunding Potential

BRF Current Outstanding Debt & Annual Debt Service
($ Million)
Page 4
Fiscal Year Ending Outstanding Debt Annual Debt Service
2008 50.000 0.000
2009 46.825 4.655
2010 44.185 4.710
2011 41.560 4.616
2012 38.820 4.614
2013 35.995 4.617
2014 133.055 4.614
2015 129.980 8.248
2016 121.615 14.330
2017 112.880 14.302
2018 103.750 14.261
2019 94.205 14.219
2020 84.110 14.328
2021 73.515 14.330
2022 62.395 14.327
2023 50.725 14.326
2024 43.100 9.717
2025 35.095 9.716
2026 26.770 9.635
2027 18.195 9.469
2028 9.275 9.557
2029 0.000 9.600
2030 0.000 0.000

Debt Authorized through FY 2015: $530,000,000 Debt Issued through FY 2015: $150,000,000 Future Authorized Debt Issuance: $380,000,000 Projected Future Debt Issuance: $280,000,000 Assumptions for future debt issuance
• Wt. Avg. Interest Rate of 4.50% per year • Annual Level Debt Service • Maximum 15-Year Bond Term • Final Debt Service Payment by FY 2030
Page 5
Bay Restoration Fund
Total Debt Authorized and Amount Unissued

Projected Debt Issuance, Debt Service Payments & Annual Revenue ($ Millions)
Page 6
* Actual revenue through FY 2014 BRF fee increase in FY 2013
Fiscal Year New Issues
Debt Outstanding
at 6/30
Debt Service
for FY
Revenue
(Cash) *
2008 50.000 50.000 0.000 55.068
2009 0.000 46.825 4.655 53.356
2010 0.000 44.185 4.710 54.818
2011 0.000 41.560 4.616 54.598
2012 0.000 38.820 4.614 54.552
2013 0.000 35.995 4.617 92.767
2014 100.000 133.055 4.614 108.466
2015 0.000 129.980 8.248 111.785
2016 180.000 ** 301.615 14.330 112.903
2017 100.000 392.880 22.402 114.032
2018 0.000 373.260 37.351 115.172
2019 0.000 346.286 43.776 116.324
2020 0.000 317.978 43.885 117.487
** Bond Sale November 2015

Projected Debt Issuance, Debt Service Payments & Annual Revenue ($ Million)
Fiscal Year New Issues
Debt Outstanding
at 6/30
Debt Service
for FY
Revenue
(Cash) *
2021 0.000 288.350 43.887 118.662
2022 0.000 257.340 43.884 119.849
2023 0.000 224.886 43.883 121.047
2024 0.000 195.541 39.274 122.257
2025 0.000 164.839 39.273 123.480
2026 0.000 132.795 39.192 124.715
2027 0.000 99.434 39.026 125.962
2028 0.000 64.612 39.114 127.222
2029 0.000 28.270 39.157 128.494
2030 0.000 0.000 29.557 129.779
Page 7
Continued….
* Actual revenue through FY 2014 BRF fee increase in FY 2013

Bay Restoration Fund
Page 8
0.000
50.000
100.000
150.000
200.000
250.000
300.000
350.000
400.000
450.000
2008
2009
2010
2011
2012
2013
2014
2015
2016
2017
2018
2019
2020
2021
2022
2023
2024
2025
2026
2027
2028
2029
2030
$ M
illi
on
FY
New Debt Issuance & Debt Outstanding
New Debt Issuance Debt Outstanding


Consolidated Transportation Bonds

Presented by
David Fleming
Chief Financial Officer
Office of Finance
September 2, 2015
Maryland Department of Transportation

Structure: Fixed rate
Interest only first 2 years
As required by statute Maximum maturity of 15 years
Level debt service payments
Additional Bonds Test: Pledged taxes at least 2.0x maximum annual debt service
Net revenue at least 2.0x maximum annual debt service
-1-

Management Practice: Pledged Taxes at least 2.5x maximum annual Debt Service
Net Revenue at least 2.5x maximum annual Debt Service
Fiscal Year 2014 Actual: Pledged taxes coverage 5.9x Net revenue coverage 3.2x
Fiscal Year 2015 Estimated : Pledged taxes coverage 5.9x Net revenue coverage 3.4x
-2-

Amount issued in prior 5 fiscal years: $1.007 billion new construction $421 million refunding
-3-
Series Sale Date ($ in millions) New Money Refunding
True Interest Cost (TIC)
Series 2015 Second Issue 6/3/2015 $136.00 2.75%
Series 2015 Refunding 6/3/2015 $259.72 1.85%
Series 2015 2/11/2015 $265.54 2.59%
Series 2014 6/11/2014 $100.00 2.66%
Series 2013 Second Issue 11/20/2013 $225.00 2.90%
Series 2013 2/13/2013 $165.00 2.45%
Series 2012 5/23/2012 $115.00 2.36%
Series 2011 Refunding 9/28/2011 $161.44 1.39%

Amount outstanding: FY15 - $2.02 billion Legislative debt ceiling increased to $4.5 billion effective June 1, 2013
Amount authorized but unissued: FY15 - $2.53 billion authorized FY15 - $510 million unissued
Maryland Department of Transportation
Consolidated Transportation Bonds
-4-

Status of refunding potential Refunding analysis is periodically completed by the
department’s financial advisor Benchmarks are 3% net present value savings and an
Opportunity Cost Index of at least 70% Refunded $301 million bonds in June 2015 for a net present
value savings of $21 million
Variable rate debt, swaps and bond insurance None
Bond Insurance Not needed because of MDOT’s stable credit profile
-5-

Preliminary projections for new issuances
Debt Debt
Outstanding Outstanding
at Beginning New at End
Fiscal Year of Year Issues Redeemed of Year
2016E $2,020 $655 $174 $2,501
2017E $2,501 $795 $207 $3,089
2018E $3,089 $675 $222 $3,542
2019E $3,542 $535 $195 $3,882
2020E $3,882 $420 $182 $4,120
2021E $4,120 $410 $235 $4,295
2022E $4,295 $480 $280 $4,495
2023E $4,495 $315 $316 $4,494
2024E $4,494 $300 $299 $4,495
2025E $4,495 $330 $333 $4,492
(E = based on July 2015 Estimate)
-6-

Debt service preliminary projections for the next 10 years
($ in millions)
-7-
2016 2017 2018 2019 2020 2021 2022 2023 2024 2025
DS Projected New Issues 6 33 74 114 151 207 268 319 371 421
DS Current Outstanding 258 288 292 243 204 212 206 199 133 119
Total Debt Service 264 321 366 357 355 419 474 518 504 540
0
100
200
300
400
500
600

Rating Agency Updates: As of June 2015
Standard & Poor’s – AAA
Moody’s – Aa1
Fitch – AA+
-8-

Status of Affordability Ratios

1
2015 Preliminary Affordability Analysis for the
Capital Debt Affordability Committee
September 2, 2015

2
Topics of Discussion
1. Authorization and Issuance Assumptions
2. Debt Outstanding Ratios
3. Assumptions
4. Debt Service Ratios

General Obligation Bonds Authorization History
• Last October, the Committee recommended $1,170 million as a prudent authorization amount for FY 2016.
• In December 2014, the Board of Revenue Estimates reduced estimated revenues for FY 2016.
• The Treasurer then sent a letter to the Governor and General Assembly, which was shared with CDAC members, because there wasn’t time for a CDAC meeting before the scheduled SAC meeting. The Treasurer noted that the original authorization would result in exceeding the debt affordability guidelines and that to remain within guidelines the FY 2016 authorization would have to be limited to $1,045 million.
• The Spending Affordability Committee recommended an authorization of $1,095 million.
• The Governor’s Proposed FY 2016 Capital Budget included an authorization of $995 million.
• At the conclusion of the 2015 Legislative Session an authorization of $1,045 million was approved.
3

General Obligation Bonds New Authorization Comparison
• The 2014 CDAC authorization column in the table on page 5 reflects the $75 million increased planning assumption for fiscal years 2017 through 2020 that the committee adopted for its report in October 2014.
• The second column in the table on page 5 represents the CDAC baseline authorizations of 3% annual growth without the $75 million increase in out-year planning.
• The Governor’s Proposed FY 2016 Capital Budget authorization assumptions are shown in the final column in the table on page 5.
4

General Obligation Bonds New Authorization Comparison
($ in millions)
Fiscal Year
CDAC Authorization
With $75 million
CDAC Baseline Authorization
(3% annual growth)
Governor’s Proposed Capital
Budget 2017 1,180 1,105 1,029
2018 1,275 1,200 1,059
2019 1,315 1,240 1,073
2020 1,355 1,280 1,025
2021 1,320 1,320 1,320
2022 1,360 1,360 1,360
2023 1,400 1,400 1,400
2024 1,440 1,440 1,440
2025 1,480 1,480 1,480
5

Tax-Supported Debt Issuance Assumption
6
2014 CDAC with $75 million increase
FY 2016 FY 2017 FY 2018 FY 2019 FY 2020
GO $1,018 $1,094 $1,168 $1,221 $1,274
MDOT $655 $795 $675 $535 $420
Bay Bonds $180 $100 $0 $0 $0
Capital Leases $20 $10 $38 $5 $5
Total $1,873 $1,999 $1,881 $1,761 $1,699
The table above reflects the assumed issuances based upon historical issuance patterns, the $1,045 million authorized by the General Assembly for FY 2016 and the additional $75 million authorization the CDAC approved through FY 2020 for planning purposes.

Tax-Supported Debt Issuance Assumption
7
CDAC Baseline (3% annual growth) without additional $75 million
FY 2016 FY 2017 FY 2018 FY 2019 FY 2020
GO $1,018 $1,071 $1,126 $1,164 $1,206
MDOT $655 $795 $675 $535 $420
Bay Bonds $180 $100 $0 $0 $0
Capital Leases $20 $10 $38 $5 $5
Total $1,873 $1,976 $1,839 $1,704 $1,631
The table above reflects the assumed issuances based upon historical issuance patterns, the $1,045 million authorized by the General Assembly for FY 2016 and the CDAC baseline of 3% annual growth in authorizations (without additional $75 million for out-year planning).

Tax-Supported Debt Issuance Assumption
8
Governor’s Proposed FY 2016 Capital Budget
FY 2016 FY 2017 FY 2018 FY 2019 FY 2020
GO $1,018 $1,047 $1,063 $1,061 $1,045
MDOT $655 $795 $675 $535 $420
Bay Bonds $180 $100 $0 $0 $0
Capital Leases $20 $10 $38 $5 $5
Total $1,873 $1,952 $1,776 $1,601 $1,470
The table above reflects the assumed issuances based upon historical issuance patterns, the $1,045 million authorized by the General Assembly for FY 2016 and the proposed authorizations for FY 2017 – FY 2020 in the Governor’s Proposed FY 2016 Capital Budget.

Preliminary Tax-Supported Debt Outstanding Ratio (2014 CDAC with $75 million)
($ in Millions)
Fiscal Year
Debt Outstanding
Personal Income Ratio (%)
2016 12,399 359,678 3.45% 2017 13,317 376,790 3.53% 2018 13,970 392,982 3.55% 2019 14,530 406,736 3.57% 2020 15,012 420,484 3.57% 2021 15,519 435,621 3.56% 2022 16,030 452,087 3.55% 2023 16,309 469,086 3.48% 2024 16,582 486,724 3.41% 2025 16,804 505,024 3.33% 9
The planning assumptions for authorizations and issuance result in the following projections of tax-supported debt outstanding:

Preliminary Tax-Supported Debt Outstanding Ratio (Baseline without $75 million additional increase)
($ in Millions)
Fiscal Year
Debt Outstanding
Personal Income Ratio (%)
2016 12,399 359,678 3.45% 2017 13,294 376,790 3.53% 2018 13,905 392,982 3.54% 2019 14,407 406,736 3.54% 2020 14,823 420,484 3.53% 2021 15,282 435,621 3.51% 2022 15,767 452,087 3.49% 2023 16,039 469,086 3.42% 2024 16,328 486,724 3.35% 2025 16,567 505,024 3.28% 10
The planning assumptions for authorizations and issuance result in the following projections of tax-supported debt outstanding:

Preliminary Tax-Supported Debt Outstanding Ratio (Gov. Proposed FY16 CIP)
($ in Millions)
Fiscal Year
Debt Outstanding
Personal Income Ratio (%)
2016 12,399 359,678 3.45% 2017 13,270 376,790 3.52% 2018 13,819 392,982 3.52% 2019 14,219 406,736 3.50% 2020 14,476 420,484 3.44% 2021 14,814 435,621 3.40% 2022 15,221 452,087 3.37% 2023 15,461 469,086 3.30% 2024 15,778 486,724 3.24% 2025 16,053 505,024 3.18% 11
The planning assumptions for authorizations and issuance result in the following projections of tax-supported debt outstanding:

12
Tax-Supported Debt Assumptions
General Obligation • Savings: No future refunding issues or use of premium. • Interest Rate: 5.0%
– This assumption is based upon standard municipal bond couponing and the Municipal Market Data (MMD) AAA curve and produces conservative and stable debt service estimates.
– Since FY 1999 the interest rates on State bonds has exceeded 5% only once.
• MDOT Interest Rate: 3.8% in fiscal year 2016; 4.3% in fiscal year 2017; 4.5% in fiscal year 2018 - 2021 and 5.3% in fiscal years 2022 – 2025.
• Bay Bonds Interest Rate: weighted average of 4.5%.
• Capital Lease Interest Rate: from 1.21% to 1.49% with different rates for each expected term.

Preliminary Tax-Supported Debt Service Ratio (2014 CDAC with $75 million)
($ in Millions)
Fiscal Year Debt Service Revenues Ratio (%) 2016 1,549 21,151 7.32% 2017 1,674 22,074 7.59% 2018 1,806 22,807 7.92% 2019 1,841 23,505 7.83% 2020 1,870 24,238 7.71% 2021 1,906 24,575 7.75% 2022 2,024 25,353 7.98% 2023 2,137 26,167 8.17% 2024 2,178 27,000 8.07% 2025 2,259 27,914 8.09%
13
The planning assumptions for authorizations and issuance result in the following projections of tax-supported debt outstanding:
These ratios are lower than the Treasurer’s December letter due to lower rates on the 2015 issues and refunding savings.

14
Preliminary Debt Service Ratio 2014 CDAC with $75 million
0
200
400
600
800
1,000
1,200
1,400
1,600
1,800
2,000
2,200
2,400
2011 2012 2013 2014 2015 2016 2017 2018 2019 2020 2021 2022 2023 2024 2025
$ in
mill
ions
General Obligation Bonds DOT Consolidated Bonds Capital Leases Stadium Authority Bay Restoration Bonds Garvee Bonds Total Tax Supported Debt Service 8.0% Benchmark

15
Preliminary Debt Service Capacity 2014 CDAC with $75 million
250 248 266
224 214
143 92
18 39 69 60 4
0
200
400
600
800
1,000
1,200
1,400
1,600
1,800
2,000
2,200
2,400
2011 2012 2013 2014 2015 2016 2017 2018 2019 2020 2021 2022 2023 2024 2025
$ in
mill
ions
Total Tax Supported Debt Service Remaining Debt Service Capacity 8.0% Benchmark

Preliminary Tax-Supported Debt Service Ratio (Baseline without increase)
($ in Millions)
Fiscal Year Debt Service Revenues Ratio (%) 2016 1,549 21,151 7.32% 2017 1,675 22,074 7.59% 2018 1,805 22,807 7.91% 2019 1,838 23,506 7.82% 2020 1,862 24,238 7.68% 2021 1,892 24,576 7.70% 2022 2,005 25,354 7.91% 2023 2,112 26,167 8.07% 2024 2,150 27,000 7.96% 2025 2,229 27,914 7.99%
16
The planning assumptions for authorizations and issuance result in the following projections of tax-supported debt outstanding:
These ratios are lower than the Treasurer’s December letter due to lower rates on the 2015 issues and refunding savings.

17
Preliminary Debt Service Ratio Baseline Without Increase
0
200
400
600
800
1,000
1,200
1,400
1,600
1,800
2,000
2,200
2,400
2011 2012 2013 2014 2015 2016 2017 2018 2019 2020 2021 2022 2023 2024 2025
$ in
mill
ions
General Obligation Bonds DOT Consolidated Bonds Capital Leases Stadium Authority Bay Restoration Bonds Garvee Bonds Total Tax Supported Debt Service 8.0% Benchmark

18
Preliminary Debt Service Capacity Baseline Without Increase
250 248 266
224 214
143 92
20 43 77 74 23
10 4
0
200
400
600
800
1,000
1,200
1,400
1,600
1,800
2,000
2,200
2,400
2011 2012 2013 2014 2015 2016 2017 2018 2019 2020 2021 2022 2023 2024 2025
$ in
mill
ions
Total Tax Supported Debt Service Remaining Debt Service Capacity 8.0% Benchmark

Preliminary Tax-Supported Debt Service Ratio (Governor’s FY16 CIP)
($ in Millions)
Fiscal Year
Debt Service Revenues Ratio (%)
2016 1,549 21,151 7.32% 2017 1,674 22,074 7.59% 2018 1,804 22,807 7.91% 2019 1,834 23,506 7.80% 2020 1,852 24,238 7.64% 2021 1,870 24,576 7.61% 2022 1,970 25,354 7.77% 2023 2,064 26,167 7.89% 2024 2,092 27,000 7.75% 2025 2,167 27,914 7.76% 19
The planning assumptions for authorizations and issuance result in the following projections of tax-supported debt outstanding:

20
Preliminary Debt Service Ratio Governor’s Proposed FY 2016 CIP
0
200
400
600
800
1,000
1,200
1,400
1,600
1,800
2,000
2,200
2,400
2011 2012 2013 2014 2015 2016 2017 2018 2019 2020 2021 2022 2023 2024 2025
$ in
mill
ions
General Obligation Bonds DOT Consolidated Bonds Capital Leases Stadium Authority Bay Restoration Bonds Garvee Bonds Total Tax Supported Debt Service 8.0% Benchmark

21
Preliminary Debt Service Capacity Governor’s Proposed FY 2016 CIP
250 248 266
224 214
143 92
21 47 87 96 58
29 68 66
0
200
400
600
800
1,000
1,200
1,400
1,600
1,800
2,000
2,200
2,400
2011 2012 2013 2014 2015 2016 2017 2018 2019 2020 2021 2022 2023 2024 2025
$ in
mill
ions
Total Tax Supported Debt Service Remaining Debt Service Capacity 8.0% Benchmark

CDAC 2015 Recommendation
• At its September 30 meeting, the Capital Debt Affordability Committee will need to vote on a recommended authorization level to support the fiscal year 2017 capital program.
• The committee will also need to adopt planning assumptions for future authorizations. The current CDAC baseline includes an annual 3% growth rate with an additional $75 million in FY 2017 through FY 2020.
22