capital adequacy risk management report - … … · csa credit support annex nsfr net stable...
TRANSCRIPT

2016
Capital Adequacy & Risk Management Report
GarantiBank International N.V.

GARANTIBANK INTERNATIONAL N.V. CAPITAL ADEQUACY AND RISK MANAGEMENT REPORT 2016 1
Contents LIST OF ABBREVIATIONS .. . . . . . . . . . . . . . . . . . . . . . . . . . . . . . . . . . . . . . . . . . . . . . . . . . . . . . . . . . . . . . . . . . . . . . . . . . . . . . . . . . 3
1. INTRODUCTION .. . . . . . . . . . . . . . . . . . . . . . . . . . . . . . . . . . . . . . . . . . . . . . . . . . . . . . . . . . . . . . . . . . . . . . . . . . . . . . . . . . . . . . . . 4
2. SCOPE OF APPLICATION .. . . . . . . . . . . . . . . . . . . . . . . . . . . . . . . . . . . . . . . . . . . . . . . . . . . . . . . . . . . . . . . . . . . . . . . . . 5
3. RISK GOVERNANCE AT GBI . . . . . . . . . . . . . . . . . . . . . . . . . . . . . . . . . . . . . . . . . . . . . . . . . . . . . . . . . . . . . . . . . . . . . . 5
4. RISK APPETITE FRAMEWORK .. . . . . . . . . . . . . . . . . . . . . . . . . . . . . . . . . . . . . . . . . . . . . . . . . . . . . . . . . . . . . . . . . . 6
5. OWN FUNDS .. . . . . . . . . . . . . . . . . . . . . . . . . . . . . . . . . . . . . . . . . . . . . . . . . . . . . . . . . . . . . . . . . . . . . . . . . . . . . . . . . . . . . . . . . . . . . 7
6. REGULATORY CAPITAL REQUIREMENTS .. . . . . . . . . . . . . . . . . . . . . . . . . . . . . . . . . . . . . . . . . . . . . . . . . . 9
6.1 Credit Risk . . . . . . . . . . . . . . . . . . . . . . . . . . . . . . . . . . . . . . . . . . . . . . . . . . . . . . . . . . . . . . . . . . . . . . . . . . . . . . . . . . . . . . . . 11
6.1.1 Exposure amounts Before Credi t Risk Mi t igat ion . . . . . . . . . . . . . . . . . . . . . . . . . . . . . . . . . . 12
6.1.2 Of f -Balance Sheet Exposure Amounts . . . . . . . . . . . . . . . . . . . . . . . . . . . . . . . . . . . . . . . . . . . . . . . . . 13
6.1.3 Geographical Breakdown of the Exposures . . . . . . . . . . . . . . . . . . . . . . . . . . . . . . . . . . . . . . . . . . 13
6.1.4 Ef fect ive Matur i ty Breakdown . . . . . . . . . . . . . . . . . . . . . . . . . . . . . . . . . . . . . . . . . . . . . . . . . . . . . . . . . . . . . 14
6.1.5 Breakdown of the Exposures by Sector . . . . . . . . . . . . . . . . . . . . . . . . . . . . . . . . . . . . . . . . . . . . . . . 15
6.1.6 Past Due and Impaired Exposures, Provis ions and Value Adjustments . . 15
6.1.7 Counterparty Credi t Risk . . . . . . . . . . . . . . . . . . . . . . . . . . . . . . . . . . . . . . . . . . . . . . . . . . . . . . . . . . . . . . . . . . . 17
6 .1.8 Credi t Risk Mit igat ion . . . . . . . . . . . . . . . . . . . . . . . . . . . . . . . . . . . . . . . . . . . . . . . . . . . . . . . . . . . . . . . . . . . 18
6.2 Scope of Acceptance for F - IRB Approach . . . . . . . . . . . . . . . . . . . . . . . . . . . . . . . . . . . . . . . . . . . . . . 20
6.2.1 General Descript ion of the Models . . . . . . . . . . . . . . . . . . . . . . . . . . . . . . . . . . . . . . . . . . . . . . . . . . . . . . 20
6.2.2 Governance Framework Around F - IRB Models and Processes . . . . . . . . . . . . . . . 20
6.2.3 Calcula t ion of r isk W eighted Assets for F- IRB Exposure Classes . . . . . . . . . . . 21
6.2.4 Special i zed Lending . . . . . . . . . . . . . . . . . . . . . . . . . . . . . . . . . . . . . . . . . . . . . . . . . . . . . . . . . . . . . . . . . . . . . . . . . . 22
6.3 Market Risk . . . . . . . . . . . . . . . . . . . . . . . . . . . . . . . . . . . . . . . . . . . . . . . . . . . . . . . . . . . . . . . . . . . . . . . . . . . . . . . . . . . . . . . 23
6.4 Operational Risk .. . . . . . . . . . . . . . . . . . . . . . . . . . . . . . . . . . . . . . . . . . . . . . . . . . . . . . . . . . . . . . . . . . . . . . . . . . . . . . . 23
7. ICAAP FRAMEWORK .. . . . . . . . . . . . . . . . . . . . . . . . . . . . . . . . . . . . . . . . . . . . . . . . . . . . . . . . . . . . . . . . . . . . . . . . . . . . . . 24
7.1 Credi t Risk . . . . . . . . . . . . . . . . . . . . . . . . . . . . . . . . . . . . . . . . . . . . . . . . . . . . . . . . . . . . . . . . . . . . . . . . . . . . . . . . . . . . . . . . . 25
7.2 Concentrat ion Risk . . . . . . . . . . . . . . . . . . . . . . . . . . . . . . . . . . . . . . . . . . . . . . . . . . . . . . . . . . . . . . . . . . . . . . . . . . . . . . 25
7.3 Market Risk . . . . . . . . . . . . . . . . . . . . . . . . . . . . . . . . . . . . . . . . . . . . . . . . . . . . . . . . . . . . . . . . . . . . . . . . . . . . . . . . . . . . . . . . 25
7.4 Interest Rate Risk on the Bank ing Book ( IRRBB) . . . . . . . . . . . . . . . . . . . . . . . . . . . . . . . . . . . 26
7.5 Operat ional Risk . . . . . . . . . . . . . . . . . . . . . . . . . . . . . . . . . . . . . . . . . . . . . . . . . . . . . . . . . . . . . . . . . . . . . . . . . . . . . . . . . 27
7.6 Reputat ional and Strategic Risks . . . . . . . . . . . . . . . . . . . . . . . . . . . . . . . . . . . . . . . . . . . . . . . . . . . . . . . . . . 29
7.7 Other Risks . . . . . . . . . . . . . . . . . . . . . . . . . . . . . . . . . . . . . . . . . . . . . . . . . . . . . . . . . . . . . . . . . . . . . . . . . . . . . . . . . . . . . . . . 29
7.8 Capi ta l Plan . . . . . . . . . . . . . . . . . . . . . . . . . . . . . . . . . . . . . . . . . . . . . . . . . . . . . . . . . . . . . . . . . . . . . . . . . . . . . . . . . . . . . . . 29
8. ILAAP FRAMEWORK .. . . . . . . . . . . . . . . . . . . . . . . . . . . . . . . . . . . . . . . . . . . . . . . . . . . . . . . . . . . . . . . . . . . . . . . . . . . . . . . 30
8.1 L iquid ity Risk Governance . . . . . . . . . . . . . . . . . . . . . . . . . . . . . . . . . . . . . . . . . . . . . . . . . . . . . . . . . . . . . . . . . . . 30
8.2 L iquid ity Risk Monitor ing . . . . . . . . . . . . . . . . . . . . . . . . . . . . . . . . . . . . . . . . . . . . . . . . . . . . . . . . . . . . . . . . . . . . . 30
8.3 Funding Strategy . . . . . . . . . . . . . . . . . . . . . . . . . . . . . . . . . . . . . . . . . . . . . . . . . . . . . . . . . . . . . . . . . . . . . . . . . . . . . . . . 31
8.4 L iquid ity Risk Prof i le . . . . . . . . . . . . . . . . . . . . . . . . . . . . . . . . . . . . . . . . . . . . . . . . . . . . . . . . . . . . . . . . . . . . . . . . . . . 32
9. REGULATORY METRICS .. . . . . . . . . . . . . . . . . . . . . . . . . . . . . . . . . . . . . . . . . . . . . . . . . . . . . . . . . . . . . . . . . . . . . . . . . 33
10. REMUNERATION .. . . . . . . . . . . . . . . . . . . . . . . . . . . . . . . . . . . . . . . . . . . . . . . . . . . . . . . . . . . . . . . . . . . . . . . . . . . . . . . . . . . . 34
10.1 Governance . . . . . . . . . . . . . . . . . . . . . . . . . . . . . . . . . . . . . . . . . . . . . . . . . . . . . . . . . . . . . . . . . . . . . . . . . . . . . . . . . . . . . . 34
10.2 Remunerat ion Committee . . . . . . . . . . . . . . . . . . . . . . . . . . . . . . . . . . . . . . . . . . . . . . . . . . . . . . . . . . . . . . . . . . . 34
10.3 Informat ion on l ink between Pay and Performance . . . . . . . . . . . . . . . . . . . . . . . . . . . . . . . 35
10.4 Quant i tat ive Information on Remunerat ion . . . . . . . . . . . . . . . . . . . . . . . . . . . . . . . . . . . . . . . . . . . 35

GARANTIBANK INTERNATIONAL N.V. CAPITAL ADEQUACY AND RISK MANAGEMENT REPORT 2016 2
Annex
Annex 1 - T ier 2 Instrument Main Features . . . . . . . . . . . . . . . . . . . . . . . . . . . . . . . . . . . . . . . . . . . . . . . . . . . . . . . 37
Annex 2- Own Funds Disc losure . . . . . . . . . . . . . . . . . . . . . . . . . . . . . . . . . . . . . . . . . . . . . . . . . . . . . . . . . . . . . . . . . . . . . . 39
Annex 3 - Asset Encumbrance . . . . . . . . . . . . . . . . . . . . . . . . . . . . . . . . . . . . . . . . . . . . . . . . . . . . . . . . . . . . . . . . . . . . . . . . . 45

GARANTIBANK INTERNATIONAL N.V. CAPITAL ADEQUACY AND RISK MANAGEMENT REPORT 2016 3
LIST OF ABBREVIATIONS
A&CCSB Audit & Compliance Committee of the Supervisory Board
ICAAP Internal Capital Adequacy Assessment Process
ALCO Asset & Liability Committee ICU Internal Control Unit
AVA Additional Valuation Adjustment ILAAP Internal Liquidity Adequacy Assessment Process
BIA Basic Indicator Approach IRB Internal Ratings Based
CCF Credit Conversion Factor IRRBB Interest Rate Risk on the Banking Book
CCR Counterparty Credit Risk IRS Interest Rate Swap
CC Credit Committee ISD Information Security Department
CD Credits Division ISDA International Swaps and Derivatives Association
CDS Credit Default Swap ITP Internal Transfer Pricing
CET1 Common Equity Tier 1 LCD Legal & Compliance Department
CIS Commonwealth of Independent States LCR Liquidity Coverage Ratio
COBIT Control Objectives for Information and Related Technology
LGD Loss Given Default
CRD Capital Requirements Directive MB Managing Board
CRR Capital Requirements Regulation MO Middle Office
CSA Credit Support Annex NSFR Net Stable Funding Ratio
DNB De Nederlandsche Bank PD Probability of Default
EAD Exposure at Default RCAP Regulatory Capital
EaR Earnings at Risk RCSB Risk Committee of the Supervisory Board
EBA European Banking Authority RMD Risk Management Department
ECAP Economic Capital ROE Return on Equity
EDTF Enhanced Disclosure Task Force RWA Risk Weighted Assets
EVE Economic Value of Equity SA Standardised Approach
F-IRB Foundation Internal Ratings Based SB Supervisory Board
FIRM Financial Institutions Risk Analysis Method
SFT Securities lending or borrowing transactions
FRA Forward Rate Agreement SMA Standardised Measurement Approach
FSA Financial Supervision Act SSC Supervisory Slotting Criteria
GMRA Global Master Repurchase Agreement VaR Value at Risk
IAD Internal Audit Department IAC Identity Access Control
GARANTIBANK INTERNATIONAL N.V. CAPITAL ADEQUACY AND RISK MANAGEMENT REPORT 2016 4
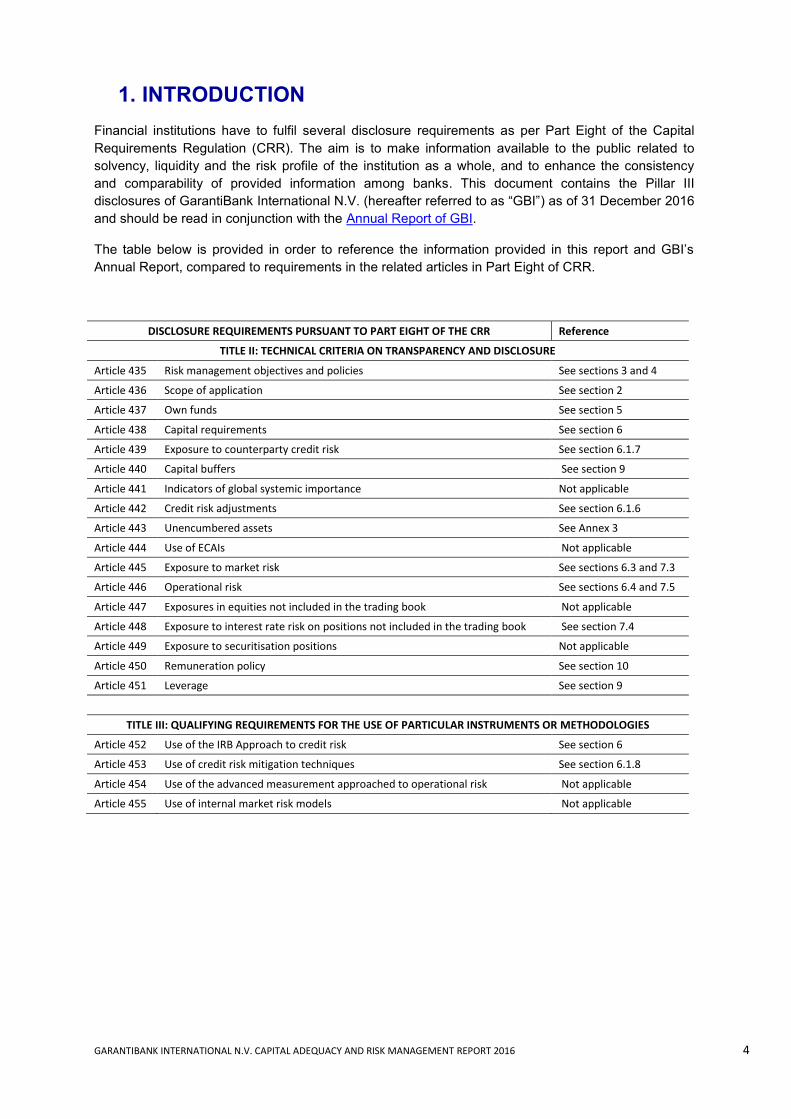
1. INTRODUCTION
Financial institutions have to fulfil several disclosure requirements as per Part Eight of the Capital
Requirements Regulation (CRR). The aim is to make information available to the public related to
solvency, liquidity and the risk profile of the institution as a whole, and to enhance the consistency
and comparability of provided information among banks. This document contains the Pillar III
disclosures of GarantiBank International N.V. (hereafter referred to as “GBI”) as of 31 December 2016
and should be read in conjunction with the Annual Report of GBI.
The table below is provided in order to reference the information provided in this report and GBI’s
Annual Report, compared to requirements in the related articles in Part Eight of CRR.
DISCLOSURE REQUIREMENTS PURSUANT TO PART EIGHT OF THE CRR Reference
TITLE II: TECHNICAL CRITERIA ON TRANSPARENCY AND DISCLOSURE
Article 435 Risk management objectives and policies See sections 3 and 4
Article 436 Scope of application See section 2
Article 437 Own funds See section 5
Article 438 Capital requirements See section 6
Article 439 Exposure to counterparty credit risk See section 6.1.7
Article 440 Capital buffers See section 9
Article 441 Indicators of global systemic importance Not applicable
Article 442 Credit risk adjustments See section 6.1.6
Article 443 Unencumbered assets See Annex 3
Article 444 Use of ECAIs Not applicable
Article 445 Exposure to market risk See sections 6.3 and 7.3
Article 446 Operational risk See sections 6.4 and 7.5
Article 447 Exposures in equities not included in the trading book Not applicable
Article 448 Exposure to interest rate risk on positions not included in the trading book See section 7.4
Article 449 Exposure to securitisation positions Not applicable
Article 450 Remuneration policy See section 10
Article 451 Leverage See section 9
TITLE III: QUALIFYING REQUIREMENTS FOR THE USE OF PARTICULAR INSTRUMENTS OR METHODOLOGIES
Article 452 Use of the IRB Approach to credit risk See section 6
Article 453 Use of credit risk mitigation techniques See section 6.1.8
Article 454 Use of the advanced measurement approached to operational risk Not applicable
Article 455 Use of internal market risk models Not applicable
GARANTIBANK INTERNATIONAL N.V. CAPITAL ADEQUACY AND RISK MANAGEMENT REPORT 2016 5
2. SCOPE OF APPLICATION
The scope of application of the Pillar III requirements is confined to GBI and its branch. The
information disclosed in this document is not subject to an external audit, but is verified and approved
independently within GBI. Differences can be found between the figures presented in this report and
the figures in the Annual Report of GBI. This is mainly due to application of F-IRB approach and the
figures in this report, unless otherwise stated, refer to Exposure at Default (EAD) whereas the figures
presented in annual report are in line with GBI’s accounting framework.
3. RISK GOVERNANCE AT GBI
The risk management culture at GBI has been established as a key element of the Bank’s strategy,
with an emphasis on risk awareness at all levels of the organization. GBI has established an
adequate segregation of duties and responsibilities enabling overall control of business operations.
Risk management is structured under various levels within the organization. These levels are
composed of committees at the Supervisory Board Level, committees at the Bank level and in the
form of separate risk and control division and departments. The committees which form the backbone
of risk governance at GBI are established as per the segregation of duties principle, and supported by
the related divisions and departments that have explicit risk management responsibilities as specified
below.
The Supervisory Board bears the overall responsibility for approving the risk appetite of GBI. The Risk
Committee of the Supervisory Board (RCSB) advises the Supervisory Board on the Bank’s risk
appetite and ensures that effective risk management is conducted accordingly. The Audit and
Compliance Committee of the Supervisory Board (ACSB) is the ultimate authority in independent
audit functions, compliance-related risks, and the statutory financial reporting process.
The Managing Board (MB) of GBI functions as a collegial body, as referred to in Section 2:129 of the
Dutch Civil Code. The MB is responsible for the management, general affairs, and business
connected with GBI. The MB develops strategies, policies, and procedures to establish effective risk
management and ensure that the Bank is in line with the approved risk appetite.
The Risk Management Committee (RMC) is responsible at the Bank level for coordinating and
monitoring risk management activities, reporting directly to the RCSB. Other committees at the Bank
level manage specific key banking risks: the Credit Committee (s) for credit risk; the Asset and
Liability Committee (ALCO) for market, interest rate, and liquidity risks; and the Compliance
Committee for compliance risks. The New Product Development Committee is responsible for the
assessment and introduction of new products and services.
The Credit Division has a separate risk control function, independent of commercial activities, making
certain the proper functioning of the Bank’s credit processes and ensuring that the composition and
the diversification of the loan portfolio are in line with the lending strategy of the Bank.
The Risk Management Department (RMD) of GBI has an independent risk monitoring function, also
independent of commercial activities.
RMD is responsible for the quantification and monitoring of the material risks in terms of economic
capital, regulatory capital and liquidity in order to limit the impact of potential events on the financial
performance of the Bank. RMD develops and implements risk policies, procedures, methodologies
and infrastructures that are consistent with the regulatory requirements and best market practices.
Risks in relation to the limits established by the Bank are continuously measured and
comprehensively reported to the appropriate committees. RMD also coordinates all efforts for

GARANTIBANK INTERNATIONAL N.V. CAPITAL ADEQUACY AND RISK MANAGEMENT REPORT 2016 6
compliance of the Bank’s risk management policies and practices with CRD, CRR, Basel principles
and the Financial Supervision Act (FSA, Wet op het financieel toezicht / Wft).
The Internal Control Unit (ICU), under RMD, is involved in the monitoring and reporting of operational
risks and establishing preventive control processes.
The Legal and Compliance Department (LCD) is also an independent body, reporting directly to the
ACSB as well as to the Managing Board and Compliance Committee. The Legal function advises on
relevant legal issues while the Compliance function translates compliance-related rules, laws and
regulations into internal compliance obligations and policies.
Information Security Department (ISD) is responsible for identifying risks in the information technology
systems and processes at GBI, as well as for ensuring that technology-related threats to the business
continuity are identified and mitigated. Identity Access Control (IAC) department manages access to
information and applications scattered across internal and external application systems.
The Internal Audit Department (IAD) monitors the governance frameworks around all risks through
regular audits, and provides reports to the Managing Board and the ACSB.
4. RISK APPETITE FRAMEWORK
GBI’s Risk Appetite Framework (RAF) consists of three layers. The first layer is the Principles of Risk
Appetite, which identifies relevant governance bodies and defines risk metrics around the Bank’s risk
appetite. The second layer is the Risk Appetite Statement (RAS), which determines the risks (and
their level) that the Bank is prepared to assume in order to achieve its business objectives. The final
layer is the Limit Framework, which supports the risk appetite and ensures that core metrics defined
under risk appetite, are met at all times according to risk type. GBI’s core metrics consist of several
risk indicators for solvency, liquidity and recurrent income.
In determining risk appetite, the Supervisory Board seeks a balanced combination of risk and return
while paying close attention to the interests of all stakeholders. As such, it reviews it on an annual
basis at minimum.
GBI’s solvency has always remained at an above-adequate level owing to its committed
shareholders and risk-averse strategies. The Bank aims to hold a strong capital base with a
high Tier 1 component.
The Bank pays specific attention to ensure sufficient liquidity and thus safe banking
operations and sound financial conditions in both normal and stressed financial environments,
while retaining a stable and diversified liquidity profile.
In terms of financial performance, the Bank targets a return on equity level that is stable in the
long-term and satisfies the stakeholders, including the shareholders, while maintaining core
competencies and a strategic position in key markets.
GBI is strongly committed to act with integrity and adhere to the highest ethical principles in
its business conduct. The Bank avoids all sorts of transactions and activities, which might
lead to an insufficient compliance with internal policies or external regulations and, which may
generate reputational risk in the eyes of all stakeholders, including regulators, shareholders,
clients and society.

GARANTIBANK INTERNATIONAL N.V. CAPITAL ADEQUACY AND RISK MANAGEMENT REPORT 2016 7
The core metrics are supported by additional metrics under the Limit Framework, which sets limits on
specific risk types by means of introducing credit, market, structural interest rate, structural FX,
liquidity, operational and reputational risk indicators.
The RAF was created to support the Bank’s core values and strategic objectives. Accordingly, GBI
dedicates sufficient resources to ensure full compliance with all requirements as well as to establish
and maintain a strong risk culture throughout the organization. Evaluation, monitoring and reporting is
an important element of GBI’s RAF, which allows the Bank to ensure the compliance with the Risk
Appetite set by the Supervisory Board. The Bank’s risk limits are continuously monitored through
control functions, while the core metrics are monitored by the Supervisory Board at each meeting.
5. OWN FUNDS
GBI’s capital base consists of two parts: Tier 1 and Tier 2 capital. Tier 1 capital is made up of
Common Equity Tier 1 (CET1) and additional Tier 1. The CET1 capital of GBI consists of fully paid-in
capital, other reserves and retained earnings including current year profit1. GBI’s Tier 1 is equal to its
CET1 as there are no other hybrid capital products which could qualify as additional Tier 1 capital.
There are various deductions from CET1 capital, based on the CRR. Intangible assets net of tax
liabilities are deducted in full from CET1 capital (Article 36 of CRR). An additional valuation
adjustment (AVA) is made on fair valued assets and liabilities, affecting CET1 capital (Article 34 of
CRR). Lastly, if expected loss of performing exposures exceeds general provisions, 80%2 of the
shortfall is deducted from CET1 capital. In GBI’s case, there is a shortfall of general provisions
compared to performing exposures, resulting in a proportional deduction from CET1 capital.
Tier 2 capital of GBI consists of subordinated loan. Tier 2 capital instruments are subject to gradual
amortization in case the remaining maturity of the debt falls below five years. No amortization is
applied on the Tier 2 capital of GBI as the remaining maturity of the instrument is higher than five
years. The main features of the Tier 2 instruments are provided in Annex 1.
There are also further deductions from Tier 2 capital. The remaining 20% of the shortfall of general
provisions, is deducted from Tier 2 capital. On the other hand, the excess of specific provisions over
impaired exposures is added back to Tier 23. Additionally, any excess holdings of own funds
instruments of other financial institutions above 10% of the Bank’s own CET1 capital is deducted from
the respective level of own funds. In GBI’s case, holdings of Tier 2 instruments are below the
threshold, thus no deduction from Tier 2 is necessary.
1 Pursuant to Article 26(2) of Regulation 575/2013 of the European Parliament and of the Council and, to
Decision 2015/656 of the European Central Bank (ECB/2015/4), interim or year-end profits may only be added to CET1 after receiving the approval of competent authority, ECB.. 2 CRR changed the treatment of the ‘expected loss shortfall’; previously, this difference, if negative, was
deducted 50%-50% from Tier 1 and Tier 2 capital. As per the CRR (Article 36.1.d), the difference must be fully deducted from Common Equity Tier 1. However, this change is phased in until 2018 (Article 469.1.a of CRR, and Article 5.5.1 of DNB CRD IV and CRR Specific Provisions Regulation), with a 80%-20% deduction in 2016. 3 Excess of specific provisions is added to Tier 2, as per Article 62 of the CRR

GARANTIBANK INTERNATIONAL N.V. CAPITAL ADEQUACY AND RISK MANAGEMENT REPORT 2016 8
Please find below an overview of GBI’s own funds composition as of 31.12.2016.
Table 5-1
(EUR 1,000) 31/12/2016 31.12.2015 Change
CET1
Paid-in and called-up capital 136,836 136,836 0
Retained earnings 9,796 9,413 383
Other reserves 409,191 397,850 11,341
IRB provision shortfall -12,524 -10,931 -1,593
Deduction of intangible fixed assets -3,373 -3,631 258
AVA -57 -65 8
TOTAL CET1 539,869 529,472 10,397
TOTAL Tier 1 539,869 529,472 10,397
(EUR 1,000) 31.12.2016 31.12.2015 Change
Tier 2
Subordinated debt 50,000 80,000 -30,000
IRB provision excess 10,390 15,949 -5,559
IRB provision shortfall -3,131 -4,685 1,554
Other deductions4 0 -556 556
TOTAL Tier 2 57,259 90,708 -33,449
TOTAL Own Funds 597,128 620,180 -23,051
Total own funds of GBI decreased by 4% in 2016 mainly due to the decrease in Tier 2. GBI recorded
a net profit of EUR 16.4million in 2016, EUR 9.8 million is included in own funds taking into account
the latest audited net profit until and including 30 June 2016, in line with the reports submitted to De
Nederlandsche Bank (DNB).The relationship between GBI’s Own Funds and accounting capital is
shown in the table below.
Table 5-2
(EUR 1,000) 31.12.2016 of which is eligible as CET1
Paid-in and called-up capital 136,836 136,836
Revaluation reserves 1,958 0
Other reserves 409,191 409,191
Profit current year 16,412 9,796
Shareholders' equity (Accounting Capital) 564,397 555,823
IRB provision shortfall - 80% -12,524
Deduction of intangible fixed assets -3,373
AVA -57
Total CET1 capital 539,869
Total Tier 1 capital 539,869
Total Tier 2 capital 57,259
Total Own Funds 597,128
4 Includes holdings of T2 instruments of other credit and financial institutions over the threshold of 10% of the
Bank’s own CET1 capital
GARANTIBANK INTERNATIONAL N.V. CAPITAL ADEQUACY AND RISK MANAGEMENT REPORT 2016 9
6. REGULATORY CAPITAL REQUIREMENTS
Total of Tier 1 and Tier 2 capital should correspond to at least 8% of the Banks’ risk weighted assets,
of which Tier 1 capital must constitute at least 6%.
GBI applies the Foundation Internal Ratings Based (F-IRB) Approach for credit risk of Corporate,
Institution and Sovereign portfolios since 1 January 2008 based on the permission obtained from
DNB. Exposures related with Retail and Private Banking, as well as counterparties in other asset
classes which cannot be rated by any of the internal rating models, are subject to permanent
exemption from F-IRB and are treated under the Standardised Approach (SA). GBI uses the
Standardised Measurement Approach (SMA) for market risk and the Basic Indicator Approach (BIA)
for operational risk in the calculation of the minimum level of required capital. In the table below, an
overview of the capital requirement and gross credit risk exposure on 31.12.2016 is presented.

GARANTIBANK INTERNATIONAL N.V. CAPITAL ADEQUACY AND RISK MANAGEMENT REPORT 2016 10
Table 6-1
5 As per Article 150 of the CRR, sovereign exposures of EUR 550 mio (2015: EUR 716 mio) are treated under SA
and being exposures to EU member states, receive a 0% risk weight. However, these are classified under IRB in this table with the rest of the sovereign asset class. 6 Throughout this document, “Institutions” consist of credit institutions as defined under Article 4(1) of the CRR,
and includes both institutions established in the EU, and in third countries. 7 As per DNB’s national discretion sovereign exposures of EUR 93 mio (2015: EUR 190 mio) which satisfy the
0% risk weight condition are classified under IRB in this table
(EUR 1,000) 31.12.2016 31.12.2015 Change
Gross Exposure
Capital Req.
Gross Exposure
Capital Req.
Gross Exposure
Capital Req.
Credit Risk 5,162,438 241,346 5,267,192 242,501 -104,754 -1,155
F-IRB approach:
Central Gov. & Central Banks5 651,380 7,667 814,330 7,499 -162,950 168
Institutions6 956,404 58,984 1,236,846 83,600 -280,442 -24,616
Corporates 3,028,511 152,625 2,636,919 132,406 396,069 21,544
Corporates (Specialised Lending) 358,079 14,037 370,920 14,820 -12,841 -783
Equity 4,621 1,368 4,477 1,325 144 43
Total F-IRB approach 4,998,995 234,681 5,059,015 238,325 -60,020 -3,644
Standardised approach:
Institutions 12,934 495 18,066 698 -5,132 -203
Corporates 115,105 3,993 157,238 1,257 -42,133 2,736
Retail 12,447 341 12,219 569 228 -228
Equity - - - - - -
Other non-credit-obligation assets 22,957 1,836 20,654 1,652 2,303 184
Total Standardised approach 163,443 6,665 208,177 4,176 -44,734 2,489
Counterparty Credit Risk (CCR) 272,283 3,179 452,384 3,947 -180,101 -768
F-IRB approach:
Central Gov. & Central Banks7 92,683 - 189,631 - -96,948 -
Institutions 127,561 858 191,392 1,230 -63,831 -372
Corporates 28,616 1,684 15,848 884 12,768 800
Corporates (Specialised Lending) 154 11 168 15 -14 -4
Total F-IRB approach 249,014 2,553 397,039 2,129 -148,025 424
Standardised approach:
Institutions 15,560 334 7,019 232 8,541 102
Corporates 4,156 26 45,451 1,553 -41,295 -1,527
Retail 3,553 266 2,875 33 678 233
Total Standardised approach 23,269 626 55,345 1,818 -32,076 -1,192
Total Credit Risk & CCR 5,434,721 244,525 5,719,576 246,448 -284,855 -1,923
Credit Valuation Adjustment (CVA)
527 572 -45
Total Market Risk (SMA)
360
48 313
Total Operational Risk (BIA)
13,253
13,503 -250
Total Capital Requirement
258,666
260,571 -1,905
Total RWA
3,233,326
3,257,140
-23,814
CET1 Ratio
16.70%
16.26%
0.44%
Total Capital Ratio
18.47%
19.04%
-0.57%

GARANTIBANK INTERNATIONAL N.V. CAPITAL ADEQUACY AND RISK MANAGEMENT REPORT 2016 11
The capital requirement under Pillar 1 is EUR 258.7 million. The largest part (95%) of the capital requirement relates to credit risk8. 97% of the credit risk weighted assets are treated under F-IRB approach.
Common Equity Tier 1 (CET1) has increased to 16.70% from 16.26% in 2016, due to the decrease in
the loan book. The total capital ratio has decreased to 18.47% from 19.04% because of the early
repayment of Tier 2 capital.
6.1. Credit Risk
Credit risk is the current or prospective risk to earnings and capital arising from an obligor’s failure to
meet the terms of any contract with the institution or otherwise fail to perform as agreed. At GBI, credit
risk arises mainly from trade and commodity finance, structured finance and treasury activities. GBI is
mainly involved in low default portfolios such as sovereigns, banks, large corporate companies and
trade finance activities. Within the credit risk framework of GBI, the counterparties are classified as
per their characteristics and subsequently specific processes are applied to effectively cope with
credit risks. All business flows implying credit risk pass through the CD from where they are
subdivided into separate teams responsible for assessing and managing credit risks pertinent to
corporate counterparties, financial institutions and sovereigns. The aggregation of business flows in
the CD allows adequate evaluation of the global balance of risks and exposures.
The risk assessment approaches for different types of counterparties within the above mentioned
subdivisions are different and adjusted to the specific properties of each subdivision type (e.g.
financial institutions, non-bank financial institutions, commodity trading companies, corporates etc.)
and to the variety of transactions typically handled (e.g. trade finance, shipping finance, treasury,
private banking etc.).
Being an F-IRB Bank, GBI has dedicated internal rating models to evaluate the creditworthiness of
counterparties. The rating models are integrated in the credit decision making and monitoring
processes. Credit rating models serve as a basis for the calculation of regulatory capital and
economic capital that GBI has to maintain to cover expected and unexpected losses from its lending
activities. Ratings are also integral parts of pricing and risk based performance measurement
processes. All rating models are validated by independent third party experts on an annual basis. IAD
also reviews the use of the models and the data quality.
The Credit Committee of GBI is responsible for the control of all credit and concentration risks arising
from the banking and trading books in line with the Bank’s risk appetite. The Wholesale Credit Risk
Policy establishes the Bank’s decision-making process in granting credit limits, setting rules and
guidelines for exposures that give rise to credit risk. In view of the internal ratings and credit
assessment analyses of the obligors, the Credit Committee assigns the credit exposure limit. All
obligors have individual credit limits based on their creditworthiness. Groups of connected obligors
are subject to regulatory ‘group exposure’ limits, as well as internal Group Concentration Policy, to
effectively manage the concentration risk of the Bank. Furthermore, as per the Country Limit Policy,
limits are in place that cap the maximum exposure to specific countries, to ensure that related risks do
not threaten the asset quality or solvency of the Bank. Finally, the Sector Limit Policy is designed to
minimize contagion risks. The effectiveness of risk monitoring is supported by internal systems
ensuring proper compliance with the principle of segregation of duties and authorization levels. Every
transaction under approved credit limits requires a number of authorizations and controls prior to
execution and cannot be finalized without those processes. Under this structure, every commercial
initiative goes through multiple checks and is inputted in the operating system by authorized
8 Including counterparty credit risk
GARANTIBANK INTERNATIONAL N.V. CAPITAL ADEQUACY AND RISK MANAGEMENT REPORT 2016 12
personnel who are functionally separated from the personnel with commercial targets. Regular
monitoring of GBI’s exposure and compliance with the established credit limits ensures timely
management of credit risk. The exposures to various customers, business lines and geographical
locations are monitored on a daily basis by assigned relationship managers and credit officers, while
compliance with the established limits is controlled by CD that provides independent judgement.
The credit follow-up process is divided into two main parts; follow-up of the customer and follow-up of
the credit facility itself. The follow-up of the customer is associated with the credit risk, whereas follow-
up of the credit facility (e.g. documentation) is related to credit risk mitigation and operational risk. The
credit facility follow-up is a dynamic process and is categorized as; performing, watch list, impaired,
provisioned and write-off stages. All shifts within those categories either in the direction of
downgrading or upgrading, require the approval of related credit committee. A loan may be shifted to
the watch list based on the events outlaid in pre-defined warning signals.
The internal information system of GBI offers great possibility in delivering information on a regular
and ad-hoc basis and allows producing a variety of regular reports that comprise all exposures and
concentrations by, among others, geographical location, sector, and borrower.
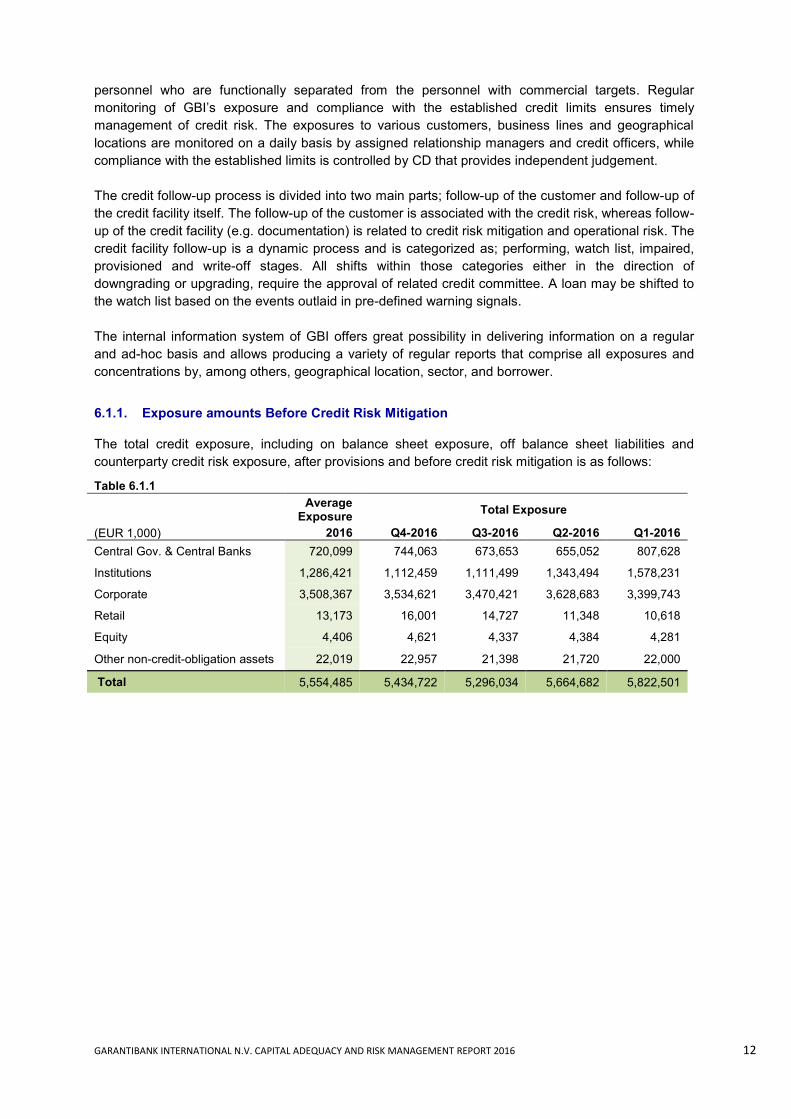
6.1.1. Exposure amounts Before Credit Risk Mitigation
The total credit exposure, including on balance sheet exposure, off balance sheet liabilities and
counterparty credit risk exposure, after provisions and before credit risk mitigation is as follows:
Table 6.1.1
Average
Exposure Total Exposure
(EUR 1,000) 2016 Q4-2016 Q3-2016 Q2-2016 Q1-2016
Central Gov. & Central Banks 720,099 744,063 673,653 655,052 807,628
Institutions 1,286,421 1,112,459 1,111,499 1,343,494 1,578,231
Corporate 3,508,367 3,534,621 3,470,421 3,628,683 3,399,743
Retail 13,173 16,001 14,727 11,348 10,618
Equity 4,406 4,621 4,337 4,384 4,281
Other non-credit-obligation assets 22,019 22,957 21,398 21,720 22,000
Total 5,554,485 5,434,722 5,296,034 5,664,682 5,822,501
GARANTIBANK INTERNATIONAL N.V. CAPITAL ADEQUACY AND RISK MANAGEMENT REPORT 2016 13
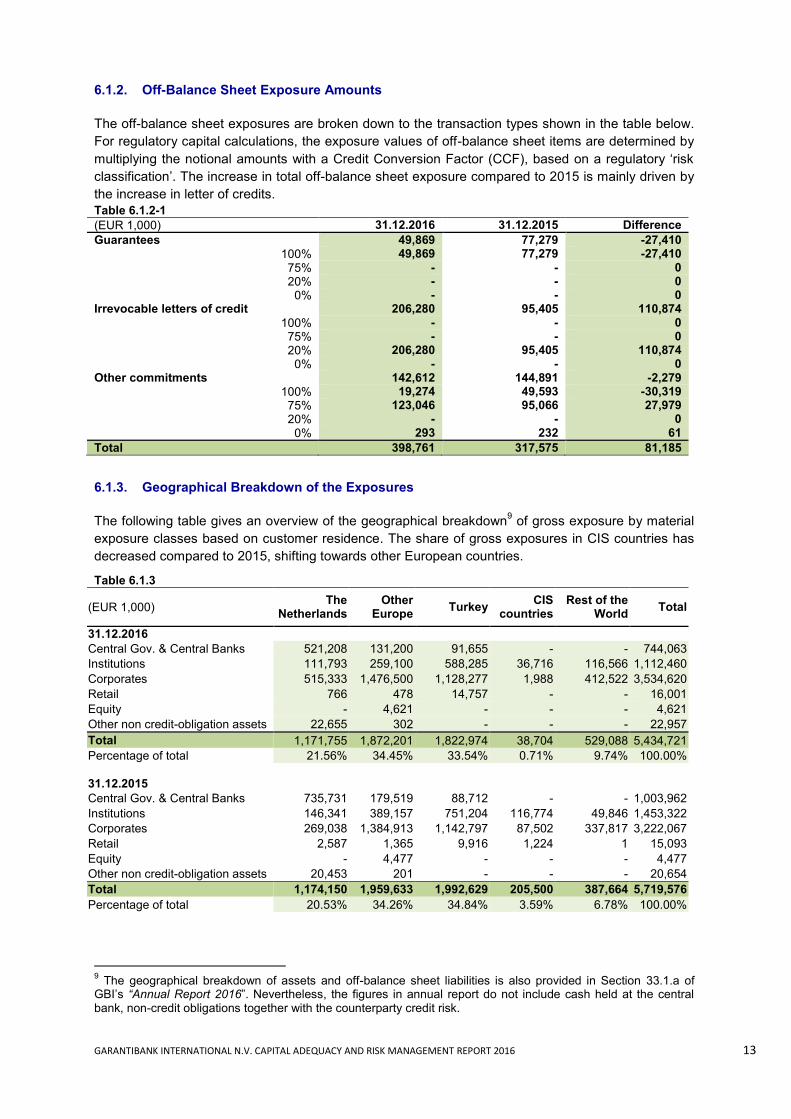
6.1.2. Off-Balance Sheet Exposure Amounts
The off-balance sheet exposures are broken down to the transaction types shown in the table below.
For regulatory capital calculations, the exposure values of off-balance sheet items are determined by
multiplying the notional amounts with a Credit Conversion Factor (CCF), based on a regulatory ‘risk
classification’. The increase in total off-balance sheet exposure compared to 2015 is mainly driven by
the increase in letter of credits.
Table 6.1.2-1
(EUR 1,000) 31.12.2016 31.12.2015 Difference
Guarantees 49,869 77,279 -27,410
100% 49,869 77,279 -27,410
75% - - 0
20% - - 0
0% - - 0 Irrevocable letters of credit 206,280 95,405 110,874
100% - - 0
75% - - 0
20% 206,280 95,405 110,874
0% - - 0 Other commitments 142,612 144,891 -2,279
100% 19,274 49,593 -30,319
75% 123,046 95,066 27,979
20% - - 0
0% 293 232 61
Total 398,761 317,575 81,185
6.1.3. Geographical Breakdown of the Exposures
The following table gives an overview of the geographical breakdown9 of gross exposure by material
exposure classes based on customer residence. The share of gross exposures in CIS countries has
decreased compared to 2015, shifting towards other European countries.
Table 6.1.3
(EUR 1,000) The
Netherlands Other
Europe Turkey
CIS countries
Rest of the World
Total
31.12.2016
Central Gov. & Central Banks 521,208 131,200 91,655 - - 744,063
Institutions 111,793 259,100 588,285 36,716 116,566 1,112,460
Corporates 515,333 1,476,500 1,128,277 1,988 412,522 3,534,620
Retail 766 478 14,757 - - 16,001
Equity - 4,621 - - - 4,621
Other non credit-obligation assets 22,655 302 - - - 22,957
Total 1,171,755 1,872,201 1,822,974 38,704 529,088 5,434,721
Percentage of total 21.56% 34.45% 33.54% 0.71% 9.74% 100.00%
31.12.2015
Central Gov. & Central Banks 735,731 179,519 88,712 - - 1,003,962
Institutions 146,341 389,157 751,204 116,774 49,846 1,453,322
Corporates 269,038 1,384,913 1,142,797 87,502 337,817 3,222,067
Retail 2,587 1,365 9,916 1,224 1 15,093
Equity - 4,477 - - - 4,477
Other non credit-obligation assets 20,453 201 - - - 20,654
Total 1,174,150 1,959,633 1,992,629 205,500 387,664 5,719,576
Percentage of total 20.53% 34.26% 34.84% 3.59% 6.78% 100.00%
9 The geographical breakdown of assets and off-balance sheet liabilities is also provided in Section 33.1.a of
GBI’s “Annual Report 2016”. Nevertheless, the figures in annual report do not include cash held at the central bank, non-credit obligations together with the counterparty credit risk.

GARANTIBANK INTERNATIONAL N.V. CAPITAL ADEQUACY AND RISK MANAGEMENT REPORT 2016 14
6.1.4. Effective Maturity Breakdown
GBI mainly enters into transactions with short maturities as a result of its business model. The vast
majority of the exposures are with residual maturity less than one year. The effective maturity
breakdown of gross exposure based on exposure classes is as follows:
Table 6.1.4
(EUR 1,000) < 3 Months < 6
Months < 1 Year
< 2 Years
< 3 Years
<= 5 Years Total
31.12.2016
Central Gov. & Central Banks 441,984 - 9 - 9,480 292,590 744,063
Institutions 215,112 230,514 248,372 61,655 94,058 262,749 1,112,460
Corporates 1,070,991 357,146 675,098 439,215 458,052 529,497 3,534,620
Retail 5,819 1,276 7,710 13 85 1,098 16,001
Equity - - - - - 4,621 4,621
Other non credit-obligation assets - - - - - 22,957 22,957
Total 1,738,528 588,936 931,189 500,883 561,675 1,113,512 5,434,721
Percentage of total 31.99% 10.84% 17.13% 9.22% 10.33% 20.49% 100.00%
(EUR 1,000) < 3 Months < 6
Months < 1 Year
< 2 Years
< 3 Years
<= 5 Years Total
31.12.2015
Central Gov. & Central Banks 521,524 - - - 189,631 292,805 1,003,960
Institutions 406,478 121,842 359,706 39,508 33,124 492,663 1,453,321
Corporates 1,346,458 310,321 783,102 344,575 218,267 219,346 3,222,068
Retail 9,020 1,279 875 1,564 1,019 1,338 15,095
Equity - - - - - 4,477 4,477 Other non credit-obligation assets - - - - - 20,654 20,654
Total 2,283,479 433,442 1,143,683 385,647 442,041 1,031,283 5,719,576
Percentage of total 39.92% 7.58% 20.00% 6.74% 7.73% 18.03% 100.00%
60.0% of the total credit exposures have effective maturity of lower than one year compared to 67.5%
in 2015.

GARANTIBANK INTERNATIONAL N.V. CAPITAL ADEQUACY AND RISK MANAGEMENT REPORT 2016 15
6.1.5. Breakdown of the Exposures by Sector
The breakdown of gross exposure10
by sector and exposure class is as follows:
Table 6.1.5
(EUR 1,000) 31.12.2016 31.12.2015
Total Total Total % of Total
Central Gov. & Central Banks 744,063 13.69% 1,003,961 17.55%
Institutions 1,112,459 20.47% 1,453,322 25.41%
Corporates 3,530,463 64.96% 3,222,055 56.33%
Financial services 668,293 12.30% 766,261 13.40%
Oil & Gas 497,800 9.16% 417,699 7.30%
Basic materials 471,471 8.68% 453,958 7.94%
Transport & logistics 442,792 8.15% 448,498 7.84%
Chemicals 292,904 5.39% 258,152 4.51%
Consumer products 252,819 4.65% 154,853 2.71%
Construction 239,048 4.40% 122,718 2.15%
Food, beverages and Tobacco 170,030 3.13% 125,217 2.19%
Agriculture 169,708 3.12% 147,833 2.58%
Wholesale 98,568 1.81% 47,558 0.83%
Utilities 80,406 1.48% 14,463 0.25%
Telecom 43,747 0.80% 56,239 0.98%
Services 9,811 0.18% 4,046 0.07%
Leisure and Tourism 17,185 0.32% 19,963 0.35%
Other 75,880 1.40% 184,596 3.23%
Retail 20,150 0.37% 15,107 0.26%
Equity 4,621 0.09% 4,477 0.08%
Other non-credit obligation assets 22,966 0.42% 20,654 0.36%
Total 5,434,722 100.00% 5,719,575 100.00%
6.1.6. Past Due and Impaired Exposures, Provisions and Value Adjustments
A loan is recognized as impaired if there is an objective evidence of impairment. This evidence could
be given by, but is not limited to, the events listed below:
- It is probable that the borrower will enter bankruptcy or other financial reorganization.
- The debtor has payment defaults against third parties; customers, banks, employees, etc.
- The debtor has been in arrears for at least 90 days with regard to repayment of principal
and/or interest.
- Observable data indicates that there is a measurable decrease in the estimated future cash
flows from a group of financial assets since the initial recognition of those assets.
- A breach of contract, such as a default or delinquency in interest or principal payments
- Significant financial difficulty of the issuer or obligor.
- The disappearance of an active market for that financial asset because of financial difficulties.
For impaired loans, GBI attempts to ensure recovery by restructuring, obtaining additional collateral
and/or proceeding with legal actions. Provisions are established by the Credit Committee, for the
outstanding amount of the defaulted credit facility after deduction of expected recoveries and/or
liquidation value of the collaterals. The impaired credit facility is further proposed for write-off after all
10
Breakdown by sector for loans and advances is also provided in Section 33.1.c of GBI’s ”Annual Report 2016”. However, the table above includes all exposures subject to credit risk calculation, thus also including cash, exposures to banks, interest-bearing securities, off-balance sheet exposures and counterparty credit risk.

GARANTIBANK INTERNATIONAL N.V. CAPITAL ADEQUACY AND RISK MANAGEMENT REPORT 2016 16
possible means of recovery have been exhausted. Below table provides information on the impaired
loans and provisions by exposure class:
Table 6.1.6-1
(EUR 1,000) 31.12.2016 31.12.2015
Impairment11
Provisions Impairment11
Provisions
Corporates 62,377 44,429 131,511 77,591
Retail 205 205 245 245
Total 62,583 44,634 131,756 77,836
Loan Loss Reserve Ratio 71.3% 59.1%
The Bank has prudently increased the loan loss provisions as a result of the slowdown in commodity
markets. The ratio is at the 71.3% level, which is higher than 59.1% in 2015.
The table below gives an overview of the impaired and past due exposures and the provisions set
aside by the residence of the counterparty:
Table 6.1.6-2
(EUR 1,000) Impaired
Exposures11
More than 90 days
past due Provisions for
Impairment
31.12.2016
The Netherlands 1,450 - 51
Other Europe 52,886 - 38,310
CIS countries 6,320 - 5,058
Rest of the world - - -
Turkey 1,926 7,657 1,215
Total 62,583 7,657 44,634
31.12.2015
The Netherlands 1,413 61
Other Europe 57,532 26,249
CIS countries 34,934 24,583
Rest of the world 35,305 24,479
Turkey 2,572 2,464
Total 131,756 77,836
An exposure is past due if a debtor has failed to make a payment of principal and/or interest when
contractually due.
The actual value adjustments in the preceding periods for each exposure class are as follows:
Table 6.1.6-3
(EUR 1,000) 31.12.2016 31.12.2015
Position as of 1 January 77,836 61,229
Additions 29,368 50,860
Write-offs (61,983) -39,099
Releases (1,377) -2,234
Exchange rate differences 790 7,080
Position as of 31 December 44,634 77,836
The net provision for loan losses decreased to EUR 44.6 million from EUR 77.8 million.
11
Impaired exposures after deduction of financial collaterals and including the noncash exposures to the impaired customers.

GARANTIBANK INTERNATIONAL N.V. CAPITAL ADEQUACY AND RISK MANAGEMENT REPORT 2016 17
6.1.7. Counterparty Credit Risk
The exposure value of the counterparty credit risk is calculated according to Part Three, Title II,
Chapter 6, section 3 of the CRR. Establishment of a credit limit for counterparty credit risk includes,
but is not limited to, for the products below:
- Spot and forward foreign exchange (FX) transactions
- Currency transactions including currency swaps
- Options
- Forward rate agreement (FRA)
- Interest rate swaps (IRS)
- Credit default swaps (CDS)
- Securities lending or borrowing transactions (SFTs)
Wrong-way risk refers to the risk that exposure to the counterparty is positively correlated to the
counterparty’s probability of default. GBI does not have exposure to such specific wrong-way risk.
Derivatives transactions with professional market participants are subject to the Credit Support Annex
(CSA) of the International Swaps and Derivatives Association (ISDA) derivatives agreements.
Therefore the Bank could be in a position to provide or require additional collateral as a result of
fluctuations in the market value of derivatives. The amount of collateral provided under these
agreements is disclosed under section 32 (Asset Encumbrance) of GBI’s “Annual Report 2016”. In the
last two years, the maximum monthly net increase in collateral provided, resulting from the
fluctuations in the market value of (hedging) derivatives amounted to EUR 132.2 million.
Some of the Bank’s agreements contain ‘Additional Termination Event’ clauses based on potential
downgrades. However, the Bank does not underwrite any credit derivatives, and uses only simple
products related to FX and interest rate risk hedging. Moreover, all derivatives under CSAs are
marked-to-market daily and collateral is posted to or received from the counterparty on a daily basis.
As such, in the occurrence of an Additional Termination Event the Bank would not face an additional
cash outflow. For derivatives transactions with clients the Bank is not obliged to provide collateral, but
it is entitled to receive collateral from clients, hence there is no potential liquidity risk for the Bank. The
repurchase transactions are subject to the Global Master Repurchase Agreement (GMRA).
The increase in the positive replacement value of derivatives together with the increase in the
repurchase transactions, have increased the total counterparty credit risk in 2016 compared to 2015.
The credit exposures of the derivative transactions are calculated by using Mark-to-market Method
and eligible collaterals are accounted for, where applicable.

GARANTIBANK INTERNATIONAL N.V. CAPITAL ADEQUACY AND RISK MANAGEMENT REPORT 2016 18
Table 6.1.7-1 demonstrates the steps in the calculation of net derivatives credit exposure.
Table 6.1.7-1
(EUR 1,000)
Positive Replacement
Value
Potential Future Credit
Exposure
Exposure Value
12
Collateral Held
Net Exposure
13
31.12.2016
Repurchase transactions 169,432 129,094 40,338
Interest rate derivatives 313 4,265 4,578 - 4,578
FX derivatives and Options 68,630 24,208 92,838 4,091 88,747
Other derivatives 955 4,480 5,435 0 5,435
Total 69,898 32,953 272,283 133,185 139,097
(EUR 1,000)
Positive Replacement
Value
Potential Future Credit
Exposure
Exposure Value
14
Collateral Held
Net Exposure
15
31.12.2015 Repurchase transactions - - 319,138 258,194 60,944
Interest rate derivatives 139 4,531 4,670 - 4,670
FX derivatives and Options 48,809 46,908 95,717 24,605 71,112
Other derivatives 21,261 11,598 32,858 4,382 28,476
Total 70,209 63,036 452,384 287,182 165,202
The distribution of derivatives notional amounts by residual maturity and information on the fair value
of the derivatives are provided in Section 33.1.e and Section 34, respectively, of GBI’s “Annual Report
2016”.
6.1.8. Credit Risk Mitigation
Credit risk mitigants are financial collaterals and guarantees which directly decrease the credit
exposure or transfer the credit risk from obligor to guarantor. GBI applies diversified collateral
requirements and a systematic approach to evaluation of collaterals submitted by customers, which
depend on the transaction type and purpose, including but not limited to cash margins, physical
commodities, receivables, cash flows, guarantees, accounts, financial instruments and immovable or
movable assets. The value of collateral is usually monitored on a regular basis to ensure timely
measures are taken, if necessary. Financial collaterals are valued on a daily and immovable/movable
property on at least a yearly basis.
The use of collateral to reduce counterparty credit exposure is also embedded in the standard legal
agreements used throughout the industry as explained in Section 6.1.7. For derivative transactions,
the legal agreements include the ISDA derivatives agreements with CSA.
The range of collateral that is eligible for the use of credit risk mitigation is based on the regulatory
capital calculation method that is used. GBI uses the Financial Collateral Comprehensive method in
the calculation of credit risk mitigation factors. Financial collateral received mostly consists of cash,
12
Exposure value refers to the sum of positive replacement cost and potential future credit exposure, however for Repurchase transactions, it includes mark-to-market value of the securities provided as collateral (after application of regulatory volatility haircuts). 13
Exposure after collateral mitigation 14
Exposure value refers to the sum of positive replacement cost and potential future credit exposure. For repurchase transactions, it includes mark-to-market value of the securities provided as collateral (after application of regulatory volatility haircuts). 15
Exposure after collateral mitigation

GARANTIBANK INTERNATIONAL N.V. CAPITAL ADEQUACY AND RISK MANAGEMENT REPORT 2016 19
but also includes debt securities, and hence is not subject to significant concentration. The credit
quality of unfunded credit protection providers is assessed as per the credit policy of the Bank.
The total exposure value that is covered by financial and other collaterals recognized as eligible credit
risk mitigation16
by the CRR s as follows:
Table 6.1.8-1
(EUR 1,000)
Financial Collateral Guarantees
Other Collateral Total
31.12.2016
Central Gov. & Central Banks 70,000 - - 70,000
Institutions 71,425 60,172 - 131,597
Corporates 77,893 321,683 - 399,576
Retail 8,413 - - 8,413
Total 227,731 381,855 - 609,586
31.12.2015
Central Gov. & Central Banks 150,000 - - 150,000
Institutions 114,429 18,371 - 132,800
Corporates 111,349 325,044 - 436,393
Retail 7,688 - - 7,688
Total 383,465 343,415 - 726,880
16
Similar table in Section 33.1.b of GBI’s “Annual Report 2016” presents all collateral received only for loans and advances, while the figures presented here contain only collateral used as credit risk mitigation in the capital requirement calculation, for all assets.
GARANTIBANK INTERNATIONAL N.V. CAPITAL ADEQUACY AND RISK MANAGEMENT REPORT 2016 20
6.2. Scope of Acceptance for F-IRB Approach
GBI applies the F-IRB approach for the following exposure classes: Central Governments and Central
Banks, Institutions and Corporates (including sub classes; Corporates, Non-Bank Financial
Institutions, Specialized Lending exposure classes of Commodity Finance and Shipping Finance).
Retail exposures (including sub classes Retail and Private Banking) are subject to permanent
exemption from F-IRB and are treated under SA.
For exposures treated under SA, the Bank uses, if available, external credit ratings of Moody’s, S&P
and Fitch, with the ‘average’ formula prescribed by Article 138 of the CRR.
6.2.1. General Description of the Models
GBI has dedicated rating models for all the sub-exposure classes mentioned above. The rating
models within the scope of F-IRB application can be grouped into two:
- Probability of Default (PD) Models: These models provide obligor grades based on the master
scale defined by GBI. The master scale has 22 rating grades and provide sufficient
granularity for risk assessment. The rating grades are converted to PD via a master scale.
The master scale is reviewed on an annual basis and updated where necessary based on the
internal and external changes in observed default rates.
- Supervisory Slotting Criteria (SSC) Models: GBI has developed rating models for Specialized
Lending exposure classes of Commodities Finance and Shipping Finance based on the SSC
as per the conditions stated in CRD. SSC Models provide 5 grades, which are mapped to risk
weights set by the regulation.
All PD models used within GBI have similar and consistent methodologies, which are based on two
steps. The first step contains financial and non-financial models that produce a combined score. The
models use financial information along with qualitative information that is collected through standard
questionnaires. This score is further adjusted for a number of warning signals. The result is an
individual rating, which is subject to an override framework in the second step. The override
framework has three layers, which are; country layer, parental support and manual override.
The internal models are subject to a regular cycle of validation and review performed by external and
internal parties.
6.2.2. Governance Framework Around F-IRB Models and Processes
Credit rating models at GBI are based on a model-life cycle framework consisting of the following
steps;
- Model development - Model approval - Model implementation - Use and monitoring of model performance - Model validation
Model development starts with the identification of the model requirement. This may arise from
regulatory needs, improving risk management practices, changes in business structure that might
lead to a new business line or a new asset class, a drastic change in macroeconomic or business
environment that might affect risk factors, change in market practices and validation results that would
necessitate model re-development.

GARANTIBANK INTERNATIONAL N.V. CAPITAL ADEQUACY AND RISK MANAGEMENT REPORT 2016 21
Model approval starts after the completion of model development and model documentation. All the
relevant materials regarding the model development are submitted to the RMC for approval. The
models are approved based on the criteria that the model should reflect the risk perception of GBI,
meet regulatory requirements, have a consistent methodology with the other models used by GBI,
and perform adequately for that specific asset class. The proposed model may also be subject to
approval by GBI’s competent authority, if model changes are material17
.
Model implementation starts once the model is approved by the RMC. IT related issues, data
management, business line process re-design, training of the users of the models and notification
to/approval from GBI’s competent authority (if needed) are included in the generic roll-out plan of
model implementation.
The models are used within the various levels of the organization. Related business lines initiate the
rating process together with the credit proposals. The Credit Division reviews the rating which is then
approved by the Credit Committee. The assigned ratings are used for all relevant transactions of the
counterparty throughout the whole credit decision making process, including credit granting,
utilization, pricing and performance monitoring.
The correct use of models is audited by IAD within the scope of the regular audit activities. RMD is
responsible for the on-going monitoring of the performance of the models. Model accuracy, stability,
granularity, use of overrides and the data quality are key performance indicators for model
performance. As the Bank mainly works with low default portfolios, the accuracy of the models cannot
be measured through predictive power against default experience. Hence, alternative methods are
used to ensure that the models perform satisfactorily, such as comparing the model outcomes with
internal or external benchmarks and using concordance measures to determine their similarity.
The model validation framework is managed by a validation team that is independent of the model
development team. RMC has the ultimate decision making authority in the formation of the validation
team and the selection of the third party. The findings of the validation team are presented in the
validation reports. Model validation is conducted once a year and may be conducted more frequently
based on the model performance.
Model maintenance is an on-going process which follows several steps within the lifecycle of the
model. GBI has established procedures in order to support change management. These procedures
explain
the roles and responsibilities of the related stakeholders during the implementation of a change in the
models, including detailed procedures related with the IT infrastructure of the models. These activities
are audited by IAD on a regular basis in addition to the independent checks and controls carried out
within the scope of the validation process.
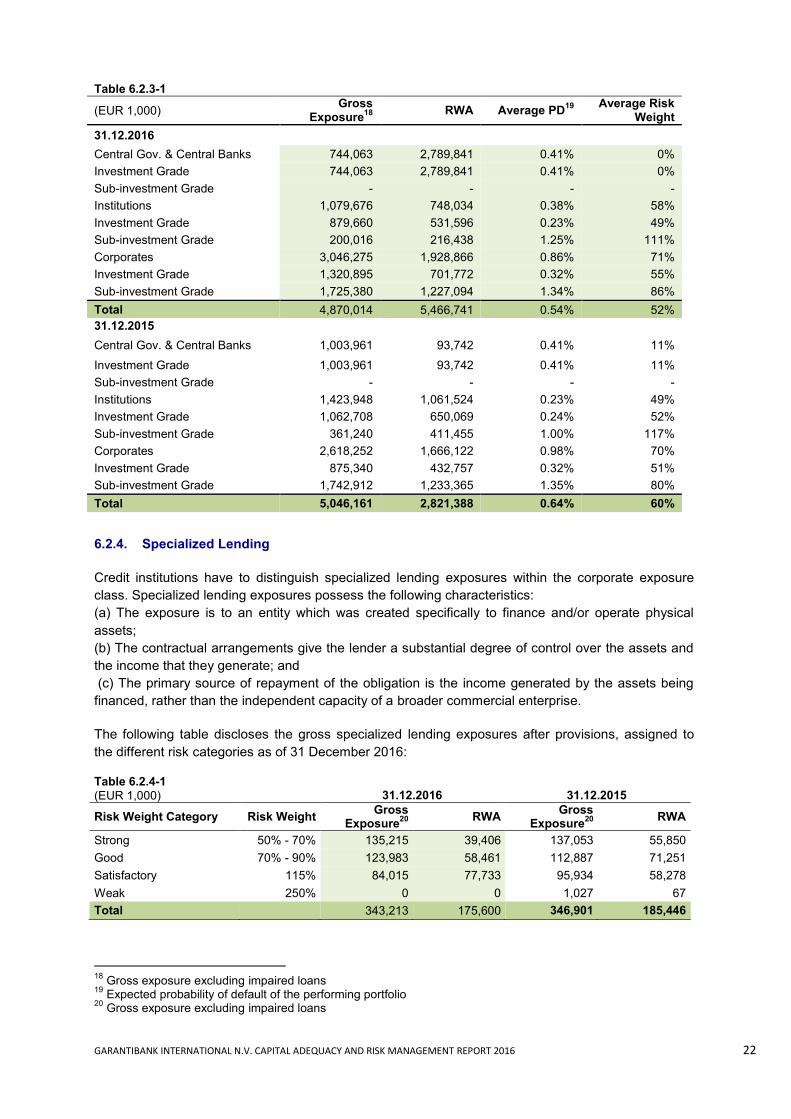
6.2.3. Calculation of risk Weighted Assets for F-IRB Exposure Classes
RWA calculation for credit risk is performed based on a regulatory formula under the F-IRB approach
where the Probability of Default (PD), Maturity (M), Exposure at Default (EAD) and Loss given Default
(LGD) are the factors. Under the F-IRB approach, PDs are estimated by the institution while M, LGD
and EAD are determined based on supervisory estimates provided in CRR.
Below is an overview of the portfolios, applicable for F-IRB methodology, excluding specialized
lending, as of 31 December 2016.
17
EBA has published Regulatory Technical Standards based on Article 143.5 of the CRR, which are to be applied when determining materiality of changes in the IRB approach of an institution.
GARANTIBANK INTERNATIONAL N.V. CAPITAL ADEQUACY AND RISK MANAGEMENT REPORT 2016 22
Table 6.2.3-1
(EUR 1,000) Gross
Exposure18
RWA Average PD19
Average Risk Weight
31.12.2016
Central Gov. & Central Banks 744,063 2,789,841 0.41% 0%
Investment Grade 744,063 2,789,841 0.41% 0%
Sub-investment Grade - - - -
Institutions 1,079,676 748,034 0.38% 58%
Investment Grade 879,660 531,596 0.23% 49%
Sub-investment Grade 200,016 216,438 1.25% 111%
Corporates 3,046,275 1,928,866 0.86% 71%
Investment Grade 1,320,895 701,772 0.32% 55%
Sub-investment Grade 1,725,380 1,227,094 1.34% 86%
Total 4,870,014 5,466,741 0.54% 52%
31.12.2015
Central Gov. & Central Banks 1,003,961 93,742 0.41% 11%
Investment Grade 1,003,961 93,742 0.41% 11%
Sub-investment Grade - - - -
Institutions 1,423,948 1,061,524 0.23% 49%
Investment Grade 1,062,708 650,069 0.24% 52%
Sub-investment Grade 361,240 411,455 1.00% 117%
Corporates 2,618,252 1,666,122 0.98% 70%
Investment Grade 875,340 432,757 0.32% 51%
Sub-investment Grade 1,742,912 1,233,365 1.35% 80%
Total 5,046,161 2,821,388 0.64% 60%
6.2.4. Specialized Lending
Credit institutions have to distinguish specialized lending exposures within the corporate exposure
class. Specialized lending exposures possess the following characteristics:
(a) The exposure is to an entity which was created specifically to finance and/or operate physical
assets;
(b) The contractual arrangements give the lender a substantial degree of control over the assets and
the income that they generate; and
(c) The primary source of repayment of the obligation is the income generated by the assets being
financed, rather than the independent capacity of a broader commercial enterprise.
The following table discloses the gross specialized lending exposures after provisions, assigned to
the different risk categories as of 31 December 2016:
Table 6.2.4-1
(EUR 1,000)
31.12.2016 31.12.2015
Risk Weight Category Risk Weight Gross
Exposure20
RWA
Gross Exposure
20
RWA
Strong 50% - 70% 135,215 39,406 137,053 55,850
Good 70% - 90% 123,983 58,461 112,887 71,251
Satisfactory 115% 84,015 77,733 95,934 58,278
Weak 250% 0 0 1,027 67
Total
343,213 175,600 346,901 185,446
18
Gross exposure excluding impaired loans 19
Expected probability of default of the performing portfolio 20
Gross exposure excluding impaired loans
GARANTIBANK INTERNATIONAL N.V. CAPITAL ADEQUACY AND RISK MANAGEMENT REPORT 2016 23
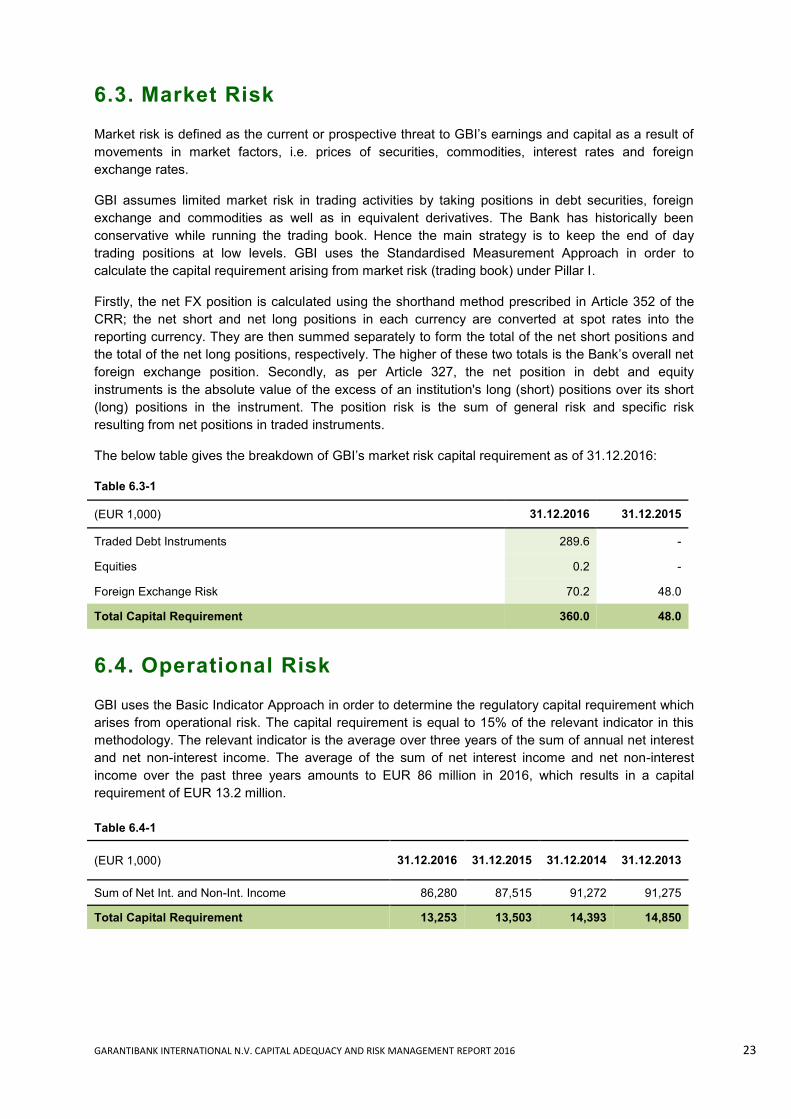
6.3. Market Risk
Market risk is defined as the current or prospective threat to GBI’s earnings and capital as a result of
movements in market factors, i.e. prices of securities, commodities, interest rates and foreign
exchange rates.
GBI assumes limited market risk in trading activities by taking positions in debt securities, foreign
exchange and commodities as well as in equivalent derivatives. The Bank has historically been
conservative while running the trading book. Hence the main strategy is to keep the end of day
trading positions at low levels. GBI uses the Standardised Measurement Approach in order to
calculate the capital requirement arising from market risk (trading book) under Pillar I.
Firstly, the net FX position is calculated using the shorthand method prescribed in Article 352 of the
CRR; the net short and net long positions in each currency are converted at spot rates into the
reporting currency. They are then summed separately to form the total of the net short positions and
the total of the net long positions, respectively. The higher of these two totals is the Bank’s overall net
foreign exchange position. Secondly, as per Article 327, the net position in debt and equity
instruments is the absolute value of the excess of an institution's long (short) positions over its short
(long) positions in the instrument. The position risk is the sum of general risk and specific risk
resulting from net positions in traded instruments.
The below table gives the breakdown of GBI’s market risk capital requirement as of 31.12.2016:
Table 6.3-1
(EUR 1,000) 31.12.2016 31.12.2015
Traded Debt Instruments 289.6 -
Equities 0.2 -
Foreign Exchange Risk 70.2 48.0
Total Capital Requirement 360.0 48.0
6.4. Operational Risk
GBI uses the Basic Indicator Approach in order to determine the regulatory capital requirement which
arises from operational risk. The capital requirement is equal to 15% of the relevant indicator in this
methodology. The relevant indicator is the average over three years of the sum of annual net interest
and net non-interest income. The average of the sum of net interest income and net non-interest
income over the past three years amounts to EUR 86 million in 2016, which results in a capital
requirement of EUR 13.2 million.
Table 6.4-1
(EUR 1,000) 31.12.2016 31.12.2015 31.12.2014 31.12.2013
Sum of Net Int. and Non-Int. Income 86,280 87,515 91,272 91,275
Total Capital Requirement 13,253 13,503 14,393 14,850
GARANTIBANK INTERNATIONAL N.V. CAPITAL ADEQUACY AND RISK MANAGEMENT REPORT 2016 24
7. ICAAP FRAMEWORK
GBI has designed a comprehensive ICAAP framework by making use of qualitative and quantitative
assessment methodologies to assess the adequacy of the Bank’s capital to cover various risks. The
methodologies used are believed to be the most appropriate ones in line with the risk profile of GBI
and they reflect the underlying risks in a prudent manner.
ICAAP starts with the assessment of the capital allocated for Pillar I risks. The capital calculations
under Pillar I are referred to as Regulatory Capital (RCAP). GBI has specific assessment
methodologies for credit, market and operational risks, which are used to come up with an Economic
Capital (ECAP) figure. RCAP and ECAP are compared for each risk type under Pillar I and the
maximum of RCAP and ECAP is taken as the outcome of ICAAP.
The second step is to take into account the additional capital requirements arising from the risks that
are not taken into account in Pillar I. GBI has a dedicated assessment methodology for each material
Pillar II risk. The capital requirement for the concentration risk and interest rate risk in the Banking
Book (IRRBB) are calculated through quantitative techniques, whereas the strategic risk and business
risk are assessed within the scope of capital plan and business viability analysis.
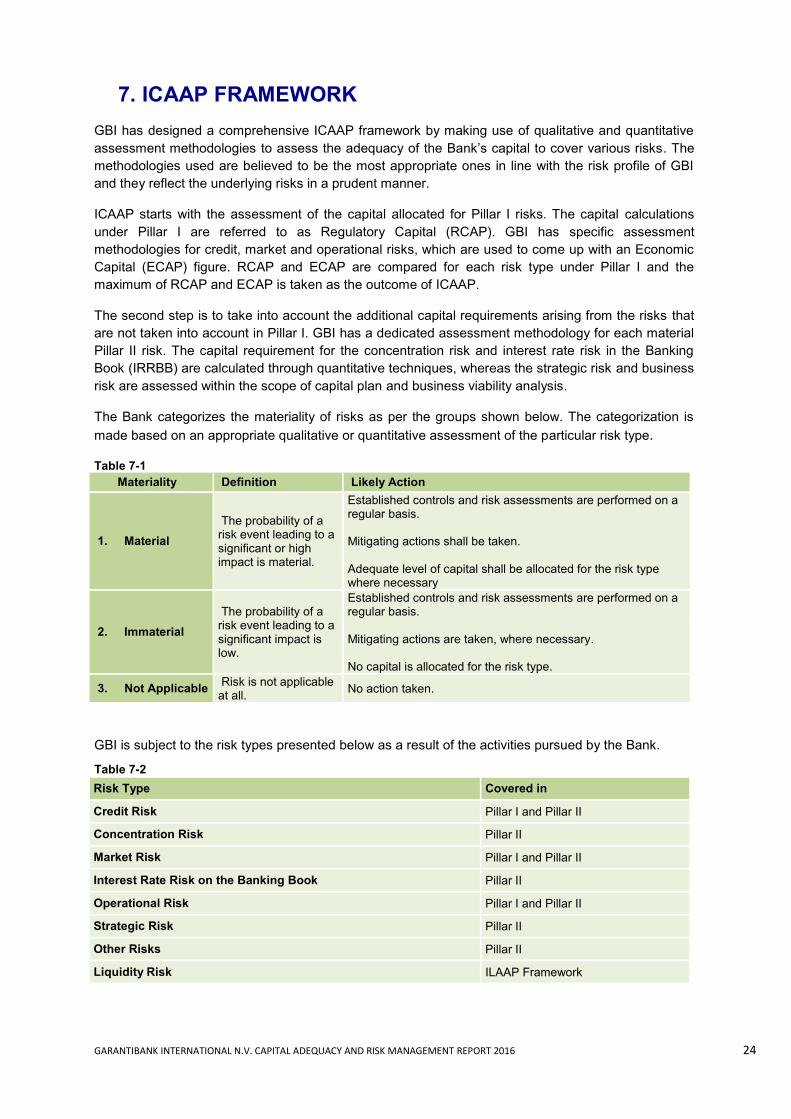
The Bank categorizes the materiality of risks as per the groups shown below. The categorization is
made based on an appropriate qualitative or quantitative assessment of the particular risk type.
Table 7-1
Materiality Definition Likely Action
1. Material
The probability of a risk event leading to a significant or high impact is material.
Established controls and risk assessments are performed on a regular basis. Mitigating actions shall be taken. Adequate level of capital shall be allocated for the risk type where necessary
2. Immaterial
The probability of a risk event leading to a significant impact is low.
Established controls and risk assessments are performed on a regular basis. Mitigating actions are taken, where necessary. No capital is allocated for the risk type.
3. Not Applicable Risk is not applicable at all.
No action taken.
GBI is subject to the risk types presented below as a result of the activities pursued by the Bank.
Table 7-2
Risk Type Covered in
Credit Risk Pillar I and Pillar II
Concentration Risk Pillar II
Market Risk Pillar I and Pillar II
Interest Rate Risk on the Banking Book Pillar II
Operational Risk Pillar I and Pillar II
Strategic Risk Pillar II
Other Risks Pillar II
Liquidity Risk ILAAP Framework

GARANTIBANK INTERNATIONAL N.V. CAPITAL ADEQUACY AND RISK MANAGEMENT REPORT 2016 25
7.1. Credit Risk
GBI has a dedicated ECAP model for credit risk, which is used as a benchmark to assess the
adequacy of regulatory capital allocated for credit risk under Pillar I. A 99.9% confidence level is used
in the ECAP calculations.
7.2. Concentration Risk
Concentration risk is defined as the risk arising from the concentration of credit exposure in a group of
obligors vulnerable to the same or similar/correlated factors; e.g. sector concentration, country
concentration, single name concentration.
GBI continuously follows the credit risk positions of all obligors via a comprehensive management
information system. Concentrations to individual customers, groups, countries and sectors are subject
to limits, as per the Limit Framework of GBI. These concentration levels are tracked frequently by the
CD, and monitored and discussed regularly at the CC.
Tracking of large exposures is also an integral part of this process. GBI monitors credit exposures to
group of connected clients and proactively manages single name concentration as per the rules and
limits stated in internal Group Concentration Policy. The policy and limits are also reviewed by the CC
and SB on a regular basis, all of which together enable the Bank to comfortably comply with
requirements on limits to large exposures outlined in the CRR. Furthermore, as per the Country Limit
Policy, limits are in place that cap the maximum exposure to specific countries, to ensure that related
risks do not threaten the asset quality or solvency of the Bank. Finally, the Sector Limit Policy is
designed to minimize contagion risks.
RMD monitors the concentration risk, quantifies its impact on the regulatory and economic capital,
and reports to RMC and SB. GBI has developed an integrated quantitative methodology for the
assessment of concentration risk. The concentration risk model, which is another form of economic
capital methodology, takes into account the main concentration elements in the portfolio, namely
single name concentration, country concentration and sector concentration, in a more conservative
manner. The outcomes of the concentration risk model are supplemented by various stress tests.
The Bank complies with the requirements of the “Policy rule on the treatment of concentration risk in
emerging countries”, which is a specific regulation on concentration risk that entered into force in the
Netherlands as of July 2010.
7.3. Market Risk
GBI uses Value-at-Risk (VaR) analysis as a risk measure for market risk on the trading book, in order
to assess the adequacy of the capital allocated under Pillar I and in the daily limit monitoring process.
VaR quantifies the maximum loss that could occur due to changes in risk factors (e.g. interest rates,
foreign exchange rates, equity prices, etc.) for a time interval of one day, with a confidence level of
99%. This amount is multiplied by square root of 10 and multiplication factor of three (as a result of
the daily back tests) in order to calculate the required capital. Limits based on VaR are defined and
monitored periodically.
ALCO bears the overall responsibility for the market risk and sets the limits at product or desk levels.
Treasury Department actively manages the market risk within the limits provided by ALCO. Middle
Office (MO) and ICU, which are both established as independent control bodies, monitor and follow-

GARANTIBANK INTERNATIONAL N.V. CAPITAL ADEQUACY AND RISK MANAGEMENT REPORT 2016 26
up all trading transactions and positions on an on-going basis. Trading activities are followed-up as
per the position, stop-loss, sensitivity and VaR limits set by ALCO. Single transaction and price
tolerance limits have been established in order to minimize the operational risks involved in the
trading processes. RMD is responsible for the maintenance of internal models, monitoring of risk
based limits and performing stress tests and presenting the results to the related committees.
VaR is supplemented by stress tests and scenario analyses in order to determine the effects of
potential extreme market developments on the value of market risk sensitive exposures. Stress tests
have the advantage of out-of-model analyses of the trading book. Hypothetical or historical scenarios
are chosen and applied to the Bank’s position regularly. These scenarios are reviewed periodically
and updated when necessary. Currently the stress tests include ‘factor push’ type of tests where
shocks are applied to the key market factors, as well as stress tests where historical scenarios such
as the 2001 crisis in Turkey and the 2008 Lehman collapse are applied to the Bank’s current portfolio.
GBI manages the currency risk and interest rate risk in line with the policies and risk appetite set by
the Supervisory Board. GBI uses FX hedging derivatives such as currency swaps, currency forward
contracts and cross currency interest rate swaps in convertible currencies to manage the currency
risk inherent to the balance sheet, and uses duration gap and sensitivity analyses for the
quantification of interest rate risk. The outcomes of these analyses are used in decision making
processes for hedging and pricing. GBI uses interest rate swaps, cross currency swaps and forward
rate agreements to hedge interest rate risk in major currencies in her banking book by converting the
short term/floating interest into fixed interest or converting fixed interest into short term/floating
interest, depending on the composition of the balance sheet. To avoid accounting mismatches due to
differences in valuation between derivatives used for hedging and hedged items, GBI applies cost
price hedge accounting according to Dutch Accounting Standards. GBI tests the effectiveness based
on the critical terms comparison method, where the critical terms of the hedging instrument are
compared with the terms of the hedged item.
7.4. Interest Rate Risk on the Banking Book (IRRBB)
Interest rate risk is defined as the risk of loss in interest earnings or in the economic value of banking
book items as a consequence of fluctuation in interest rates. GBI perceives interest rate risk as a
combination of repricing risk, yield curve risk, basis risk and option risk. The asset and liability
structure of the Bank creates a certain exposure to IRRBB. Repricing risk is the most important one
and the others are at immaterial levels as a result of the business model of the Bank. However, all
types are monitored and their impact is assessed regularly. Business units are not allowed to run
structural interest mismatch positions. As a result of this policy, day-to-day interest rate risk
management is carried out by the Treasury Department in line with the policies and limits set by
ALCO, with the help of a well-defined internal transfer pricing process.
IRRBB is measured and monitored at each meeting of ALCO by using Duration, Repricing Gap and
Sensitivity analyses. Sensitivity analyses are based on both economic value and earnings
perspectives. Interest sensitivity is measured by applying standard parallel yield curve shifts, historical
simulation and user defined yield curve twist scenarios. All analyses are based on the interest rate
repricing maturities. Behavioural analyses are used for the products that do not have contractual
maturities; for GBI the only product that falls under this condition is demand deposits. To assess the
interest rate related behaviour of these liabilities, GBI conducts a demand deposit modelling analysis
to predict deposit outflow patterns over time, taking into account historical deposit trends and various
factors such as deposit age and market rates.
The Repricing Gap analysis shows interest bearing assets and liabilities broken down by when they
are next due for repricing. This analysis is used as a supplementary measure to duration in order to

GARANTIBANK INTERNATIONAL N.V. CAPITAL ADEQUACY AND RISK MANAGEMENT REPORT 2016 27
point out interest bearing inflows/outflows and their maturities. Maturity calendar is disclosed under
section 33.2.b (Interest Rate Risk) of GBI’s “Annual Report 2016”.
The Earnings at Risk (EaR) analysis focuses on the effects of interest rate changes on the Bank’s
reported earnings over one year and two years. The standard gradual shift in the yield curve is
applied for the calculation of the regulatory stress test; the interest rates are assumed to increase (or
decrease) within one year and to remain at that level in the second year.
Economic Value of Equity (EVE) is defined as the economic value of assets less the economic value
of liabilities. The standard parallel shock to risk-free yield curves, as defined in “EBA guidelines on the
management of interest rate risk arising from non-trading activities”, leads to a potential decrease in
EVE of EUR 51.6 million (8.64% of the total own funds), which is below the regulatory threshold of
20%.
GBI also measures interest rate sensitivity by using historical volatility approach. Historical scenarios
are applied to the whole banking book in a systematic manner in order to find the day in history which
would have the maximum negative impact on the economic value of equity. Scenarios are determined
based on the interest rates collected at different currencies and maturities for a 5-year historical
period.
Table 7.4-1
Economic Value Sensitivity Analysis21
EUR USD TRY OTHER TOTAL
(EUR 1,000)
31.12.2016
Shift Up Net22
-23,265 -27,339 -783 -200 -51,587
Shift Down Net22
10,710 32,209 817 0 43,737
Change in Economic Value
51,587
Own Funds
597,129
Change in Economic Value / Own Funds
8.64%
31.12.2015
Shift Up Net
22 -21,358 -40,558 1,853 20 -60,043
Shift Down Net22
18,102 49,009 -1,895 0 65,216
Change in Economic Value
60,043
Own Funds
620,181
Change in Economic Value / Own Funds
9.68%
The Bank has a moderate duration structure. The duration mismatch is stable as a natural
consequence of the clear business model of the Bank.
All interest rate sensitivity analyses are also used for evaluating hedging strategies, internal limit
setting and portfolio monitoring purposes, enabling GBI to manage interest rate risk in a proactive
manner.
7.5. Operational Risk
Operational risk is defined as the risk of loss resulting from inadequate or failed internal processes,
people and systems or from external events. Operational risk includes potential losses caused by a
breakdown in information or transaction processing and settlement systems and procedures, human
21
Static balance sheet, based on instant liquidation 22 200 Bps shock
GARANTIBANK INTERNATIONAL N.V. CAPITAL ADEQUACY AND RISK MANAGEMENT REPORT 2016 28
errors, non-compliance with internal policies or procedures, including the possibility of unauthorized
transactions by employees.
The Bank has embedded the 3 Lines of Defence model in its day-to-day activities. The first line is the
business lines that are the experts in their field; the second line is the controlling functions (ICU, CD,
ISD, IAC, LCD) responsible for establishing and implementing the relevant control processes, in
addition to challenging and advising the business; the third line is Internal Audit that performs
independent audits throughout the year. The operational risk identification and monitoring is mainly
monitored by three departments at GBI; ICU for process risks, ISD and IAC for information and
technology risks and LCD for legal and compliance related risks.
The operational risk framework of GBI is based on the principle that senior management, in addition
to the MB and SB, is actively involved in risk management, and that the risk management system is
independent, sound and implemented with integrity.
GBI establishes and continuously reviews policies and procedures to set the internal rules and uses a
“Risk and Control Matrix” to identify the risks in daily processes and to assess the effectiveness of the
control points that mitigate these risks. It is based on self-assessment of individual departments and
aims to control the operational risks inherent in all key processes of the Bank. The risk levels and the
process control points identified as such are then reported to RMC.
The Bank’s internal control framework for process risks, consists of daily controls performed by all
controlling functions and by ICU, to ensure that the activities of the Bank are in compliance with the
internal policies and that corrections are done in a timely manner on a consolidated basis.
GBI follows the Financial Institutions Risk Analysis Method (FIRM) for its operational risk for ICAAP.
FIRM questionnaires are also used via a scoring methodology. The answers to the questions are
translated into scores in a similar manner to that explained in the FIRM manual. The score outcomes
are reviewed in order to make the necessary decisions (if any) to take mitigating action.
IT risk assessments are performed regularly based on the international Control Objectives for
Information and Related Technology (COBIT) and national FIRM standards. The implementation of an
Information Security Management System in accordance with internationally recognized standards
(ISO/IEC 27001&27002) is a key objective of the Bank. This involves the systematic examination of
the Bank’s information security risks; the identification of threats and vulnerabilities and assessment
of associated risk exposures; the implementation of a comprehensive suite of security controls to
reduce or mitigate identified information security risks; conducting information security awareness
training for all employees; the establishment of information security and information technology
policies to manage potential exposures and a robust management process to ensure controls
continue to meet the Bank’s information security needs; and lastly, centralizing, standardizing and
automating identity management services to reduce risk, cost and improve operational efficiency.
GBI is aware of the integrity risks that are possible and common in the banking industry in general
and moreover in its core activities; international trade finance, correspondent banking and retail
banking.
Integrity is a core value of GBI, and is embedded in the Bank’s organization and implemented through
a number of policies and procedures.
GBI uses Systematic Integrity Risk Analysis (SIRA) to evaluate integrity risks with respect to
characteristics of the Bank’s products, services, customers, and geographical locations. SIRA also
provides an overview of the main compliance risk management controls applied within the Bank.

GARANTIBANK INTERNATIONAL N.V. CAPITAL ADEQUACY AND RISK MANAGEMENT REPORT 2016 29
7.6. Reputational and Strategic Risks
GBI is committed to safeguarding its reputation as a reliable, professional, and trustworthy provider of
financial services in the eyes of all stakeholders, including regulators, shareholders, clients, and
society. The Bank avoids activities, which might lead to insufficient compliance with internal policies or
external regulations and, which may generate reputational risk in the eyes of all stakeholders,
including regulators, shareholders, clients and society. The impact of reputation risk is also included
within the scope of liquidity risk management and the Recovery Plan.
Strategic risk is the current or prospective risk to earnings and capital arising from changes in the
business environment and from adverse business decisions, improper implementation of decisions or
lack of responsiveness to changes in the business environment. GBI assumes low strategic risk to
achieve its business goals in changing market conditions. Strategic risk is taken into account in the
capital planning process and business viability analysis in order to account for the possible increase in
the capital requirement based on the strategies or the business models that are chosen by GBI.
7.7. Other Risks
Risks around the business model are assessed through the Business Viability Analysis. Business risk
is also continuously monitored as part of the concentration risk, and also through the near-default
scenarios used in the Recovery Plan
GBI has limited or no exposure to residual, pension, settlement, underwriting, and securitization risks.
7.8. Capital Plan
Capital planning is an integral part of ICAAP. GBI’s capital planning is performed based on various
scenarios; one baseline scenario, which is in line with the Bank’s current expectations and financial
budget, and one or more stress scenarios. The stress scenarios apply more conservative
assumptions in order to assess the future capital adequacy of GBI under stressed economic and
financial conditions. Stress test outcomes are used to assess the adequacy of the own funds for
potential future capital requirements for the next three years.
The capital plan aims to cover as many aspects as possible, including expected profit, portfolio mix,
capital structure and asset quality, in order to reflect the impact of several risk factors on the
profitability and the capital adequacy of GBI at the same time. Changes in regulations, timelines,
transitions, etc. are taken into account within the scope of the capital planning process.

GARANTIBANK INTERNATIONAL N.V. CAPITAL ADEQUACY AND RISK MANAGEMENT REPORT 2016 30
8. ILAAP FRAMEWORK
8.1. Liquidity Risk Governance
The main objective of GBI’s liquidity risk policy is to maintain sufficient liquidity in order to ensure safe
operations and a sound financial condition under both normal and stressed market conditions and a
stable long term liquidity profile.
To meet this objective, GBI performs an Internal Liquidity Adequacy Assessment Process (ILAAP) on
an annual basis where all qualitative and quantitative aspects of liquidity risk management at the
Bank are reviewed against supervisory recommendations and market best practices. The Framework
is reviewed by the RCSB, which bears the overall responsibility at the Board level for ensuring that
effective risk management is conducted by the Bank.
The ILAAP Framework also lays out the Bank’s general funding strategy, which is determined in line
with the risk appetite. The strategy is reviewed in conjunction with the budget process as part of the
funding plan, another component of the annual ILAAP. The Supervisory Board then monitors whether
the Bank remains in line with the strategy and the plan.
At the bank level, ALCO monitors liquidity risk, implements the appropriate policies defined by the risk
appetite and ILAAP Framework, makes pricing decisions through the Internal Transfer Pricing (ITP)
process.
8.2. Liquidity Risk Monitoring
RMD performs the liquidity risk assessment, develops the required methodologies and conducts
regular stress tests to ensure the Bank operates with sufficient liquidity. Liquidity risk is monitored
through gap analyses, supplemented by multiple stress tests designed based on different scenarios.
These analyses apply shocks with different magnitudes on the liquidity position. Scenarios are set
based on bank-specific and market-wide liquidity squeezes. Behavioural analyses of the Bank’s
liabilities are used to determine some of the stress factors in both of these scenarios.
Compliance with regulatory requirements related to liquidity risk is an integral part of the liquidity risk
management of GBI. As such, the Bank ensures that it is in line with all regulations in place in its
jurisdiction, and compliance with future regulations is part of its ongoing strategy and planning. In this
context, the Bank monitors and reports the DNB Liquidity Stress Test as per the Supervisory
Regulation on Liquidity (Regeling liquiditeit Wft), as well as the liquidity ratios Liquidity Coverage Ratio
(LCR) and Net Stable Funding Ratio (NSFR), as per the CRR.
In addition to liquidity risk limits, the Bank has established several metrics as ‘Early Warning
Indicators’ (EWIs), which could potentially trigger an action by management. EWIs include monthly
deposit outflows, mismatch in the average maturities of assets and liabilities, and breaches of liquidity
risk limits.
All EWIs and liquidity analyses are reported to ALCO on a regular basis. ALCO reviews and plans the
necessary actions to manage the liquidity gaps, and bears overall responsibility for the liquidity risk
strategy. ALCO has delegated day-to-day liquidity management to the Treasury Department, which is
responsible for managing the overall liquidity risk position of the Bank, and the intraday liquidity as per
the principles of intraday liquidity management, established in the ILAAP Framework. The Treasury
Department manages all maturing cash flows along with expected changes in business related
funding requirements. The Treasury Operations Department performs the role of collateral
management and executes the settlements of all transactions.

GARANTIBANK INTERNATIONAL N.V. CAPITAL ADEQUACY AND RISK MANAGEMENT REPORT 2016 31
8.3. Funding Strategy
GBI’s funding strategy is developed, applied and adapted as necessary using the management
expertise as well as best market practices and regulatory requirements. The Bank aims for a well-
diversified mix in terms of instrument types, fund providers, geographic markets and currencies. GBI
obtains both unsecured and secured funding. The Bank’s unsecured funding comes from a balanced
mix of retail and wholesale sources.
Within wholesale funding, the Bank also balances the distribution between financial and non-financial
counterparties. The non-financial counterparties, with which the Bank has established long lasting
relationships through offering various financial services, constitute the major part of the wholesale
funding. The remaining portion of wholesale funding is spread across interbank borrowing, transaction
based borrowing, secured funding and GBI’s syndicated loan. GBI’s liabilities to banks include
unsecured borrowing facilities from various counterparties. The breakdown of funding sources is
provided below. Further information on asset encumbrance in funding can be found in Annex 3.
Figure 8.3-1
In terms of intragroup funding, GBI is not dependent on this funding source and conducts liquidity
management independently of the parent company. Group related balances are disclosed under
section 36 (Group Related Balances) of GBI’s “Annual Report 2016”.

GARANTIBANK INTERNATIONAL N.V. CAPITAL ADEQUACY AND RISK MANAGEMENT REPORT 2016 32
8.4. Liquidity Risk Profile
GBI’s short term lending strategy and stable funding provide natural mitigation for liquidity risk. The
short term lending strategy enables the quick accumulation of a liquidity buffer in stressed financial
environments, and the equally efficient build-up of short term assets once the stress is past. The
contractual maturity breakdown of assets and liabilities, disclosed under section 33.3 (Liquidity Risk)
of GBI’s “Annual Report 2016”, demonstrates that the Bank does not carry a large maturity mismatch.
70% of loans/advances to corporate and banks, matures in less than one year.
The Bank maintains a high quality liquidity buffer as short term placements to central banks as well as
investments in high quality debt securities eligible to be used in repurchase transactions with the
Central Bank or in over-the counter repurchase transactions with other counterparties. The liquidity
value of the debt securities is calculated using their market value and a conservative assumption of
the volatility haircuts applicable in repurchase transactions.
In case of a liquidity squeeze or an emergency situation, GBI has a detailed contingency funding plan,
as part of the Recovery Plan, in place to enable the Bank to perform effective crisis management.

GARANTIBANK INTERNATIONAL N.V. CAPITAL ADEQUACY AND RISK MANAGEMENT REPORT 2016 33
9. REGULATORY METRICS
The CRR/CRD IV has been in place since 1st January 2014, and will be phased in completely by
2019. Related new reporting requirements began in Q1 2014.
As per the CRR/CRD IV, the Common Equity Tier 1 (CET1) requirement of 2% has been increased to
4.5% as of 2014, and will be increased to 7% (including the 2.5% capital conservation buffer), by the
year 2019. Hence, the minimum total capital ratio requirement of 8% will also be increased to 10.5%
by that date. A countercyclical buffer between 0% and 2.5% will also be introduced on top of these
required minimums in order to achieve the broader macro-prudential goal of protecting the banking
sector from periods of excess aggregate credit growth. Finally, the definition of eligible instruments for
capital treatment is changed to increase the loss absorbance capacity.
GBI is well positioned for the full phase-in implementation of CRR, thanks to the key features of its
business model; low leverage, a high quality capital base, and sound liquidity management. The
impact of the changes in the definition of capital, as well as the minimum capital requirements, is
limited for GBI since the Bank has a high common equity component and no hybrid capital products.
The capital ratios are already comfortably above the CRR minimum and the fully phased-in capital
conservation buffer of 2.5% in the CRD IV, at 16.70% of CET 1 and 18.47 % Total Capital Ratio.
Short-term and long-term liquidity standards, such as the Liquidity Coverage Ratio (LCR) and the Net
Stable Funding Ratio (NSFR), respectively, were introduced by CRR to protect the financial industry
from potential liquidity shocks. GBI’s LCR, at 341%, is comfortably above the regulatory minimum of
100%.
Although a regulatory minimum has not yet been established in the EU for the NSFR, GBI’s level is
well above the Basel III proposal of 100%. The Bank maintains a high liquidity buffer and, given its
stable funding base, the Bank expects to continue meeting both liquidity requirements.
In addition to the changes in the minimum required solvency, a non-risk based measure, namely the
Leverage Ratio, has been established to limit excessive leverages in the financial industry. GBI’s level
of 10.66% is well above the Basel III proposal of 3%.

GARANTIBANK INTERNATIONAL N.V. CAPITAL ADEQUACY AND RISK MANAGEMENT REPORT 2016 34
10. REMUNERATION
This section provides qualitative and quantitative information on the remuneration policies and practices
followed by GBI.
10.1. Governance
GBI has implemented a meticulous, restrained and long-term remuneration policy in line with its
strategy and risk appetite. The policy focuses on ensuring a sound and effective risk management
through:
establishing a stringent governance structure for setting goals
observing both financial and non-financial criteria in performance assessment
making fixed salaries the main remuneration component.
The policy reflects GBI’s objectives for good corporate governance and meets the requirements as
laid down in DNB’s Guidelines on Controlled Remuneration Policy and the Dutch Banking Code,
except for one item which has been neutralized by applying the proportionality principle. GBI will not
meet the bonus share part of the guidelines, because employees and management of GBI are not
rewarded with shares or options in the share capital of the parent bank as this would be against the
parent bank policy.
The remuneration policy of GBI is prepared by the Human Resources Department, in close
consultation with the Managing Board and with the help of external consultants where necessary. The
Remuneration Policy is presented to the Remuneration Committee of the Supervisory Board. The
Remuneration Committee prepares the decision making process for the Supervisory Board. The
Supervisory Board approves the draft Remuneration Policy and advises the Shareholders to adopt
the Policy in the Annual General Meeting of Shareholders.
10.2. Remuneration Committee
The roles and responsibilities of the Remuneration Committee are as follows:
testing and monitoring periodically the general principles of the remuneration policy;
execution of the remuneration policy;
acting independently;
being able to manage the incentives in relation to risk, capital and liquidity;
consulting with the Managing Board and, where relevant, with Human Resources on all
matters pertaining to the terms and conditions of employment of the Identified Staff and
ensuring that the compensation of the Identified Staff and the policy on which it is based is
fair, adequate and fully transparent.
The Remuneration Committee meets at least two times a year and consists of two members of the
Supervisory Board one of which is an independent member. The Remuneration Committee makes a
proposal for the remuneration of the individual members of the Managing Board and the Senior
Management, for approval by the Supervisory Board. The Supervisory Board advises the
Shareholders to adopt the proposed remuneration of the Managing Board in the Annual General
Meeting of Shareholders.

GARANTIBANK INTERNATIONAL N.V. CAPITAL ADEQUACY AND RISK MANAGEMENT REPORT 2016 35
The remuneration of the other members of the Identified Staff are reviewed once a year by the
Managing Board in consultation with the Human Resources Department on the basis of the Bank’s
development and performance, the individual development and performance and changes in the
consumer price index (cpi). The Managing Board shall advise the Remuneration Committee on the
yearly review of the salaries of the other members of the Identified Staff. The remuneration of the non-
identified staff members is also reviewed once a year by the Senior Management in consultation with
the Human Resources Department. The outcome thereof is presented for approval to the Managing
Board.
10.3. Information on link between Pay and Performance
The Remuneration Policy is designed to ensure that cost effective packages that attract and retain the
highest calibre employees and motivate them to perform to the highest standards are provided. The
objective is to align individual rewards with the Bank's performance in a sustainable way and in
relation to the budget, the parent bank’s performance, the Bank’s core values. Compliance with
internal and external rules and regulations and individual performance both financial and non-financial
with non-financial component accounting for at least 50% of the valuation, are also taken into
account.
Depending on the assessment of the above-mentioned criteria, the Remuneration Committee may
propose to distribute variable compensation to individual members of the Identified Staff. For the non-
identified staff, Managing Board may decide within the set limits. If the Bank does not make any profit
in the related calendar year, no variable compensation will be paid, regardless of the outcome of the
assessment of the above-mentioned criteria.
The fixed remuneration is established taking into account the level of responsibility, the role and
position of the individual employee and the local market conditions (collective labour agreement). As
of performance year 2016 variable remuneration shall not exceed 20% of the fixed component of the
remuneration package.
10.4. Quantitative Information on Remuneration
Total breakdown of the remuneration by business areas provided by GBI over performance year 2015
is provided in the table below.
Table 10.4-1
Total remuneration over performance year 2016
(EUR 1,000)
Management Body 2,843
Commercial Units 5,883
Non Commercial Units 15,129
Total 23,857
The professional activities of staff, individually or collectively, can exert influence on a firm’s risk
profile. Accordingly, GBI analyses its job descriptions and responsibilities in relation to their possible
impact on the Bank’s risk profile. The Bank assesses the degree of seniority of individual members of
staff, the size of the obligations into which a staff member may enter and as an overall criterion, the
size of the bank is taken into account, as well as its internal organization and the nature, scope and
complexity of the Bank’s business.
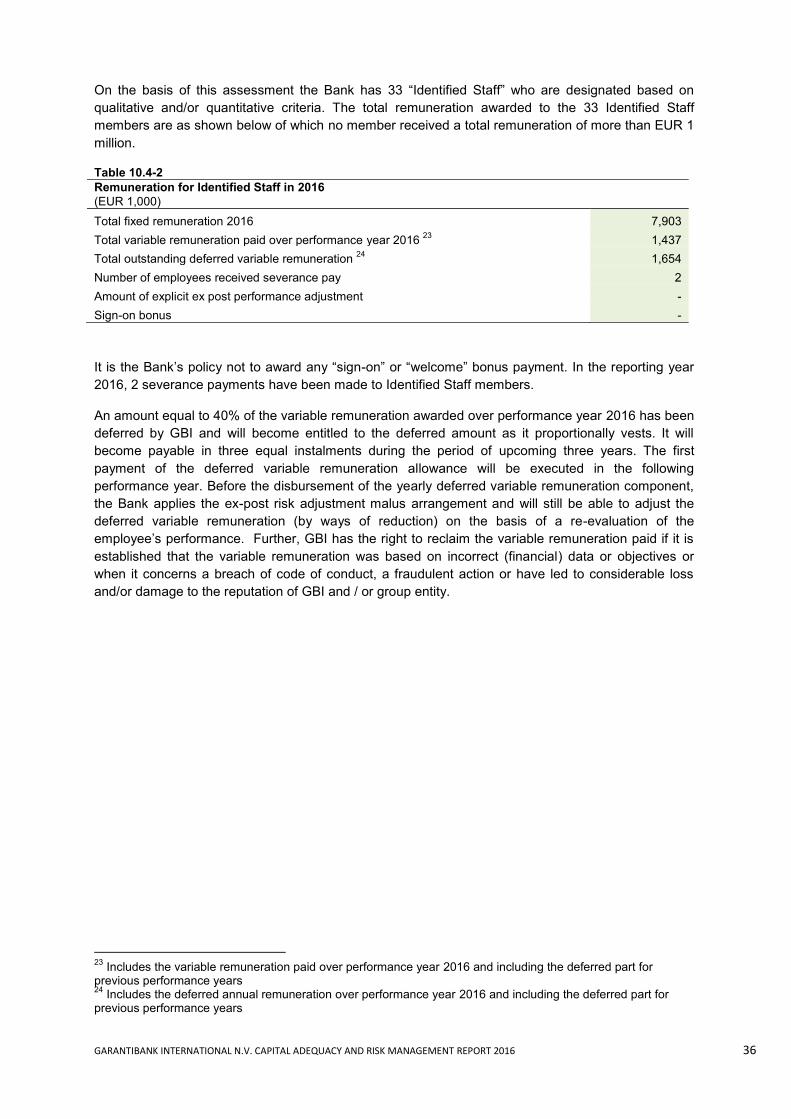
GARANTIBANK INTERNATIONAL N.V. CAPITAL ADEQUACY AND RISK MANAGEMENT REPORT 2016 36
On the basis of this assessment the Bank has 33 “Identified Staff” who are designated based on
qualitative and/or quantitative criteria. The total remuneration awarded to the 33 Identified Staff
members are as shown below of which no member received a total remuneration of more than EUR 1
million.
Table 10.4-2
Remuneration for Identified Staff in 2016
(EUR 1,000)
Total fixed remuneration 2016 7,903
Total variable remuneration paid over performance year 2016 23
1,437
Total outstanding deferred variable remuneration 24
1,654
Number of employees received severance pay 2
Amount of explicit ex post performance adjustment -
Sign-on bonus -
It is the Bank’s policy not to award any “sign-on” or “welcome” bonus payment. In the reporting year
2016, 2 severance payments have been made to Identified Staff members.
An amount equal to 40% of the variable remuneration awarded over performance year 2016 has been
deferred by GBI and will become entitled to the deferred amount as it proportionally vests. It will
become payable in three equal instalments during the period of upcoming three years. The first
payment of the deferred variable remuneration allowance will be executed in the following
performance year. Before the disbursement of the yearly deferred variable remuneration component,
the Bank applies the ex-post risk adjustment malus arrangement and will still be able to adjust the
deferred variable remuneration (by ways of reduction) on the basis of a re-evaluation of the
employee’s performance. Further, GBI has the right to reclaim the variable remuneration paid if it is
established that the variable remuneration was based on incorrect (financial) data or objectives or
when it concerns a breach of code of conduct, a fraudulent action or have led to considerable loss
and/or damage to the reputation of GBI and / or group entity.
23
Includes the variable remuneration paid over performance year 2016 and including the deferred part for previous performance years 24
Includes the deferred annual remuneration over performance year 2016 and including the deferred part for previous performance years
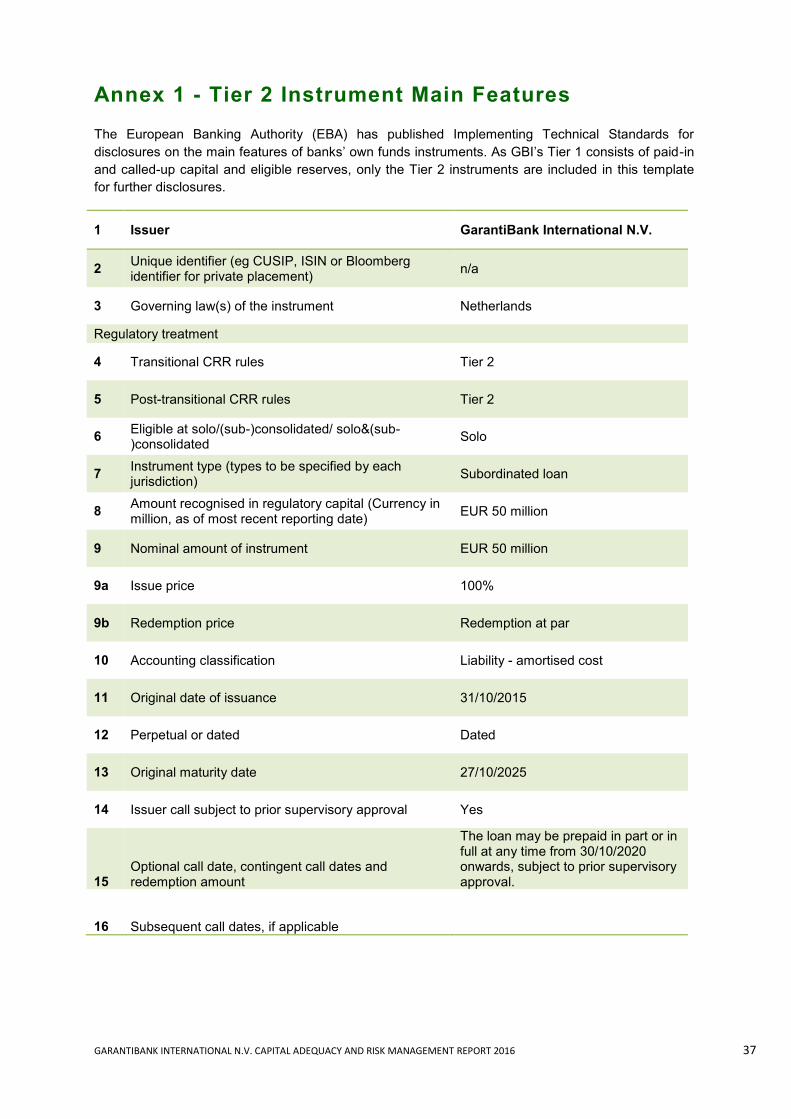
GARANTIBANK INTERNATIONAL N.V. CAPITAL ADEQUACY AND RISK MANAGEMENT REPORT 2016 37
Annex 1 - Tier 2 Instrument Main Features
The European Banking Authority (EBA) has published Implementing Technical Standards for
disclosures on the main features of banks’ own funds instruments. As GBI’s Tier 1 consists of paid-in
and called-up capital and eligible reserves, only the Tier 2 instruments are included in this template
for further disclosures.
1 Issuer GarantiBank International N.V.
2 Unique identifier (eg CUSIP, ISIN or Bloomberg identifier for private placement)
n/a
3 Governing law(s) of the instrument Netherlands
Regulatory treatment
4 Transitional CRR rules Tier 2
5 Post-transitional CRR rules Tier 2
6 Eligible at solo/(sub-)consolidated/ solo&(sub-)consolidated
Solo
7 Instrument type (types to be specified by each jurisdiction)
Subordinated loan
8 Amount recognised in regulatory capital (Currency in million, as of most recent reporting date)
EUR 50 million
9 Nominal amount of instrument EUR 50 million
9a Issue price 100%
9b Redemption price Redemption at par
10 Accounting classification Liability - amortised cost
11 Original date of issuance 31/10/2015
12 Perpetual or dated Dated
13 Original maturity date 27/10/2025
14 Issuer call subject to prior supervisory approval Yes
15 Optional call date, contingent call dates and redemption amount
The loan may be prepaid in part or in full at any time from 30/10/2020 onwards, subject to prior supervisory approval.
16 Subsequent call dates, if applicable

GARANTIBANK INTERNATIONAL N.V. CAPITAL ADEQUACY AND RISK MANAGEMENT REPORT 2016 38
Coupons / dividends
17 Fixed or floating dividend/coupon Fixed
18 Coupon rate and any related index 4.33% p.a.
19 Existence of a dividend stopper n/a
20a Fully discretionary, partially discretionary or mandatory (in terms of timing)
Mandatory
20b Fully discretionary, partially discretionary or mandatory (in terms of amount)
Mandatory
21 Existence of step up or other incentive to redeem No
22 Noncumulative or cumulative n/a
23 Convertible or non-convertible Non-convertible
24 If convertible, conversion trigger(s) n/a
25 If convertible, fully or partially n/a
26 If convertible, conversion rate n/a
27 If convertible, mandatory or optional conversion n/a
28 If convertible, specify instrument type convertible into n/a
29 If convertible, specify issuer of instrument it converts into
n/a
30 Write-down features No
31 If write-down, write-down trigger(s) n/a
32 If write-down, full or partial n/a
33 If write-down, permanent or temporary n/a
34 If temporary write-down, description of write-up mechanism
n/a
35 Position in subordination hierarchy in liquidation (specify instrument type immediately senior to instrument)
Junior to senior unsecured
36 Non-compliant transitioned features No
37 If yes, specify non-compliant features n/a
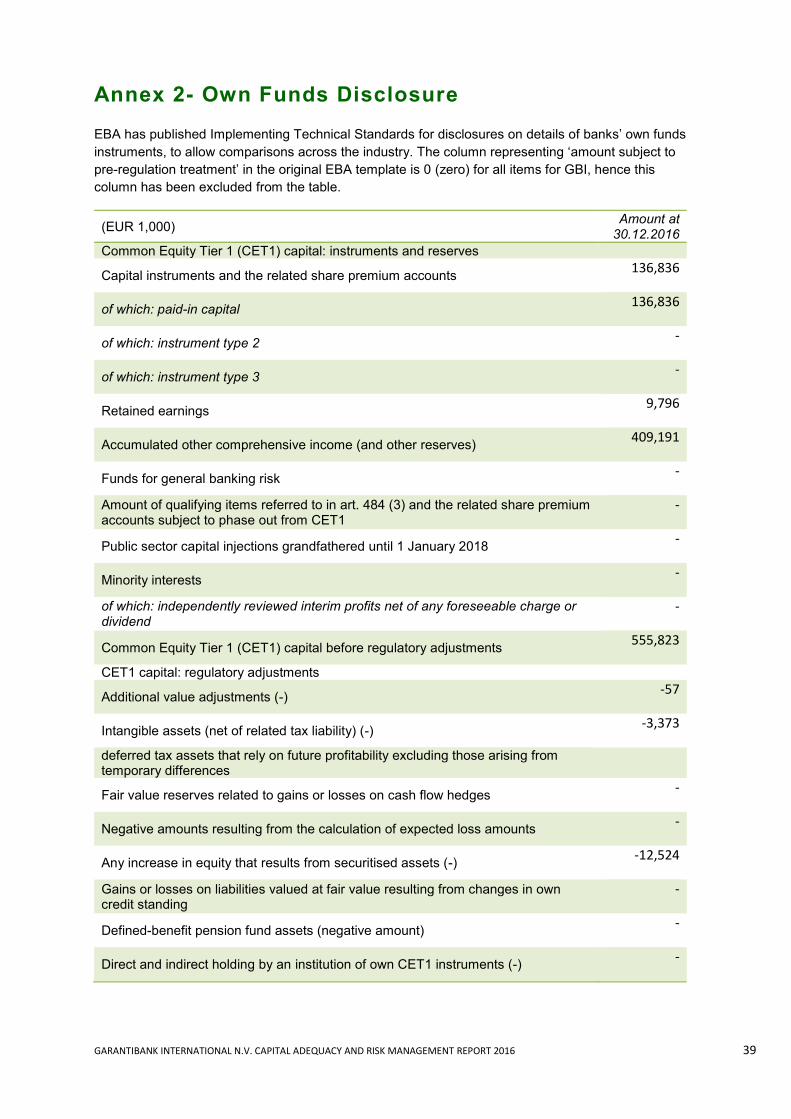
GARANTIBANK INTERNATIONAL N.V. CAPITAL ADEQUACY AND RISK MANAGEMENT REPORT 2016 39
Annex 2- Own Funds Disclosure
EBA has published Implementing Technical Standards for disclosures on details of banks’ own funds
instruments, to allow comparisons across the industry. The column representing ‘amount subject to
pre-regulation treatment’ in the original EBA template is 0 (zero) for all items for GBI, hence this
column has been excluded from the table.
(EUR 1,000) Amount at
30.12.2016
Common Equity Tier 1 (CET1) capital: instruments and reserves
Capital instruments and the related share premium accounts 136,836
of which: paid-in capital 136,836
of which: instrument type 2 -
of which: instrument type 3 -
Retained earnings 9,796
Accumulated other comprehensive income (and other reserves) 409,191
Funds for general banking risk -
Amount of qualifying items referred to in art. 484 (3) and the related share premium accounts subject to phase out from CET1
-
Public sector capital injections grandfathered until 1 January 2018 -
Minority interests -
of which: independently reviewed interim profits net of any foreseeable charge or dividend
-
Common Equity Tier 1 (CET1) capital before regulatory adjustments 555,823
CET1 capital: regulatory adjustments
Additional value adjustments (-) -57
Intangible assets (net of related tax liability) (-) -3,373
deferred tax assets that rely on future profitability excluding those arising from temporary differences
Fair value reserves related to gains or losses on cash flow hedges -
Negative amounts resulting from the calculation of expected loss amounts -
Any increase in equity that results from securitised assets (-) -12,524
Gains or losses on liabilities valued at fair value resulting from changes in own credit standing
-
Defined-benefit pension fund assets (negative amount) -
Direct and indirect holding by an institution of own CET1 instruments (-) -
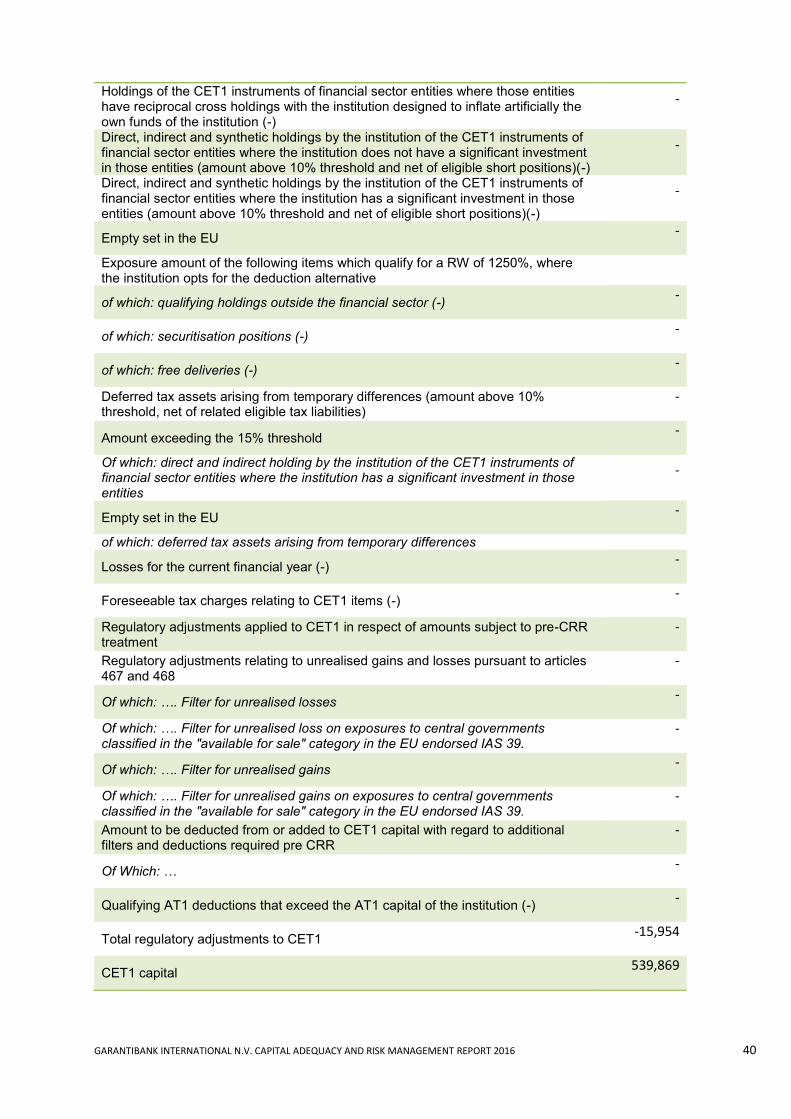
GARANTIBANK INTERNATIONAL N.V. CAPITAL ADEQUACY AND RISK MANAGEMENT REPORT 2016 40
Holdings of the CET1 instruments of financial sector entities where those entities have reciprocal cross holdings with the institution designed to inflate artificially the own funds of the institution (-)
-
Direct, indirect and synthetic holdings by the institution of the CET1 instruments of financial sector entities where the institution does not have a significant investment in those entities (amount above 10% threshold and net of eligible short positions)(-)
-
Direct, indirect and synthetic holdings by the institution of the CET1 instruments of financial sector entities where the institution has a significant investment in those entities (amount above 10% threshold and net of eligible short positions)(-)
-
Empty set in the EU -
Exposure amount of the following items which qualify for a RW of 1250%, where the institution opts for the deduction alternative
of which: qualifying holdings outside the financial sector (-) -
of which: securitisation positions (-) -
of which: free deliveries (-) -
Deferred tax assets arising from temporary differences (amount above 10% threshold, net of related eligible tax liabilities)
-
Amount exceeding the 15% threshold -
Of which: direct and indirect holding by the institution of the CET1 instruments of financial sector entities where the institution has a significant investment in those entities
-
Empty set in the EU -
of which: deferred tax assets arising from temporary differences
Losses for the current financial year (-) -
Foreseeable tax charges relating to CET1 items (-) -
Regulatory adjustments applied to CET1 in respect of amounts subject to pre-CRR treatment
-
Regulatory adjustments relating to unrealised gains and losses pursuant to articles 467 and 468
-
Of which: …. Filter for unrealised losses -
Of which: …. Filter for unrealised loss on exposures to central governments classified in the "available for sale" category in the EU endorsed IAS 39.
-
Of which: …. Filter for unrealised gains -
Of which: …. Filter for unrealised gains on exposures to central governments classified in the "available for sale" category in the EU endorsed IAS 39.
-
Amount to be deducted from or added to CET1 capital with regard to additional filters and deductions required pre CRR
-
Of Which: … -
Qualifying AT1 deductions that exceed the AT1 capital of the institution (-) -
Total regulatory adjustments to CET1 -15,954
CET1 capital 539,869

GARANTIBANK INTERNATIONAL N.V. CAPITAL ADEQUACY AND RISK MANAGEMENT REPORT 2016 41
Additional Tier 1 (AT1) capital: instruments -
Capital instruments and the related share premium accounts
of which: classified as equity -
of which: classified as liabilities -
Amount of qualifying items referred to in art. 484 (3) and the related share premium accounts subject to phase out from AT1
-
Public sector capital injections grandfathered until 1 January 2018 -
Qualifying Tier 1 capital included in consolidated AT1 capital issued by subsidiaries and held by third parties
-
of which: instruments issued by subsidiaries subject to phase out -
AT 1 capital before regulatory adjustments -
AT1 capital: regulatory adjustments -
Direct and indirect holding by an institution of own AT1 instruments (-) Holdings of the AT1 instruments of financial sector entities where those entities
have reciprocal cross holdings with the institution designed to inflate artificially the own funds of the institution (-)
-
Direct, indirect and synthetic holdings by the institution of the AT1 instruments of financial sector entities where the institution does not have a significant investment in those entities (amount above 10% threshold and net of eligible short positions)(-)
-
Direct, indirect and synthetic holdings by the institution of the AT1 instruments of financial sector entities where the institution has a significant investment in those entities (amount above 10% threshold and net of eligible short positions)(-)
-
Regulatory adjustments applied to AT1 in respect of amounts subject to pre-CRR treatment and transitional treatments subject to phase out as prescribed in Reg. (EU) No 575/2013
-
Residual amounts deducted from AT1 capital with regard to deduction from CET1 capital during the transitional period pursuant to art. 472 of Reg. (EU) No 575/2013
-
Of which: intangibles -
Of which: shortfall of provisions to expected losses -
Residual amounts deducted from AT1 capital with regard to deduction from T2 capital during the transitional period pursuant to art. 475 of Reg. (EU) No 575/2013
-
Of which items to be detailed line by line, e.g. reciprocal cross holding in T2 instruments, direct holding of non-significant investments in the capital of other financial sector entities, etc.
-
Amount to be deducted from or added to AT1 capital with regard to additional filters and deductions required pre CRR
-
Of which: … possible filter for unrealised losses -
Of which: … possible filter for unrealised gains -
Of which: … -
Qualifying T2 deductions that exceed the T2 capital of the institution (-)
Total regulatory adjustments to AT1 capital -
AT1 capital -

GARANTIBANK INTERNATIONAL N.V. CAPITAL ADEQUACY AND RISK MANAGEMENT REPORT 2016 42
Tier 1 capital (T1= CET1 + AT1) 539,869
Tier 2 (T2) capital: instruments and provisions -
Capital instruments and the related share premium accounts 50,000
Amount of qualifying items referred to in art. 484 (3) and the related share premium accounts subject to phase out from T2
-
Public sector capital injections grandfathered until 1 January 2018 -
Qualifying own funds instruments included in consolidated T2 capital issued by subsidiaries and held by third parties (excluding row 5 and 34)
-
of which: instruments issued by subsidiaries subject to phase out -
Credit risk adjustments 10,390
T2 capital before regulatory adjustments 60,390
T2 capital: regulatory adjustments -
Direct and indirect holding by an institution of own T2 instruments and subordinated loans (-) Holdings of the T2 instruments and subordinated loans of financial sector entities where those entities have reciprocal cross holdings with the institution designed to inflate artificially the own funds of the institution (-)
-
Direct and indirect holdings of the T2 instruments and subordinated loans of financial sector entities where the institution does not have a significant investment in those entities (amount above 10% threshold and net of eligible short positions)(-)
-
Of which new holdings not subject to transitional arrangements -
Of which holdings existing before 1 January 2013 and subject to transitional arrangements
-
Direct and indirect holdings of the T2 instruments and subordinated loans of financial sector entities where the institution has a significant investment in those entities (amount above 10% threshold and net of eligible short positions)(-)
-
Regulatory adjustments applied to T2 in respect of amounts subject to pre-CRR treatment and transitional treatments subject to phase out as prescribed in Reg. (EU) No 575/2013
-
Residual amounts deducted from T2 capital with regard to deduction from CET1 capital during the transitional period pursuant to art. 472 of Reg. (EU) No 575/2013
-
Of which: shortfall of provisions to expected losses -3,131
Residual amounts deducted from T2 capital with regard to deduction from AT1 capital during the transitional period pursuant to art. 475 of Reg. (EU) No 575/2013
-3,131
Of which items to be detailed line by line, e.g. reciprocal cross holding in T2 instruments, direct holding of non-significant investments in the capital of other financial sector entities, etc.
-
Amount to be deducted from or added to T2 capital with regard to additional filters and deductions required pre CRR
-
Of which: … possible filter for unrealised losses -
Of which: … possible filter for unrealised gains -
Of which: … -

GARANTIBANK INTERNATIONAL N.V. CAPITAL ADEQUACY AND RISK MANAGEMENT REPORT 2016 43
Total regulatory adjustments to T2 capital -3,131
Tier 2 capital 57,259
Total capital (TC = T1 + T2) 597,129
RWA in respect of amounts subject to pre-CRR treatment and transitional treatments subject to phase out as prescribed in Reg. (EU) No 575/2013
Of which: … items not deducted from CET1
Of which: … items not deducted from AT1 items
Of which: … items not deducted from T2 items
Total risk weighted assets 3,233,326
Capital ratios and buffers -
CET1 (as a % of total risk exposure amount) 16.70%
T1 (as a % of total risk exposure amount) 16.70%
TC (as a % of total risk exposure amount) 18.47%
Institution specific buffer requirement -
of which: capital conservation buffer requirement -
of which: countercyclical buffer requirement -
of which: systemic buffer requirement -
of which: G-SII or O-SII buffer -
CET1 available to meet buffers (as a % of risk exposure amount) -
Amounts below the thresholds for deduction 11.48%
Direct and indirect holdings of the capital of financial sector entities where the institution does not have a significant investment in those entities (amount below 10% threshold and net of eligible short positions)
Direct and indirect holdings of the CET1 instruments of financial sector entities where the institution has a significant investment in those entities (amount below 10% threshold and net of eligible short positions)
deferred tax assets arising from temporary differences (amount below 10% threshold, net of related tax liability where the conditions in Article 38 (3) are met) Applicable caps on the inclusion of provisions in Tier 2
Credit risk adjustments included in T2 in respect of exposures subject to standardised approach
31,802
Cap on inclusion of credit risk adjustments in T2 under standardised approach -
Credit risk adjustments included in T2 in respect of exposures subject to internal ratings-based approach Cap for inclusion of credit risk adjustments in T2 under internal ratings-based approach
-
Capital instruments subject to phase-out arrangements (1 Jan 2014 - 1 Jan 2022)

GARANTIBANK INTERNATIONAL N.V. CAPITAL ADEQUACY AND RISK MANAGEMENT REPORT 2016 44
Current cap on CET1 instruments subject to phase out arrangements -
Amount excluded from CET1 due to cap 1,139
Current cap on AT1 instruments subject to phase out arrangements 10,390
Amount excluded from AT1 due to cap 17,793
Current cap on T2 instruments subject to phase out arrangements
Amount excluded from T2 due to cap -
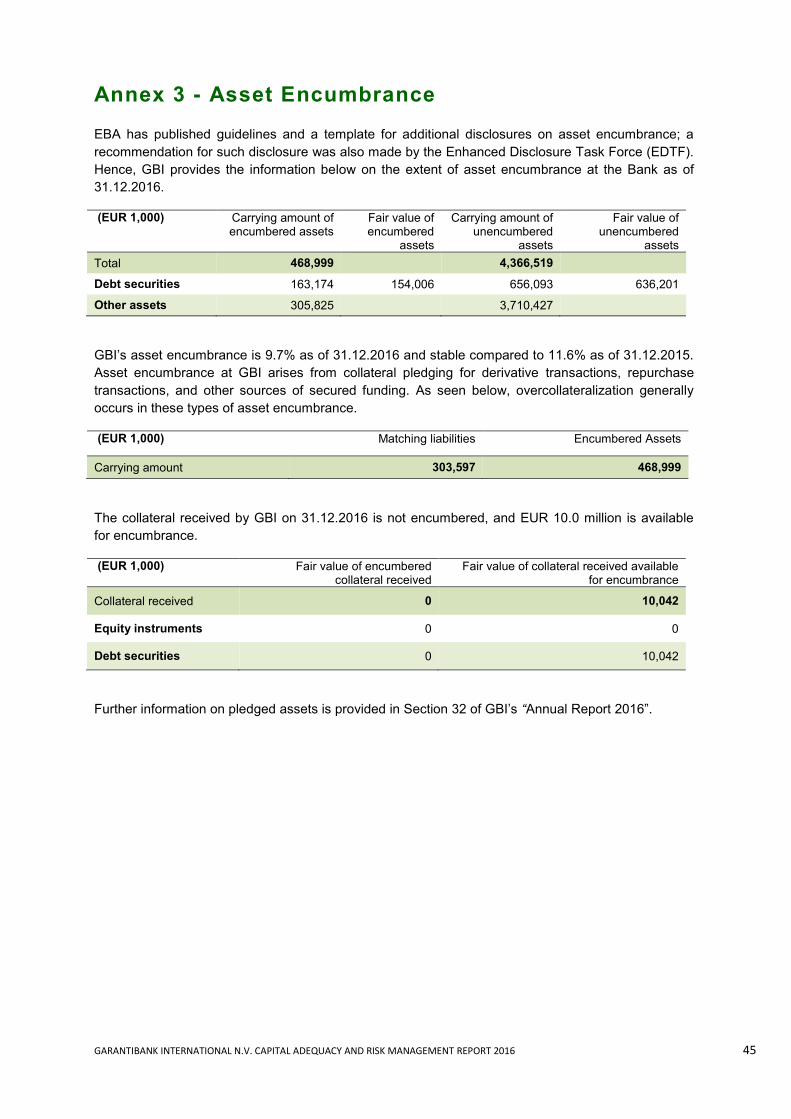
GARANTIBANK INTERNATIONAL N.V. CAPITAL ADEQUACY AND RISK MANAGEMENT REPORT 2016 45
Annex 3 - Asset Encumbrance
EBA has published guidelines and a template for additional disclosures on asset encumbrance; a
recommendation for such disclosure was also made by the Enhanced Disclosure Task Force (EDTF).
Hence, GBI provides the information below on the extent of asset encumbrance at the Bank as of
31.12.2016.
(EUR 1,000) Carrying amount of encumbered assets
Fair value of encumbered
assets
Carrying amount of unencumbered
assets
Fair value of unencumbered
assets
Total 468,999 4,366,519
Debt securities 163,174 154,006 656,093 636,201
Other assets 305,825 3,710,427
GBI’s asset encumbrance is 9.7% as of 31.12.2016 and stable compared to 11.6% as of 31.12.2015.
Asset encumbrance at GBI arises from collateral pledging for derivative transactions, repurchase
transactions, and other sources of secured funding. As seen below, overcollateralization generally
occurs in these types of asset encumbrance.
(EUR 1,000) Matching liabilities Encumbered Assets
Carrying amount 303,597 468,999
The collateral received by GBI on 31.12.2016 is not encumbered, and EUR 10.0 million is available
for encumbrance.
(EUR 1,000) Fair value of encumbered collateral received
Fair value of collateral received available for encumbrance
Collateral received 0 10,042
Equity instruments 0 0
Debt securities 0 10,042
Further information on pledged assets is provided in Section 32 of GBI’s “Annual Report 2016”.
