capillary zone electrophoresis separation of azaarenes with sensitive uv absorption photometric...
TRANSCRIPT

Fuel 129 (2014) 20–26
Contents lists available at ScienceDirect
Fuel
journal homepage: www.elsevier .com/locate / fuel
Capillary zone electrophoresis separation of azaarenes with sensitive UVabsorption photometric detection after cationic solid phase extractionand field amplified sample stacking
http://dx.doi.org/10.1016/j.fuel.2014.03.0120016-2361/� 2014 Elsevier Ltd. All rights reserved.
⇑ Corresponding author. Address: Dept. of Chemistry, Pontifícia UniversidadeCatólica do Rio de Janeiro, Rua Marquês de São Vicente, 225, Gávea, Rio de Janeiro,RJ, Brazil. Tel.: +55 21 3527 1319; fax: +55 21 3527 1637.
E-mail address: [email protected] (R.Q. Aucelio).
Elaine Rocha da Luz a,b, Cabrini Ferraz de Souza b, Anastácia Sá b, Alessandra Licursi M.C. da Cunha b,Caroline F.J. Franco c, Selma Cunha Mello d, Ricardo Queiroz Aucelio b,⇑a Federal Institute of Education Science and Technology (IFRJ) of Rio de Janeiro, RJ, Brazilb Chemistry Department, Pontifícia Universidade Católica do Rio de Janeiro (PUC-Rio), RJ, Brazilc Chemistry Institute, Universidade Federal Fluminense (UFF), RJ, Brazild Leopoldo Américo Miguez de Mello Research Center – Petrobras (CENPES), Cidade Universitária, Quadra 7, Ilha do Fundão, RJ 21949-900, Brazil
h i g h l i g h t s
� CZE was used for the selectivedetermination of five basic azaarenesin diesel.� Field-amplified sample stacking was
used to online preconcentrateanalytes.� The method was simple requiring a
sample solid phase extraction.� Effective detectable concentration of
azaarenes in diesel was in the mg L�1
level.
g r a p h i c a l a b s t r a c t
a r t i c l e i n f o
Article history:Received 9 December 2013Received in revised form 5 March 2014Accepted 8 March 2014Available online 20 March 2014
Keywords:AzaarenesDieselCapillary zone electrophoresisField-amplified sample stacking
a b s t r a c t
Capillary zone electrophoresis (CZE) was used to enable selective and sensitive determination of fivebasic azaarenes (7,8-benzoquinoline, 7,9-dimethylbenz[c]acridine, 9-methylacridine, acridine, anddibenz[a,j]acridine) in diesel fuel using 9-amino-1,2,3,4-tetrahydroacridine as internal standard. Solidphase extraction was performed in a single step allowing sample clean-up. Field-amplified sample stack-ing was achieved using a more conductive background electrolyte (50 mmol L�1 phosphate bufferadjusted to pH 2.65 with 25% of acetonitrile) and a less conductive sample solution prepared in1 mmol L�1 phosphoric acid with 20% acetonitrile. Instrumental conditions were: 25 kV at 15 �C andhydrodynamic injection (50 mbar) for 100 s. The LOD values in diesel (based on the signal-to-noise ratio3:1) were in the mg L�1 level. The method was able to detect some of the azaarenes in real samples.
� 2014 Elsevier Ltd. All rights reserved.
1. Introduction
Nitrogen compounds are frequently present in fossil fuelsgenerally associated with the organic portion of crude material.Nitrogen levels may reach up to 15 lg g�1 in untreated fuels, mostpart consisting on basic nitrogen compounds, which were reported
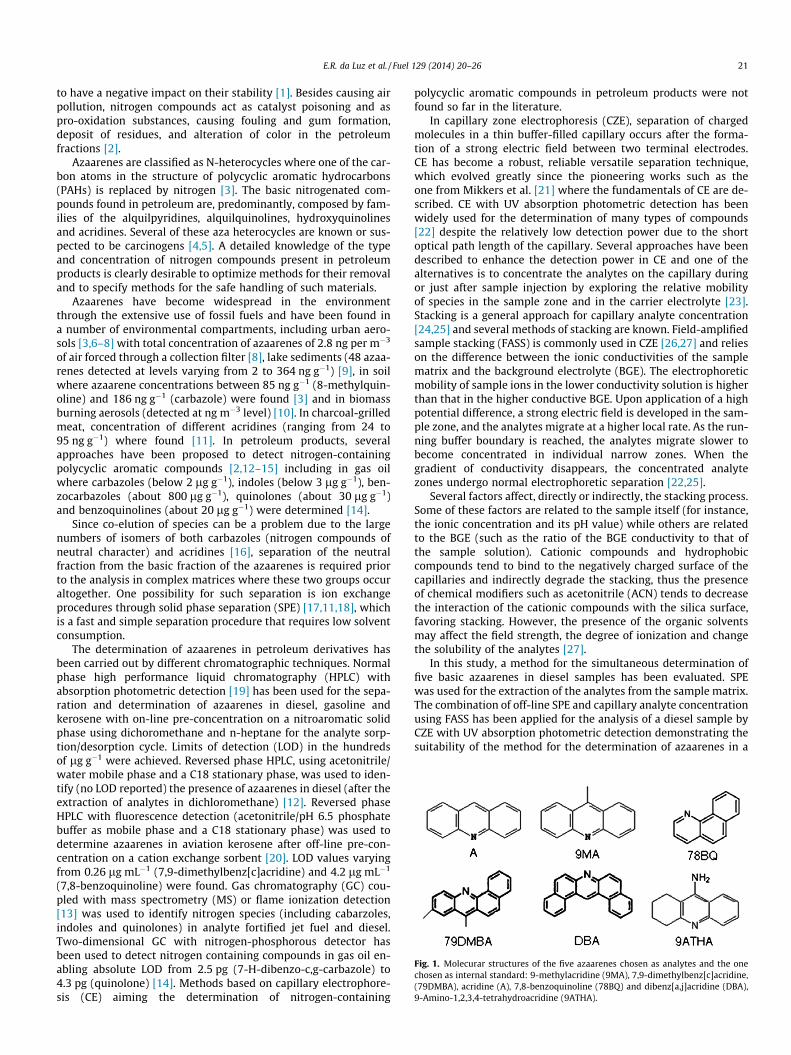
Fig. 1. Molecurar structures of the five azaarenes chosen as analytes and the onechosen as internal standard: 9-methylacridine (9MA), 7,9-dimethylbenz[c]acridine,(79DMBA), acridine (A), 7,8-benzoquinoline (78BQ) and dibenz[a,j]acridine (DBA),9-Amino-1,2,3,4-tetrahydroacridine (9ATHA).
E.R. da Luz et al. / Fuel 129 (2014) 20–26 21
to have a negative impact on their stability [1]. Besides causing airpollution, nitrogen compounds act as catalyst poisoning and aspro-oxidation substances, causing fouling and gum formation,deposit of residues, and alteration of color in the petroleumfractions [2].
Azaarenes are classified as N-heterocycles where one of the car-bon atoms in the structure of polycyclic aromatic hydrocarbons(PAHs) is replaced by nitrogen [3]. The basic nitrogenated com-pounds found in petroleum are, predominantly, composed by fam-ilies of the alquilpyridines, alquilquinolines, hydroxyquinolinesand acridines. Several of these aza heterocycles are known or sus-pected to be carcinogens [4,5]. A detailed knowledge of the typeand concentration of nitrogen compounds present in petroleumproducts is clearly desirable to optimize methods for their removaland to specify methods for the safe handling of such materials.
Azaarenes have become widespread in the environmentthrough the extensive use of fossil fuels and have been found ina number of environmental compartments, including urban aero-sols [3,6–8] with total concentration of azaarenes of 2.8 ng per m�3
of air forced through a collection filter [8], lake sediments (48 azaa-renes detected at levels varying from 2 to 364 ng g�1) [9], in soilwhere azaarene concentrations between 85 ng g�1 (8-methylquin-oline) and 186 ng g�1 (carbazole) were found [3] and in biomassburning aerosols (detected at ng m�3 level) [10]. In charcoal-grilledmeat, concentration of different acridines (ranging from 24 to95 ng g�1) where found [11]. In petroleum products, severalapproaches have been proposed to detect nitrogen-containingpolycyclic aromatic compounds [2,12–15] including in gas oilwhere carbazoles (below 2 lg g�1), indoles (below 3 lg g�1), ben-zocarbazoles (about 800 lg g�1), quinolones (about 30 lg g�1)and benzoquinolines (about 20 lg g�1) were determined [14].
Since co-elution of species can be a problem due to the largenumbers of isomers of both carbazoles (nitrogen compounds ofneutral character) and acridines [16], separation of the neutralfraction from the basic fraction of the azaarenes is required priorto the analysis in complex matrices where these two groups occuraltogether. One possibility for such separation is ion exchangeprocedures through solid phase separation (SPE) [17,11,18], whichis a fast and simple separation procedure that requires low solventconsumption.
The determination of azaarenes in petroleum derivatives hasbeen carried out by different chromatographic techniques. Normalphase high performance liquid chromatography (HPLC) withabsorption photometric detection [19] has been used for the sepa-ration and determination of azaarenes in diesel, gasoline andkerosene with on-line pre-concentration on a nitroaromatic solidphase using dichoromethane and n-heptane for the analyte sorp-tion/desorption cycle. Limits of detection (LOD) in the hundredsof lg g�1 were achieved. Reversed phase HPLC, using acetonitrile/water mobile phase and a C18 stationary phase, was used to iden-tify (no LOD reported) the presence of azaarenes in diesel (after theextraction of analytes in dichloromethane) [12]. Reversed phaseHPLC with fluorescence detection (acetonitrile/pH 6.5 phosphatebuffer as mobile phase and a C18 stationary phase) was used todetermine azaarenes in aviation kerosene after off-line pre-con-centration on a cation exchange sorbent [20]. LOD values varyingfrom 0.26 lg mL�1 (7,9-dimethylbenz[c]acridine) and 4.2 lg mL�1
(7,8-benzoquinoline) were found. Gas chromatography (GC) cou-pled with mass spectrometry (MS) or flame ionization detection[13] was used to identify nitrogen species (including cabarzoles,indoles and quinolones) in analyte fortified jet fuel and diesel.Two-dimensional GC with nitrogen-phosphorous detector hasbeen used to detect nitrogen containing compounds in gas oil en-abling absolute LOD from 2.5 pg (7-H-dibenzo-c,g-carbazole) to4.3 pg (quinolone) [14]. Methods based on capillary electrophore-sis (CE) aiming the determination of nitrogen-containing
polycyclic aromatic compounds in petroleum products were notfound so far in the literature.
In capillary zone electrophoresis (CZE), separation of chargedmolecules in a thin buffer-filled capillary occurs after the forma-tion of a strong electric field between two terminal electrodes.CE has become a robust, reliable versatile separation technique,which evolved greatly since the pioneering works such as theone from Mikkers et al. [21] where the fundamentals of CE are de-scribed. CE with UV absorption photometric detection has beenwidely used for the determination of many types of compounds[22] despite the relatively low detection power due to the shortoptical path length of the capillary. Several approaches have beendescribed to enhance the detection power in CE and one of thealternatives is to concentrate the analytes on the capillary duringor just after sample injection by exploring the relative mobilityof species in the sample zone and in the carrier electrolyte [23].Stacking is a general approach for capillary analyte concentration[24,25] and several methods of stacking are known. Field-amplifiedsample stacking (FASS) is commonly used in CZE [26,27] and relieson the difference between the ionic conductivities of the samplematrix and the background electrolyte (BGE). The electrophoreticmobility of sample ions in the lower conductivity solution is higherthan that in the higher conductive BGE. Upon application of a highpotential difference, a strong electric field is developed in the sam-ple zone, and the analytes migrate at a higher local rate. As the run-ning buffer boundary is reached, the analytes migrate slower tobecome concentrated in individual narrow zones. When thegradient of conductivity disappears, the concentrated analytezones undergo normal electrophoretic separation [22,25].
Several factors affect, directly or indirectly, the stacking process.Some of these factors are related to the sample itself (for instance,the ionic concentration and its pH value) while others are relatedto the BGE (such as the ratio of the BGE conductivity to that ofthe sample solution). Cationic compounds and hydrophobiccompounds tend to bind to the negatively charged surface of thecapillaries and indirectly degrade the stacking, thus the presenceof chemical modifiers such as acetonitrile (ACN) tends to decreasethe interaction of the cationic compounds with the silica surface,favoring stacking. However, the presence of the organic solventsmay affect the field strength, the degree of ionization and changethe solubility of the analytes [27].
In this study, a method for the simultaneous determination offive basic azaarenes in diesel samples has been evaluated. SPEwas used for the extraction of the analytes from the sample matrix.The combination of off-line SPE and capillary analyte concentrationusing FASS has been applied for the analysis of a diesel sample byCZE with UV absorption photometric detection demonstrating thesuitability of the method for the determination of azaarenes in a
22 E.R. da Luz et al. / Fuel 129 (2014) 20–26
real sample. The chosen analytes were 9-methylacridine (9MA),7,9-dimethylbenz[c]acridine, (79DMBA), acridine (A), 7,8-Benzo-quinoline (78BQ) and dibenz[a,j]acridine (DBA) as seen in Fig. 1.The azaareene 9-amino-1,2,3,4-tetrahydroacridine (9ATHA), whichis present a primary amine group (polar group) and thus not ex-pected to be in diesel fraction, was chosen as internal standard.
2. Experimental
2.1. Apparatuses
CZE was performed on a HP 3DCE capillary electrophoresis sys-tem (Agilent, California, USA) operating in a normal polarity modewith an UV–vis diode array type absorption photometric detector.A fused silica capillary (Microsolv Technology Corp., USA) of73.5 cm of length (65.0 cm of effective length) with 50 lm ofinternal diameter was used. In order to improve detection duringanalysis, a special capillary from Agilent (with the internaldiameter of 150 lm in the detection zone) was used.
Chromatographic analyses were carried out in a Waters 1525Series HPLC system (Waters, Milford, Massachusetts, USA)equipped with a Waters Multi Wavelength Fluorescence Detector2475 and a 5 lL loop injector. The analytical system included anEclipse XDB C-18 Agilent column (250 mm � 4.6 mm with5.0 lm average particle size). The separations were performed at35 �C (thermostat HPLC column heater from Waters) with a flowrate of 1 mL min�1. A pH meter (MS Tecnopon, model MPA-210,São Paulo, Brazil) with a glass membrane electrode conjugatedwith an Ag/AgCl reference electrode was employed for pHmeasurements. Conductivities of the solutions were measuredusing conduction meter model mCA 150 with a platinum electrode(Tecnopon). Agilent Vac Elut Manifold (California, USA).
2.2. Materials
All chemical reagents were of analytical grade. Ultrapure water(18.2 M Xcm), from a water ultra purifier Milli-Q gradient A10(Millipore), was used to prepare all aqueous solutions. 9-Methylac-ridine (9MA), 95% purity, and 7,9-dimethylbenz[c]acridine(79DMBA) and 9-amino-1,2,3,4-tetrahydroacridine (9ATHA)technical grade, standards were purchased from Sigma–Aldrich(Steinheim, Germany); acridine (A), 98% purity, and 7,8-benzoquin-oline (78BQ), 97% purity, were purchased from Acros Organics (NewJersey, USA); Dibenz[a,j]acridine (DBA), 99.5% purity, standard waspurchased from Chem Service (West Chester, USA). Standard stocksolutions of 200 mg L�1 of these compounds, prepared in acetoni-trile, were used to prepare working solutions by further dilution.HPLC-grade acetonitrile (ACN), methanol, 25% ammonia solution(analytical grade), phosphoric acid were provided by Merck (Darms-tadt, Germany). All solutions were passed through a 0.45 lm filter(Millipore, Bedford, USA) before the injection into CZE and HPLC sys-tems. SampliQ Silica Strong Cation Exchange (Si-SCX benzene-sulphonic acid, 500 mg of solid phase) column was obtained fromAgilent (California, USA). The diesel samples were provided byPetrobras, the Brazilian Energy Company.
2.3. Procedures
Volumes between 20 and 100 lL of diesel sample were selected(depending on the level of azaarenes in the sample) were diluted inACN (total volume of 2 mL). This solution was fortified with theinternal standard (200 lg g�1 final concentration) and, in someexperiments, also with the analytes. Then the solution was loadedto the cationic solid phase cartridge, which was previously condi-tioned with 3 mL of methanol, 3 mL of a solution methanol:HCl
1 mol L�1 1:1 v/v and 3 mL of HCl 1 mol L�1. Additional 3 mL ofmethanol:HCl 1 mol L�1 (50:50% v/v) and 3 mL of HCl 1 mol L�1
was used to elute the neutral substances. The retained basic azaa-renes were gently eluted with 5.00 mL of methanol:ammonia solu-tion (95:5% v/v) with the aid of a weak flow of nitrogen in order toimprove recoveries, in special for DBA. After the elution, the sol-vent volume was evaporated (by placing the vials in a water bathat about 65 �C) to 500 lL, approximately. Then, ACN (1 mL) wasadded before including phosphoric acid (1.3 mmol L�1) to adjustthe final volume to 5.00 mL (or 1000 mL) in the volumetric flask.The final solution was passed through a 0.45 lm filter before anal-ysis. The dilution factors of samples were between 20 and500 times and diluting was important to reduce sample matrixinterferences and make sample solution compatible with the elec-trophoresis procedure. For HPLC, evaporation of the collected sam-ple from the SPE cartridge was made using a N2 flow only tominimize the excess of ammonia before adjusting the volume ofthe volumetric flask with methanol. Analyte fortification of dieselsamples were made by the addition of azareenes at 200 lg L�1
(DBA) and 1000 lg L�1 for the other four azaarenes (A, 78BQ,9MA and 79DMBA).
The BGE was freshly prepared and consisted of 50 mmol L�1
phosphate buffer (pH 2.65) containing ACN (25%, in volume). Thecapillary was conditioned at the beginning of the working day withNaOH 1 mol L�1 for 30 min, and then it was rinsed with ultrapurewater for 10 min, methanol for 10 min followed by ultrapure waterfor 10 min and 30 min of BGE. In order to achieve a good reproduc-ibility between runs, the following protocol was applied:1.0 mol L�1 NaOH for 6 min, water for 3 min, methanol for 3 minand with ultrapure water for 3 min. Then the capillary was rinsedwith BGE for 3 min.
The applied potential was of 25 kV and the temperature was setto 15 �C. Sample injection was made at 50 mbar during times up to100 s. The diode array UV detector was set at different wavelengths(230, 250, 260 and 300 nm). Electropherograms shown in figureswere obtained with detection at 250 nm.
High performance liquid chromatography with fluorescencedetection (HPLC-FD) was carried out a C-18 column (250 mm �4.6 mm � 5.0 lm) at 35 �C with a flow rate of 1 mL min�1. The gra-dient applied in the mobile phase and the excitation/emissionwavelength detection program is described elsewhere [20]. Theelution was performed using a mobile phase consisting of ACNand phosphate buffer (pH 6.9; 10 mmol�1) whose proportionsvaried in a gradient elution as following: ACN/phosphate bufferfrom 40/60% to 68/32% v/v (0–8.5 min); from 68/32% to 82/18%v/v (8.5–9.5 min) and from 82/18% to 90/10% v/v (9.5–15 min).Detection was made by measuring fluorescence in two channelsas follows: The detection program on channel 1 was 240/361 nm(0–5 min) and 263/367 nm (5–15 min) and on channel 2 was247/422 nm (0–9 nm), 290/410 nm (9–12.5 min) and 285/412 nm(12.5–15 min).
3. Results and discussion
3.1. Method optimization
In the preliminary tests carried out with CZE for the separationof the six basic azaarenes (including the 9ATHA used later as inter-nal standard), the BGE employed consisted of 10 mmol L�1 H3PO4
solution (pH around 2). A standard solution containing 2000 lg L�1
of each of the azaarenes was prepared in the BGE and then injected(hydrodynamic injection) in the system during 10 s. Neitherturbidity nor precipitation at the bottom of the vial was observedindicating total solubilization of analytes in the acidic aqueousmedium due to the protonation of the nitrogen of the ring systems.
Migration time (min)
Mea
sure
d in
tens
ity (
mA
)
0
4 5 6 7 8 9 10 11 12
1.0
2.0
3.0
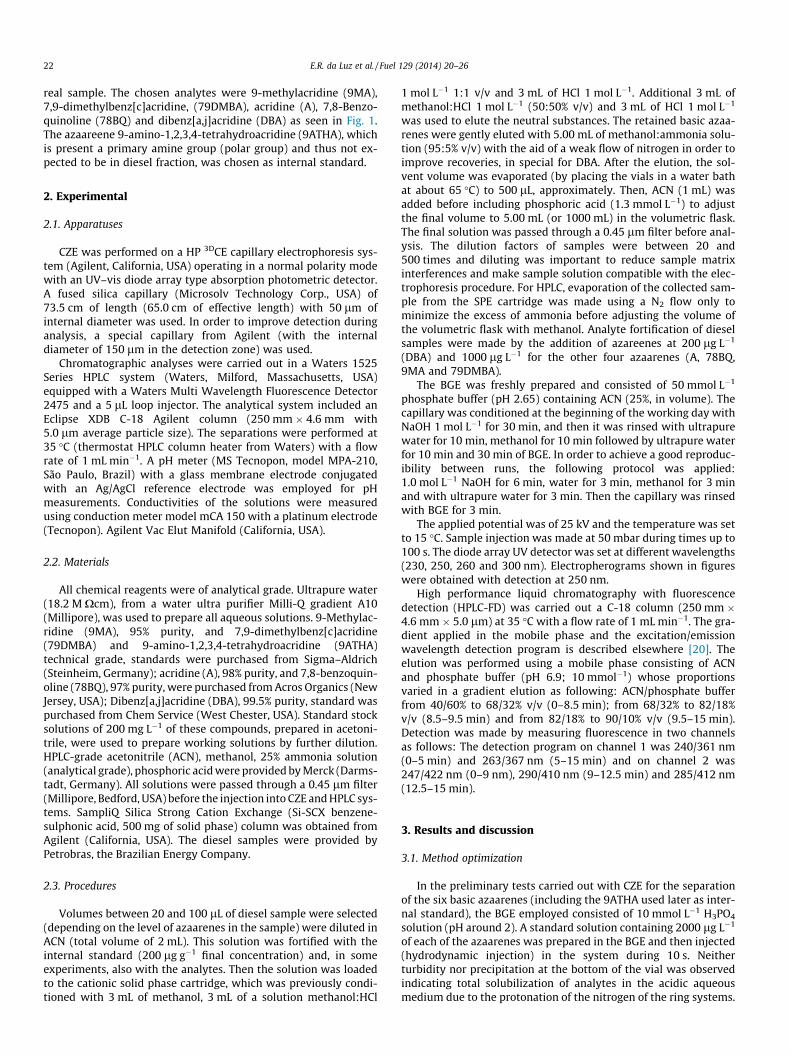
Fig. 2. Preliminary tests carried out with CZE for the separation of the six basicazaarenes: (A) electroferogram from a standard solution containing 200 lg L�1 ofeach of the azaarenes with hydrodynamic injection during 10 s. (B) Electroferogramfrom a standard solution containing 200 lg L�1 of each of the azaarenes withhydrodynamic injection during 100 s. Background electrolyte (BGE): A – consistedon 10 mmol L�1 H3PO4 solution at pH around 2 and B – consisted in 1 mmol L�1
phosphate buffer pH 2.
Migration time (min)
Rel
ativ
eint
ensi
ty
7 8 9 10 11 12
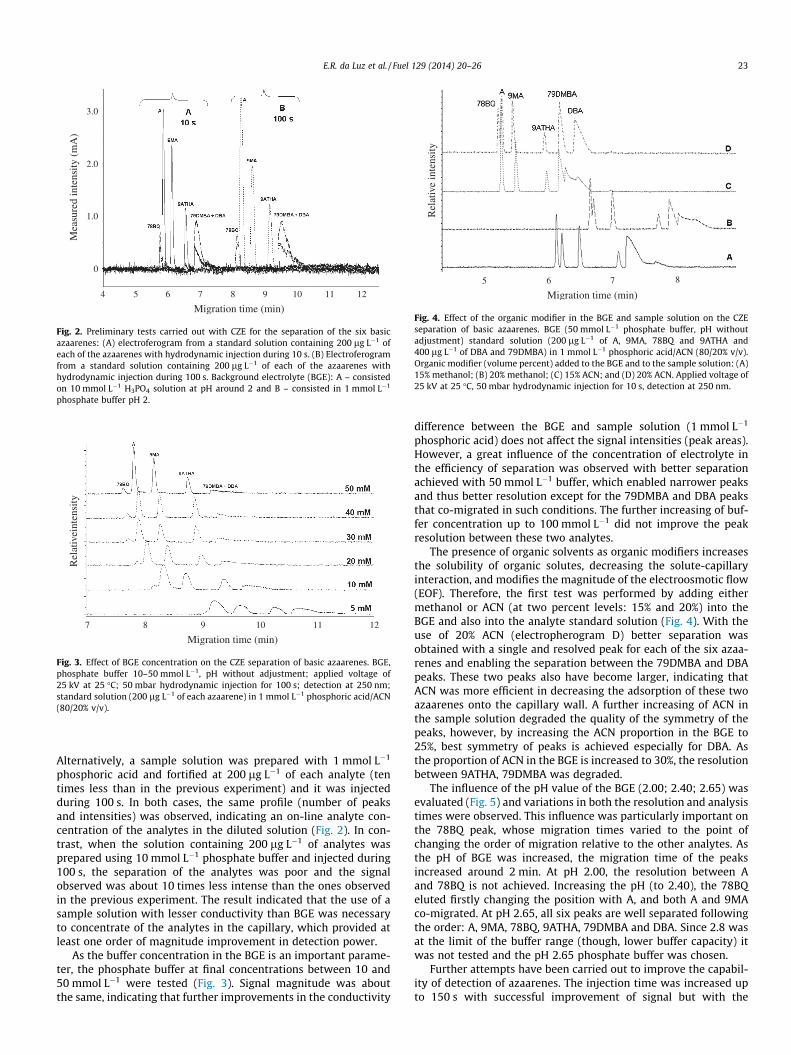
Fig. 3. Effect of BGE concentration on the CZE separation of basic azaarenes. BGE,phosphate buffer 10–50 mmol L�1, pH without adjustment; applied voltage of25 kV at 25 �C; 50 mbar hydrodynamic injection for 100 s; detection at 250 nm;standard solution (200 lg L�1 of each azaarene) in 1 mmol L�1 phosphoric acid/ACN(80/20% v/v).
Migration time (min)
875 6
Rel
ativ
e in
tens
ity
Fig. 4. Effect of the organic modifier in the BGE and sample solution on the CZEseparation of basic azaarenes. BGE (50 mmol L�1 phosphate buffer, pH withoutadjustment) standard solution (200 lg L�1 of A, 9MA, 78BQ and 9ATHA and400 lg L�1 of DBA and 79DMBA) in 1 mmol L�1 phosphoric acid/ACN (80/20% v/v).Organic modifier (volume percent) added to the BGE and to the sample solution: (A)15% methanol; (B) 20% methanol; (C) 15% ACN; and (D) 20% ACN. Applied voltage of25 kV at 25 �C, 50 mbar hydrodynamic injection for 10 s, detection at 250 nm.
E.R. da Luz et al. / Fuel 129 (2014) 20–26 23
Alternatively, a sample solution was prepared with 1 mmol L�1
phosphoric acid and fortified at 200 lg L�1 of each analyte (tentimes less than in the previous experiment) and it was injectedduring 100 s. In both cases, the same profile (number of peaksand intensities) was observed, indicating an on-line analyte con-centration of the analytes in the diluted solution (Fig. 2). In con-trast, when the solution containing 200 lg L�1 of analytes wasprepared using 10 mmol L�1 phosphate buffer and injected during100 s, the separation of the analytes was poor and the signalobserved was about 10 times less intense than the ones observedin the previous experiment. The result indicated that the use of asample solution with lesser conductivity than BGE was necessaryto concentrate of the analytes in the capillary, which provided atleast one order of magnitude improvement in detection power.
As the buffer concentration in the BGE is an important parame-ter, the phosphate buffer at final concentrations between 10 and50 mmol L�1 were tested (Fig. 3). Signal magnitude was aboutthe same, indicating that further improvements in the conductivity
difference between the BGE and sample solution (1 mmol L�1
phosphoric acid) does not affect the signal intensities (peak areas).However, a great influence of the concentration of electrolyte inthe efficiency of separation was observed with better separationachieved with 50 mmol L�1 buffer, which enabled narrower peaksand thus better resolution except for the 79DMBA and DBA peaksthat co-migrated in such conditions. The further increasing of buf-fer concentration up to 100 mmol L�1 did not improve the peakresolution between these two analytes.
The presence of organic solvents as organic modifiers increasesthe solubility of organic solutes, decreasing the solute-capillaryinteraction, and modifies the magnitude of the electroosmotic flow(EOF). Therefore, the first test was performed by adding eithermethanol or ACN (at two percent levels: 15% and 20%) into theBGE and also into the analyte standard solution (Fig. 4). With theuse of 20% ACN (electropherogram D) better separation wasobtained with a single and resolved peak for each of the six azaa-renes and enabling the separation between the 79DMBA and DBApeaks. These two peaks also have become larger, indicating thatACN was more efficient in decreasing the adsorption of these twoazaarenes onto the capillary wall. A further increasing of ACN inthe sample solution degraded the quality of the symmetry of thepeaks, however, by increasing the ACN proportion in the BGE to25%, best symmetry of peaks is achieved especially for DBA. Asthe proportion of ACN in the BGE is increased to 30%, the resolutionbetween 9ATHA, 79DMBA was degraded.
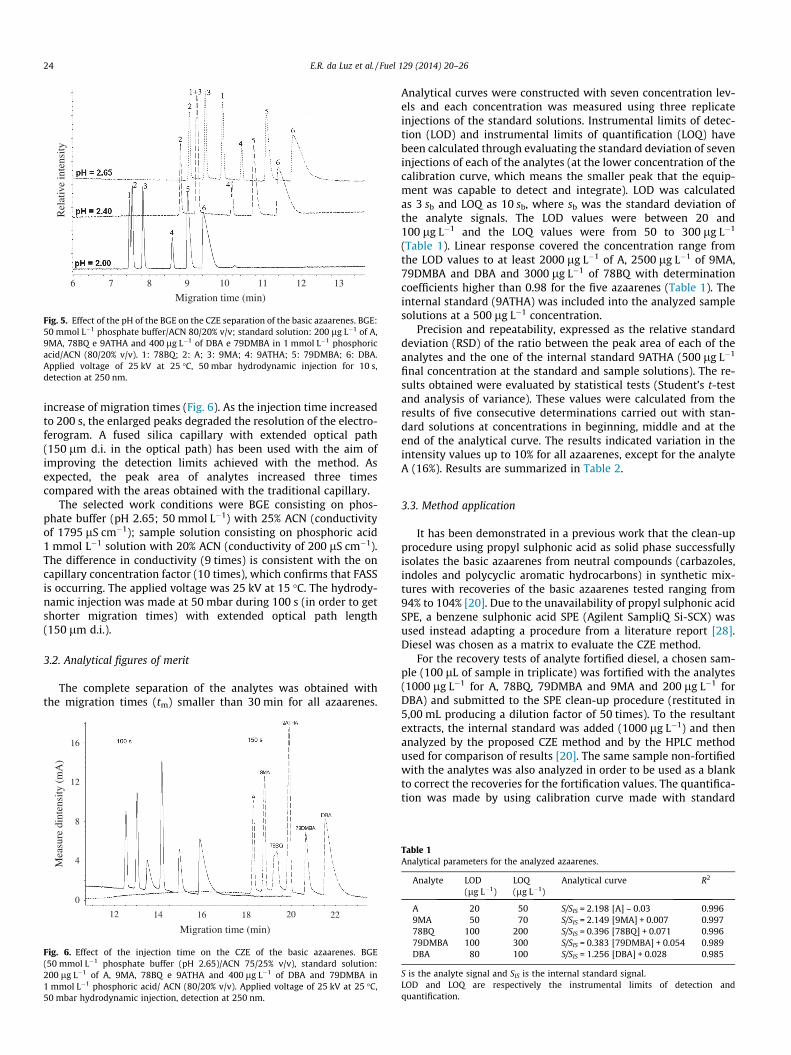
The influence of the pH value of the BGE (2.00; 2.40; 2.65) wasevaluated (Fig. 5) and variations in both the resolution and analysistimes were observed. This influence was particularly important onthe 78BQ peak, whose migration times varied to the point ofchanging the order of migration relative to the other analytes. Asthe pH of BGE was increased, the migration time of the peaksincreased around 2 min. At pH 2.00, the resolution between Aand 78BQ is not achieved. Increasing the pH (to 2.40), the 78BQeluted firstly changing the position with A, and both A and 9MAco-migrated. At pH 2.65, all six peaks are well separated followingthe order: A, 9MA, 78BQ, 9ATHA, 79DMBA and DBA. Since 2.8 wasat the limit of the buffer range (though, lower buffer capacity) itwas not tested and the pH 2.65 phosphate buffer was chosen.
Further attempts have been carried out to improve the capabil-ity of detection of azaarenes. The injection time was increased upto 150 s with successful improvement of signal but with the
Migration time (min)6 7 8 9
Rel
ativ
e in
tens
ity
10 11 12 13
Fig. 5. Effect of the pH of the BGE on the CZE separation of the basic azaarenes. BGE:50 mmol L�1 phosphate buffer/ACN 80/20% v/v; standard solution: 200 lg L�1 of A,9MA, 78BQ e 9ATHA and 400 lg L�1 of DBA e 79DMBA in 1 mmol L�1 phosphoricacid/ACN (80/20% v/v). 1: 78BQ; 2: A; 3: 9MA; 4: 9ATHA; 5: 79DMBA; 6: DBA.Applied voltage of 25 kV at 25 �C, 50 mbar hydrodynamic injection for 10 s,detection at 250 nm.
24 E.R. da Luz et al. / Fuel 129 (2014) 20–26
increase of migration times (Fig. 6). As the injection time increasedto 200 s, the enlarged peaks degraded the resolution of the electro-ferogram. A fused silica capillary with extended optical path(150 lm d.i. in the optical path) has been used with the aim ofimproving the detection limits achieved with the method. Asexpected, the peak area of analytes increased three timescompared with the areas obtained with the traditional capillary.
The selected work conditions were BGE consisting on phos-phate buffer (pH 2.65; 50 mmol L�1) with 25% ACN (conductivityof 1795 lS cm�1); sample solution consisting on phosphoric acid1 mmol L�1 solution with 20% ACN (conductivity of 200 lS cm�1).The difference in conductivity (9 times) is consistent with the oncapillary concentration factor (10 times), which confirms that FASSis occurring. The applied voltage was 25 kV at 15 �C. The hydrody-namic injection was made at 50 mbar during 100 s (in order to getshorter migration times) with extended optical path length(150 lm d.i.).
3.2. Analytical figures of merit
The complete separation of the analytes was obtained withthe migration times (tm) smaller than 30 min for all azaarenes.
Migration time (min)
Mea
sure
din
tens
ity (
mA
)
12 2220181614
0
4
8
16
12
Fig. 6. Effect of the injection time on the CZE of the basic azaarenes. BGE(50 mmol L�1 phosphate buffer (pH 2.65)/ACN 75/25% v/v), standard solution:200 lg L�1 of A, 9MA, 78BQ e 9ATHA and 400 lg L�1 of DBA and 79DMBA in1 mmol L�1 phosphoric acid/ ACN (80/20% v/v). Applied voltage of 25 kV at 25 �C,50 mbar hydrodynamic injection, detection at 250 nm.
Analytical curves were constructed with seven concentration lev-els and each concentration was measured using three replicateinjections of the standard solutions. Instrumental limits of detec-tion (LOD) and instrumental limits of quantification (LOQ) havebeen calculated through evaluating the standard deviation of seveninjections of each of the analytes (at the lower concentration of thecalibration curve, which means the smaller peak that the equip-ment was capable to detect and integrate). LOD was calculatedas 3 sb and LOQ as 10 sb, where sb was the standard deviation ofthe analyte signals. The LOD values were between 20 and100 lg L�1 and the LOQ values were from 50 to 300 lg L�1
(Table 1). Linear response covered the concentration range fromthe LOD values to at least 2000 lg L�1 of A, 2500 lg L�1 of 9MA,79DMBA and DBA and 3000 lg L�1 of 78BQ with determinationcoefficients higher than 0.98 for the five azaarenes (Table 1). Theinternal standard (9ATHA) was included into the analyzed samplesolutions at a 500 lg L�1 concentration.
Precision and repeatability, expressed as the relative standarddeviation (RSD) of the ratio between the peak area of each of theanalytes and the one of the internal standard 9ATHA (500 lg L�1
final concentration at the standard and sample solutions). The re-sults obtained were evaluated by statistical tests (Student’s t-testand analysis of variance). These values were calculated from theresults of five consecutive determinations carried out with stan-dard solutions at concentrations in beginning, middle and at theend of the analytical curve. The results indicated variation in theintensity values up to 10% for all azaarenes, except for the analyteA (16%). Results are summarized in Table 2.
3.3. Method application
It has been demonstrated in a previous work that the clean-upprocedure using propyl sulphonic acid as solid phase successfullyisolates the basic azaarenes from neutral compounds (carbazoles,indoles and polycyclic aromatic hydrocarbons) in synthetic mix-tures with recoveries of the basic azaarenes tested ranging from94% to 104% [20]. Due to the unavailability of propyl sulphonic acidSPE, a benzene sulphonic acid SPE (Agilent SampliQ Si-SCX) wasused instead adapting a procedure from a literature report [28].Diesel was chosen as a matrix to evaluate the CZE method.
For the recovery tests of analyte fortified diesel, a chosen sam-ple (100 lL of sample in triplicate) was fortified with the analytes(1000 lg L�1 for A, 78BQ, 79DMBA and 9MA and 200 lg L�1 forDBA) and submitted to the SPE clean-up procedure (restituted in5,00 mL producing a dilution factor of 50 times). To the resultantextracts, the internal standard was added (1000 lg L�1) and thenanalyzed by the proposed CZE method and by the HPLC methodused for comparison of results [20]. The same sample non-fortifiedwith the analytes was also analyzed in order to be used as a blankto correct the recoveries for the fortification values. The quantifica-tion was made by using calibration curve made with standard
Table 1Analytical parameters for the analyzed azaarenes.
Analyte LOD(lg L�1)
LOQ(lg L�1)
Analytical curve R2
A 20 50 S/SIS = 2.198 [A] – 0.03 0.9969MA 50 70 S/SIS = 2.149 [9MA] + 0.007 0.99778BQ 100 200 S/SIS = 0.396 [78BQ] + 0.071 0.99679DMBA 100 300 S/SIS = 0.383 [79DMBA] + 0.054 0.989DBA 80 100 S/SIS = 1.256 [DBA] + 0.028 0.985
S is the analyte signal and SIS is the internal standard signal.LOD and LOQ are respectively the instrumental limits of detection andquantification.
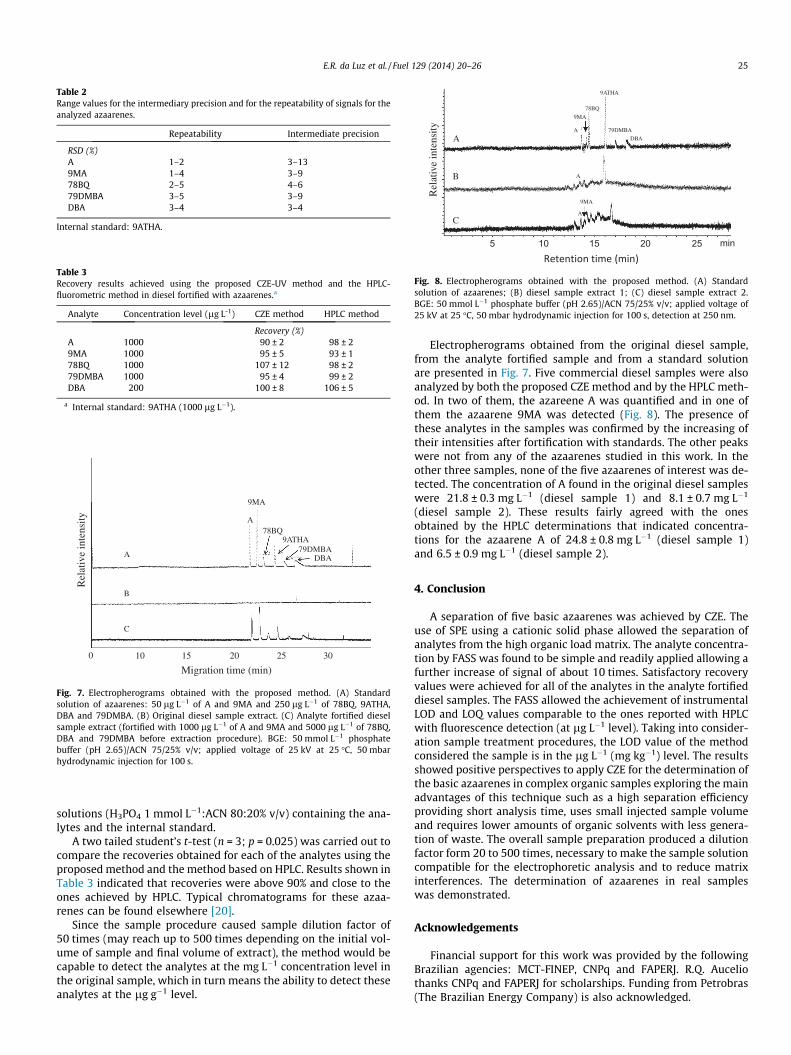
Table 2Range values for the intermediary precision and for the repeatability of signals for theanalyzed azaarenes.
Repeatability Intermediate precision
RSD (%)A 1–2 3–139MA 1–4 3–978BQ 2–5 4–679DMBA 3–5 3–9DBA 3–4 3–4
Internal standard: 9ATHA.
Table 3Recovery results achieved using the proposed CZE-UV method and the HPLC-fluorometric method in diesel fortified with azaarenes.a
Analyte Concentration level (lg L-1) CZE method HPLC method
Recovery (%)A 1000 90 ± 2 98 ± 29MA 1000 95 ± 5 93 ± 178BQ 1000 107 ± 12 98 ± 279DMBA 1000 95 ± 4 99 ± 2DBA 200 100 ± 8 106 ± 5
a Internal standard: 9ATHA (1000 lg L�1).
A
9MA
78BQ
79DMBADBA
9ATHA
Migration time (min)
0 10 15 20 25 30
A
B
C
Rel
ativ
e in
tens
ity
Fig. 7. Electropherograms obtained with the proposed method. (A) Standardsolution of azaarenes: 50 lg L�1 of A and 9MA and 250 lg L�1 of 78BQ, 9ATHA,DBA and 79DMBA. (B) Original diesel sample extract. (C) Analyte fortified dieselsample extract (fortified with 1000 lg L�1 of A and 9MA and 5000 lg L�1 of 78BQ,DBA and 79DMBA before extraction procedure). BGE: 50 mmol L�1 phosphatebuffer (pH 2.65)/ACN 75/25% v/v; applied voltage of 25 kV at 25 �C, 50 mbarhydrodynamic injection for 100 s.
min5 10 15 20 25
A
B
C
79DMBA
DBA
9ATHA
78BQ
A
9MA
A
A
9MA
Rel
ativ
e in
tens
ity
Fig. 8. Electropherograms obtained with the proposed method. (A) Standardsolution of azaarenes; (B) diesel sample extract 1; (C) diesel sample extract 2.BGE: 50 mmol L�1 phosphate buffer (pH 2.65)/ACN 75/25% v/v; applied voltage of25 kV at 25 �C, 50 mbar hydrodynamic injection for 100 s, detection at 250 nm.
E.R. da Luz et al. / Fuel 129 (2014) 20–26 25
solutions (H3PO4 1 mmol L�1:ACN 80:20% v/v) containing the ana-lytes and the internal standard.
A two tailed student’s t-test (n = 3; p = 0.025) was carried out tocompare the recoveries obtained for each of the analytes using theproposed method and the method based on HPLC. Results shown inTable 3 indicated that recoveries were above 90% and close to theones achieved by HPLC. Typical chromatograms for these azaa-renes can be found elsewhere [20].
Since the sample procedure caused sample dilution factor of50 times (may reach up to 500 times depending on the initial vol-ume of sample and final volume of extract), the method would becapable to detect the analytes at the mg L�1 concentration level inthe original sample, which in turn means the ability to detect theseanalytes at the lg g�1 level.
Electropherograms obtained from the original diesel sample,from the analyte fortified sample and from a standard solutionare presented in Fig. 7. Five commercial diesel samples were alsoanalyzed by both the proposed CZE method and by the HPLC meth-od. In two of them, the azareene A was quantified and in one ofthem the azaarene 9MA was detected (Fig. 8). The presence ofthese analytes in the samples was confirmed by the increasing oftheir intensities after fortification with standards. The other peakswere not from any of the azaarenes studied in this work. In theother three samples, none of the five azaarenes of interest was de-tected. The concentration of A found in the original diesel sampleswere 21.8 ± 0.3 mg L�1 (diesel sample 1) and 8.1 ± 0.7 mg L�1
(diesel sample 2). These results fairly agreed with the onesobtained by the HPLC determinations that indicated concentra-tions for the azaarene A of 24.8 ± 0.8 mg L�1 (diesel sample 1)and 6.5 ± 0.9 mg L�1 (diesel sample 2).
4. Conclusion
A separation of five basic azaarenes was achieved by CZE. Theuse of SPE using a cationic solid phase allowed the separation ofanalytes from the high organic load matrix. The analyte concentra-tion by FASS was found to be simple and readily applied allowing afurther increase of signal of about 10 times. Satisfactory recoveryvalues were achieved for all of the analytes in the analyte fortifieddiesel samples. The FASS allowed the achievement of instrumentalLOD and LOQ values comparable to the ones reported with HPLCwith fluorescence detection (at lg L�1 level). Taking into consider-ation sample treatment procedures, the LOD value of the methodconsidered the sample is in the lg L�1 (mg kg�1) level. The resultsshowed positive perspectives to apply CZE for the determination ofthe basic azaarenes in complex organic samples exploring the mainadvantages of this technique such as a high separation efficiencyproviding short analysis time, uses small injected sample volumeand requires lower amounts of organic solvents with less genera-tion of waste. The overall sample preparation produced a dilutionfactor form 20 to 500 times, necessary to make the sample solutioncompatible for the electrophoretic analysis and to reduce matrixinterferences. The determination of azaarenes in real sampleswas demonstrated.
Acknowledgements
Financial support for this work was provided by the followingBrazilian agencies: MCT-FINEP, CNPq and FAPERJ. R.Q. Auceliothanks CNPq and FAPERJ for scholarships. Funding from Petrobras(The Brazilian Energy Company) is also acknowledged.

26 E.R. da Luz et al. / Fuel 129 (2014) 20–26
References
[1] Pillon LZ. Effect of clays and adsorbents on the nitrogen content and thestability of jet fuels. Pet Sci Technol 2001;19:961–70.
[2] von Muhlen C, Zini CA, Camarao EB, Marriott PJ. Applications of comprehensivetwo-dimensional gas chromatography to the characterization of petrochemicaland related samples. J Chromatogr A 2006;1105:39–50.
[3] Chen HY, Preston MR. Measurement of semi-volatile azaarenes in airborneparticulate and vapor phases. Anal Chim Acta 2004;501:71–8.
[4] Sochova I, Hofman J, Holoubek I. Effects of seven organic pollutants on soilnematode Caenorhabditis elegans. Environ Int 2007;33:798–804.
[5] Bleeker EAJ, Wiegman S, de Voogt P, Kraak M, Leslie HA, de Haas E, AdmiraalW. Toxicity of azaarenes. Rev Environ Contam T 2002;173:39–83.
[6] Clement RE, Yang PW, Koester CJ. Environmental analysis. Anal Chem1999;71:257R–92R.
[7] Chen HY, Preston MR. Dissolution of azaarenes from urban aerosols. AtmosEnviron 2004;38:1023–8.
[8] Chen HY, Preston MR. Azaarenes in the aerosol of an urban atmosphere.Environ Sci Technol 1999;32:577–83.
[9] Osborne PJ, Preston MR, Chen HY. Azaarenes in sediments, suspended particlesand aerosol associated with the River Mersey estuary. Mar Chem1997;58:73–83.
[10] Ma YL, Hays MD. Thermal extraction-two-dimensional gas chromatography-mass spectrometry with heart-cutting for nitrogen heterocyclics in biomassburning aerosols. J Chromatogr A 2008;1200:228–34.
[11] Rivera L, Curto MJC, Pais P, Galceran MT, Puignou L. Solid-phase extraction forthe selective isolation of polycyclic aromatic hydrocarbons, azaarenes andheterocyclic aromatic amines in charcoal-grilled meat. J Chromatogr A1996;731:85–94.
[12] Mao J, Pacheco CR, Traficante DD, Rosen W. Analysis of benzoquinolines andacridines in a brazilian diesel oil by particle-beam LC/MS and HPLC/UV. J LiqChromatogr 1995;18:903–16.
[13] Link DD, Baltrus JP, Zandhuis P. Isolation and identification of nitrogen speciesin jet fuel and diesel fuel. Energy Fuels 2007;21:1575–81.
[14] von Muhlen C, de Oliveira EC, Morrison PD, Zini CA, Camarao EB, Marriott PJ.Qualitative and quantitative study of nitrogen-containing compounds in heavygas oil using comprehensive two-dimensional gas chromatography withnitrogen phosphorus detection. J Sep Sci 2007;30:3223–32.
[15] Svabensky R, Koci K, Simek Z. The study of properties of HPLC determination ofpolycyclic aromatic nitrogen heterocycles. Int J Environ Anal Chem2007;87:337–49.
[16] Tollback P, Carlsson H, Ostman C. Coupled LC-GC-NPD for determination ofcarbazole-type PANH and its application to personal exposure measurement. JHigh Res Chromatogr 2000;23:131–7.
[17] Wilhelm M, Matuschek G, Kettrup A. Determination of basic nitrogen-containing polynuclear aromatic hydrocarbons formed during thermaldegradation of polymers by high-performance liquid chromatography-fluorescence detection. J Chromatogr A 2000;878:171–81.
[18] Janoszka B, Blaszczyk U, Warzecha L, Strozyk M, Damasiewicz-Bodzek A,Bodzek D. Clean-up procedures for the analysis of heterocyclic aromaticamines (aminoazaarenes) from heat-treated meat samples. J Chromatogr A2001;938:155–65.
[19] Nondek L, Chvalovsky Y. On-line pre-concentration and liquidchromatography of azaarenes using nitroaromatic sorbents. J Chromatogr1984;312:303–12.
[20] da Luz ER, Gonsalves TFM, Aucelio RQ. Determination of basic azaarenes inaviation kerosene by solid-phase extraction and HPLC-fluorescence detection.J Sep Sci 2009;32:2058–65.
[21] Mikkers FEP, Everaerts FM, Verheggen PEM. High performance zoneelectrophoresis. J Chromatogr B 1979;169:11–20.
[22] Kartsova LA, Bessonova EA. Preconcentration techniques in capillaryelectrophoresis. J Anal Chem 2009;64:326–37.
[23] Mikkers FEP, Everaerts FM, Verheggen PEM. Concentration distributions infreezone electrophoresis. J Chromatogr B 1979;169:1–10.
[24] Shihabi ZK. Stacking in capillary zone electrophoresis. J Chromatogr A2000;902:107–17.
[25] Quirino JP, Terabe S. Sample stacking of cationic and anionic analytes incapillary electrophoresis. J Chromatogr A 2000;902:119–35.
[26] Tezcan F, Erim FB. On-line stacking techniques for the nonaqueous capillaryelectrophoretic determination of acrylamide in processed food. Anal ChimActa 2008;617:196–9.
[27] Shihabi ZK. Organic solvent high-field amplified stacking for basic compoundsin capillary electrophoresis. J Chromatogr A 2005;1066:205–10.
[28] Matsukawa T, Hasegawa H, Shinohara Y, Kobayashi J, Shinohara A, Chiba M,et al. Simultaneous determination of selenomethionine enantiomers inbiological fluids by stable isotope dilution gas chromatography–massspectrometry. J Chromatogr B 2011;879:3253–8.