capillary electrophoresis of biopharmaceuticalsjonatan r. catai efficient capillary electrophoresis...
TRANSCRIPT

Chapter 2
Capillary electrophoresis of biopharmaceuticals
Catai, J. R.; de Jong, G. J.; Somsen, G. W.
in: Jiskoot, W.; Crommelin, D. J. A. (Eds.), Methods for Structural Analysis of Protein Pharmaceuticals,
American Association of Pharmaceutical Scientists,Arlington, VA, USA 2005, pp. 331-377


Jonatan R. Catai
Efficient capillary electrophoresis of peptides and proteins with bilayer-coated capillaries 21
2.1. Introduction
Capillary electrophoresis (CE) is a modern analytical separation technique that
can be used for a variety of compounds such as drugs (and their enantiomers), amino
acids, peptides, DNA, and numerous other ionic species. In recent years, CE has played a
major role in the Human Genome Project where it provided a huge and decisive boost to
the project’s completion. The vast majority of the sequence of the human genome was
determined with CE-based high-throughput DNA sequencers. CE is also very well suited
for the separation of proteins [1, 2]. The CE separation mechanism is governed by
electrophoretic mobility, which is a function of charge and size of the studied ionic species.
Differences between a (therapeutic) protein and, for example, its degradation products are
often small relative to the molecular size of the protein (10–200 kDa) but usually involve
changes in net protein charge and/or shape. These modifications frequently are sufficient
for separation by CE. Even glycoforms of one protein might be separable by CE.
During the past decade, CE has emerged as a powerful tool for the characterization
of pharmaceutical and other biotechnologically derived proteins [3-6] and established a
position next to more conventional protein separation techniques like polyacrylamide gel
electrophoresis (PAGE) and high-performance liquid chromatography (HPLC). CE is a
rapid analytical technique, requiring small sample volumes and limited quantities of
reagents, and is applicable to a wide range of analytes. In addition, CE is a highly efficient
separation technique capable of yielding much higher plate numbers than PAGE and HPLC.
The high electrical resistance of a buffer-filled capillary and its favorable surface area-to-
volume ratio (good heat dissipation) enables the application of very high electrical fields
(100–500 V/cm) without causing detrimental heat generation. CE is carried out in “free”
buffer solutions, so sources of band-broadening related to the stationary phase (as are
common in HPLC) are absent. Furthermore, whereas in HPLC the pressure-driven flow
profile is parabolic (laminar flow), in CE the electrically driven flow has basically a flat
profile. Overall, this induces the analytes to migrate as very narrow zones and ideally
undergo dispersion only from axial diffusion. The mild separation conditions that can be
chosen in CE present the possibility to separate and study proteins in their natural
(nondenatured) state, which can be important when characteristics of pharmaceutical
proteins have to be assessed. Though it was originally thought that CE would compete
with HPLC as a separation technique, the two methods are now increasingly deemed
complementary. In this respect, CE and reversed-phase HPLC often are referred to as
“orthogonal” separation techniques providing noncorrelated information on separated species.
In this chapter, we will highlight the (potential) role of CE in the analysis of

Jonatan R. Catai
Efficient capillary electrophoresis of peptides and proteins with bilayer-coated capillaries22
biopharmaceuticals. CE offers various modes of separation, which can be useful in protein
analysis. These include capillary zone electrophoresis (CZE; charge-size ratio–based
separation), capillary gel electrophoresis (CGE; molecular-weight–based separation), and
capillary isoelectric focusing (CIEF; isoelectric-point–based separation). After first describing
the general basics and properties of CE, the principles and applications of each of these
modes are outlined. Selected examples are given to illustrate the usefulness of the CE systems,
and comprehensive tables provide an overview of applications of CE for the characterization
of biotechnologically produced proteins. As mass spectrometric (MS) detection is of increasing
importance in protein analysis, specific attention is devoted to the on-line coupling of CE
and MS for the characterization of intact proteins. Also, affinity capillary electrophoresis
(ACE), which permits direct determination of the binding stoichiometry and the
thermodynamic equilibrium constants of protein-ligand complexes, is briefly treated.
2.2. Principles of Capillary Electrophoresis
2.2.1. Setup, Theory, and Practical Aspects
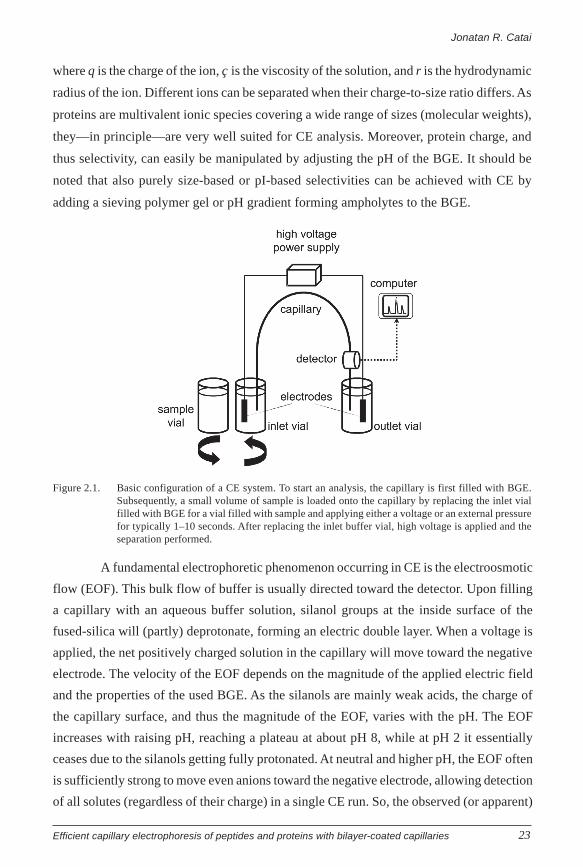
In CE, separation of analyte ions is carried out in a buffer or background electrolyte
(BGE) present in a narrow fused-silica capillary (25-100 µm i.d.). The ends of the capillary
are inserted into vials filled with BGE, which also contain electrodes connected to a high-
voltage supply to complete an electrical circuit (Figure 2.1). The sample solution is
introduced as a small plug at the inlet side of the capillary. With the application of high
voltage (5–30 kV) across the capillary, different zones of analyte ions are developed and
start to migrate with different velocities toward the outlet side of the capillary. Before
reaching the end of the capillary, most commonly, the separated analyte bands (peaks) are
registered by absorbance detection directly through the capillary wall yielding an
electropherogram.
Separation by electrophoresis is based on differences in electrophoretic mobility
(µ) of ionic species. The mobility is the result of the electrostatic force exerted on an ion by
the electric field and the opposing viscous force (frictional drag) that the ion meets when
it moves in solution. For a spherical ion, the mobility µ can be written as:
r
q
πηµ
6= (1)
Jonatan R. Catai
Efficient capillary electrophoresis of peptides and proteins with bilayer-coated capillaries 23
where q is the charge of the ion, ç is the viscosity of the solution, and r is the hydrodynamic
radius of the ion. Different ions can be separated when their charge-to-size ratio differs. As
proteins are multivalent ionic species covering a wide range of sizes (molecular weights),
they—in principle—are very well suited for CE analysis. Moreover, protein charge, and
thus selectivity, can easily be manipulated by adjusting the pH of the BGE. It should be
noted that also purely size-based or pI-based selectivities can be achieved with CE by
adding a sieving polymer gel or pH gradient forming ampholytes to the BGE.
Figure 2.1. Basic configuration of a CE system. To start an analysis, the capillary is first filled with BGE.Subsequently, a small volume of sample is loaded onto the capillary by replacing the inlet vialfilled with BGE for a vial filled with sample and applying either a voltage or an external pressurefor typically 1–10 seconds. After replacing the inlet buffer vial, high voltage is applied and theseparation performed.
A fundamental electrophoretic phenomenon occurring in CE is the electroosmotic
flow (EOF). This bulk flow of buffer is usually directed toward the detector. Upon filling
a capillary with an aqueous buffer solution, silanol groups at the inside surface of the
fused-silica will (partly) deprotonate, forming an electric double layer. When a voltage is
applied, the net positively charged solution in the capillary will move toward the negative
electrode. The velocity of the EOF depends on the magnitude of the applied electric field
and the properties of the used BGE. As the silanols are mainly weak acids, the charge of
the capillary surface, and thus the magnitude of the EOF, varies with the pH. The EOF
increases with raising pH, reaching a plateau at about pH 8, while at pH 2 it essentially
ceases due to the silanols getting fully protonated. At neutral and higher pH, the EOF often
is sufficiently strong to move even anions toward the negative electrode, allowing detection
of all solutes (regardless of their charge) in a single CE run. So, the observed (or apparent)
Jonatan R. Catai
Efficient capillary electrophoresis of peptides and proteins with bilayer-coated capillaries24
where tm is the migration time of the analyte. In CE, plate numbers of several hundreds of
thousands to even a few millions are very well possible, whereas in HPLC plate numbers
rarely exceed 10,000. These high efficiencies can be achieved because several potential
sources of band broadening are absent or can be effectively minimized. Ideally, axial
diffusion is the only source of band broadening and the ultimate plate number is then given
by:
mobility of an ion (as determined from the electropherogram) usually is the sum of two
mobilities: the electroosmotic mobility and the ionic (or effective) mobility. Obviously,
separation only takes place when ionic species have different effective mobilities.
As for any other separation technique, the widths of the separated analyte zones
(peaks) preferably should be as narrow as possible in order to enhance resolution. Assuming
Gaussian zone profiles in CE, band widths are usually given as the standard deviation (σ) or
variance (σ2) of the peak. Like in chromatography, in CE the ability of a separation system to
produce narrow peaks (i.e., the efficiency) is expressed by the plate number (N):
2
=
σmtN (2)
D
VN
2
µ= (3)
where V is the applied voltage and D is the diffusion coefficient of the analyte. Notably,
the plate number does not depend on the length of the capillary. Larger molecules have
smaller diffusion coefficients, and indeed highest efficiencies in CE have been obtained
for macromolecules such as DNA and proteins. In practice, however, for proteins these
high plate numbers are not always easy to achieve due to adsorption of proteins to the
capillary wall, which can adversely affect the peak widths. Methods to decrease protein
adsorption are discussed below.
Equation 3 also indicates that the applied voltage in principle should be maximized
to attain high efficiencies. Using commercial CE instruments, commonly voltages of up to
30 kV can be applied (cf. in PAGE, applied voltages typically are 100–150 V). In fact, the
favorable plate numbers in CE are directly related to the high voltages that can be used. An
inherent effect of applying voltage is the production of heat in the BGE in the capillary
resulting from the electric current passing through. Advanced CE instruments use capillary
thermostatting to provide an effective way of dissipating this so-called Joule heat and a
more stable performance. Joule heating can cause band broadening when the current gets
too high (e.g., as result of the high conductivity of the used BGE). To avoid this, the
Jonatan R. Catai
Efficient capillary electrophoresis of peptides and proteins with bilayer-coated capillaries 25
voltage has to be lowered or the concentration of the BGE has to be reduced. Another
option is to select organic and/or zwitterionic buffers, such as TAPS, CHES, and HEPES,
as BGE. These buffers add to the ionic strength, but less or not to the conductivity, and
thus allow high voltages to be applied at acceptable currents.
Measurement of the absorption of UV or visible light by the separated analytes is
the predominant detection mode in CE. For absorbance (and also fluorescence) detection,
a certain length of the capillary near the outlet is used as detector “cell” It is created by
removing a piece of the polyimide coating from the outside of the fused-silica capillary,
which in itself is light-transparent down to 190 nm. Detection apertures with a typical
length of 0.2–0.8 mm are used to create a well-defined detection volume. The size of the
detection window has to be limited to prevent significant contribution of the detection to
band broadening and, thus, to allow proper detection of the sharp analyte zones.
In CE, the sample is introduced as a small zone at the inlet of the capillary. In
order to minimize the effect of the injection on band broadening, as a rule of thumb, the
length of the sample plug should be within 1% of the total length of the capillary. This
corresponds to maximum injection volumes of about 2-50 nL only, depending on the length
and diameter of the used capillary. For a 100 µg/mL sample of a 20-kDa protein, for example,
this implies that the analyzed protein amounts are in the femtomol range. An important
aspect to consider in CE is the concentration of salts in the sample. To ensure high efficiency,
the ionic strength of the sample should not exceed the ionic strength of the BGE. On the
other hand, when the ionic strength of the sample is lower than the BGE, sharpening of
analyte zones (so-called stacking) occurs. This often allows larger injection volumes to be
loaded into the capillary and, thus, lower detection limits to be achieved.
Although mass sensitivities can be impressive in CE, the attainable concentration
sensitivity can be considerably less favorable. This is in part caused by the restricted sample
loadability, but most of all (bearing Beer’s law in mind) by the limited optical pathlength
for detection, which is not larger than the capillary diameter (25-100 µm). The effect of the
small pathlength is to some extent counteracted by the relatively high peak concentrations
(resulting from the high efficiency) in CE. Overall, however, with UV absorbance detection
in CE, concentration detection limits generally are about two orders of magnitude higher
than in HPLC. Sometimes this loss can partly be compensated for by selecting a more
favorable detection wavelength. For instance, the molar absorptivity of proteins at 190–
200 nm is much higher than at 280 nm, the commonly used wavelength in protein HPLC.
Detection in the far UV region in HPLC can be problematic, but often is very well possible
in CE (due to the short optical path length and/or high separation selectivity), even when a
Jonatan R. Catai
Efficient capillary electrophoresis of peptides and proteins with bilayer-coated capillaries26
moderately UV-absorbing BGE is used.
In order to improve detection limits in CE, proteins may be derivatized with
fluorescent reagents and detected with highly sensitive laser-induced fluorescence (LIF)
detection. However, as one protein normally contains several reactive moieties (e.g., lysine
residues), upon derivatization, usually multiple products are formed. These give rise to a
wide peak pattern when analyzed by CZE or CIEF, which obviously is undesirable if, for
instance, quality control of a biopharmaceutical sample is pursued. In CGE, which has a
purely size-based separation mechanism, this problem does not occur, and LIF can be used
effectively to obtain better sensitivity for proteins.
2.2.2. Capillary Coating
Proteins tend to adsorb to surfaces, which in CE can lead to band broadening and
peak tailing, or even loss of analyte(s) when the binding is irreversible. Moreover, changes
in the surface of the capillary may cause nonuniform liquid flow profiles and an
uncontrollable EOF leading to poor migration time reproducibilities. Adsorption is caused
by electrostatic and/or hydrophobic interactions of proteins with the capillary inner wall.
By using BGEs with extreme pH values, protein adsorption phenomena sometimes can be
reduced. At a pH lower than 2, the silanol groups of the fused-silica are fully protonated
and the surface charge will approach zero. This means that electrostatic interaction of the
proteins (which are positively charged at low pH) with the capillary wall will be minimized.
At pH values higher than 10, the capillary surface will be highly negatively charged, while
most proteins also will bear a net negative charge. So in this situation, electrostatic repulsion
will reduce the chance of adsorption of proteins. Contrary to HPLC, in CE there are no
technical constraints to perform separations at very low or high pH. Nevertheless, from
the viewpoint of protein stability and integrity, the use of BGEs with extreme pH might
not be desirable. Moreover, for separation optimization, the possibility to vary the pH of
the BGE might be required.
In CE of proteins, coated capillaries are often used in order to minimize protein
interaction/adsorption and stabilize or cancel out the EOF [7]. Before use, the fused-silica
capillary wall surface is then coated with a suitable layer that masks the silanol groups.
Several coating approaches can be discerned. The first applied, and still quite popular
method of producing a capillary coating involves the use of polymers (in situ polymerized
or preformed) that are covalently bound to the capillary internal wall [8, 9]. These coating
materials, like for example polyacrylamide or poly(vinyl alcohol), cover the capillary surface
and are less susceptible to protein adsorption. Chemically coated capillaries are widely
used to improve efficiencies and, especially in CIEF, to eliminate the EOF. Disadvantage
of this type of coating is that the preparation is often based on a multi-step chemical reaction

Jonatan R. Catai
Efficient capillary electrophoresis of peptides and proteins with bilayer-coated capillaries 27
scheme that may cause a large variance between capillaries. Besides, covalent coatings are
usually stable only in a restricted pH range, have limited lifetimes, and can be quite
expensive when purchased commercially.
Another approach to prevent protein adsorption and control the EOF is the addition
of compounds (such as amines or surfactants) to the BGE that interact electrostatically
with the silanol groups. The preparation of these so-called dynamically coated capillaries
is quite simple and fast, comprising a flushing procedure only [10, 11]. As an example,
Figure 2.2 shows that adding triethylamine to the BGE can strongly improve the efficiency
and, thus, resolution of a CE separation of a drug-protein conjugate sample. Removal of
dynamic coatings can easily be accomplished by changing the pH. This also implies a
drawback because analyses can only be carried out in a certain pH range. Furthermore, the
presence of coating additives in the BGE may influence the CE selectivity and, depending
on their character, additives may interfere with UV absorbance or MS detection.
Figure 2.2. CZE of lysozyme conjugated with captopril (reaction ratio 1:2) using a BGE of 50 mMphosphate buffer, pH 2.5, (A) without and (B) with 40 mM triethylamine. As lysozyme containsmultiple reaction sites (lysine groups), the reaction yields various differently conjugatedprotein molecules [12].
A third coating development involves the use of noncovalently coated capillaries,
which are prepared by flushing the capillary with a solution of an ionic polymer prior to
CE analysis. Initially, capillaries were coated with a monolayer of positively charged
polymers, such as Polybrene and polyethylenimine [13-15]. As the capillary wall in these
systems is positively charged, the EOF is reversed and, therefore, the voltage polarity of
the CE system also has to be switched so that the EOF will be directed toward the detector.
In such a case, positively charged proteins will migrate slower than the EOF. Recently, it
has been demonstrated that a second, anionic polymer layer can be electrostatically adsorbed
on the first cationic layer, creating a doubly noncovalently coated capillary. These bilayer
coatings show a high endurance and uniformity and seem to be very promising for the
highly efficient and reproducible analysis of peptides and proteins [16, 17].
Jonatan R. Catai
Efficient capillary electrophoresis of peptides and proteins with bilayer-coated capillaries28
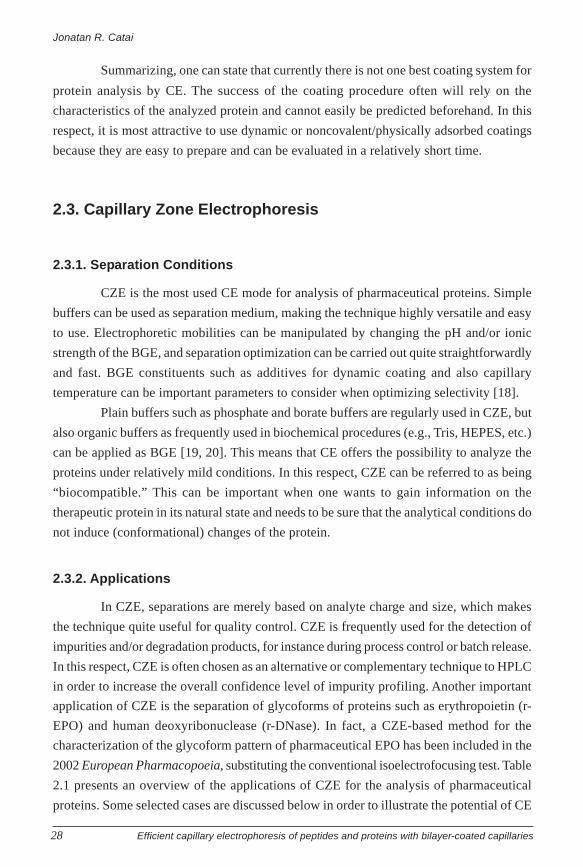
Summarizing, one can state that currently there is not one best coating system for
protein analysis by CE. The success of the coating procedure often will rely on the
characteristics of the analyzed protein and cannot easily be predicted beforehand. In this
respect, it is most attractive to use dynamic or noncovalent/physically adsorbed coatings
because they are easy to prepare and can be evaluated in a relatively short time.
2.3. Capillary Zone Electrophoresis
2.3.1. Separation Conditions
CZE is the most used CE mode for analysis of pharmaceutical proteins. Simple
buffers can be used as separation medium, making the technique highly versatile and easy
to use. Electrophoretic mobilities can be manipulated by changing the pH and/or ionic
strength of the BGE, and separation optimization can be carried out quite straightforwardly
and fast. BGE constituents such as additives for dynamic coating and also capillary
temperature can be important parameters to consider when optimizing selectivity [18].
Plain buffers such as phosphate and borate buffers are regularly used in CZE, but
also organic buffers as frequently used in biochemical procedures (e.g., Tris, HEPES, etc.)
can be applied as BGE [19, 20]. This means that CE offers the possibility to analyze the
proteins under relatively mild conditions. In this respect, CZE can be referred to as being
“biocompatible.” This can be important when one wants to gain information on the
therapeutic protein in its natural state and needs to be sure that the analytical conditions do
not induce (conformational) changes of the protein.
2.3.2. Applications
In CZE, separations are merely based on analyte charge and size, which makes
the technique quite useful for quality control. CZE is frequently used for the detection of
impurities and/or degradation products, for instance during process control or batch release.
In this respect, CZE is often chosen as an alternative or complementary technique to HPLC
in order to increase the overall confidence level of impurity profiling. Another important
application of CZE is the separation of glycoforms of proteins such as erythropoietin (r-
EPO) and human deoxyribonuclease (r-DNase). In fact, a CZE-based method for the
characterization of the glycoform pattern of pharmaceutical EPO has been included in the
2002 European Pharmacopoeia, substituting the conventional isoelectrofocusing test. Table
2.1 presents an overview of the applications of CZE for the analysis of pharmaceutical
proteins. Some selected cases are discussed below in order to illustrate the potential of CE

Jonatan R. Catai
Efficient capillary electrophoresis of peptides and proteins with bilayer-coated capillaries 29
as a “stand-alone” as well as a complementary technique to HPLC.
Several reported applications of CZE deal with the analysis of insulin, a widely
used and produced therapeutic protein. Mandrup described a CZE method for the separation
of insulin and deamidation products (impurities) using untreated fused-silica capillaries
and a BGE containing CHES, triethylamine, and 10% acetonitrile [21]. Acidic and neutral
desamido-insulin in formulated human insulin could be separated within 20 minutes with
the relative standard deviation (RSD) of the migration times being below 1%. In reversed-
phase HPLC, the neutral desamido-insulin coeluted with the insulin, whereas with CZE in
comparison with ion-exchange chromatography (IEC) better resolution was obtained in a
shorter analysis time. Klyushnichenko et al. showed how CZE can be incorporated in an
analytical scheme for the monitoring of recombinant human insulin during the various
steps of its production [22, 23]. Simple borate or phosphate buffers (pH 9–11) were used
with uncoated fused-silica capillaries. CZE was applied, for example, for the assessment
of the isolation and purification of the fusion protein (used for expression), for the control
of the isolation and purification of the intermediate di-Arg(B31-B32)-insulin from the
reaction mixture, and for control of the final purification of the insulin by IEC. The latter
is illustrated in Figure 2.3, which shows the CZE analysis of three IEC fractions revealing
the presence of several impurities from preparation (Arg-insulin) and degradation
(unidentified desamido-insulins) in the isolated insulin. The degradation impurities were
not detected with HPLC.
Figure 2.3. CZE of fractions obtained after ion-exchange chromatography of crude insulin sample. (A) Front,(B) central part, and (C) tail of IEC peak [23]. Reproduced by permission of Elsevier.
Jonatan R. Catai
Efficient capillary electrophoresis of peptides and proteins with bilayer-coated capillaries30
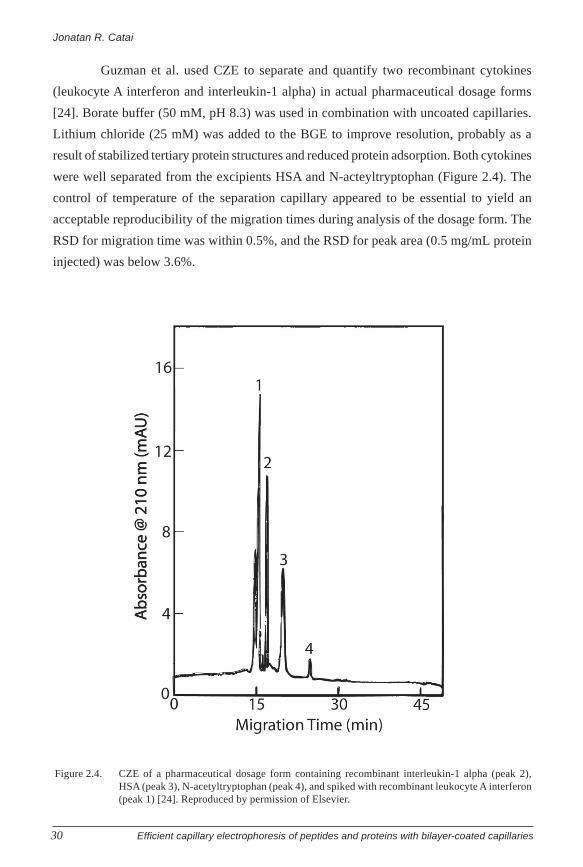
Guzman et al. used CZE to separate and quantify two recombinant cytokines
(leukocyte A interferon and interleukin-1 alpha) in actual pharmaceutical dosage forms
[24]. Borate buffer (50 mM, pH 8.3) was used in combination with uncoated capillaries.
Lithium chloride (25 mM) was added to the BGE to improve resolution, probably as a
result of stabilized tertiary protein structures and reduced protein adsorption. Both cytokines
were well separated from the excipients HSA and N-acteyltryptophan (Figure 2.4). The
control of temperature of the separation capillary appeared to be essential to yield an
acceptable reproducibility of the migration times during analysis of the dosage form. The
RSD for migration time was within 0.5%, and the RSD for peak area (0.5 mg/mL protein
injected) was below 3.6%.
Figure 2.4. CZE of a pharmaceutical dosage form containing recombinant interleukin-1 alpha (peak 2),HSA (peak 3), N-acetyltryptophan (peak 4), and spiked with recombinant leukocyte A interferon(peak 1) [24]. Reproduced by permission of Elsevier.

Jonatan R. Catai
Efficient capillary electrophoresis of peptides and proteins with bilayer-coated capillaries 31
[36]
UV
(20
0 nm
)U
ncoa
ted
100
mM
sod
ium
bor
ate
(pH
8.9
) w
ith
5 m
M 1
,3 d
iam
inop
ropa
nePr
edic
tion
of
biol
ogic
al
pote
ncy
r Fo
llicl
e-st
imul
atin
g ho
rmon
e
[35]
UV
(21
4 nm
)Po
lybr
ene
400
mM
am
mon
ium
ace
tate
(pH
4.7
5)Se
para
tion
of
glyc
ofor
ms
r E
ryth
ropo
ieti
n
[34]
UV
(21
4 nm
)U
ncoa
ted
10 m
M tr
icin
e, 1
0 m
M N
aCl,
10 m
M
sodi
um a
ceta
te, 7
M u
rea,
and
3.9
mM
di
amin
obut
ane
(pH
5.5
)
Sepa
rati
on o
f gl
ycof
orm
sr
Ery
thro
poie
tin
[33]
UV
(20
0 nm
)eC
AP
amin
e (B
eckm
an)
200
mM
sod
ium
pho
spha
te (
pH 4
.0)
with
1 m
M n
icke
l chl
orid
eSe
para
tion
/qua
ntif
icat
ion
in
form
ulat
ions
con
tain
ing
HSA
r E
ryth
ropo
ieti
n
[32]
UV
(21
4 nm
)Po
lyac
ryla
mid
e10
mM
tric
ine,
10
mM
NaC
l, 10
mM
so
dium
ace
tate
, 7 M
ure
a, a
nd 3
.9 m
M
diam
inob
utan
e (p
H 5
.5)
Sepa
rati
on o
f gl
ycof
orm
s;Pr
otei
n ch
arac
teri
zati
onr
Ery
thro
poie
tin
[31]
UV
(21
4 nm
)U
ncoa
ted
10 m
M tr
icin
e, 1
0 m
M s
odiu
m
chlo
ride
, 10
mM
sod
ium
ace
tate
, 7 M
ur
ea, a
nd 3
.9 m
M d
iam
inob
utan
e (p
H
5.5)
Dis
crim
inat
ion
of r
ecom
bina
nt
and
urin
ary
orig
inr
Ery
thro
poie
tin
[30]
UV
(21
4 nm
)D
B-1
; DB
-17
10 m
M tr
icin
e, 1
0 m
M s
odiu
m
chlo
ride
, 10
mM
sod
ium
ace
tate
, 7 M
ur
ea, a
nd 2
.5 m
M d
iam
inob
utan
e (p
H
5.5)
Sepa
rati
on o
f gl
ycof
orm
sPr
otei
n ch
arac
teri
zati
on
r E
ryth
ropo
ieti
n
[29]
UV
(21
4 nm
)PV
A20
0 m
M 6
-am
ino-
n-ca
proi
c ac
id p
H 4
.8
with
5 m
M C
a2 +Se
para
tion
of
glyc
ofor
ms
Prot
ein
char
acte
riza
tion
r D
eoxy
ribo
nucl
ease
[28]
UV
(20
0 nm
)U
ncoa
ted
100
mM
sod
ium
pho
spha
te (
pH 2
.5)
Sepa
rati
on o
f gl
ycof
orm
sPr
otei
n ch
arac
teri
zatio
nr
Bon
e m
orph
ogen
ic
prot
ein
2
[27]
UV
(20
0 nm
)U
ncoa
ted
50 m
M s
odiu
m b
orat
e (p
H 8
.5)
wit
h 2
mM
dia
min
obut
ane
Det
erm
inat
ion
of d
egra
datio
n pr
oduc
tsA
lkal
ine
phos
phat
ase
from
hum
an p
lace
nta
[26]
UV
(20
0 nm
)U
ncoa
ted
50 m
M s
odiu
m b
orat
e (p
H 8
.5)
wit
h 2
mM
dia
min
obut
ane
Qua
lity
con
trol
Impu
rity
pro
filin
gA
lkal
ine
phos
phat
ase
from
hum
an p
lace
nta
[25]
UV
(21
4 nm
)U
ncoa
ted
50 m
M p
hosp
hate
(pH
2.5
) w
ith
0.25
%
HPM
CPr
otei
n st
abil
ity a
sses
smen
tIm
puri
ty p
rofi
ling
r A
cidi
c fi
brob
last
gr
owth
fac
tor
Ref
.D
etec
tion
Cap
illa
ry C
oati
ngb
BG
EO
bjec
tive
Pro
tein
a
Tabl
e 2.
1.C
ZE
of
Pha
rmac
euti
cal P
rote
ins

Jonatan R. Catai
Efficient capillary electrophoresis of peptides and proteins with bilayer-coated capillaries32
a r, r
ecom
bina
nt.
b DB
-1, d
imet
hyl p
olys
ilox
ane;
DB
-17,
(50
% p
heny
l)-m
ethy
l pol
ysil
oxan
e.
[42]
UV
(214 n
m)
PV
A200 m
Mε-
amin
o-n
-cap
roic
acid
wit
h
50 m
Mac
etic
aci
d (
pH
5.1
)C
har
acte
riza
tion
Gly
cofo
rmse
par
atio
nr
Tis
sue
pla
smin
og
enac
tivat
or
[18]
UV
(214 n
m)
Unco
ated
50 m
Mso
diu
m t
etra
bo
rate
(pH
8.3
) w
ith
2.5
mM
lith
ium
chlo
ride
Sep
arat
ion/q
uan
tifi
cati
on
in
form
ula
tio
nr
Monocl
onal
an
tibody a
nti
-TA
C
[24]
UV
(214 n
m)
Unco
ated
50 m
Mso
diu
m t
etra
bo
rate
pH
8.3
w
ith
2.5
mM
lith
ium
chlo
ride
Sep
arat
ion i
n i
nje
ctab
ledosa
ge
form
conta
inin
g H
SA
r L
euko
cyte
A
inte
rfer
on
[41]
UV
(200 n
m),
E
SI-
MS
Unco
ated
20 m
Mam
moniu
m a
ceta
te (
pH
4.2
)S
epar
atio
n a
nd i
den
tifi
cati
on
of
deg
rad
atio
n p
roduct
sr
Inte
rleu
kin
-6
[40]
UV
(200 n
m)
Unco
ated
100 m
Mso
diu
m p
hosp
hat
e (p
H 2
.5)
Char
acte
riza
tion
Nat
ura
l an
d r
in
terl
euk
in-2
[24]
UV
(214 n
m)
Unco
ated
50 m
Mso
diu
m t
etra
bo
rate
pH
8.3
w
ith
2.5
mM
lith
ium
chlo
ride
Sep
arat
ion i
n i
nje
ctab
ledosa
ge
form
conta
inin
g H
SA
Det
erm
inat
ion o
f deg
radat
ion
pro
duct
s
r In
terl
eukin
-1 a
lpha
[22]
UV
(214 n
m)
Unco
ated
100 m
Mso
diu
m b
ora
te (
pH
9.3
)Q
ual
ity c
on
trol
Imp
uri
ty p
rofi
lin
gr
Insu
lin
[23]
UV
(214 n
m)
Unco
ated
50 m
Mso
diu
m p
hosp
hat
e pH
11 a
nd
sodiu
m p
hosp
hat
e (p
H 9
) w
ith 1
0%
M
eOH
Mon
itori
ng p
roduct
ion
pro
cess
Det
erm
inat
ion o
f post
-tr
ansl
atio
nal
modif
icat
ions
and d
egra
dat
ion
pro
duct
s
r In
suli
n
[39]
UV
(214 n
m)
Unco
ated
10 m
Mtr
icin
e-5.8
mM
morp
ho
line-
20
M p
ota
ssiu
m c
hlo
rid
e (p
H 8
.0)
Char
acte
riza
tion i
n
form
ula
tio
nQ
uan
tifi
cati
on
r In
suli
n
[21]
UV
(214 n
m)
Unco
ated
50 m
Mac
etat
e, 8
50 m
MC
HE
S, 1
0%
ac
eto
nit
rile
(v
/v)
(pH
7.8
)Q
uan
tifi
cati
on
Det
erm
inat
ion o
f deg
radat
ion
pro
duct
s
r In
suli
n
[38]
UV
(214 n
m)
Unco
ated
50 m
Mac
etat
e, 8
50 m
MC
HE
S, 1
0%
ac
eto
nit
rile
(v
/v)
(pH
7.8
)Q
uan
tifi
cati
on
r In
suli
n
[37]
UV
(214 n
m)
Unco
ated
50 m
Mphosp
hat
e-5
0 m
Mbora
te (
pH
8.0
) w
ith a
nd w
ithout
2.5
mM
dia
min
obu
tane
Sep
arat
ion o
f gly
cofo
rms
Pro
tein
char
acte
riza
tion
r G
ranu
locy
te-
colo
ny–st
imu
lati
ng
fact
or

Jonatan R. Catai
Efficient capillary electrophoresis of peptides and proteins with bilayer-coated capillaries 33
2.4. Capillary Isoelectric Focusing
2.4.1. Principles and Separation Conditions
Capillary isoelectric focusing (CIEF) is a mode of CE that separates amphoteric
compounds, such as proteins and peptides, according to their differences in isoelectric
point (pI). CIEF offers the possibility to combine the high resolving power of IEF (as
known from conventional gel-IEF) with the advantages of CE instrumentation (i.e.,
automation, on-line detection, and use of high electric field strengths). Proteins that differ
0.005 pI units or even less have successfully been separated with CIEF. In CIEF, a pH
gradient is formed along the capillary using ampholytes (zwitterionic compounds), which
have slightly different pI values spanning the desired pH range (e.g., pH 3–9). The
ampholytes act as strong buffers at their pI. Upon analysis, the capillary is filled with a
mixture of both the ampholytes and the sample. The capillary inlet and anode are then
placed in an acidic solution (anolyte; typically phosphoric acid) and the capillary outlet
and cathode in a basic solution (catholyte; typically sodium hydroxide). After application
of the high voltage, a pH gradient will be formed by the ampholytes ranging from low
(inlet) to high (outlet) pH. According to their electrophoretic mobility, the sample proteins
will migrate through the gradient until they reach a pH region equal to their pI where they
become net uncharged and stop migrating. The protein zones remain narrow (focused), as
a protein that enters a zone of different pH will become charged and migrate back. The
overall focusing process can be followed by monitoring the current, which approaches
zero when the ion movement inside the capillary stops. After focusing, the zones are passed
through the UV detector to produce an electropherogram. This is most commonly
accomplished by adding a salt (e.g., sodium chloride) to the catholyte or by applying pressure
to the capillary inlet.
In CIEF, the EOF needs to be eliminated because it can sweep the ampholytes
from the capillary before focusing is complete. So, usually capillaries with neutral coatings
are used, which are also helpful in reducing protein adsorption. An important advantage of
CIEF is that, in contrast with most other CE techniques, relatively large sample volumes
can be introduced into the capillary, as after injection the analytes are focused to sharp
zones. Clearly, this concentration effect favors analyte detectability, although there also is
a danger that the proteins aggregate and/or precipitate having minimum solubility at their
pI. Most commonly, CIEF employs UV absorbance detection. Unfortunately, most
ampholytes exhibit strong absorbance at wavelengths below 240 nm, so that proteins have
to be detected at 280 nm and cannot be detected in the far UV where protein molar
absorptivities are much higher. In other words, in CIEF the gain in analyte peak concentration
is more or less counterbalanced by a loss in detection sensitivity.
Jonatan R. Catai
Efficient capillary electrophoresis of peptides and proteins with bilayer-coated capillaries34
2.4.2. Applications
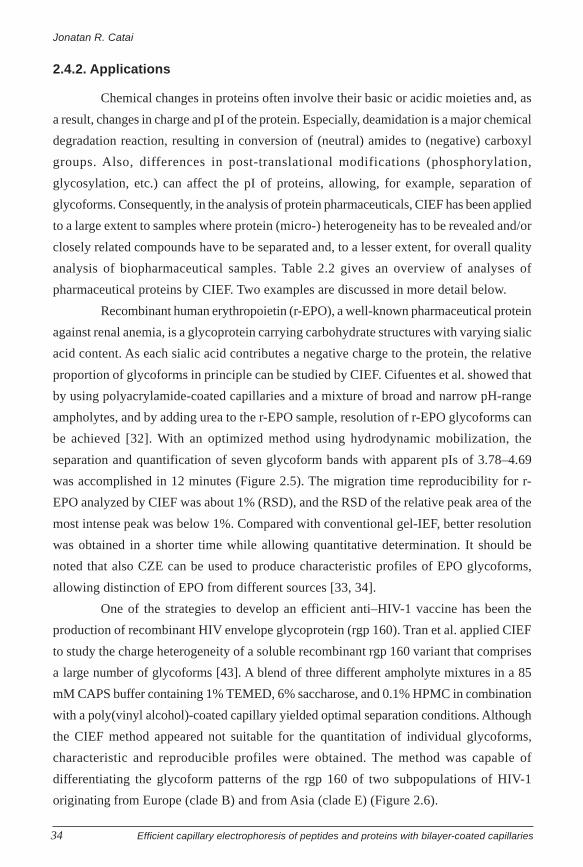
Chemical changes in proteins often involve their basic or acidic moieties and, as
a result, changes in charge and pI of the protein. Especially, deamidation is a major chemical
degradation reaction, resulting in conversion of (neutral) amides to (negative) carboxyl
groups. Also, differences in post-translational modifications (phosphorylation,
glycosylation, etc.) can affect the pI of proteins, allowing, for example, separation of
glycoforms. Consequently, in the analysis of protein pharmaceuticals, CIEF has been applied
to a large extent to samples where protein (micro-) heterogeneity has to be revealed and/or
closely related compounds have to be separated and, to a lesser extent, for overall quality
analysis of biopharmaceutical samples. Table 2.2 gives an overview of analyses of
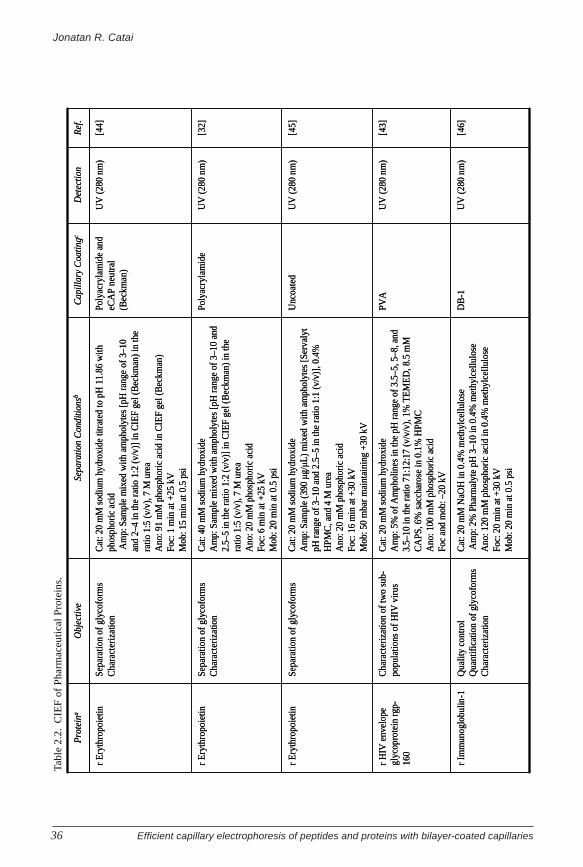
pharmaceutical proteins by CIEF. Two examples are discussed in more detail below.
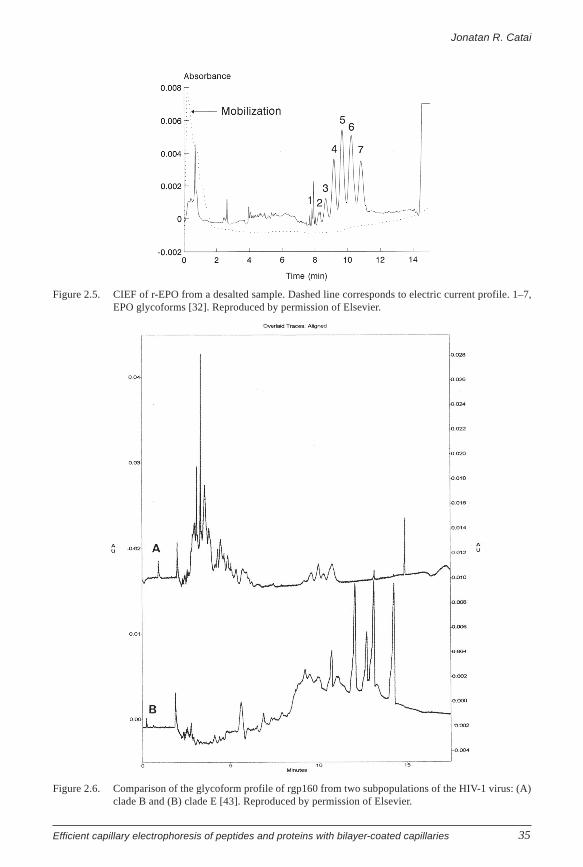
Recombinant human erythropoietin (r-EPO), a well-known pharmaceutical protein
against renal anemia, is a glycoprotein carrying carbohydrate structures with varying sialic
acid content. As each sialic acid contributes a negative charge to the protein, the relative
proportion of glycoforms in principle can be studied by CIEF. Cifuentes et al. showed that
by using polyacrylamide-coated capillaries and a mixture of broad and narrow pH-range
ampholytes, and by adding urea to the r-EPO sample, resolution of r-EPO glycoforms can
be achieved [32]. With an optimized method using hydrodynamic mobilization, the
separation and quantification of seven glycoform bands with apparent pIs of 3.78–4.69
was accomplished in 12 minutes (Figure 2.5). The migration time reproducibility for r-
EPO analyzed by CIEF was about 1% (RSD), and the RSD of the relative peak area of the
most intense peak was below 1%. Compared with conventional gel-IEF, better resolution
was obtained in a shorter time while allowing quantitative determination. It should be
noted that also CZE can be used to produce characteristic profiles of EPO glycoforms,
allowing distinction of EPO from different sources [33, 34].
One of the strategies to develop an efficient anti–HIV-1 vaccine has been the
production of recombinant HIV envelope glycoprotein (rgp 160). Tran et al. applied CIEF
to study the charge heterogeneity of a soluble recombinant rgp 160 variant that comprises
a large number of glycoforms [43]. A blend of three different ampholyte mixtures in a 85
mM CAPS buffer containing 1% TEMED, 6% saccharose, and 0.1% HPMC in combination
with a poly(vinyl alcohol)-coated capillary yielded optimal separation conditions. Although
the CIEF method appeared not suitable for the quantitation of individual glycoforms,
characteristic and reproducible profiles were obtained. The method was capable of
differentiating the glycoform patterns of the rgp 160 of two subpopulations of HIV-1
originating from Europe (clade B) and from Asia (clade E) (Figure 2.6).
Jonatan R. Catai
Efficient capillary electrophoresis of peptides and proteins with bilayer-coated capillaries 35
Figure 2.5. CIEF of r-EPO from a desalted sample. Dashed line corresponds to electric current profile. 1–7,EPO glycoforms [32]. Reproduced by permission of Elsevier.
Figure 2.6. Comparison of the glycoform profile of rgp160 from two subpopulations of the HIV-1 virus: (A)clade B and (B) clade E [43]. Reproduced by permission of Elsevier.
Jonatan R. Catai
Efficient capillary electrophoresis of peptides and proteins with bilayer-coated capillaries36
Tabl
e 2.
2.C
IEF
of
Pha
rmac
euti
cal P
rote
ins.
[46]
UV
(280
nm
)D
B-1
Cat
: 20
mM
NaO
H in
0.4
% m
ethy
lcel
lulo
seA
mp:
2%
Pha
rmal
yte
pH 3
–10
in 0
.4%
met
hylc
ellu
lose
Ano
: 120
mM
phos
phor
ic a
cid
in 0
.4%
met
hylc
ellu
lose
Foc:
20
min
at +
30 k
V
Mob
: 20
min
at 0
.5 p
si
Qua
lity
cont
rol
Qua
ntif
icat
ion
of g
lyco
form
sC
hara
cter
izat
ion
r Im
mun
oglo
bulin
-1
[43]
UV
(280
nm
)PV
AC
at: 2
0 m
Mso
dium
hyd
roxi
de
Am
p: 5
% o
f Am
phol
ines
in th
e pH
rang
e of
3.5
–5, 5
–8, a
nd
3.5–
10 in
the
ratio
71:
12:1
7 (v
/v/v
), 1%
TE
ME
D, 8
.5 m
MC
APS
, 6%
sac
char
ose
in 0
.1%
HPM
CA
no: 1
00 m
Mph
osph
oric
aci
dFo
can
d m
ob: –
20 k
V
Cha
ract
eriz
atio
n of
two
sub-
popu
latio
ns o
f HIV
vir
us
r HIV
env
elop
e gl
ycop
rote
in rg
p-16
0
[45]
UV
(280
nm
)U
ncoa
ted
Cat
: 20
mM
sodi
um h
ydro
xide
Am
p: S
ampl
e (3
90 µ
g/µL
) mix
ed w
ith a
mph
olyt
es [S
erva
lyt
pH ra
nge
of 3
–10
and
2.5–
5 in
the
ratio
1:1
(v/v
)], 0
.4%
H
PMC
, and
4 M
ure
aA
no: 2
0 m
Mph
osph
oric
aci
dFo
c: 1
6 m
in a
t +30
kV
Mob
: 50
mba
r mai
ntai
ning
+30
kV
Sepa
ratio
n of
gly
cofo
rms
r Ery
thro
poie
tin
[32]
UV
(280
nm
)Po
lyac
ryla
mid
eC
at: 4
0 m
Mso
dium
hyd
roxi
deA
mp:
Sam
ple
mix
ed w
ith a
mph
olyt
es [p
H ra
nge
of 3
–10
and
2.5–
5 in
the
ratio
1:2
(v/v
)] in
CIE
F ge
l (B
eckm
an) i
n th
e ra
tio 1
:5 (v
/v),
7 M
ure
aA
no: 2
0 m
Mph
osph
oric
aci
dFo
c: 6
min
at +
25 k
V
Mob
: 20
min
at 0
.5 p
si
Sepa
ratio
n of
gly
cofo
rms
Cha
ract
eriz
atio
n r E
ryth
ropo
ietin
[44]
UV
(280
nm
)Po
lyac
ryla
mid
e an
d eC
AP
neut
ral
(Bec
kman
)
Cat
: 20
mM
sodi
um h
ydro
xide
titr
ated
to p
H 1
1.86
with
ph
osph
oric
aci
dA
mp:
Sam
ple
mix
ed w
ith a
mph
olyt
es [p
H ra
nge
of 3
–10
and
2–4
in th
e ra
tio 1
:2 (v
/v)]
in C
IEF
gel (
Bec
kman
) in
the
ratio
1:5
(v/v
), 7
M u
rea
Ano
: 91
mM
phos
phor
ic a
cid
in C
IEF
gel (
Bec
kman
)Fo
c: 1
min
at +
25 k
V
Mob
: 15
min
at 0
.5 p
si
Sepa
ratio
n of
gly
cofo
rms
Cha
ract
eriz
atio
nr E
ryth
ropo
ietin
Ref
.D
etec
tion
Cap
illar
y C
oatin
gcSe
para
tion
Con
ditio
nsb
Obj
ectiv
eP
rote
ina

Jonatan R. Catai
Efficient capillary electrophoresis of peptides and proteins with bilayer-coated capillaries 37
a r, r
ecom
bina
nt.
b Cat
, cat
holy
te; A
mp,
am
phol
yte;
Ano
, ano
lyte
; Foc
, foc
usin
g; M
ob, m
obil
izat
ion.
c DB
-1, d
imet
hyl p
olys
ilox
ane.
[42]
UV
(28
0 nm
)eC
AP
neut
ral
(Bec
kman
)C
at: 1
0 m
Mso
dium
hyd
roxi
deA
mp:
Sam
ple
(320
µg/µL
) m
ixed
wit
h 1.
3% (
v/v)
am
phol
ytes
pH
ran
ge o
f 3–
10 (
Am
phol
ine,
Pha
rmal
yte
and
Ser
valy
t), a
nd 4
.8 M
ure
aA
no: 9
1 m
Mph
osph
oric
aci
dF
oc: 2
min
at +
13.5
kV
Mob
: 35
mba
r
Sep
arat
ion
of g
lyco
form
sC
hara
cter
izat
ion
r T
issu
e-ty
pe
plas
min
ogen
acti
vato
r
[45]
UV
(28
0 nm
)U
ncoa
ted
Cat
: 20
mM
sodi
um h
ydro
xide
Am
p: S
ampl
e (3
90 µ
g/µL
) m
ixed
wit
h am
phol
ytes
(S
erva
lyt
pH r
ange
of
3–10
and
2.5
–5 in
the
rati
o 1:
1 (v
/v))
, 0.4
%
HP
MC
, and
4 M
ure
aA
no: 2
0 m
Mph
osph
oric
aci
dF
oc: 1
6 m
in a
t +30
kV
Mob
: 50
mba
r m
aint
aini
ng +
30 k
V
Sep
arat
ion
of g
lyco
form
sr
Tis
sue-
type
pl
asm
inog
enac
tiva
tor
[49]
UV
(28
0 nm
)eC
AP
neut
ral
(Bec
kman
)C
at: 2
0 m
Mso
dium
hyd
roxi
deA
mp:
Sam
ple
(125
µg/
mL
), 4
M u
rea,
0.1
% (
w/v
) H
PM
C.
0.75
% (
v/v)
TE
ME
D a
nd 3
% (
w/v
) am
phol
ytes
pH
3–1
0 (P
harm
alyt
e, A
mph
olin
e, B
io-l
yte
and
Ser
valy
tA
no: 1
0 m
Mph
osph
oric
aci
dF
oc: a
nd M
ob: 1
0 m
in a
t –13
.5 k
V
Sep
arat
ion
of g
lyco
form
sC
hara
cter
izat
ion
r T
issu
e-ty
pe
plas
min
ogen
acti
vato
r
[48]
ESI
-MS
Pol
yacr
ylam
ide
Cat
: 20
mM
sodi
um h
ydro
xide
Am
p: 0
.05%
Pha
rmal
yte
pH 3
–10
and
0.05
% T
EM
ED
Ano
: 20
mM
phos
phor
ic a
cid
Foc
: 10
min
at +
10 k
VM
ob: r
aisi
ng th
e in
let s
ide
to 1
0 cm
abo
ve th
e le
vel o
f th
e el
ectr
ospr
ay n
eedl
e
Cha
ract
eriz
atio
n of
ref
oldi
ng
proc
ess
Rib
onuc
leas
eA
(b
ovin
e pa
ncre
atic
)
[47]
UV
(28
0 nm
)P
olya
cryl
amid
eC
at: 4
0 m
Mso
dium
hyd
roxi
deA
mp:
a s
olut
ion
(2%
w/v
) co
nsis
ted
of a
8:1
:1 r
atio
P
harm
alyt
epH
8–1
0.5,
Bio
-lyt
epH
7–9
, Bio
-lyt
epH
3–1
0 co
ntai
ning
0.5
% (
v/v)
TE
ME
D, a
nd 0
.2%
(w
/v)
HP
MC
Ano
: 20
mM
phos
phor
ic a
cid
Foc
: 17
min
at +
15 k
VM
ob: 3
0 m
in a
t 0.5
psi
Qua
lity
con
trol
Sep
arat
ion
of g
lyco
form
sC
hara
cter
izat
ion
r M
onoc
lona
l an
tibo
dy H
ER
2

Jonatan R. Catai
Efficient capillary electrophoresis of peptides and proteins with bilayer-coated capillaries38
2.5. Capillary Gel Electrophoresis
2.5.1. Principles and Separation Conditions
Capillary gel electrophoresis (CGE) is a CE mode in which separation is based on
differences in molecular size. Separation is achieved by electrophoresis of charged
macromolecular analytes through a capillary filled with a “gel” that acts as a molecular
sieve. During their migration through the gel, larger molecules are hindered more than
smaller ones. Having a similar separation mechanism, CGE is readily comparable with
traditional slab gel electrophoresis (PAGE). However, CGE offers the advantage of up to
100-fold higher electric fields, on-capillary detection, instrumental automation, and ease
of use. The preparative and multilane capacity of PAGE is difficult to reproduce in the
capillary format, although the much shorter analysis times of CGE and the recent
introduction of multicapillary CE systems (partly) compensate for this. Analogous to PAGE,
in CGE rigid, cross-linked polyacrylamide was used initially as separation matrix in the
capillary, but these gels were not easy to make reproducibly and suffered from clogging
and instability. An important breakthrough for CGE came in the 1990s with the advent of
linear, non–cross-linked polymers, which have relatively low viscosity and can easily be
replaced. These “liquid” polymers form entangled networks in solution and give excellent
separations of DNA, RNA, and protein molecules of different size. Best results are obtained
under EOF-suppressed conditions using permanently or dynamically coated capillaries.
In order to achieve purely size-based separations of proteins in CGE, the proteins
of interest are usually denaturated and complexed with sodium dodecyl sulfate (SDS)
prior to analysis. Because the charge-to-size ratio of SDS-protein complexes is almost
protein independent, the proteins will have virtually identical effective electrophoretic
mobilities and, therefore, will only be discriminated on their size by the sieving polymer
matrix (which also contains SDS). By running protein standards as well, good estimates of
the molecular weight of unknown proteins can be achieved. It should be noted that this
may not be true for glycoproteins, as the carbohydrate structures do not bind the negatively
charged SDS molecules. An additional advantage of SDS-CGE is that fluorescent labeling
of proteins does not affect the separation performance. As derivatization with the commonly
small fluorescent labels hardly affects the overall size of the protein and complexation
with SDS cancels out charge differences, in SDS-CGE one peak will be obtained for one
protein, irrespective of the number of labels bound.

Jonatan R. Catai
Efficient capillary electrophoresis of peptides and proteins with bilayer-coated capillaries 39
2.5.2. Applications
CGE monitors protein size and therefore is more useful for providing an overall
picture of the composition of a protein sample and less suited for the analysis of subtle
changes in a protein. Thus, in the analysis of pharmaceutical proteins, CGE is mainly used
to check for the presence of other proteins, protein aggregates, or protein degradation
fragments during characterization, purity, and/or stability studies. Table 2.3 summarizes
the application of CGE in biopharmaceutical analysis; below some examples are outlined.
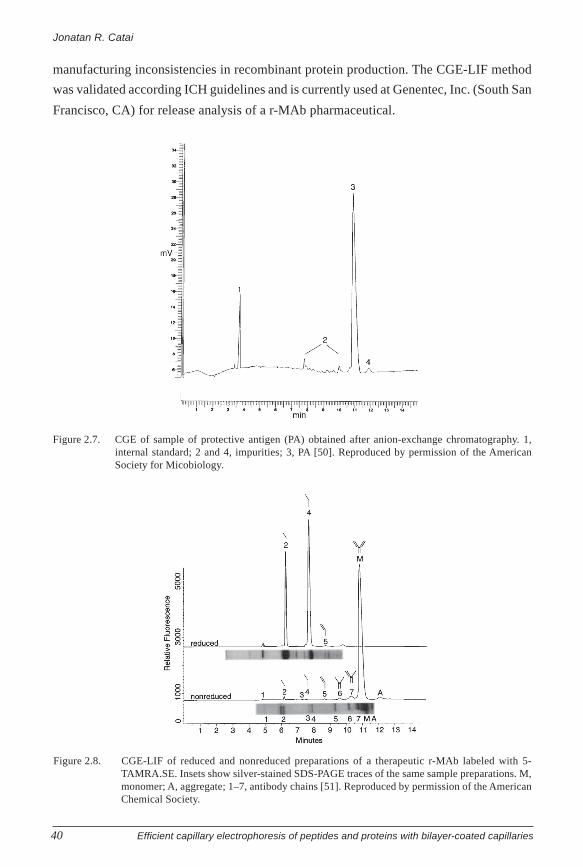
Farchaus et al. applied CGE to study the purity of the active compound, termed
protective antigen (PA), of the human anthrax vaccine [50]. PA is the B subunit (Mr 83,000)
of the AB-type exotoxin of Bacillus anthracis and is produced recombinantly. Figure 2.7
shows the CGE analysis of the final PA product obtained after purification by anion-
exchange chromatography (AEC). Before analysis, the PA sample was diluted in buffer
containing SDS and 2-mercaptoethanol (for denaturation), and for separation a commercial
sieving polymer was used with a 42-cm fused-silica capillary. Next to the main compound
(3) and the internal standard (1), various proteinaceous impurities (2, 4) could be observed
(Figure 2.7). Overall integration of all the peaks yielded a final PA purity of 90% for this
lot. CGE analysis of the same PA after purification with hydrophobic interaction
chromatography (HIC) revealed a final purity of 98% (not shown) and indicated that the
HIC step was extremely effective in removing impurity 4.
The advantages of using CGE with LIF detection was well illustrated by Hunt
and Nashabeh for the analysis of humanized recombinant IgG1-monoclonal antibodies (r-
MAb), a class of proteins that is increasingly applied for therapeutic purposes [51]. To
allow CGE-LIF, the r-MAb was first derivatized with a rhodamine succinimidyl ester (5-
TAMRA.SE) and then incubated and heated in the presence of SDS. A commercial CGE
buffer was used with a 24-cm fused silica capillary installed in a CE instrument equipped
with a LIF detector employing 488 nm for excitation. Figure 2.8 shows the results of the
CGE-LIF analysis of nonreduced and reduced preparations of a therapeutic r-MAb. The
light and heavy chains (and their combinations) originating from the antibody were nicely
separated, and the obtained profiles compared well with silver-stained PAGE, except that
the light chain apparently was more reactive with the silver stain than the heavy chain
(Figure 2.8). Repeated analysis showed that RSD values for the migration time were below
1%, and the RSD of the area of the main peak was lower than 0.6%. Compared with CGE-
UV, a 140-fold increase of sensitivity was achieved with CGE-LIF, allowing detection of
minor peaks, which were undetected with UV detection. It was further shown that also
nonrelated proteinaceous impurities in r-MAb preparations could be detected at low levels
and that the CGE-LIF system could readily resolve various common r-MAb proteolytic
fragments. These applications demonstrate the usefulness of this technology for detecting
Jonatan R. Catai
Efficient capillary electrophoresis of peptides and proteins with bilayer-coated capillaries40
Figure 2.7. CGE of sample of protective antigen (PA) obtained after anion-exchange chromatography. 1,internal standard; 2 and 4, impurities; 3, PA [50]. Reproduced by permission of the AmericanSociety for Micobiology.
Figure 2.8. CGE-LIF of reduced and nonreduced preparations of a therapeutic r-MAb labeled with 5-TAMRA.SE. Insets show silver-stained SDS-PAGE traces of the same sample preparations. M,monomer; A, aggregate; 1–7, antibody chains [51]. Reproduced by permission of the AmericanChemical Society.
manufacturing inconsistencies in recombinant protein production. The CGE-LIF method
was validated according ICH guidelines and is currently used at Genentec, Inc. (South San
Francisco, CA) for release analysis of a r-MAb pharmaceutical.

Jonatan R. Catai
Efficient capillary electrophoresis of peptides and proteins with bilayer-coated capillaries 41
Tabl
e 2.
3.C
GE
of
Pha
rmac
euti
cal P
rote
ins.
a r, r
ecom
bina
nt.
[42
]U
V (
280 n
m)
eCA
Pn
eutr
al
(Bec
km
an)
eCA
PS
DS
14-2
00
gel
buff
er (
Bec
km
an)
Ch
arac
teri
zati
on
r T
issu
e p
lasm
ino
gen
acti
vat
or
[57
]U
V (
214 n
m)
γ-(a
crylo
xypro
pyl)
m
eth
yld
ich
loro
sila
ne
coat
ed
375 m
MT
ris
(pH
8.8
) w
ith 0
.1%
SD
S-
eth
yle
ne
gly
col
Ch
arac
teri
zati
on
Qu
anti
fica
tio
nr
So
luble
CD
4-P
E
[50
]U
V (
215 n
m)
Un
coat
edP
roS
ort
SD
S-p
rote
in a
nal
ysi
s re
agen
t (P
erk
in E
lmer
Ap
pli
ed B
iosy
stem
s)C
har
acte
riza
tio
nP
rote
ctiv
e an
tig
en
of
leth
al t
ox
in a
nd
ed
ema
tox
in
secr
eted
by
B
acil
lus
anth
raci
s
[56
]U
V (
214 n
m)
eCA
PS
DS
-20
0
(Bec
km
an)
eCA
PS
DS
-200 p
rote
in k
it (
Bec
km
an)
Ch
arac
teri
zati
on
of
pu
rifi
cati
on
ste
ps
r N
AD
(+)-
dep
enden
t fo
rmat
e d
ehyd
rog
enas
e
[47
]U
V (
214 n
m)
Un
coat
edS
DS
-runnin
g b
uff
er (
Bio
Rad
)P
rote
in s
tab
ilit
y a
sses
smen
tQ
uan
tifi
cati
on
Imp
uri
ty p
rofi
lin
g
r M
on
ocl
on
al
anti
bo
dy
HE
R2
[51
]U
V (
220 n
m)
and
LIF
(ex
cita
tio
n
48
8 n
m,
det
ecti
on
5
60
nm
)
Un
coat
edC
E-S
DS
pro
tein
kit
(B
ioR
ad)
Imp
uri
ty p
rofi
lin
gS
epar
atio
n o
f d
iges
ted
fr
agm
ents
r Im
mu
noglo
buli
n
1-
mo
no
clo
nal
an
tib
od
y
[55
]U
V (
220 n
m)
Un
coat
edC
E-S
DS
pro
tein
kit
(B
ioR
ad)
Ch
arac
teri
zati
on
D
eter
min
atio
n o
f d
egra
dat
ion
p
rod
uct
s
Imm
un
og
lob
uli
n G
(v
ario
us
sou
rces
)
[54
]U
V (
214 n
m)
eCA
PS
DS
-20
0
(Bec
km
an)
eCA
PS
DS
-200 p
rote
in k
it (
Bec
km
an)
Ch
arac
teri
zati
on
of
red
uce
d
and nonre
duce
dfo
rms
r C
ilia
ryn
euro
tro
ph
icfa
cto
r
[53
]U
V (
214 m
)U
nco
ated
100 m
MC
HE
S (
pH
8.5
) w
ith
0.1
% S
DS
an
d 5
% p
oly
(et
hyle
ne
oxid
e) (
MW
1
00
,00
0)
Ch
arac
teri
zati
on
r B
rain
der
ived
n
euro
tro
ph
icfa
cto
r
[52
]U
V (
214 n
m)
Un
coat
edeC
AP
SD
S 1
4-2
00
gel
buff
er (
Bec
km
an)
Ch
arac
teri
zati
on
Qu
anti
fica
tio
nr
Ap
oli
pro
tein
E3
[26
]U
V (
200 n
m)
Un
coat
edC
E-S
DS
pro
tein
kit
(B
ioR
ad)
Ch
arac
teri
zati
on
Alk
alin
e p
ho
sph
atas
efr
om
h
um
an p
lace
nta
Ref
.D
etec
tio
nC
ap
illa
ry C
oa
tin
gS
epa
rati
on
Co
nd
itio
ns
Ob
ject
ive
Pro
tein
a

Jonatan R. Catai
Efficient capillary electrophoresis of peptides and proteins with bilayer-coated capillaries42
2.6. Capillary Electrophoresis-Mass Spectrometry
Mass spectrometry (MS) is nowadays an important and powerful tool for the
analysis and characterization of proteins. The multiple charging of proteins observed in
electrospray ionization (ESI) allows their analysis on MS instruments with mass ranges
far below the molecular masses of the proteins. MS detection can considerably enhance
the utility of CE by providing information about the identity of the separated compounds.
In purity and stability studies, the availability of MS data is highly desirable.
Characterization of peaks by molecular mass strongly adds to the reliability of their
assignment and is very helpful when conditions are changed and cross-correlations have
to be made. Therefore, for quality control (e.g., when changes in proteins during storage or
exposure are monitored), CE-MS is an attractive approach.
2.6.1. Coupling Modes and Separation Conditions
In CE-MS, the outlet of the separation capillary has to be connected to the ion
source of the mass spectrometer, and obviously, no outlet buffer vial can be used. Still, CE
requires a closed electrical circuit and, therefore, a CE-MS interface should provide a
means to apply voltage to capillary outlet. Two approaches can roughly be discerned to
achieve this [58]. In the first one, an additional liquid is used to apply the voltage indirectly
to the CE buffer. A very popular and widely used example of this approach is the so-called
sheath liquid interface. In this interface, the separation capillary is surrounded by a second
tube of larger diameter in a coaxial arrangement (Figure 2.9). The supportive “sheath”
liquid (e.g., acetonitrile-water acidified with formic acid) is led through the outer tube and
merges with the CE effluent at the capillary outlet. The terminating CE voltage is now
applied to the sheath liquid. Most often, a third tube guiding a stream of gas surrounds this
arrangement to aid nebulization into the electrospray (ES) ion source. As the sheath-liquid
flow rates are of the order 3-15 µL/min, a conventional ES ion source as normally used for
HPLC-MS can be applied. In the second CE-MS approach, the voltage is applied directly
to the CE buffer. This can be achieved by putting a metal coating to the end of the separation
capillary or by connecting a metal-coated, full metal, or conductive polymeric sprayer tip
to the CE outlet. Another option is the insertion of microelectrode through the wall of the
capillary end. The inherently low flow emerging from the CE capillary requires the use of
special nano-electrospray ion sources. Although less robust when compared to sheath-liquid
interfaces, these sheathless setups offer a strongly improved sensitivity.
The presence of nonvolatile buffer constituents can be problematic when CE is coupled
on-line to MS. Especially species like phosphate and SDS can give serious suppression of the
intensity of MS signals of proteins when ESI is used. This phenomenon practically precludes

Jonatan R. Catai
Efficient capillary electrophoresis of peptides and proteins with bilayer-coated capillaries 43
the possibility of coupling, for example, CGE (which uses high SDS concentrations in the
separation buffer) with ESI-MS. Thus, until now in CZE-MS, most often BGEs such as formic
acid or ammonium acetate are applied, which are volatile and can be evaporated in the ESI
interface. It should be noted that these types of buffer may not provide the conditions for
optimal efficiency and/or selectivity in CE. Recently, it was demonstrated that also borate
buffers might be used for on-line CE-MS of proteins [59].
Figure 2.9. Schematic representation of a sheath-liquid interface for CE-ESI-MS.
2.6.2. Applications
During the production of biopharmaceuticals, analytical techniques that are able
to identify compounds present in process samples and final formulations are of great value.
Using a CE-MS approach for this purpose, ideally CE provides the efficient separation of
sample constituents, while MS analysis allows the identification of the separated
compounds. Several studies on the use of CE-MS for the analysis of pharmaceutical proteins
have been reported. In one example, CE-MS is used for the identification of variants of
human insulin-like growth factor 1 (IGF-1), a protein that mediates many of the anabolic
effects of human growth hormone. Recombinant DNA technology is used to produce
substantial quantities of IGF-1; however, during the cellular production of the protein,
several variants are obtained. Nashabeh et al. designed a CZE method to resolve these
closely related variants and combined the CE instrument with ESI-MS using a sheath-
liquid interface [60]. Applying a polyacrylamide-coated capillary with a BGE containing
aminocaproic acid, acetic acid, and DAPS, four out of the five variants present in the IGF-
1 samples could be separated. Interestingly, IGF-1 and improperly folded IGF-1, which
have identical molecular weights, were baseline resolved by CZE. The MS provided the
additional selectivity to distinguish and identify all five IGF-1 variants, which were at the
100-femtomol level in the sample. The molecular weight calculated from the measured
spectra nicely matched the ones expected for the respective variants (Table 2.4).
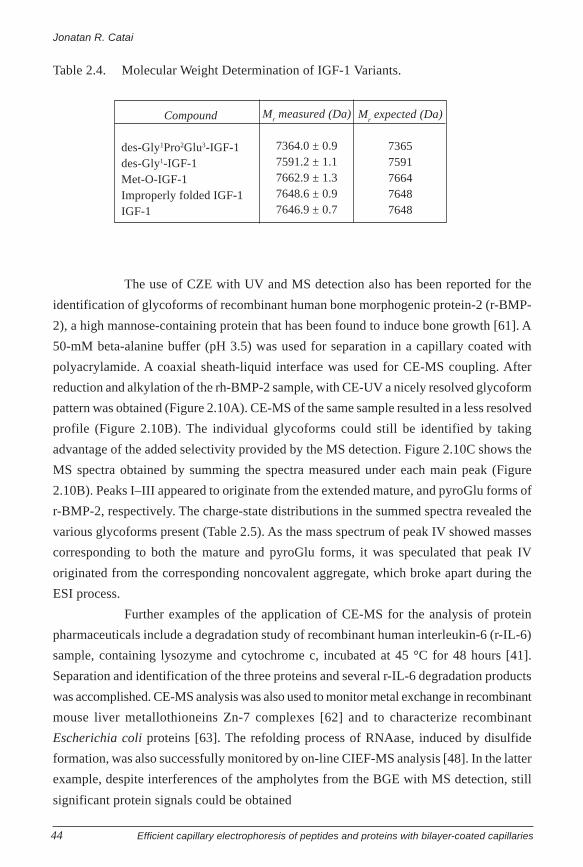
Jonatan R. Catai
Efficient capillary electrophoresis of peptides and proteins with bilayer-coated capillaries44
Table 2.4. Molecular Weight Determination of IGF-1 Variants.
The use of CZE with UV and MS detection also has been reported for the
identification of glycoforms of recombinant human bone morphogenic protein-2 (r-BMP-
2), a high mannose-containing protein that has been found to induce bone growth [61]. A
50-mM beta-alanine buffer (pH 3.5) was used for separation in a capillary coated with
polyacrylamide. A coaxial sheath-liquid interface was used for CE-MS coupling. After
reduction and alkylation of the rh-BMP-2 sample, with CE-UV a nicely resolved glycoform
pattern was obtained (Figure 2.10A). CE-MS of the same sample resulted in a less resolved
profile (Figure 2.10B). The individual glycoforms could still be identified by taking
advantage of the added selectivity provided by the MS detection. Figure 2.10C shows the
MS spectra obtained by summing the spectra measured under each main peak (Figure
2.10B). Peaks I–III appeared to originate from the extended mature, and pyroGlu forms of
r-BMP-2, respectively. The charge-state distributions in the summed spectra revealed the
various glycoforms present (Table 2.5). As the mass spectrum of peak IV showed masses
corresponding to both the mature and pyroGlu forms, it was speculated that peak IV
originated from the corresponding noncovalent aggregate, which broke apart during the
ESI process.
Further examples of the application of CE-MS for the analysis of protein
pharmaceuticals include a degradation study of recombinant human interleukin-6 (r-IL-6)
sample, containing lysozyme and cytochrome c, incubated at 45 °C for 48 hours [41].
Separation and identification of the three proteins and several r-IL-6 degradation products
was accomplished. CE-MS analysis was also used to monitor metal exchange in recombinant
mouse liver metallothioneins Zn-7 complexes [62] and to characterize recombinant
Escherichia coli proteins [63]. The refolding process of RNAase, induced by disulfide
formation, was also successfully monitored by on-line CIEF-MS analysis [48]. In the latter
example, despite interferences of the ampholytes from the BGE with MS detection, still
significant protein signals could be obtained
Compound
des-Gly1Pro2Glu3-IGF-1des-Gly1-IGF-1Met-O-IGF-1Improperly folded IGF-1IGF-1
Mr measured (Da)
7364.0 ± 0.97591.2 ± 1.17662.9 ± 1.37648.6 ± 0.97646.9 ± 0.7
Mr expected (Da)
73657591766476487648
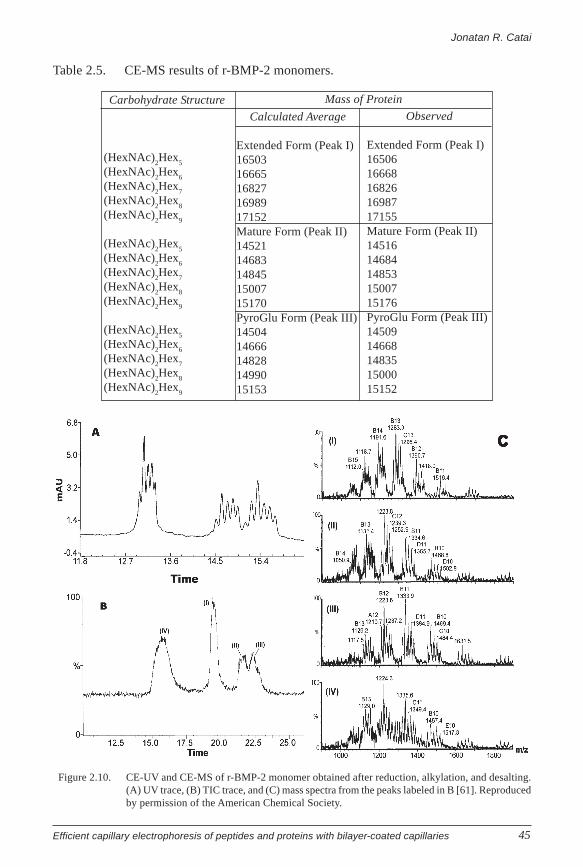
Jonatan R. Catai
Efficient capillary electrophoresis of peptides and proteins with bilayer-coated capillaries 45
Figure 2.10. CE-UV and CE-MS of r-BMP-2 monomer obtained after reduction, alkylation, and desalting.(A) UV trace, (B) TIC trace, and (C) mass spectra from the peaks labeled in B [61]. Reproducedby permission of the American Chemical Society.
Table 2.5. CE-MS results of r-BMP-2 monomers.
Carbohydrate Structure
(HexNAc)2Hex
5
(HexNAc)2Hex
6
(HexNAc)2Hex
7
(HexNAc)2Hex
8
(HexNAc)2Hex
9
(HexNAc)2Hex
5
(HexNAc)2Hex
6
(HexNAc)2Hex
7
(HexNAc)2Hex
8
(HexNAc)2Hex
9
(HexNAc)2Hex
5
(HexNAc)2Hex
6
(HexNAc)2Hex
7
(HexNAc)2Hex
8
(HexNAc)2Hex
9
Calculated Average
Extended Form (Peak I)1650316665168271698917152Mature Form (Peak II)1452114683148451500715170PyroGlu Form (Peak III)1450414666148281499015153
Mass of Protein
Observed
Extended Form (Peak I)1650616668168261698717155Mature Form (Peak II)1451614684148531500715176PyroGlu Form (Peak III)1450914668148351500015152
Jonatan R. Catai
Efficient capillary electrophoresis of peptides and proteins with bilayer-coated capillaries46
2.7. Affinity Capillary Electrophoresis
In the previous sections of this chapter, CE in its various modes was applied as a
mere separation tool, particularly used to achieve resolution of sample constituents of
biopharmaceutical samples. However, as the electrophoretic mobility is a function of
molecular size, shape, and charge, CE in principle can also be used to probe physicochemical
parameters of analyzed proteins. In affinity capillary electrophoresis (ACE), the measured
electrophoretic characteristics of a protein-ligand complex are used to assess (the extent
of) protein binding.
2.7.1. Principles and Separation Conditions
ACE is a relatively new technique that can be used for the study of biomolecular
noncovalent interactions and determination of binding/dissociation constants of protein
complexes [64-66]. In ACE, changes in the electrophoretic mobility of a protein are
correlated to the binding of the protein with a ligand. In a typical ACE experiment, the
ligand (or protein) under study is added to the BGE at various concentrations. At each
concentration, the potentially binding protein (or ligand) is injected into the capillary and
its migration time is measured. During electrophoresis, protein-ligand interactions might
occur that lead to changes in the electrophoretic mobility of the protein. Quantitative
measurement of these mobility shifts allows determination of the protein-ligand binding
constants. The advantage of ACE is that the analyzed sample does not have to be pure and
that more proteins can be assessed in one run. Requirement for the described approach is
that the protein-ligand complexation kinetics (the “on-off rate”) is relatively fast, which
often is the case. When the kinetics for establishing equilibrium conditions in protein–
ligand complex formation are slow with respect to the time required for analysis, the protein
and the ligand can be incubated until equilibrium is reached. Then, an aliquot of the mixture
is injected, and CE is used to differentiate quantitatively between the free and bound forms
of the protein.
2.7.2. Applications
The interaction of proteins with specific ligands such as drugs and toxins is among
the important aspects of biological studies in drug discovery and pharmaceutical
development processes. Until now, ACE has mainly been applied for binding studies of
low-molecular-weight drugs with serum proteins. Some researchers, however, have
recognized that ACE can also be useful for the investigation of the binding of protein
pharmaceuticals (and related species) with compounds of interest. Table 2.6 lists several
of these ACE applications and some examples are treated in more detail below.
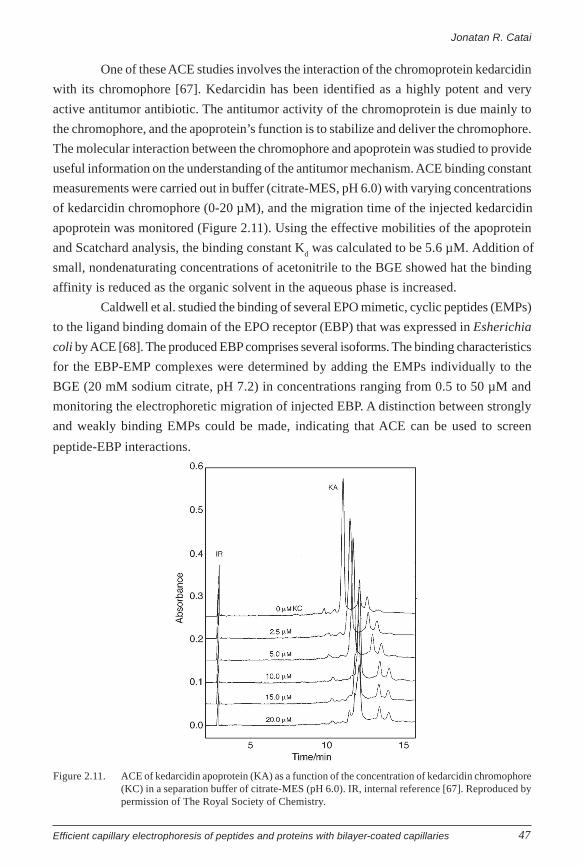
Jonatan R. Catai
Efficient capillary electrophoresis of peptides and proteins with bilayer-coated capillaries 47
One of these ACE studies involves the interaction of the chromoprotein kedarcidin
with its chromophore [67]. Kedarcidin has been identified as a highly potent and very
active antitumor antibiotic. The antitumor activity of the chromoprotein is due mainly to
the chromophore, and the apoprotein’s function is to stabilize and deliver the chromophore.
The molecular interaction between the chromophore and apoprotein was studied to provide
useful information on the understanding of the antitumor mechanism. ACE binding constant
measurements were carried out in buffer (citrate-MES, pH 6.0) with varying concentrations
of kedarcidin chromophore (0-20 µM), and the migration time of the injected kedarcidin
apoprotein was monitored (Figure 2.11). Using the effective mobilities of the apoprotein
and Scatchard analysis, the binding constant Kd was calculated to be 5.6 µM. Addition of
small, nondenaturating concentrations of acetonitrile to the BGE showed hat the binding
affinity is reduced as the organic solvent in the aqueous phase is increased.
Caldwell et al. studied the binding of several EPO mimetic, cyclic peptides (EMPs)
to the ligand binding domain of the EPO receptor (EBP) that was expressed in Esherichia
coli by ACE [68]. The produced EBP comprises several isoforms. The binding characteristics
for the EBP-EMP complexes were determined by adding the EMPs individually to the
BGE (20 mM sodium citrate, pH 7.2) in concentrations ranging from 0.5 to 50 µM and
monitoring the electrophoretic migration of injected EBP. A distinction between strongly
and weakly binding EMPs could be made, indicating that ACE can be used to screen
peptide-EBP interactions.
Figure 2.11. ACE of kedarcidin apoprotein (KA) as a function of the concentration of kedarcidin chromophore(KC) in a separation buffer of citrate-MES (pH 6.0). IR, internal reference [67]. Reproduced bypermission of The Royal Society of Chemistry.
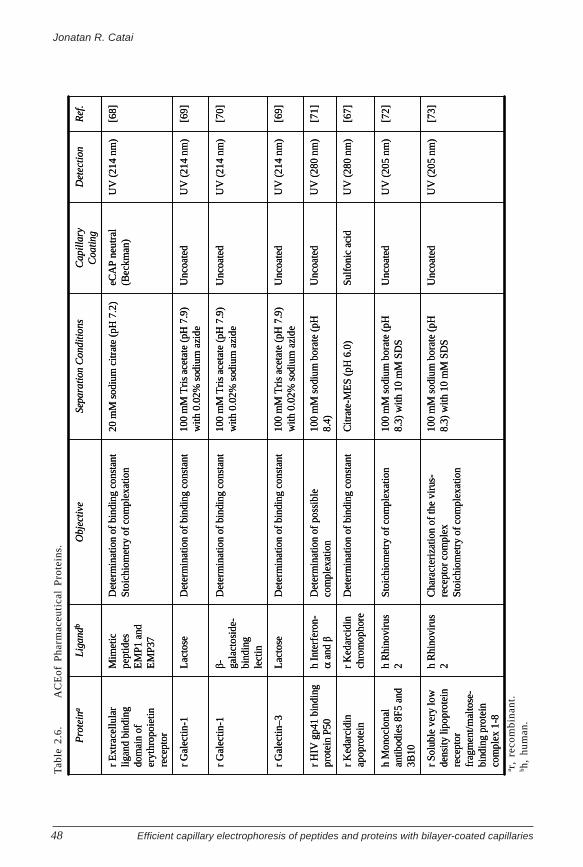
Jonatan R. Catai
Efficient capillary electrophoresis of peptides and proteins with bilayer-coated capillaries48
[73]
UV
(20
5 nm
)U
ncoa
ted
100
mM
sodi
um b
orat
e (p
H
8.3)
with
10
mM
SDS
Cha
ract
eriz
atio
n of
the
viru
s-re
cept
or c
ompl
exSt
oich
iom
etry
of c
ompl
exat
ion
h R
hino
viru
s 2
r So
lubl
e ve
ry lo
w
dens
ity li
popr
otei
n re
cept
or
frag
men
t/mal
tose
-bi
ndin
g pr
otei
n co
mpl
ex 1
-8
[72]
UV
(20
5 nm
)U
ncoa
ted
100
mM
sodi
um b
orat
e (p
H
8.3)
with
10
mM
SDS
Stoi
chio
met
ryof
com
plex
atio
nh
Rhi
novi
rus
2 h
Mon
oclo
nal
antib
odie
s 8F
5 an
d 3B
10
[67]
UV
(28
0 nm
)Su
lfon
ic a
cid
Citr
ate-
ME
S (p
H 6
.0)
Det
erm
inat
ion
of b
indi
ng c
onst
ant
r K
edar
cidi
nch
rom
opho
rer
Ked
arci
din
apop
rote
in
[71]
UV
(28
0 nm
)U
ncoa
ted
100
mM
sodi
um b
orat
e (p
H
8.4)
Det
erm
inat
ion
of p
ossi
ble
com
plex
atio
nh
Inte
rfer
on-
αan
d β
r H
IV g
p41
bind
ing
prot
ein
P50
[69]
UV
(21
4 nm
)U
ncoa
ted
100
mM
Tri
sac
etat
e (p
H 7
.9)
with
0.0
2% s
odiu
m a
zide
Det
erm
inat
ion
of b
indi
ng c
onst
ant
Lac
tose
r G
alec
tin–3
[70]
UV
(21
4 nm
)U
ncoa
ted
100
mM
Tri
sac
etat
e (p
H 7
.9)
with
0.0
2% s
odiu
m a
zide
Det
erm
inat
ion
of b
indi
ng c
onst
ant
β- gala
ctos
ide-
bind
ing
lect
in
r G
alec
tin-1
[69]
UV
(21
4 nm
)U
ncoa
ted
100
mM
Tri
sac
etat
e (p
H 7
.9)
with
0.0
2% s
odiu
m a
zide
Det
erm
inat
ion
of b
indi
ng c
onst
ant
Lac
tose
r G
alec
tin-1
[68]
UV
(21
4 nm
)eC
AP
neut
ral
(Bec
kman
)20
mM
sodi
um c
itrat
e (p
H 7
.2)
Det
erm
inat
ion
of b
indi
ng c
onst
ant
Stoi
chio
met
ryof
com
plex
atio
nM
imet
ic
pept
ides
E
MP1
and
E
MP3
7
r E
xtra
cellu
lar
ligan
dbi
ndin
g do
mai
n of
er
ythr
opoi
etin
re
cept
or
Ref
.D
etec
tion
Cap
illar
y C
oatin
gSe
para
tion
Con
ditio
nsO
bjec
tive
Liga
ndb
Pro
tein
a
Tab
le 2
.6.
AC
Eof
Pha
rmac
euti
cal
Pro
tein
s.
a r,
reco
mbi
nant
.b h
, hu
man
.
Jonatan R. Catai
Efficient capillary electrophoresis of peptides and proteins with bilayer-coated capillaries 49
2.8. Conclusions
This chapter provides a general overview of the various ways CE can be used in
the analysis of pharmaceutical proteins. In CE, diverse selectivities can be achieved with
different modes of separation. The application of a particular mode depends on the analytical
question posed. CIEF is especially useful when small changes or differences in variants of
one protein have to be monitored. CZE can also be used to separate closely related protein
species but also is well suited for the profiling of samples on impurities and degradation
products. With CGE, biopharmaceuticals can be checked for the presence of other
proteinaceous material. ACE approaches allow the determination of binding data of
pharmaceutical proteins with potential ligands.
The quality control of biopharmaceuticals often presents a mixture analysis
problem, and consequently separation techniques play (and will play) a pivotal role. As is
demonstrated in this chapter, the application of CE for the characterization of protein
pharmaceuticals has drastically increased during the past decade. Admittedly, the use of
CE is still limited, although it should be realized that a substantial part of the analytical
work on protein pharmaceuticals (including the accompanying method development) is
carried out within the biopharmaceutical companies and often is not published in the
scientific literature. In several of these industries, CE has already been recognized as a
highly valuable tool that has enriched the arsenal of analytical methodologies that currently
is applied to characterize biopharmaceuticals. Thus, CE provides a highly efficient and
complementary technique for the evaluation of purity, stability, heterogeneity, and identity
of pharmaceutical protein samples.
In biopharmaceutical analysis, until now, CE has mainly been explored as an
efficient separation technique to distinguish proteins from other mixture constituents such
as impurities or isoforms. However, CZE potentially could also provide information on
the condition and structure of the protein itself. The electrophoretic mobility is governed
by charge and size of the protein. This means that changes in protein charge by conjugation
or changes in protein size by unfolding and/or aggregation will be reflected in the observed
electrophoretic mobility. As in CZE separations, conditions can be chosen such that protein
structure is not affected (nondenaturing circumstances), and the CE migration data truly
reflect the native state of the protein (i.e., the state in which biopharmaceuticals are actually
administered to patients). Moreover, next to protein identity, MS detection can also provide
information on protein conformation. Because the charge states of a protein relate to its
conformational state, mass spectra of proteins recorded using ESI in principle can be used
to characterize the folding of the protein. So far, these aspects of CZE and CZE-MS have
hardly been explored, but they most probably will be in the near future.

Jonatan R. Catai
Efficient capillary electrophoresis of peptides and proteins with bilayer-coated capillaries50
Abbreviations
ACE Affinity capillary electrophoresis
BGE Background electrolyte
BMP Bone morphogenic protein
CAPS 3-Cyclohexylamino-1-propanesulfonic acid
CE Capillary electrophoresis
CGE Capillary gel electrophoresis
CHES 2-(Cyclohexylamino)ethanesulfonic acid
CIEF Capillary isoelectric focusing
CZE Capillary zone electrophoresis
DAPS N-dodecyl-N,N-dimethyl-3-amino-1-propanesulfonate
DNase Deoxyribonuclease
EBP EPO binding protein
EOF Electroosmotic flow
EPO Erythropoietin
ES Electrospray
ESI Electrospray ionization
FDA Food and Drug Administration
Gal Galectin
h Human
HEPES 4-(2-Hydroxyethyl)-1-piperazineethanesulfonic acid
HIC Hydrophobic interaction chromatography
HIV Human immunodeficiency virus
HPLC High-performance liquid chromatography
HPMC Hydroxypropylmethyl cellulose
HSA Human serum albumin
I Insulin
ICH International Committee on Harmonization
i.d. Internal diameter
IEC Ion-exchange chromatography
IGF Insulin-like growth factor
IgG Immunoglobulin
IL Interleukin
LIF Laser-induced fluorescence
MAb Monoclonal antibody
MES 4-Morpholinoethanesulfonic acid
Mr
Molecular weight
Jonatan R. Catai
Efficient capillary electrophoresis of peptides and proteins with bilayer-coated capillaries 51
MS Mass spectrometry
NAD(+) Nicotinamide adenine dinucleotide
PA Protective antigen
PAGE Polyacrylamide gel electrophoresis
PVA Poly(vinyl alcohol)
r Recombinant
RSD Relative standard deviation
SDS Sodium dodecyl sulfate
TAPS N-[Tris(hydroxymethyl)methyl]-3-aminopropanesulfonic acid
TEMED 1,2-Di(dimethylamino)ethane
TIC Total ion current
Tris Tris(hydroxymethyl)aminomethane
UV Ultraviolet
Vis Visible
References
[1] Jenkins, M. A., Guerin, M. D., J. Chromatogr. B 1997, 699:257-268.
[2] Hu, S., Dovichi, N. J., Anal. Chem. 2002, 74:2833-2850.
[3] Lagu, A. L., Electrophoresis 1999, 20:3145-3155.
[4] Chen, A. B., Canova-Davis, E., Chromatographia 2001, 53:S7-S17.
[5] Ma, S., Nashabeh, W., Chromatographia 2001, 53:S75-S89.
[6] Patrick, J. S., Lagu, A. L., Electrophoresis 2001, 22:4179-4196.
[7] Horvath, J., Dolnik, V., Electrophoresis 2001, 22:644-655.
[8] Figeys, D., Aebersold, R., J. Chromatogr. B 1997, 695:163-168.
[9] Belder, D., Deege, A., Husmann, H., Kohler, F., Ludwig, M., Electrophoresis 2001,
21:3813-3818.
[10] Corradini, D., J. Chromatogr B 1997, 699:221-256.
[11] Righetti, P. G., Gelfi, C., Verzola, B., Castelletti, L., Electrophoresis 2001, 22:603-
611.
[12] Somsen et al., unpublished results
[13] Erim, F. B., Cifuentes, A., Poppe, H., Kraak, J. C., J Chromatogr A 1995, 708:356-
361.
[14] Córdova, E., Gao, J., Whitesides, G. M., Anal. Chem. 1997, 69:1370-1379.
[15] Wang, Y., Dubin, P. L., Anal. Chem. 1999, 71:3463-3468.
Jonatan R. Catai
Efficient capillary electrophoresis of peptides and proteins with bilayer-coated capillaries52
[16] Katayama, H., Ishihama, Y., Asakawa, N., Anal. Chem. 1998, 70:2254-2260.
[17] Catai, J. R., Somsen, G. W., Jong, G. J. d., Electrophoresis 2004, 25:817-824.
[18] Guzman, N. A., Moschera, J., Iqbal, K., Malick, A.W., J. Chromatogr. 1992, 608:197-
204.
[19] Janini, G. M., Issac, H. J., Chromatographia 2001, 53:S18-S26.
[20] Righetti, P. G., Gelfi, C., Bossi, A., Olivieri, E., Castelletti, L., Verzola, B., Stoyanov,
A.V., Electrophoresis 2000, 21:4046-4053.
[21] Mandrup, G., J. Chromatogr. 1992, 604:267-281.
[22] Klyushnichenko, V. E., Koulich, D. M., Yakimov, S. A., Maltsev, K. V., Grishina,
G. A., Nazimov, I. V., Wulfson, A. N., J. Chromatogr. A 1994, 661:83-92.
[23] Sergeev, N. V., Gloukhova, N. S., Nazimov, I. V., Gulyaev, V. A., Shvets, S. V.,
Donetsky, I. A., Miroshnikov, A. I., J. Chromatogr. A 2001, 907:131-144.
[24] Guzman, N. A., Ali, H., Moschera, J., Iqbal, K., Malick, A. W., J. Chromatogr.
1991, 559:307-315.
[25] Roddy, T. P., Molnar, T. E., McKean, R. E., Foley, J. P., J. Chromatogr. B 1997,
695:49-58.
[26] Eriksson, H. J. C., Somsen, G. W., Hinrichs, W. L. J., Frijlink, H. W., de Jong G. J.,
J. Chromatogr. B 2001, 755:311-319.
[27] Eriksson, H. J. C., Wijngaard, M., Hinrichs, W. L. J., Frijlink, H. W., Somsen, G.
W., de Jong, G. J., J. Pharm. Biomed. Anal. 2003, 31:351-357.
[28] Yim, K., Abrams, J., Hsu, A., J. Chromatogr. A 1995, 716:401-412.
[29] Felten, C., Quan, C. P., Chen, A. B., Canova-Davis, E., McNerney, T., Goetzinger,
W. K., Karger, B. L., J. Chromatogr. A 1999, 853:295-308.
[30] Kinoshita, M., Murakami, E., Oda, Y., Funakubo, T., Kawakami, D., Kakehi, K.,
Kawasaki, N., Morimoto, K., Hayakawa, T., J. Chromatogr. A 2000, 866:261-271.
[31] de Frutos, M., Cifuentes, A., Diez-Masa, J. C., Electrophoresis 2003, 24:678-680.
[32] Cifuentes, A., Moreno-Arribas, M. V., de Frutos, M., Diez-Masa, J. C., J.
Chromatogr. A 1999, 830:453-463.
[33] Bietlot, H. P., Girard, M., J. Chromatogr. A 1997, 759:177-184.
[34] Lopez-Soto-Yarritu, P. L., Diez-Masa, J. C., de Frutos, M., Cifuentes, A., J. Sep.
Sci. 2002b, 25:1112-1118.
[35] Sanz-Nebot, V., Benavente, F., Vallverdú, A., Guzman, N. A., Barbosa, J., Anal.
Chem. 2003, 75:5220-5229.
[36] Storring, P. L., Das, R. E. G., Mulders, J. W. M., Halder, M., Biologicals 2002,
30:217-234.
[37] Watson, E., Yao, F., J. Chromatogr. 1993, 630:442-446.
Jonatan R. Catai
Efficient capillary electrophoresis of peptides and proteins with bilayer-coated capillaries 53
[38] Kunkel, A., Gunter, S., Dette, C., Watzig, H., J. Chromatogr. A 1997, 781:445-455.
[39] Lookabaugh, M., Biswas, M., Krull, I. S., J. Chromatogr. 1991, 549:357-366.
[40] Knüver-Hopf, J., Mohr, H., J. Chromatogr. A 1995, 717:71-74.
[41] Gysler, J., Helk, B., Dambacher, S., Tjaden, U. R., van der Greef, J., Pharm. Res.
1999, 16:695-701.
[42] Thorne, J. M., Goetzinger, W. K., Chen, A. B., Moorhouse, K. G., Karger, B. L., J.
Chromatogr. A 1996, 744:155-165.
[43] Tran, N. T., Taverna, M., Chevalier, M., Ferrier, D., J. Chromatogr. A 2000, 866:121-
135.
[44] Lopez-Soto-Yarritu, P., Diez-Masa, J. C., Cifuentes, A., de Frutos, M., J. Chromatogr.
A 2002a, 968:221-228.
[45] Kubach, J., Grimm, R., J. Chromatogr. A 1996, 737:281-289.
[46] Tang, S., Nesta, D. P., Maneri, L. R., Anumula, K. R., J. Pharm. Biomed. Anal.
1999, 19:569-583.
[47] Hunt, G., Moorhouse, K. G., Chen, A. B., J. Chromatogr. A 1996, 744:295-301.
[48] Jensen, P. K., Harrata, A. K., Lee, C. S., Anal. Chem. 1998, 70:2044-2049.
[49] Chen, A. B., Rickel, C. A., Flanigan, A., Hunt, G., Moorhouse, K. G., J. Chromatogr.
A 1996, 744:279-284.
[50] Farchaus, J. W., Ribot, W. J., Jendrek, S., Little, S. F., Appl. Environ. Microbiol.
1998, 64:982-991.
[51] Hunt, G., Nashabeh, W., Anal. Chem. 1999, 71:2390-2397.
[52] Schlenck, A., Schiele, F., Barbier, A., Shuvaev, V. V., Visvikis, S., Siest, G., J.
Chromatogr. A 1999, 853:237-241.
[53] Benedek, K., Thiede, S., J. Chromatogr. A 1994, 676:209-217.
[54] Guttman, A., Nolan, J. A., Cooke, N., J. Chromatogr. 1993, 632:171-175.
[55] Lee, H. G., J. Immunol. Methods 2000, 234:71-81.
[56] Klyushnichenko, V., Tishkov, V., Kula, M. R., J. Biotechnol. 1997, 58:187-195.
[57] Tsuji, K., J. Chromatogr. 1991, 550:823-830.
[58] Schmitt-Kopplin, P., Frommberger, M., Electrophoresis 2003, 24:3837-3867.
[59] Eriksson J. H. C., Mol, R., Somsen, G. W., Hinrichs, W. L. J., Frijlink, H. W., de
Jong, G. J., Electrophoresis 2004, 25:43-49.
[60] Nashabeh, W., Greve, K. F., Kirby, D., Foret, F., Karger, B. L., Reifsnyder, D. H.,
Builder, S. E., Anal. Chem. 1994, 66:2148-2154.
[61] Yeung, B., Porter, T. J., Vath, J. E., Anal. Chem. 1997, 69:2510-2516.
[62] Pawlak, K. P., Palacios, O., Capdevila, M., Gonzalez-Duarte, P., Lobinski, R.,
Talanta 2002, 57:1011-1017.

Jonatan R. Catai
Efficient capillary electrophoresis of peptides and proteins with bilayer-coated capillaries54
[63] Tang, Q., Harrata, A. K., Lee, C. S., Anal. Chem. 1997, 69:3177-3182.
[64] Shimura, K., Kasai, K., Anal. Biochem. 1997, 251:1-16.
[65] Heegaard, N. H. H., Nilsson, S., Guzman, N. A., J. Chromatogr. B 1998, 715:29-
54.
[66] Heegaard, N. H. H., Kennedy, R. T., Electrophoresis 1999, 20:3122-3133.
[67] Liu, J. P., Abid, S., Hail, M. E., Lee, M. S., Hangeland, J., Zein, N., Analyst 1998,
123:1455-1459.
[68] Caldwell, G. W., McDonnell, P. A., Masucci, J. A., Johnson, D. L., Jolliffe, L. K., J.
Biochem. Biophys. Meth. 1999, 40:17-25.
[69] Shimura, K., Arata, Y., Uchiyama, N., Hirabayashi, J., Kasai, K., J. Chromatogr. B
2002, 768:199-210.
[70] Shimura, K., Uchiyama, N., Kasai, K., Electrophoresis 2001, 22:3471-3477.
[71] Yu, T., Xiao, Y., Bai, Y., Ru, Q., Luo, G., Dierich, M. P., Chen, Y-H., Immun. Lett.
2000, 73:19-22.
[72] Okun, V. M., Moser, R., Blaas, D., Kenndler, E., Anal. Chem. 2001a, 73:3900-
3906.
[73] Okun, V. M., Moser, R., Ronacher, B., Kenndler, E., Blaas, D., J. Biol. Chem. 2001b,
276:1057-1062.