cape winelands district municipality 2017/18 2021/22 · 6 foreword: executive mayor as executive...
TRANSCRIPT
1
4TH GENERATION IDP
CAPE WINELANDS DISTRICT MUNICIPALITY
2017/18 – 2021/22

2
TABLE OF CONTENTS
GLOSSARY OF ACRONYMS.................................................................................................... 5
FOREWORD: EXECUTIVE MAYOR ......................................................................................... 6
OVERVIEW/PREFACE: MUNICIPAL MANAGER ..................................................................... 7
MAP OF CAPE WINELANDS DISTRICT .................................................................................. 8
1.1 VISION AND MISSION .............................................................................................. 9
1.2 CORE VALUES ......................................................................................................... 9
1.3 STRATEGIC OBJECTIVES ..................................................................................... 10
1.4 FIVE YEAR INTEGRATED DEVELOPMENT PLANNING ...................................... 11
1.4.1 INTRODUCTION TO INTEGRATED DEVELOPMENT PLANNING .............. 11
1.5 ALIGNMENT BETWEEN NATIONAL, PROVINCIAL & CWDM .............................. 17
1.6 THE MILLENNIUM DEVELOPMENTAL GOALS (MDGS) ....................................... 26
1.7 NATIONAL DEVELOPMENT PLAN (NDP) –VISION FOR 2030 ............................ 26
1.8 NATIONAL GOVERNMENT’S OUTCOMES-ROLE OF LOCAL GOVERNMENT ... 26
1.9 WESTERN CAPE GOVERNMENT– PROVINCIAL STRATEGIC GOALS ............... 27
2.1 THE LEGAL OBLIGATION / MANDATE ................................................................. 28
2.2 THE ROLE OF A DISTRICT MUNICIPALITY ......................................................... 30
2.3 SYNOPSIS REPORT ON THE IDP / BUDGET ....................................................... 31
2.4 PARTICIPATORY DEMOCRACY ........................................................................... 33
2.5 STAKEHOLDER ACTIVATION ............................................................................... 34
2.6 RESPONSE ON PUBLIC INPUT ............................................................................. 35
2.7 IDP/BUDGET PUBLIC PARTICIPATION ROAD MAP ............................................ 37
3.1 INTRODUCTION ..................................................................................................... 38
3.2 CAPE WINELANDS LOCALITY PROFILE .............................................................. 38
3.3 CAPE WINELANDS SOCIO-ECONOMIC SNAPSHOT .......................................... 42
3.4 DEMOGRAPHIC PROFILE - MUNICIPAL SOCIO-ECONOMIC ANALYSIS .......... 43
3.5 EDUCATION ............................................................................................................ 45
3.6 HEALTH ................................................................................................................... 49
3.7 POVERTY ................................................................................................................ 53
3.8 BASIC SERVICE DELIVERY .................................................................................. 55
3.9 SAFETY AND SECURITY ....................................................................................... 58
3.10 THE ECONOMY ...................................................................................................... 61
3.11 BROADBAND .......................................................................................................... 67

3
3.13 STATE OF THE DISTRICT ..................................................................................... 71
3.14 THUSONG CENTRES IN CAPE WINELANDS DISTRICT ..................................... 79
3.15 STATUS REPORT ON SECTOR PLANS ............................................................... 82
4.1 SUPPLY CHAIN MANAGEMENT AS A STRATEGIC ENABLER FOR ECONOMIC
OPPORTUNITIES ............................................................................................................. 85
4.2 ALIGNMENT AND ACCOUNTABILITY OF THE SPHERES OF GOVERNMENT ..... 88
4.3 NATIONAL DEVELOPMENT PLAN – VISION FOR 2030 ...................................... 89
CHAPTER 5: PRIORITIES AND KEY INTERVENTIONS ....................................................... 92
5.1 INTRODUCTION ......................................................................................................... 92
5.2 STRATEGIC OBJECTIVE 1 ........................................................................................ 98
5.2.1 DRAFT CAPE WINELANDS ENVIRONMENTAL MANAGEMENT FRAMEWORK113
5.3 STRATEGIC OBJECTIVE 2 .................................................................................. 133
5.4 STRATEGIC OBJECTIVE 3 .................................................................................. 143
6. ORGANISATIONAL PERFORMANCE TARGETS (PER STRATEGIC OBJECTIVE)152
CHAPTER 7: INSTITUTIONAL/GOVERNANCE FRAMEWORK .......................................... 159
7.11 POLITICAL SEGMENT .......................................................................................... 159
7.2 ADMINISTRATIVE COMPONENT ........................................................................ 163
CHAPTER 8: SPATIAL BUDGET FOOTPRINT .................................................................... 169
CHAPTER 9: NATIONAL AND PROVINCIAL PROGRAMMES ............................................ 176
9.1 NATIONAL GOVERNMENT ...................................................................................... 176
9.2 WESTERN CAPE PROVINCIAL GOVERNMENT PRIORITIES FOR 2016/2017 178
9.3 PROVINCIAL JOINT PLANNING INITIATIVES .................................................... 180
CHAPTER TEN: SUMMARY OF LOCAL MUNICIPALITIES’ IDP 2017/18 – 2020/21.......... 193
10.1 WITZENBERG MUNICIPALITY ............................................................................. 193
10.2 DRAKENSTEIN MUNICIPALITY ......................................................................... 196
10.3 LANGEBERG MUNICIPALITY ............................................................................ 198
10.4 STELLENBOSCH MUNICIPALITY ..................................................................... 199
10.5 BREEDE VALLEY (2012/2013-2016/2017 IDP) .................................................... 202
10.6 SUPPORT TO LOCAL MUNICIPALITIES – FINANCIAL IMPACT ..................... 204
CHAPTER ELEVEN: MEDIUM TERM REVENUE AND EXPENDITURE FRAMEWORK .... 206
11.1 INTRODUCTION .................................................................................................. 206
11.2 TOTAL ACTUAL BUDGET ................................................................................... 212
11.3 COMPARISON BETWEEN THE ADJUSTMENT BUDGET AND THE
2015/2016 BUDGET ................................................................................................... 212
11.4 FUNDING OF THE BUDGET ............................................................................... 213
11.5 FINANCIAL POSITION .......................................................................................... 215

4
11.6 LIQUIDITY AND DEBT- EQUITY RATIO’S ........................................................... 215
11.7 CAPITAL REPLACEMENT RESERVE FOR THE 2015/2016-2017/2018 MTREF216
11.8 KEY PROJECTS .................................................................................................. 216
11.9 AREAS OF POTENTIAL SAVING ........................................................................ 220
CHAPTER TWELVE: MONITORING AND EVALUATION. .................................................. 221
CHAPTER THIRTEEN: IDP/BUDGET/PMS LINK ................................................................. 222
13.1 PREDETERMINED DEVELOPMENT OBJECTIVES (IDP) LINK TO SDBIP AND PMS 222
13.2 PLANNING, BUDGETING AND REPORTING ..................................................... 225
13.3 HIGH-LEVEL SERVICE DELIVERY AND BUDGET IMPLEMENTATION PLAN
(PROJECTS) ................................................................................................................... 226
13.4 IDP PERFORMANCE 2014 – 2015 ANNUAL REPORT ...................................... 231
ANNEXURES: ........................................................................................................................ 232
5
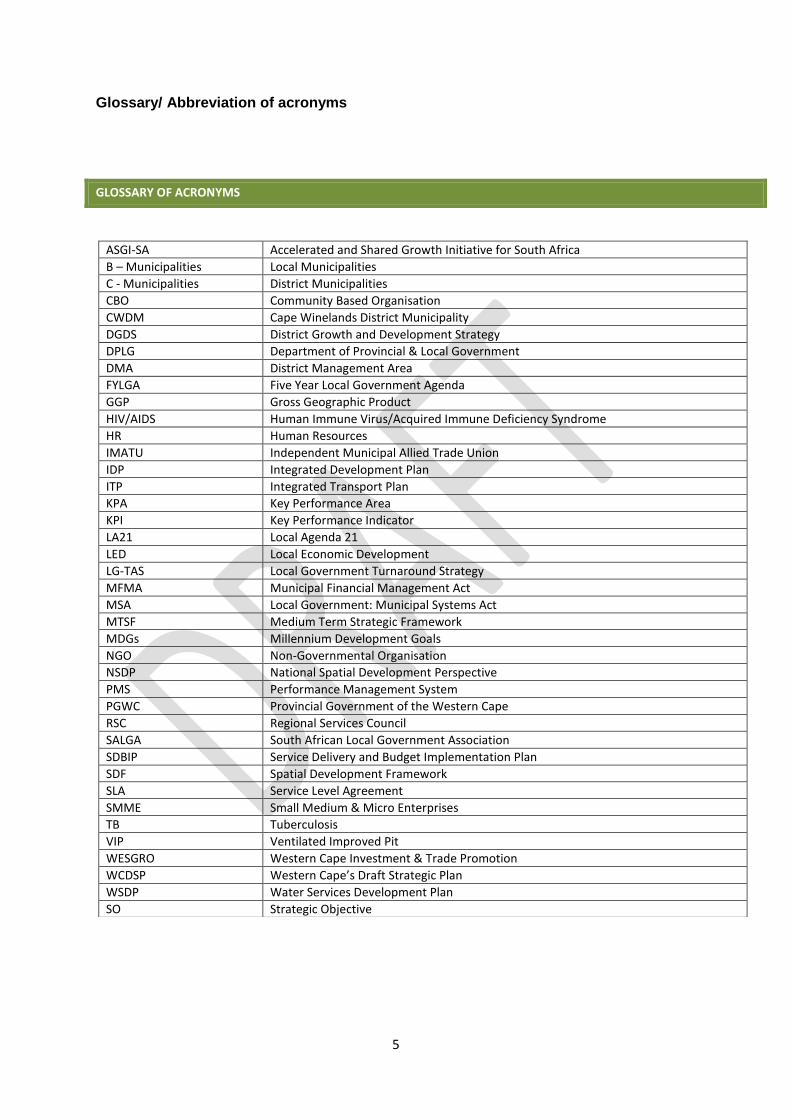
Glossary/ Abbreviation of acronyms
GLOSSARY OF ACRONYMS
ASGI-SA Accelerated and Shared Growth Initiative for South Africa
B – Municipalities Local Municipalities
C - Municipalities District Municipalities
CBO Community Based Organisation
CWDM Cape Winelands District Municipality
DGDS District Growth and Development Strategy
DPLG Department of Provincial & Local Government
DMA District Management Area
FYLGA Five Year Local Government Agenda
GGP Gross Geographic Product
HIV/AIDS Human Immune Virus/Acquired Immune Deficiency Syndrome
HR Human Resources
IMATU Independent Municipal Allied Trade Union
IDP Integrated Development Plan
ITP Integrated Transport Plan
KPA Key Performance Area
KPI Key Performance Indicator
LA21 Local Agenda 21
LED Local Economic Development
LG-TAS Local Government Turnaround Strategy
MFMA Municipal Financial Management Act
MSA Local Government: Municipal Systems Act
MTSF Medium Term Strategic Framework
MDGs Millennium Development Goals
NGO Non-Governmental Organisation
NSDP National Spatial Development Perspective
PMS Performance Management System
PGWC Provincial Government of the Western Cape
RSC Regional Services Council
SALGA South African Local Government Association
SDBIP Service Delivery and Budget Implementation Plan
SDF Spatial Development Framework
SLA Service Level Agreement
SMME Small Medium & Micro Enterprises
TB Tuberculosis
VIP Ventilated Improved Pit
WESGRO Western Cape Investment & Trade Promotion
WCDSP Western Cape’s Draft Strategic Plan
WSDP Water Services Development Plan
SO Strategic Objective

6
Foreword: Executive Mayor
As Executive Mayor of the Cape Winelands District Municipality, I am proud and honored to
present to you the 4th Generation 2017/2018 – 2021/2022 strategic planning of this
municipality as it is legislated by the Municipal Systems Act (MSA) 2000.
This Integrated Development Plan complies with the Act when the following is required:
3.) “To provide for the core principles, mechanisms and processes that are necessary to
enable municipalities to move progressively towards the social and economic
upliftment of local communities and ensure universal access to essential services that
are affordable to all;
4.) … to establish a framework for support, monitoring and standard setting by other
spheres of government in order to progressively build local government into an
efficient, frontline development agency capable of integrating the activities of all
spheres of government for the overall social and economic upliftment of communities
in harmony with their local natural environment …”
This IDP illustrates the commitment and dedication of the Cape Winelands District Municipality
to consider current realities within our region, including the 5 local municipalities (Drakenstein,
Stellenbosch, Witzenberg, Breede Valley and Langeberg), and can be regarded as a
document for the people, by the people.
The 2017/2018 IDP is the result of intense consultations and active participation by all
stakeholders, including regional service organizations, the 5 local municipalities and Cape
Winelands District Municipality line departments and councilors.
From the strategic planning of CWDM, the vision for 2017/2018 is: “A unified Cape Winelands
of excellence for sustainable development” which will be demonstrated in the following
strategic goals:
1 Creating an environment and forging partnerships that ensure social and economic
development of all communities, including the empowerment of the poor in the Cape
Winelands District;
2 Promoting sustainable infrastructure services and a
transport system which fosters social and economic opportunities; and
3 Providing effective and efficient financial and strategic support services to the Cape
Winelands District Municipality (CWDM).
Further to the above strategic goals, the guidelines presented by the National Development
Plan, together with the 2017 State of the Province Address by Premier Helen Zille, such as
economic inclusion of all, skills development, job creation, Agri-processing, tourism, the
energy economy and SMME’s as potential contributors to the falling rural unemployment rate
will together be the key drivers to deliver on the vision of CWDM.
It is against this background that I thank all individuals and groups who contributed to the
development of this IDP. Cape Winelands District Municipality remains dedicated to executing
our core mandate and will proudly deliver on this 2017/2018 – 2021/2022 Integrated
Development Plan.
Executive Mayor
Alderman (Dr.) Helena von Schlicht

7
Overview/Preface: Municipal Manager
Integrated development planning is the principal strategic planning instrument which guides
and informs all planning and developments, and all decisions with regard to planning,
management and development in the municipality. Cape Winelands district being mandated
for coordination and strategic support role towards the local municipalities in the area of its
jurisdiction has approved a framework for integrated development planning after following a
consultative process.
Local government in South Africa on the 3rd August 2016 has held the fourth successful
democratic elections to give mandate to elected councillors to govern over the affairs of the
municipality on behalf of its citizens. Cape Winelands district council was formally constituted
at its council meeting held in Worcester on the 1st September 2016.
In the light of the fourth democratic election referred to, all municipalities were simultaneously
charged with the responsibility to develop fourth generation integrated development planning.
(IDP).In this regard municipalities are guided by the Local government system act, Chapter 4
on community participation and chapter 5 on integrated development planning amongst the
host of regulations.
Cape Winelands at its council meeting of 26 January 2017 mandated the municipal manager
to review the staff establishment. Regulations on senior managers, section 7 (1) states that:
A municipal manager must develop the staff establishment of a municipality within 90 days
after the promulgation of these regulations and thereafter within 90 days after the election of
the new municipal council of a municipality having regard to the functions and powers
assigned to a municipality in terms of chapter 5 of the municipal structures act, and based on
–
(a) A municipality’s strategic objective
(b) A municipality’s core and support functions and
(c) Information inflow and processes
In conclusion, let me express my appreciation and gratitude to the Executive Mayor Dr…..and
her mayoral committee members for always providing political guidance and taking all
decisions in the interest of the municipality. To the Speaker Clara Meyer for chairing council
meetings ,all political parties councillors represented in council ,senior managers reporting
directly to the municipal manager and all staff member ,labour unions and of most important
the community and citizens of our district.

8
Map of Cape Winelands District

9
CHAPTER 1: INTRODUCTION AND OVERVIEW
1.1 Vision and Mission
VISION
A unified Cape Winelands of Excellence for sustainable development.
MISSION All structures of the Cape Winelands co-operate together towards effective, efficient and economically sustainable development.
1.2 CORE VALUES
Our core values are largely shaped by the moral fibre of the administrative and political
leadership of our municipality, guidance by the Batho Pele service delivery principles and the
strategic compass provided to us by the Western Cape Government through its Strategic Plan,
which reflects the core values of the Western Cape Government.
The following core values reflect the character and organizational culture of the
municipality:
1. Commitment to the development of people;
2. Integrity in the performance of our duty;
3. Respect for our natural resources;
4. Transparency in accounting for our actions;
5. Regular consultation with customers on the level and quality of services;
6. Higher levels of courtesy and professionalism in the workplace;
7. Efficient spending and responsible utilization of municipal assets; and
8. Celebrating diversity.

10
1.3 Strategic Objectives
STRATEGIC OBJECTIVES
OFFICE OF THE MUNICIPAL MANAGER Integrated Development Plan Performance Management
Risk Management Internal Auditing Communications
STRATEGIC OBJECTIVES PREDETERMINED DEVELOPMENT OBJECTIVES
1. To create an environment and forging partnerships that ensure social and economic development of all communities, including the empowerment of the poor in the Cape Winealnds District.
1.1 Provide a comprehensive and equitable Municipal Health Service including Air Quality Management throughout the CWDM. 1.2 Ensure coordination of multi-disciplinary and sectoral disaster risk reduction through integrated institutional capacity for Disaster Risk management, Disaster Risk Assessment and Response and Recovery 1.3 Effective planning and coordination of specialized fire-fighting services throughout the CWDM 1.3 To facilitate environmentally sustainable
economic development planning through the development and maintenance of strategic partnerships, investment attraction, retention and opportunities, SMME support and development, skills development and information knowledgement.
1.4 To facilitate, ensure and monitor the development and empowerment of the poor by graduating people out of poverty, social inclusion and improving the livelihood of the poor, vulnerable groups, rural farm dwellers and rural communities.
2. Promoting sustainable infrastructure services and a transport system which fosters social and economic opportunities
2.1 To comply with the administrative and financial conditions of the Western Cape Government roads agency function agreement. 2.2 To implement sustainable infrastructure services. 2.3 To increase levels of mobility in the whole of the CWDM area. 2.4 To improve infrastructure services for rural dwellers

11
2.5 To implement an effective ICT support system.
3. Providing effective and efficient financial and strategic support services to the Cape Winelands District Municipality.
3.1 To facilitate and enhance sound financial support services 3.2 To strengthen and promote participative and accountable IGR and governance. 3.3 To facilitate and enhance sound strategic support services
1.4 Five year Integrated Development Planning
1.4.1 Introduction to Integrated Development Planning
Integrated Development Planning is a process through which a municipality can establish a
development plan for the short, medium and long-term. In effect, the integrated development
plan is a planning and strategic framework to help municipalities fulfil their developmental
mandate:
It enables municipalities to align their financial and institutional resources behind
agreed policy objectives and programmes.
It is a vital tool to ensure the integration of a municipality’s activities with other
spheres of development planning at provincial, national and international levels, by
serving as a basis for communication and interaction.
It serves as a basis for engagement between the municipality and the citizens of the
district, as well as with various stakeholders and interest groups.
It enables municipalities to weigh up their obligations and systematically prioritise
programmes and resources allocations. In a context of great inequalities, integrated
development plans serve as a framework for municipalities prioritise their actions
around meeting urgent needs, while maintaining the overall economic, municipal and
social infrastructure already in place.
In assists municipalities to focus on the environmental sustainability of their delivery
and development strategies.
It helps municipalities to develop a holistic strategy for poverty alleviation.
Source: IDP Guidepacks, GTZ

12
1.4.2 Provincial viewpoint on 4th Generation IDP (awaiting more information)
The Western Cape Government (WCG) recognises that municipalities are at the forefront of
managing the impact of unplanned urbanisation, which often results in significant challenges
in the provision of adequate infrastructure, service delivery, governance and development.
Despite great strides made in addressing governance issues and attaining unqualified audits
(“clean audits”), the sustainability of municipalities is under threat given, amongst others, the
pressures on budgets and service delivery. There has been a strong call from municipalities
for a new approach in addressing sustainability challenges.
Recognising that an Integrated Development Plan (IDP) is a single and inclusive strategic plan
for the development of a municipality, which integrates plans and resources in a sustainable
manner, the Fourth Generation Integrated IDPs provide an opportunity to strengthen
integrated planning, budgeting and implementation between the WCG and the respective
Western Cape Municipalities and to influence planning to contribute to sustainable local
government.
INTEGRATED MUNICIPAL ENGAGEMENTS
The Engagements were held with all five Districts with a theme of “Integrated Approach
Towards Sustainable Local Government”. The agenda focused on the following six key
aspects:
Partnering for economic development
All five engagements noted that municipal sustainability requires successful socio-economic
development and spatial transformation. The best way to grow and sustain a municipal
revenue base, deliver basic services, and reduce the number of poor households, is by
growing the economy in an inclusive way. To do this, municipalities need to engage proactively
in a variety of partnerships and relationships, beyond conventional Public-Private
Partnerships. It is recommended that municipalities adopt an explicit partnering (or integrated
management) approach in the formulation and implementation of their fourth Generation IDPs
and Spatial Development Frameworks.

13
Provincial strategic initiatives impacting on local government
The Department of the Premier’s Delivery Support Unit (DSU) shared Game Changers which
impact on local government, namely;
a) Energy Security: The DSU is working with 13 municipalities on SSEG. Currently, the
DSU is working with the City of Cape Town, Drakenstein, Mossel Bay, Stellenbosch,
George, and Saldanha Bay.
b) Apprenticeship: Priority sectors: Energy, Oil and Gas, Tourism, ICT, and Agri-
processing. Municipalities were encouraged to pay specific attention to
apprenticeships and avail placement opportunities for learners in priority sectors.
c) After School: Municipalities are encouraged to identify any after school activities that
are running in your municipality and the DSU can link them with the community of
practise being established in the space.
d) Alcohol Harms Reduction: The first phase of this game changer is focused in
Khayelitsha, Nyanga and Paarl East.
The DSU can avail a toolkit for more information in the event that municipalities would
want to use the methodology in their municipal game changers.
Key opportunities and challenges impacting on sustainable local government
The following themes emerged from all Districts presentations:
a) Role of political leadership
b) Need for trust building to get the relationships right
c) Getting the basics right e.g. clean and safe areas, provision of services and
infrastructure, councils that are able to take consistent decisions
d) The need to focus on key issues e.g. a number of districts presented 46 challenges
and to move forward, it is important to prioritise issues and focus
e) Need for unified approach between government spheres to the practice of community
engagement
f) Co-planning for co-implementation
g) Reciprocal planning and budgeting (‘landing’ WCG departmental plans in IDPs, and
‘landing’ municipal priorities in WCG departmental plans and budgets)
h) Cross-boundary partnering: differentiate between ‘being competitive’, and ‘being in
competition with’ the municipal neighbours
i) Importance of data and intelligence
j) Municipal interest in specific game changers, e.g. alcohol harms reduction, after-
schools programme, skills

14
Economic Intelligence and fiscal policy informing sustainable local government
Local Government sustainability is dependent on and linked to economic growth and
socio economic outcomes.
The integration of economic sustainability, financial sustainability, governance
sustainability and public value are a prerequisite for sustainable local government.
Municipalities should strive for inclusive growth and utilise levers of economic growth
which are contained in local government mandates and the ‘basic’ functions that
municipalities perform.
Spatial and environmental engagement is also a key element of inclusive economic
development where municipalities play a critical role.
There are two key roles for municipalities: enabling opportunity and attracting
investment which is largely done through the basics of service delivery.
Local government can also be a catalyst for social investment and economic
investment: consideration of municipal policies enable a thriving economic
environment – attract investments into the area, incentives and encourage inclusion of
community, support to the vulnerable.
The annual Municipal Economic Review and Outlook (MERO) and Socio-Economic
Profiles of Local Government (SEP-LG) can be used by municipalities as a form of
economic intelligence to inform evidence-based planning during IDP preparation.
Other data sources can complement the MERO and SEP-LG to assist in understanding
the regional and local economy, identifying areas of risk and opportunity in order to
know, understand, anticipate and plan for changes in the economic and socio-
economic environment.
The existing domestic constraints which include policy uncertainty, infrastructure gaps,
drought, rising fiscal pressure, rising interest and Inflation rates, high joblessness for
youth and rising debt service costs, must be factored into the IDP formulation and
budget process. Municipalities could for example consider formulating a budget policy
to give effect to the IDPs as is done nationally and provincially to strengthen the links
between the plans and budgets for delivery.
Government should use technology as an enabler (e.g. for efficiency)) and
infrastructure spending and targeting is key.
Spatial Governance for sustainable local government
Spatial governance implies integration and is synonymous with an integrated
management approach.

15
Spatial Transformation is essential to address the apartheid legacy, to bridge the
policy-practice gap and to achieve social-ecological resilience and inclusion.
Joined-up government for improved impact and improved use of scarce resources is
required to ensure the integrated, coordinated and spatially targeted planning and
delivering of development starting with a shared vision or agreement to be reached
on what is to be achieved in specific space, followed by institutionalising for joint
planning and delivery by following a whole of government approach (crowd-in).
The WCG policies and plans clearly articulate the spatial and societal transformations
required, and planning tools such as the PSP, the PSDF, MERO and Growth Potential
of Towns Study provides clear evidence for spatial targeting and lobbying for delivery
through formation of strategic partnerships either at the physical or metaphysical
scales.
From a spatial governance point of view important, provision for institutionalising
spatial governance is made in the NDP, the PSP, the PSDF and the IDP and MSDF
processes are central to achieving success in integrated management in the province.
Examples were shared per district providing an analysis of the manifestation of spatial
patterns and trends of key economic and socio-economic indicators of the MERO
2016 to further the notion of joint intelligence, the need for evidence based planning,
budgeting and infrastructure-enabled development;
They key messages are: municipalities should (a) capitalise on their unique settlement
typologies/ assets/ knowledge economy; (b) consolidate and enhance investment in
economically vibrant areas / service delivery / resources and development
management; (c) cluster activities to demote suburban development/ investment in
economic infrastructure / resource management; and (d) connect economic and social
opportunities/ regional economic infrastructure/ climate change adaptation.
Towards sustainable Integrated Development Planning.
Western Cape Municipalities’ IDPs have reached suitable compliance levels.
Therefore, the Fourth Generation IDPs should move to the next level i.e. ensuring that
the IDPs are aligned to the budget and taking in consideration spatial targeting in order
to move towards sustainable IDPs.
When developing the fourth generation IDPs, the citizen and community must be the
central focus of the IDP.
During planning, municipalities must take into account the physical and social
demographics utilising all information sources e.g. Census Surveys, MERO, spatial

16
circumstances and environmental sensitivities using tools such as the Spatial
Development Frameworks.
Role players/partners must be identified and considered during the planning stage of
the IDP preparation and not only at implementation must i.e. from the community to
the National and Provincial departments, SOEs, Parastatals and Business including
local entrepreneurs.
All the partners must develop a vision for the area/region. The partners must be
included and allowed to determine the priorities, given the realities and resource
constraints while utilising different mechanisms to communicate.
A simplified manner of communicating the strategic intent and how it will be
implemented in the various local areas is to be developed while understanding there
is still a requirement for a compliant IDP.
A simplified manner of reporting on the progress throughout the year which ward
councillors can utilise at their quarterly meetings. This allows the community to be
continuously involved in the municipality from the planning stage and not on an annual
basis when certain processes must be legally adhered too.
WAY-FORWARD AND RESOLUTIONS
All five engagements unanimously agreed that the local government sustainability theme
was of importance and would have to be carried through all future engagements between
WCG and Municipalities. During mid-2017, a discussion will be held on transversal issues
and how can on a macro level be the issues be incorporated into municipal support plans.

17
1.5 ALIGNMENT BETWEEN NATIONAL, PROVINCIAL & CWDM
Millennium
Development
Goals
National
Development Plan
2030
Western Cape
Provincial Strategic
Objectives
Cape Winelands
District Municipality
Strategic objectives
CWDM Pre-determined
objectives
CWDM
Programmes
and projects
Eradicate extreme
hunger and poverty
Economy and
employment
Strategic Goal 1 :
Creating opportunities
for growth and jobs
To create an
environment and forge
partnerships that
ensures the health,
safety ,social and
economic development
of all communities
including the
empowerment of the
poor in the Cape
Winelands District
through economic,
environmental and
social infrastructure
investment.
PDO1.4: To facilitate environmentally sustainable economic development planning through the development and maintenance of strategic partnerships, investment attraction, retention and opportunities, SMME support and development, skills development and information acknowledgement.
PDO1.5: To facilitate, ensure and
monitor the development and
empowerment of the poor by
Business
Retention
Expansion
Programme
for Tourism
Sector
CWDM/DEDA
T Municipal
Red Tap
Reduction
Programme
Entrepreneuri
al Seed Fund
LED
information/
intelligence
Tourism
Month
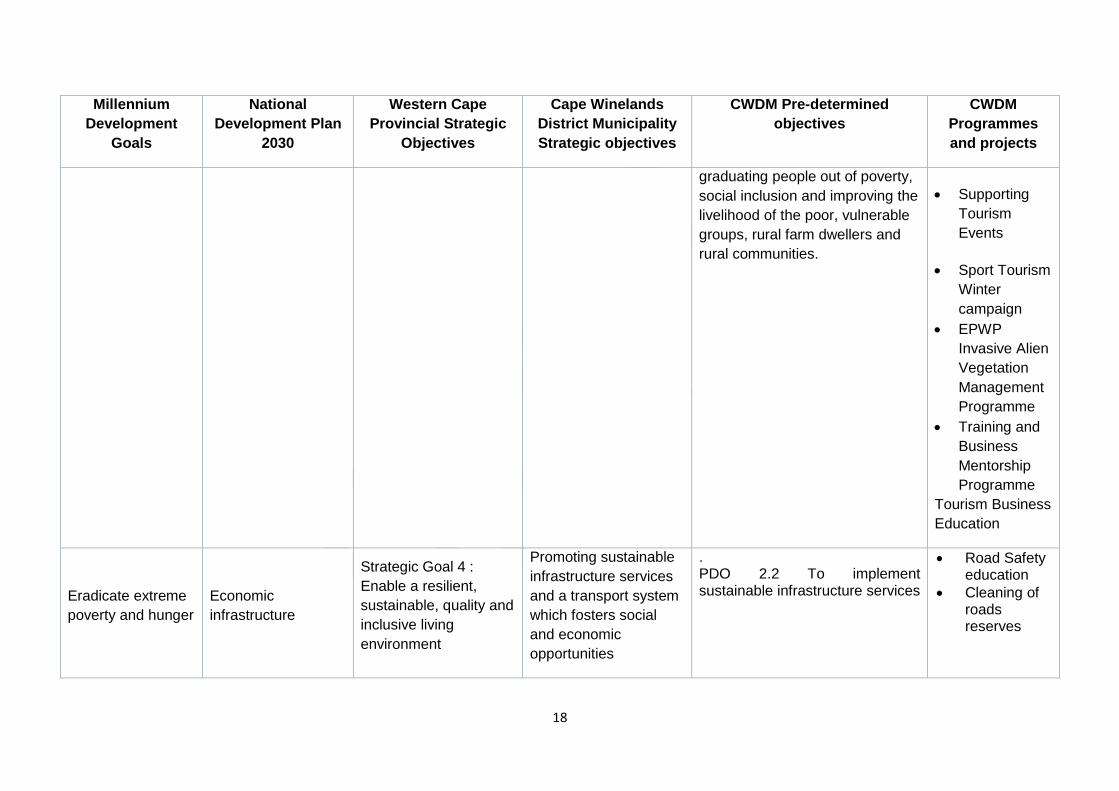
18
Millennium
Development
Goals
National
Development Plan
2030
Western Cape
Provincial Strategic
Objectives
Cape Winelands
District Municipality
Strategic objectives
CWDM Pre-determined
objectives
CWDM
Programmes
and projects
graduating people out of poverty,
social inclusion and improving the
livelihood of the poor, vulnerable
groups, rural farm dwellers and
rural communities.
Supporting
Tourism
Events
Sport Tourism
Winter
campaign
EPWP
Invasive Alien
Vegetation
Management
Programme
Training and
Business
Mentorship
Programme
Tourism Business
Education
Eradicate extreme
poverty and hunger
Economic
infrastructure
Strategic Goal 4 :
Enable a resilient,
sustainable, quality and
inclusive living
environment
Promoting sustainable
infrastructure services
and a transport system
which fosters social
and economic
opportunities
. PDO 2.2 To implement sustainable infrastructure services
Road Safety education
Cleaning of roads reserves
19
Millennium
Development
Goals
National
Development Plan
2030
Western Cape
Provincial Strategic
Objectives
Cape Winelands
District Municipality
Strategic objectives
CWDM Pre-determined
objectives
CWDM
Programmes
and projects
Ensure
environmental
sustainability
Environmental
sustainability and
resilience
Strategic Goal 4 :
Enable a resilient,
sustainable, quality and
inclusive living
environment
To create an
environment and forge
partnerships that
ensures the health,
safety ,social and
economic development
of all communities
including the
empowerment of the
poor in the Cape
Winelands District
through economic,
environmental and
social infrastructure
investment.
. PDO1.1 Provide a comprehensive and equitable Municipal Health Service including Air Quality Management throughout the area of Cape Winelands District Municipality.
EPWP Invasive Alien Management Programme
River Rehabilitation
Environmental health education
Greening project
Eradicate extreme
poverty and hunger
Inclusive rural
economy
Strategic Goal 1 :
Creating opportunities
for growth and jobs
To create an
environment and forge
partnerships that
ensures the health,
safety ,social and
economic development
of all communities
including the
empowerment of the
poor in the Cape
Winelands District
PDO1.5: To facilitate, ensure and
monitor the development and
empowerment of the poor by
graduating people out of poverty,
social inclusion and improving the
livelihood of the poor, vulnerable
groups, rural farm dwellers and
rural communities.
Business
Retention
Expansion
Programme
for Tourism
Sector
CWDM/DEDA
T Municipal
Red Tap
Reduction
Programme

20
Millennium
Development
Goals
National
Development Plan
2030
Western Cape
Provincial Strategic
Objectives
Cape Winelands
District Municipality
Strategic objectives
CWDM Pre-determined
objectives
CWDM
Programmes
and projects
through economic
,environmental and
social infrastructure
investment
Entrepreneuri
al Seed Fund
LED
information/
intelligence
Achieve Universal
Primary Education
South Africa in the
region and the world
Strategic Goal 2 :
Improve education
outcomes and
opportunities for youth
development
To create an
environment and forge
partnerships that
ensures the health,
safety ,social and
economic development
of all communities
including the
empowerment of the
poor in the Cape
Winelands District
through economic,
environmental and
social infrastructure
investment
PDO1.4: To facilitate environmentally sustainable economic development planning through the development and maintenance of strategic partnerships, investment attraction, retention and opportunities, SMME support and development, skills development and information acknowledgement.
Investmen
t
Attraction
an
opportuniti
es
Programm
e
Trade
Mission/
Exhibition
s/ Expos
Tourism
Exhibition
s
Tourism
Education
als for
media and
21
Millennium
Development
Goals
National
Development Plan
2030
Western Cape
Provincial Strategic
Objectives
Cape Winelands
District Municipality
Strategic objectives
CWDM Pre-determined
objectives
CWDM
Programmes
and projects
tour
operators
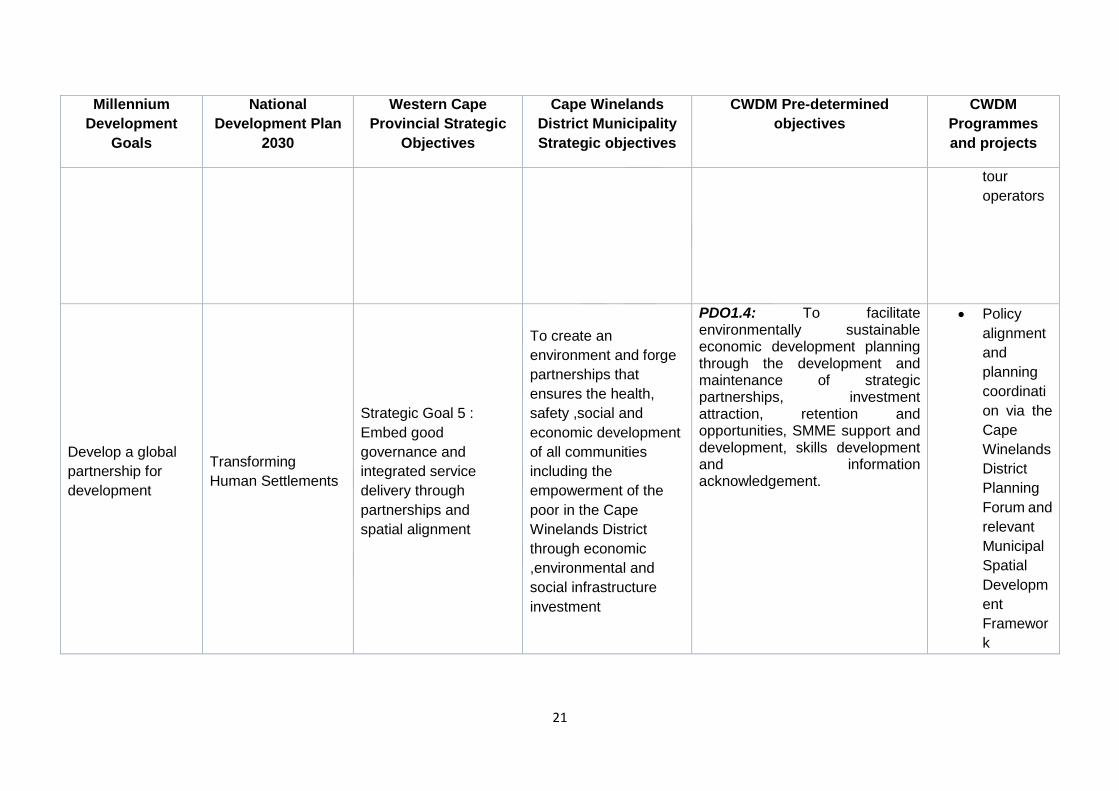
Develop a global
partnership for
development
Transforming
Human Settlements
Strategic Goal 5 :
Embed good
governance and
integrated service
delivery through
partnerships and
spatial alignment
To create an
environment and forge
partnerships that
ensures the health,
safety ,social and
economic development
of all communities
including the
empowerment of the
poor in the Cape
Winelands District
through economic
,environmental and
social infrastructure
investment
PDO1.4: To facilitate environmentally sustainable economic development planning through the development and maintenance of strategic partnerships, investment attraction, retention and opportunities, SMME support and development, skills development and information acknowledgement.
Policy
alignment
and
planning
coordinati
on via the
Cape
Winelands
District
Planning
Forum and
relevant
Municipal
Spatial
Developm
ent
Framewor
k

22
Millennium
Development
Goals
National
Development Plan
2030
Western Cape
Provincial Strategic
Objectives
Cape Winelands
District Municipality
Strategic objectives
CWDM Pre-determined
objectives
CWDM
Programmes
and projects
Committe
es
Eradicate extreme
poverty and hunger
Improving education,
training and
innovation
Strategic Goal 3 :
Increase wellness,
safety and tackle social
ills
To create an
environment and forge
partnerships that
ensures the health,
safety ,social and
economic development
of all communities
including the
empowerment of the
poor in the Cape
Winelands District
through economic
,environmental and
social infrastructure
investment
PDO1.5: To facilitate, ensure and
monitor the development and
empowerment of the poor by
graduating people out of poverty,
social inclusion and improving the
livelihood of the poor, vulnerable
groups, rural farm dwellers and
rural communities.
Awareness
programmes
Skills
development
Life skills
Artisan skills
development
Community
support
programme
Improve maternal
health
Combat HIV/AIDS,
malaria and other
diseases
Health care for all
Strategic Goal 3 :
Increase wellness,
safety and tackle social
ills
To create an
environment and forge
partnerships that
ensures the health,
safety ,social and
economic development
of all communities
including the
PDO1.1 Provide a comprehensive
and equitable Municipal Health
Service including Air Quality
Management throughout the area
of Cape Winelands District
Municipality
Environmental
health Education

23
Millennium
Development
Goals
National
Development Plan
2030
Western Cape
Provincial Strategic
Objectives
Cape Winelands
District Municipality
Strategic objectives
CWDM Pre-determined
objectives
CWDM
Programmes
and projects
empowerment of the
poor in the Cape
Winelands District
through economic
,environmental and
social infrastructure
investment
PDO1.5: To facilitate, ensure and
monitor the development and
empowerment of the poor by
graduating people out of poverty,
social inclusion and improving the
livelihood of the poor, vulnerable
groups, rural farm dwellers and
rural communities.
Awareness
programmes
Eradicate extreme
poverty and hunger Social protection
Strategic Goal 4 :
Enable a resilient,
sustainable, quality and
inclusive living
environment
To create an
environment and forge
partnerships that
ensures the health,
safety ,social and
economic development
of all communities
including the
empowerment of the
poor in the Cape
Winelands District
through economic,
environmental and
social infrastructure
investment
PDO1.5: To facilitate, ensure and
monitor the development and
empowerment of the poor by
graduating people out of poverty,
social inclusion and improving the
livelihood of the poor, vulnerable
groups, rural farm dwellers and
rural communities.
Community
Support
programme
Awareness
programmes
(Families and
Children)
Skills
development
Programme for
elderly
Programme for
disabled

24
Millennium
Development
Goals
National
Development Plan
2030
Western Cape
Provincial Strategic
Objectives
Cape Winelands
District Municipality
Strategic objectives
CWDM Pre-determined
objectives
CWDM
Programmes
and projects
N/A Building safer
communities
Strategic Goal 3 :
Increase wellness,
safety and tackle social
ills
To create an
environment and forge
partnerships that
ensures the health,
safety ,social and
economic development
of all communities
including the
empowerment of the
poor in the Cape
Winelands District
through economic
,environmental and
social infrastructure
investment
PDO1.2: Ensuring coordination of
multi-disciplinary and sectoral
disaster risk reduction through
integrated institutional capacity for
Disaster Risk management,
Disaster Risk Assessment,
Response and Recovery.
Disaster Risk
assessments
N/A Nation building and
social cohesion
Strategic Goal 5 :
Embed good
governance and
integrated service
delivery through
partnerships and
spatial alignment
To create an
environment and forge
partnerships that
ensures the health,
safety ,social and
economic development
of all communities
including the
empowerment of the
poor in the Cape
Winelands District
PDO1.5: To facilitate, ensure and
monitor the development and
empowerment of the poor by
graduating people out of poverty,
social inclusion and improving the
livelihood of the poor, vulnerable
groups, rural farm dwellers and
rural communities.
Sport,
Recreation, Arts
and Culture
Events/Festivals
Promote Easter
Weekend Rugby
Competitions
Business Against
Crime

25
Millennium
Development
Goals
National
Development Plan
2030
Western Cape
Provincial Strategic
Objectives
Cape Winelands
District Municipality
Strategic objectives
CWDM Pre-determined
objectives
CWDM
Programmes
and projects
through economic
,environmental and
social infrastructure
investment
N/A
Strategic Goal 4 :
Enable a resilient,
sustainable, quality and
inclusive living
environment
To create an
environment and forge
partnerships that
ensure the health,
safety ,social and
economic development
of all communities
including the
empowerment of the
poor in the Cape
Winelands District
through economic
,environmental and
social infrastructure
investment

26
1.6 THE MILLENNIUM DEVELOPMENTAL GOALS (MDGS)
The following represents the Millennium Development Goals:
Eradicate extreme poverty and hunger;
Achieve universal primary education;
Promote gender equality and empower women;
Reduce child mortality;
Improve maternal health;
Combat HIV/AIDS, malaria, and other diseases; and
Ensure environmental sustainability.
Develop a global partnership for development
1.7 NATIONAL DEVELOPMENT PLAN (NDP) –VISION FOR 2030
In 2012, the National Cabinet adopted the National Development Plan (NDP) to serve as a blueprint for the work that is still required in order to substantially reduce poverty and inequality in South Africa by 2030. The Western Cape Government broadly endorses the thrust of the NDP. The NDP offers a long-term perspective. It defines a desired destination and identifies the role different sectors of society need to play in reaching that goal. . The only sustainable way to reduce poverty is by creating opportunities for growth and jobs. According to the plan, South Africa can realise these goals by drawing on the energies of its people, growing an inclusive economy, building capabilities, enhancing the capacity of the state, and promoting leadership and partnerships throughout society.
Partnerships are central to both the NDP’s approach and to the fulfilment of the Western Cape Government’s mandate. Partnerships are not confined to organisations, institutions and businesses. Every family and every citizen is an active partner in his or her own development and that of the country, and citizens must use each opportunity to become the best they can be, and fulfil their social responsibilities. This philosophy is underpinned by the Constitution, which establishes the essential balance between rights and responsibilities.
1.8 NATIONAL GOVERNMENT’S OUTCOMES-ROLE OF LOCAL GOVERNMENT
National Government has agreed on 12 outcomes. The outcomes have been expanded into
high-level outputs and activities, which in turn formed the basis of a series of Performance
Agreements between the President and relevant Ministers.
Whilst all of the outcomes can to some extent be supported through the work of local
government, Outcome 9 (A responsive, accountable, effective and efficient local government
system) and Cape Winelands District Municipality is trying to comply with the 12 outcomes by
taking them into consideration in the Integrated Development Plan (IDP) process:
Improve the quality of basic education;
Improve health and life expectancy;
All people in South Africa protected and feel safe;

27
Decent employment through inclusive growth;
A skilled and capable workforce to support inclusive growth;
An efficient, competitive and responsive economic infrastructure network;
Vibrant, equitable and sustainable rural communities and food security;
Sustainable human settlements and improved quality of household life;
A responsive, accountable, effective and efficient local government system;
Protection and enhancement of environmental assets and natural resources;
A better South Africa, a better and safer Africa and world; and
A development-orientated public service and inclusive citizenship.
1.9 WESTERN CAPE GOVERNMENT– PROVINCIAL STRATEGIC GOALS
The Western Cape Government has identified the five PSGs to deliver on its vision and to help realise the objectives of the NDP over its five-year term. The PSGs are as follow: STRATEGIC GOAL 1 Creating opportunity for growth and jobs We are committed to creating an enabling environment to attract investment, grow the economy and create jobs by supporting high growth economic sectors. STRATEGIC GOAL 2 Improve education outcomes and opportunities for youth development. We’re committed to expanding quality education across the province and providing opportunities for youth to realise their full potential. STRATEGIC GOAL 3 Increase wellness, safety and tackle social ills We’re committed to addressing health, safety and social ills by supporting healthy communities, a healthy workforce, and healthy families, youth and children. STRATEGIC GOAL 4 Enable a resilient, sustainable, quality and inclusive living environment. We’re committed to improving urban and rural areas through enhanced management of land, an enhanced climate change plan, and better living conditions for all. STRATEGIC GOAL 5 Embed good governance and integrated service delivery through partnerships and spatial alignment. We’re committed to delivering good governance and an inclusive society that increases access to information, in partnership with active citizens, business and institutions. The PSGs translate the vision of “an open, opportunity society for all” into practical policies, strategies, programmes and projects. The Strategic Goals are the fulcrum of an actionable policy agenda designed to achieve quantified and measurable outcomes. Each of the five PSGs – together with the strategic priorities they set, the specific actions they will drive, and quantified targets they aim to achieve –

28
CHAPTER 2: STRATEGIC SUBSTANCE OF THE IDP
2.1 The legal obligation / mandate
On 3 August 2016 a new Council was elected during the Local Government Elections. The newly elected Council has embarked on a vigorous and very inclusive process of shaping the vision and strategic direction of the Cape Winelands District Municipality (CWDM) for the duration of their five-year tenure. The document as presented here embodies the hopes, aspirations and unwavering trust in the future of the Cape Winelands region by communities, public representatives (Council) and the Administration. It is a shared commitment to work tirelessly to ensure a better Cape Winelands for all. The legal framework for integrated development planning is contained in Chapter 5 of the Local Government: Municipal Systems Act, 2000 (Act No 32 of 2000). With regard to the core components of integrated development plans, section 26 of the Local Government: Municipal Systems Act, 2000 (Act No 32 of 2000) stipulates that: “An integrated development plan must reflect-
(a) the municipal council’s vision for the long term development of the municipality with
special emphasis on the municipality’s most critical development and internal transformation needs;
(b) an assessment of the existing level of development in the municipality, which must include an identification of communities which do not have access to basic municipal services;
(c) the council’s development priorities and objectives for its elected term, including its local economic development aims and its internal transformation needs;
(d) the council’s development strategies which must be aligned with any national and provincial sectoral plans and planning requirements binding on the municipality in terms of legislation;
(e) a spatial development framework which must include the provision of basic guidelines for a land use management system for the municipality;
(f) the council’s operational strategies; (g) applicable disaster management plans; (h) a financial plan, which must include a budget projection for at least the next three years;
and (i) the key performance indicators and performance targets determined in terms of section
41.”
The key to ensuring the co-ordination of the IDP and Annual Budget is the development of the Service Delivery and Budget Implementation Plan (SDBIP). The SDBIP is a detailed plan approved by the Executive Mayor of the Cape Winelands District Municipality (CWDM) for the implementation of service delivery and the Annual Budget. The SDBIP includes monthly revenue and expenditure projections, quarterly service delivery targets and performance indicators. The Local Government: Municipal Systems Act, 2000 (Act No 32 of 2000) states that key performance indicators must be part of the IDP. The SDBIP specifies that the Performance Contracts of Senior Managers must form part of the approval of the SDBIP. The 4th Generation IDP Draft 2017/2018-2020/21 for the CWDM aligns the SDBIP key performance indicators, the key performance indicators of the senior managers with the key programmes, as well as the municipal scorecard in the IDP.

29
Legislative Alignment between the IDP/Budget and Performance Management Targets
In terms of the Local Government: Municipal Systems Act, 2000 (Act No 32 of 2000), the Cape Winelands District Municipality (CWDM) is required to formulate an Integrated Development Plan (IDP) made up of the following components:
A vision of the long-term development of the CWDM;
An assessment of the existing level of development in the CWDM which must include an identification of the need for basic municipal services;
The CWDM development priorities and objectives for its elected term;
The CWDM development strategies which must be aligned with any national or provincial sectoral plans and planning requirements;
A spatial development framework which must include the provision of basic guidelines for a land use management system;
The CWDM operational strategies;
A disaster management plan;
A financial plan, which must include a budget projection for at least the next three years; and
Key performance indicators and performance targets.
Regulation 2 of the Local Government: Municipal Planning and Performance Management Regulations (2001) sets out the following further requirements for an IDP:
An institutional framework for implementation of the IDP and to address the municipality’s internal transformation;
Investment initiatives should be clarified;
Development initiatives including infrastructure, physical, social and institutional development and;
All known projects, plans and programmes to be implemented within the municipality by any organ of state.
Key performance indicators set by the municipality.
In addition, the Local Government: Municipal Finance Management Act, 2003 (Act No 56 of 2003) (MFMA) provides for closer alignment between the Annual Budget and the compilation of the IDP. This can be understood as a response to the critique that IDP formulation took place in isolation from financial planning and IDPs were rarely implemented in full as a result. Specifically, section 21(1) of the MFMA stipulates that the Executive Mayor must co-ordinate the process for preparing the Annual Budget and for reviewing the CWDM’s IDP to ensure that both the budget and IDP are mutually consistent and credible.

30
2.2 The role of a district municipality
South Africa celebrated 21 years of its democratic system and Local Government on the 5
December 2015, celebrated 15 years of democratic and developmental local government.
Local government consists of three different types of municipalities – metropolitan, district
and local municipalities.
The promulgation of the Local Government: Municipal Structures Act, 1998 (the Structures
Act) provided the legislative framework for the consolidation and rationalisation of
municipalities in accordance with the Constitution. When district councils were initially
established, their functions were not clearly defined in legislation. The Structures Act brought
about greater clarity around the functions of district municipalities by giving them
responsibility over key service delivery areas such as water, sanitation, electricity, municipal
health services and other district-wide functions (e.g. fire-fighting, passenger transport,
promotion of tourism). The Structures Act further allows for the adjustment of the division of
powers between the district and local municipalities.
The Constitution outlined the role of districts to:
a) Redistribute resources within a district according to need;
b) Assist and capacitate local municipalities to enable them to provide, and sustain the
provision of services in their areas; and
c) Promote economic development in the district because sustainability of service provision
(as well as the general well-being of the inhabitants) is dependent on a productive local
economy.
The White paper on Local Government, 1998 identified the following four key role that district
municipalities should fulfil:
a) District integrated development planning as a statutory mandate of all district
governments;
b) To serve as infrastructural development agents, involving planning and developing bulk
infrastructure in non-metro municipalities;
c) The provision of technical assistance to local municipalities including facilitation the
sharing of specialised capacity and equipment between municipalities, assisting in the
development of cooperative relations between municipalities, assistance in the preparation
of the budgets, consolidated municipal infrastructure programme applications, tenders,
drafting by-laws;
d) District to the point of coordination for national and provincial capacity building
programmes and location of support and training infrastructure.

31
Section 88 of the Local Government: Structures Act, 1998, calls for cooperation between
district and local municipalities that:-
• A district municipality and local municipalities within the area of that district municipality
must co-operate with one another by assisting and supporting each other;
• A district municipality on request by a local municipality within its area may provide
financial, technical and administrative support services to that local municipality to the extent
that that district has the capacity to provide those support services;
• A local municipality may provide financial, technical or administrative support services to
another local municipality within the area of the same district 3 municipality to the extent that
it has the capacity to provide those support services, if the district municipality or that local
municipality so requests;
• The MEC for local government in a province must assist a district municipality to provide
support services to a local municipality.
Source: SALGA
2.3 Synopsis report on the IDP / Budget
In terms of Chapter 5 and Section 27 of the Municipal Systems Act (2000), districts are
required to prepare and adopt a Framework Plan which indicates how the district and local
municipalities will align their IDP’s.
The Framework is the most important strategic document for aligning the planning process for
Integrated Development Plans (IDPs) among the 3 spheres of government. This document
can be defined as follows: A coordinating document for the district to ensure an
integrated and parallel planning process at national, provincial, district and local level,
with the objective of ensuring that the process of formulating district and local IDPs is
interrelated and mutually reconcilable.
It is important that the Framework be informed by certain responsibilities, which are entrusted
to district and local municipalities in terms of legislation. Therefore, the Framework is prepared
jointly by all the municipalities, with the district municipality playing a leading role. The
Framework is binding on the district as well as the local municipalities.
The objectives of the District’s Framework, which is binding on all the municipalities in the
district, are:
1. To serve as a guiding model for integrated development planning by the CWDM &
local municipalities;
2. To involve and integrate all relevant role-players;
3. To ensure that all the local authorities in the district fulfil the responsibilities entrusted

32
to them by legislation in the form of powers & functions;
4. To bring about cooperative governance in the regional context and to align and
coordinate development planning at local government level;
5. To guide the modus operandi of local government, in particular with regard to aspects
of integrated development;
6. To ensure that the needs of communities & interest groups are identified,
acknowledged and addressed;
7. To ensure and coordinate the effective use of resources (financial, human & natural);
8. To keep up to date with legislation; and
9. To ensure that the above-mentioned approved policy and strategies are taken into
consideration in future development planning in the Cape Winelands.
The IDP/Budget Review Process can be summed up as follows:
TIM
E
SC
HE
DU
LE
The Cape Winelands District IDP Strategic Management Framework was adopted by the Council of the CWDM and approved by the District Coordinating Forum. List of all engagements and participation mechanisms are displayed.
AN
AL
YS
IS
Community Input – Two Stakeholder Engagements was held 8 and 9 February 2017 with a wide range of sector representatives as well as different organisations, NGO’s and NPO’s of the community.
Performance Analysis – This phase involved the assessment of the performance of the municipality and the determination of areas of change for the next three years. The Annual Report of the municipality was tabled at a Council meeting held on 26 January 2017 and will be approved on 30 March 2017.
Financial Analysis – In analysing the financial capacity and position of the municipality. The Adjustment Budget approved at a Council meeting held on 23 February 2017 was indicative of the financial viability of the municipality and a strong emphasis was placed on increased fiscal discipline and cost saving measures to enhance the financial stability of the municipality.
Situational Analysis –The socio-economic profile as well as the MERO 2016 compiled by Provincial Treasury and the municipality’s analysis were key in providing guidance on strategic priorities for the five-year plan of the municipality.
Intergovernmental Alignment – Joint Planning Initiatives, led by the Provincial Department of Local Government were held during this period to facilitate better alignment between provincial and local priorities. It also assisted Provincial Government in developing better municipal support plans that will enable municipalities to perform their statutory functions.
ST
RA
TE
GY
The Cape Winelands Spatial Development Framework was adopted in 2011, the SDF is in the process of being reviewed. A number of policies were revised to create better synergy between IDP priorities and policy positions.
33
PR
OG
RA
MM
ES
,
PR
OJ
EC
TS
AN
D
PR
EL
IMIN
AR
Y B
UD
GE
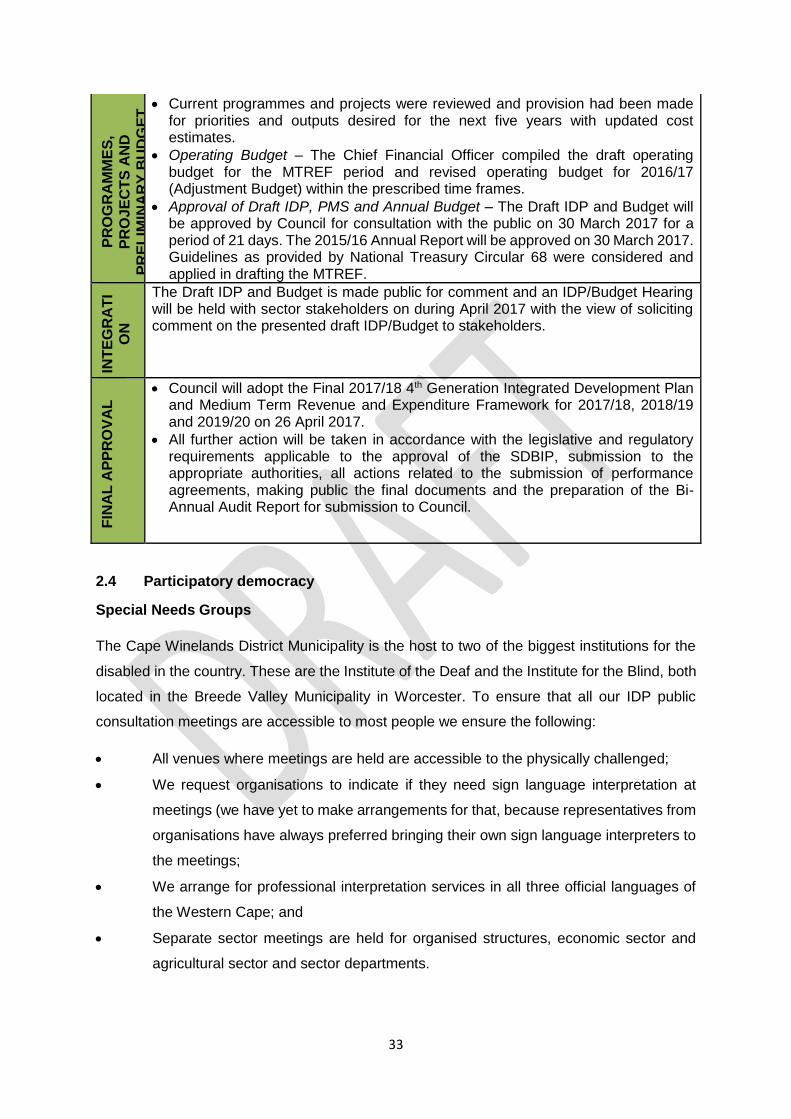
T Current programmes and projects were reviewed and provision had been made
for priorities and outputs desired for the next five years with updated cost estimates.
Operating Budget – The Chief Financial Officer compiled the draft operating budget for the MTREF period and revised operating budget for 2016/17 (Adjustment Budget) within the prescribed time frames.
Approval of Draft IDP, PMS and Annual Budget – The Draft IDP and Budget will be approved by Council for consultation with the public on 30 March 2017 for a period of 21 days. The 2015/16 Annual Report will be approved on 30 March 2017. Guidelines as provided by National Treasury Circular 68 were considered and applied in drafting the MTREF.
INT
EG
RA
TI
ON
The Draft IDP and Budget is made public for comment and an IDP/Budget Hearing will be held with sector stakeholders on during April 2017 with the view of soliciting comment on the presented draft IDP/Budget to stakeholders.
FIN
AL
AP
PR
OV
AL
Council will adopt the Final 2017/18 4th Generation Integrated Development Plan and Medium Term Revenue and Expenditure Framework for 2017/18, 2018/19 and 2019/20 on 26 April 2017.
All further action will be taken in accordance with the legislative and regulatory requirements applicable to the approval of the SDBIP, submission to the appropriate authorities, all actions related to the submission of performance agreements, making public the final documents and the preparation of the Bi-Annual Audit Report for submission to Council.
2.4 Participatory democracy
Special Needs Groups
The Cape Winelands District Municipality is the host to two of the biggest institutions for the
disabled in the country. These are the Institute of the Deaf and the Institute for the Blind, both
located in the Breede Valley Municipality in Worcester. To ensure that all our IDP public
consultation meetings are accessible to most people we ensure the following:
All venues where meetings are held are accessible to the physically challenged;
We request organisations to indicate if they need sign language interpretation at
meetings (we have yet to make arrangements for that, because representatives from
organisations have always preferred bringing their own sign language interpreters to
the meetings;
We arrange for professional interpretation services in all three official languages of
the Western Cape; and
Separate sector meetings are held for organised structures, economic sector and
agricultural sector and sector departments.

34
2.5 Stakeholder Activation
The following efforts are made to activate participants:
All departments are involved in activating their stakeholders who participate in sector
plan development to attend meetings;
The Unit: Rural and Social Development’s officials are key in mobilising farm dwellers
through our civil society partner, the Health and Development Committees and other
groupings;
Transport is arranged for those stakeholders who have indicated a need; and
The Cape Winelands District Municipality has an IDP Communication Plan that is
executed with the assistance of our Communication Services which includes the
following avenues for dissemination of information and channels.
Local municipalities also make Ward Committees and CDW’s available to assist with
mobilisation during IDP meetings

35
2.6 RESPONSE ON PUBLIC INPUT
STRATEGIC OBJECTIVE
STRATEGIC AREA IDENTIFIED ISSUES CWDM ACTIONS / RESPONSE
SO1 Health Oral health and dental care
Water and sanitation awareness
Transport plans for patients
Shelter at Zwelethemba clinic
CWDM are educating learners through interactive theatre regarding all health issues and water wise education
CWDM referred to Dept of Health
Youth Assistance regarding matriculates on farms
Department Rural and Social Development provides opportunities for learners to attend career guidance exhibitions.
Mayoral Bursary Fund
Skills training and development Dept Rural and Social Development has various programmes:
Skills development progamme
Life skill programme
Career exhibitions
Educational excursions
Sport and Recreation More opportunities for youth and especially young men
CWDM budgeted for the following projects:
Business Against Crime
Freedom Run
Easter Sport Tournament
Drama Festival
Sport Awards
More support for NGO’s and community organisations
Dept of Rural and Social Development has a Community Support programme to assist NGO’s and other community organisation
Disability Educating citizens to communicate with deaf people
CWDM provides hearing aids
4 deaf people appointed at CWDM, Worcester Office

36
Agriculture Dept of Agriculture reiterated the importance of saving water
Tourism What are the plans to improve the tourism sector?
CWDM focuses on Tourism and transformation – we are creating opportunities for our young people.
Seed funding applications
SO2 Water and sanitation There are still farm dwellers without water and sanitation
CWDM provides subsidy for farm owners for water and sanitation services for farm dwellers.
Railway tracks Support with railway tracks form Worcester to De Doorns
Referred to Dept of Transport and Public Works

37
2.7 IDP/BUDGET PUBLIC PARTICIPATION ROAD MAP
CWDM IDP/BUDGET Road Map for Public Participation 2016/17 MUNICIPALITY VENUE START DATE END DATE
PUBLIC PARTICIPATION (with sectors)
Stellenbosch Stellenbosch Council chambers 03/10/2016 30/11/2016
Drakenstein Huguenot Hall 03/10/2016 30/11/2016
Witzenberg Ceres Town Hall 03/10/2016 30/11/2016
Breede Valley Worcester Town Hall 03/10/2016 30/11/2016
Langeberg Robertson Town Hall 03/10/2016 30/11/2016
DISTRICT CONSULTATION MEETINGS
CWDM Consultation Meeting Paarl East Thusong Centre 03/10/2016 30/11/2016
CWDM IDP/Budget Hearing Worcester Town Hall 01/04/2017 28/04/2017
BUDGET PROCESS
Financial analysis CWDM Office Stellenbosch 2016-09-05 2016-12-16
Programmes, Projects & Preliminary Capital Budget
CWDM Office Stellenbosch 2016-09-05 2016-12-16
Priorities and Outputs CWDM Office Stellenbosch 2016-09-05 2016-12-16
Operating Budget CWDM Office Stellenbosch 2016-09-05 2016-12-16
Final Approval of IDP, PMS and Annual Budget
CWDM Office Stellenbosch 2017-05-01 2017-05-31
DISTRICT ENGAGEMENTS WITH PGWC ON THE ROLL OUT OF THE WESTERN CAPE DELIVERY PLAN
Joint planning process with PGWC
2016/08/01 - 2017/04/27
IDP INDABA 1
IDP INDABA 2
LGMTEC 1
LGMTEC 2
LGMTEC 3

38
Chapter 3: Situational Analysis
3.1 Introduction
The local municipalities in the Cape Winelands District Municipality are the Witzenberg,
Drakenstein, Stellenbosch, Breede Valley, and Langeberg Municipalities.
Section 26 of the MSA determines that an IDP must reflect amongst others an assessment of
the existing level of development in the municipality. The previous Chapter deals meticulously
with the policy and legislative framework of integrated development planning.
This Chapter thus seeks to illuminate the Cape Winelands District Municipality’s locality,
people and institutional context. The Cape Winelands District Municipality consists of its
political division (Council), the Administrative segment and the community and all play a critical
role in determining the district’s development context.
3.2 Cape Winelands locality profile
National context: The Cape Winelands District Municipality is situated in the Western Cape
Province and is one of 51 district municipalities in South Africa. The Western Cape Province
is located in the south-western tip of the African continent, bordering the Northern Cape in the
north, the Eastern Cape in the east, the Atlantic Ocean on the west, and the Indian Ocean in
the south. The province covers a geographical area of 129 370 km2, constituting 10.6% of the
total land area of the country.
Regional context: The Cape Winelands district is situated next to the Cape Metropolitan
area and encloses 22 309 km². It is a landlocked area in-between the West Coast and
Overberg coastal regions. The district includes five local municipalities, namely Drakenstein,
Stellenbosch, Witzenberg, Breede Valley and Langeberg Municipality. The area is one of the
“pearls” of South Africa’s rural and small-town sub-regions, but disparate with a relatively high
and diverse level of development.
Topographical Conditions: The combination of the physical contextual characteristics of the
Cape Winelands area, including topography, climate hydrology, geology, soil and indigenous
vegetation, has a direct effect on economic activity (in particular agricultural and related
production) and tourism, as well as settlement patterns in the district.
The area has a Mediterranean climate, which is characterised by hot, dry summers and cold
to moderate, wet winters. The different conditions climatologically have a direct impact on the
various agricultural activities in the sub regions. Approximately 65% – 80% of the area’s rainfall
occurs between April and September. The Cape Winelands mountain ranges are the most

39
significant aspect of the region. Together with a number of important rivers they form the
spines of the rich valleys, which provide much of the wealth of the Cape Winelands economy.
The region is well endowed with both public and private nature areas in the District that
conserve the wild life and the floral kingdom of the area. Nevertheless, the Cape Winelands
area faces a number of significant threats to the biophysical environment. These include:
Over consumption of water relative to available resources with parts of rivers often
pumped dry during the dry mid-summer. Together with the pollution of water sources
in some areas, this problem has a detrimental effect on the natural environment;
Water quality is negatively affected by farming activities, informal settlements,
leaching from land-fill sites and unsuitable sewage removal systems that lead to river
pollution; and
Other problems include erosion, soil pollution loss of biodiversity and natural beauty,
particularly on the lower mountain slopes through agriculture and infrastructural
development.
Environmental Context: The health of ecosystem services in the Cape Winelands District is
deteriorating gradually. Without the necessary interventions, this will lead to a crisis in the
ability of these ecosystem services to support the sustainable economic development and
improved quality of life that the District Municipality strives for in its area of jurisdiction. Human
activity in the Cape Winelands District Area is imposing pressures on the continued ability of
the ecosystem to deliver ecosystem services into the future.
From a regional perspective, the Cape Winelands District forms part of an area with
high agricultural potential, stretching westwards across the District boundary. The
District’s western half has significant run-off areas that should be managed as an
important resource (see Fig 3.1: Natural Assets). Sensitive ecosystems and protected
areas occur in the District, requiring a joint management approach with adjacent
authorities (see Fig 3.2).

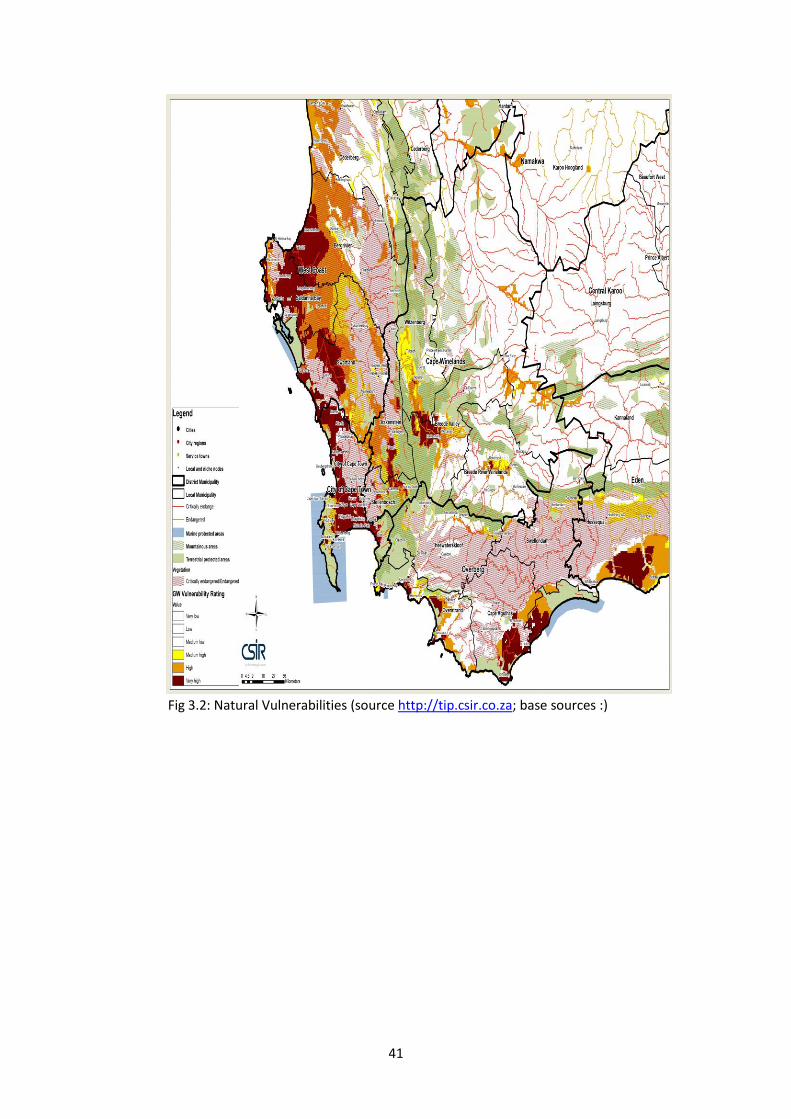
41
Fig 3.2: Natural Vulnerabilities (source http://tip.csir.co.za; base sources :)

42
3.3 CAPE WINELANDS SOCIO-ECONOMIC SNAPSHOT

43
3.4 DEMOGRAPHIC PROFILE - Municipal socio-economic analysis
Introduction
Demographics is broadly defined as the study of population dynamics which is significantly
influenced by a wide array of factors such as birth and death rates, migration patterns, age,
race, gender, life expectancy etc. The importance of understanding demographics as a
decisive factor in shaping our current socio-economic reality is therefore critical for
governments, economists and politicians alike.
The following section provides a concise, yet meaningful overview of the most prominent
demographic indicators relevant for municipal planning and budgeting. It is contended that the
population and household statistics provided hereto will assist municipalities to set accurate
and credible service delivery targets across the new 5-year integrated development cycle.
POPULATION BREAKDOWN
Other than the Cape Metro, Cape Winelands has the largest population of all districts in the
Western Cape which, according to the forecasts of the Western Cape Department of Social
Development, is estimated to be 853 423 in 20171. This total gradually increases across the
5-year planning cycle and is expected to reach 913 388 by 2023. This equates to an
approximate 7.0 per cent growth of the 2017 base estimate.
In 2017, Cape Winelands population gender breakdown will be relatively evenly split between
male (420 125, 49.2 per cent) and female (433 298, 50.8 per cent). For 2023, the split is
anticipated to be 448 958 (49.2) and 464 430 (50.8) for males and females respectively.
1 The data provided hereto serves as a 2017 – 2023 forecast to coincide with the new 5-year IDP planning cycle.
Municipalities are however urged to consult the results of the 2016 Community Survey for the 2016 population count.
853 423 Total estimated population size in 2017.
913 388 Total estimated population size in 2023.

44
AGE DISTRIBUTION
The Cape Winelands District’s population is in 2017 expected to be heavily concentrated
within the youth age groups which could possibly result in an increasing dependency ratio.
The region could also potentially face a challenge to absorb these youth into the local labour
market, especially considering the increased demand for skilled and semi-skilled labour within
prominent economic industries such as commercial services, manufacturing and agriculture.
HOUSEHOLDS
AGE COHORTS
0
10 000
20 000
30 000
40 000
50 000
0-4 5-9 10-14 15-19 20-24 25-29 30-34 35-39 40-44 45-49 50-54 55-59 60-64 65-69 70-74 75-79 80-84 85+
Males Females
In order to ensure basic service delivery to all, municipal
budget allocations should be informed by credible and
accurate assumptions regarding the number of households
within a municipal area.
According to Census 2011, there were 198 265 households
within the greater Cape Winelands District. As per the 2016
Community Survey estimates, the number of households
increased to 236 006 which equates to a 19.0 per cent
increase off the 2011 base.

45
Cape Winelands has rising dependency ratios of 44.9, 46.0 and 47.0 across 2011, 2017 and
2023 respectively. As higher dependency ratios imply greater strain on the working age to
support their economic dependents (children and aged), this increase will have far reaching
social, economic and labour market implications.
An increase in the dependency ratio is often associated with a relative decrease in the working
age population. From a national perspective, the relative decrease in the working age
population will result in lower tax revenues, pension shortfalls and overall inequality as citizens
struggle to tend to the needs of their dependents amidst increased economic hardship.
At the municipal level, this decrease in the working population will also result in a smaller base
from which local authorities can collect revenue for basic services rendered and will
necessitate the prioritisation of spending on social services such as education, health and
welfare.
3.5 EDUCATION
Education and training improves access to employment opportunities and helps to sustain and
accelerate overall development. It expands the range of options available from which a person
can choose to create opportunities for a fulfilling life. Through indirect positive effects on health
and life expectancy, the level of education of a population also influences its welfare.
LITERACY
Literacy is used to indicate a minimum education level attained. A simple definition of literacy
is the ability to read and write, but it is more strictly defined as the successful completion of a
minimum of 7 years of formal education. Since most learners start school at the age of 7 years,
the literacy rate is calculated as the proportion of those 14 years and older who have
successfully completed a minimum of 7 years of formal education. The literacy rate for the
Cape Winelands District was recorded at 81.7 per cent in 2011 which is lower than the average
literacy rates of the Western Cape (87.2 per cent). Cape Winelands’ rate is however slightly
higher than the rate of the rest of South Africa (80.9 per cent).
Year Children:
0 – 14 Years Working Age: 15 – 65 Years
Aged: 65 +
Dependency Ratio
2011 203 475 543 600 40 415 44.9
2017 218 017 584 659 50 747 46.0
2023 227 740 621 301 64 346 47.0

46
LEARNER ENROLMENT
Learner enrolment in the Cape Winelands District dropped by 1 731 learners between 2013
and 2014, which might be due to the inclusion of data on learners with special education needs
(LSEN) in the 2013 WCED survey. Learner enrolment increased with 2175 learners between
2014 and 2015.
LEARNER-TEACHER RATIO
GRADE 12 DROP-OUT RATES
The drop-out rate for learners within the Cape Winelands District that enrolled from Grade 10
in 2014 to Grade 12 in 2016 was recorded at 31.7 per cent, which higher than the average
drop-out rate for the District over the same period. These high levels of high school drop-outs
are influenced by a wide array of socio-economic factors including teenage pregnancies,
availability of no-fee schools, indigent households and unemployment.
EDUCATIONAL FACILITIES
The availability of adequate education facilities such as schools, FET colleges and schools
equipped with libraries and media centres could affect academic outcomes positively.
101 574
101 165
102 412
100 400
100 600
100 800
101 000
101 200
101 400
101 600
101 800
102 000
102 200
102 400
102 600
Learner Enrolment 2013
(Gr 1 - 12 + LSEN)
Learner Enrolment ASS 2014 Learner Enrolment ASS 2015
The learner-teacher ratio within Cape Winelands was
below 30 in 2012 and 2014, however the number of
learners per teacher increased to 31.1 in 2013 and 36.1 in
2015. According to the Department of Education the
number of learners per teacher was 30.3 in 2010. Factors
influencing the learner-teacher ratio is the ability of
schools to employ more educators when needed and
the ability to collect school fees.

47
The Cape Winelands District had 272 schools in 2015 which had to accommodate
141 263 learners.
Given the tough economic climate, schools have been reporting an increase in parents being
unable to pay their school fees. Nevertheless, the proportion of no-fee schools has remained
relatively unchanged between 2014 and 2015, which could in future further increase the drop-
out rate.
The number of schools equipped with a library increased from 143 in 2014 to 151 in 2015.
Total number of
schools
Proportion of no
fee schools
Number of schools
with libraries
2014 272 77,1% 143
2015 272 77,0% 151
272
77,1%
143
272
77,0%
151
0
50
100
150
200
250
300

48
EDUCATION OUTCOMES
Education remains one of the key avenues through which the state
is involved in the economy. In preparing individuals for future
engagement in the labour market, policy choices and decisions in
the sphere of education play a critical role in determining the extent
to which future economic and poverty reduction plans can be
realised.
Cape Winelands’ matric outcomes have remained consistently above 80.0 per cent between
2013 and 2015, with the highest pass rate of 88.8 per cent recorded in 2013. Despite is overall
high pass rates, the Cape Winelands District had the lowest rate of all other districts in 2015.
Western
Cape
City of Cape
TownWest Coast
Cape
WinelandsOverberg Eden
Central
Karoo
2013 84,7% 83,2% 88,4% 88,8% 89,8% 88,2% 80,9%
2014 82,2% 81,7% 88,4% 88,3% 88,1% 81,5% 70,0%
2015 84,7% 83,6% 89,8% 82,3% 91,3% 85,9% 88,6%
0,0%
10,0%
20,0%
30,0%
40,0%
50,0%
60,0%
70,0%
80,0%
90,0%
100,0%

49
3.6 HEALTH
Good health is vital to achieving and maintaining a high quality of life. A diverse range of
factors play a role in ensuring the good health of communities and that disease, especially
preventable and contagious/communicable ones, are kept at bay. Some of the factors include
lifestyle features that also depend on the provision of high quality municipal services, such as
clean water, sanitation and the removal of solid waste.
The information provided by the Department of Health as detailed in this section, pertains only
to public sector healthcare institutions. Any privately provided facilities or services are not
reflected in the information below.
HEALTHCARE FACILITIES
All citizens’ rights to access to healthcare services are directly affected by the number and
spread of facilities within their geographical reach. South Africa’s healthcare system is geared
in such a way that people have to move from primary, with a referral system, to secondary
and tertiary levels.
The Western Cape Province has a range of primary healthcare facilities which includes
208 fixed clinics, 164 mobile/satellite clinics, 58 community day centres, 34 district hospitals
and 5 regional hospitals. Of these facilities, 41 fixed clinics, 34 mobile/satellite clinics,
6 community day centres and 4 district hospitals are situated within the Cape Winelands
District.
EMERGENCY MEDICAL SERVICES
Health Indicator Cape
Winelands
Western
Cape
EMS Operational
Ambulances 36 228
Population (2017) 853 423 6 264 790
No. of operational
ambulances per
10 000 people
0.42 0.36
41
28
6
0
6
47
4
2
208
92
72
9
58
275
34
5
Number of PHC clinics - fixed
Number of PHC clinics - non-fixed (mobiles)
Number of PHC clinics - non-fixed (Satellites)
Community Health Centres
Community Day Centres
Total number of PHC facilities (Fixed Clinics, CHCs and CDCs)
Number of district hospitals
Number of regional hospitals
Cape Winelands Western Cape

50
Access to emergency medical services is critical for rural citizens due to rural distances
between towns and health facilities being much greater than in the urban areas. Combined
with the relatively lower population per square kilometre in rural areas, ambulance coverage
is greater in rural areas in order to maintain adequate coverage for rural communities. Within
the Cape Winelands District, there are 0.42 ambulances available per 10 000 population,
higher than the provincial average of 0.36.
HIV/AIDS
At the end of March 2016, anti-retroviral treatment (ART) was provided to over
200 000 persons in the Province, 23 172 of whom were in the Cape Winelands District. At the
end of March 2016, 5 195 new ART patients were being treated from 41 treatment sites in the
Cape Winelands District.
In addition to improving the quality of life of the patient, anti-retroviral treatment to mothers
both before and at birth, also decreases the chances that infants will contract HIV from their
mothers. The most recent information for the Cape Winelands District indicates a
mother-to-child transmission rate of 1.7 per cent which is higher than the 1.4 per cent
Provincial rate.
TUBERCULOSIS
7 200
7 250
7 300
7 350
7 400
7 450
7 500
7 550
7 600
Number of TB
patients
2013/14
Number of TB
patients 2014/15
Number of TB
patients
2015/16
Health Indicataor Cape
Winelands
Western
Cape
Total registered patients
receiving ART 23 172 203 565
No. of new ART patients 5 195 43 363
HIV Transmission Rate 1.7% 1.4%

51
The number of TB patients in the Province has decreased over the past few years, dropping
to 43 294 in 2015/16 treated at 451 clinics or treatment sites. In the Cape Winelands District,
the number of TB patients has decreased over the last year, reaching 7 531 in 2016 treated
at 102 clinics or treatment sites.
CHILD HEALTH
In 2015, the full immunisation coverage rate for the Cape Winelands was 78.4 per cent,
compared to 88.8 per cent in the Province. This is a slight deterioration from the 2014 rate of
79.0 per cent.
The number of malnourished children under five years in the Cape Winelands in 2015 was
1.4 per 100 000 children. The District’s rate is currently lower than the Provincial rate.
The District’s neonatal mortality rate (6.5) is slightly above the Province’s 2019 target of 6.0
per 1 000 live births, but has shown a deterioration from the 2014 rate of 4.9.
In the Cape Winelands District, 15 per cent of babies were born underweight, compared to
the Provincial average of 14.5 per cent.
DEFINITIONS
Immunisation: Immunisation protects both adults and children against preventable infectious
diseases. Low immunisation rates speak to the need for parents to understand the critical
importance of immunisation, as well as the need to encourage parents to have their young
children immunised.
Malnutrition: Malnutrition (either under- or over nutrition) refers to the condition whereby an
individual does not receive adequate amounts or receives excessive amounts of nutrients.
Neonatal mortality rate: The first 28 days of life – the neonatal period - represent the most
vulnerable time for a child’s survival. The neonatal mortality rate is the number of neonates
dying before reaching 28 days of age, per 1 000 live births in a given year. The Province has
a target of 6.0 per 1 000 live births by 2019.
Health Indicator Cape
Winelands
Western
Cape
Immunisation 78.4% 88.8%
Malnutrition 1.4 2.4
Neonatal mortality rate 6.5 5.0
Low birth weight 15% 14.5%

52
DEFINITIONS
Maternal health refers to the health of women during pregnancy, childbirth and the
postpartum period.
Maternal mortality rate: Maternal death is death occurring during pregnancy, childbirth
and the puerperium of a woman while pregnant or within 42 days of termination of
pregnancy, irrespective of the duration and site of pregnancy and irrespective of the cause
of death (obstetric and non-obstetric).
Births to teenage mothers: Teenage pregnancy is almost always unplanned; as a result
when young parents are placed in a position to care for their children, life can become
particularly tough, especially if they do not have family or social support.
Termination of pregnancy: Government hospitals, designated private doctors and
gynaecologists, and non-profit providers offer safe and legal termination of pregnancy. To
have a free abortion, the request must be made at a primary healthcare clinic, where the
pregnancy will be confirmed, counselling provided, an appointment made, and a referral
letter be given to a facility where the procedure can be performed.
Low birth weight: Low birth weight is defined as weight at birth of less than 2 500 g. Low birth
weight is associated with a range of both short- and long term consequences.
MATERNAL HEALTH
Maternal mortality rate: Cape Winelands District’s most recent figures show a maternal
mortality ratio of 46.5 per 100 000 live births compared to the Provincial ratio of 58.3. The
Province has a maternal mortality ratio target of 65 by 2019.
Births to teenage mothers: In the 2015, the delivery rate to women under 18 years in the
Cape Winelands was 6.1 per cent, which is higher than the Provincial rate at 5.5 per cent.
Termination of pregnancy: Cape Winelands District’s termination of pregnancy rate of 0.7
per 1 000 live births is lower than the Province’s ratio at 1.1.
Overall, half of the indicators for child and maternal health have improved in the last year
within the Cape Winelands District which indicates that the District is making progress in
reaching its health targets. Positive progress has particularly been made with regards to the
maternal mortality rate as well as the termination of pregnancy rate which has dropped in the
last year.
Health Indicator Cape
Winelands
Western
Cape
Maternal Mortality Ratio 46.5 58.3
Delivery Rate to Women under
18 years 6.1% 5.5%
Termination of Pregnancy Rate 0.7 1.1

53
3.7 POVERTY
The intensity of poverty as well as the poverty headcount of municipalities is analysed in this
section. The intensity of poverty is measured by calculating the Poverty Gap Index, which is
the average poverty gap in the population as a proportion of the poverty line. The Poverty Gap
Index estimates the depth of poverty by considering how far, on the average, the poor are
from that poverty line. The Poverty Gap Index is a percentage between 0 and 100 per cent. A
theoretical value of zero implies that no one in the population is below the poverty line.
Individuals whose income is above the poverty line have a gap of zero while individuals whose
income is below the poverty line would have a gap ranging from 1 per cent to 100 per cent,
with a theoretical value of 100 per cent implying that everyone in the population has an income
that is below the poverty line or zero. A higher poverty gap index means that poverty is more
severe.
This section also provides information on annual household income for residents living within
the Cape Winelands District. Poverty tends to be prevalent in areas where the majority of
households fall within the low income bracket.
POVERTY HEADCOUNT AND INTENSITY
The number of poor people within the Cape Winelands District increased from 2.5 per cent of
the population in 2011 to 3.1 per cent in 2016. The increasing poverty headcount in the District
is a concern as it may strain municipal financial resources.
Area
Poverty Headcount
(Percentage)
Poverty Intensity
(Percentage)
2011 2016 2011 2016
Cape Winelands District 2.5 3.1 42.0 41.3
Western Cape 3.6 2.7 42.6 40.1
The intensity of poverty, i.e. the proportion of poor people that are below the poverty line within
the Cape Winelands District, decreased from 42.0 per cent in 2011 to 41.3 per cent in 2016.
This percentage is still high and should be moving towards zero as income of more households
within the Cape Winelands District moves away from the poverty line.
HOUSEHOLD INCOME
The annual income for households living within the Cape Winelands District shows the
proportion of people that fall within low, middle and high income brackets. Poor households
fall under the low income bracket, which ranges from no income to just over R50 000 annually
(R4 166 per month). An increase in living standards can be evidenced by a rising number of
households entering the middle and high income brackets.

54
Amount (2016) Cape Winelands District
No income 13.1
Low income
R1 – R6 327 1.9
R6 328 – R12 653 3.5
R12 654 – R25 306 13.4
R25 307 – R50 6013 20.1
R50 614 – R101 225 18.4
Middle Income R101 226 – R202 450 12.3
R202 451 – R404 901 8.8
R404 902 – R809 802 5.7
High income R809 803 – R1 619 604 2.0
R1 619 605 – R3 239 208 0.5
R3 239 209 or more 0.4
Approximately 52.0 per cent of households in the Cape Winelands District fall within the low
income bracket, of which 13.1 per cent have no income. Less than fifty per cent of households
fall within the middle to higher income categories, split between 39.5 per cent in middle income
group and 8.6 per cent in the higher income group. A sustained increase in economic growth
within the Cape Winelands District is needed if the 2030 NDP income target of R110 000 per
person, per annum is to be achieved.
INDIGENT HOUSEHOLDS
The Non-Financial Census of Municipalities released by Statistics South Africa in 2016
indicates increases or decreases of indigent households per municipal area between 2014
and 2015.
Area 2014 2015 Change
Cape Winelands District 39 368 38 374 -994
Western Cape 413 259 360 238 -53 021
The Cape Winelands District experienced a decrease in the number of indigent households
between 2014 and 2015, implying reduced burdens on municipal financial resources.

55
SERVICE STANDARD DEFINITION: Households with access to
piped water inside the dwelling or yard or within 200 meters
from yard.
3.8 BASIC SERVICE DELIVERY
Access to basic services within South Africa is a basic human right. It is also an indication of
the quality of life of the inhabitants in the country. The extent of human development within a
municipality is largely influenced by access to housing and associated basic services such as
water, electricity, sanitation and refuse removal, with high access levels implying better human
development and vice versa. The profile uses data from Census 2011 and the Community
Survey of 2016 for the analysis of access to basic services.
Please note: Access level definitions for water and electricity were phrased differently in the
respective Census 2011 and Community Survey 2016 questionnaires.
ACCESS TO WATER
Statistics South Africa estimates the number of households in the Cape Winelands District
increased from 198 265 in 2011 to 236 006 in 2016. The biggest source of water in the Cape
Winelands District region in 2016 was access to piped water inside their dwelling/yard/or within
200 metres. Access to piped water for these categories increased by 18.3 per cent from
196 603 households in 2011 to 232 605 households in 2016 and increased by 18.2 per cent
across the Province over the same period.
Area 2011 2016 % Change
Cape Winelands
District 196 603 232 605 18.3
Western Cape 1 619 763 1 914 055 18.2

56
SERVICE STANDARD DEFINITION: Households with access to
flush toilet connected to sewerage system. SERVICE STANDARD DEFINITION: Households with access
to flush toilet connected to sewerage system.
SERVICE STANDARD DEFINITION: Households with access to
electricity as primary source of energy for lighting purposes.
ACCESS TO ELECTRICITY
The biggest source of energy for lighting purposes in the Cape Winelands District in 2016 was
electricity whilst 7.4 per cent of households make use of other sources of energy i.e.
households that access electricity from a source which they do not pay for, generator, solar
home system, battery and other. Access to electricity for lighting purposes in the Cape
Winelands District improved by 18.8 per cent from 183 976 households in 2011 to
218 483 households in 2016 and increased by 22.3 per cent across the Province over the
same period.
ACCESS TO SANITATION
The biggest source of sanitation in the Cape Winelands District was access to flush toilets
connected to a sewerage system/chemical toilet whilst 2.6 per cent of households make use
of other sources of other sanitation i.e. toilet facilities other than flushed and chemical (pit
latrine, ecological toilets, bucket toilets). Alarmingly, a total of 1 186 households still have no
access to any sanitation services. Access to flush toilets connected to a sewerage system in
the Cape Winelands District improved by 26.0 per cent from 181 418 households in 2011 to
228 650 households in 2016 and by 23.8 per cent across the Province over the same period.
Area 2011 2016 % Change
Cape Winelands
District 181 418 228 650 26.0
Western Cape 1 478 154 1 829 816 23.7
Area 2011 2016 % Change
Cape Winelands
District 183 976 218 483 18.8
Western Cape 1 525 980 1 866 531 22.3

57
SERVICE STANDARD DEFINITION: Households whose waste is
removed by local authority at least weekly.
SERVICE STANDARD DEFINITION: Households with access
to formal dwelling.
ACCESS TO REFUSE REMOVAL
The majority of households in the Cape Winelands District had their refuse removed by local
authorities at least weekly (81.7 per cent) and a further 4.6 per cent of households have refuse
removed by the local authority/private company less often. Refuse removed by local authority
once a week in the Cape Winelands District increased by 21.8 per cent from 158 426
households in 2011 to 192 974 households in 2016 and decreased by 3.4 per cent across the
Province over the same period.
ACCESS TO HOUSING
The majority of households in the Cape Winelands District reside in formal dwellings
(80.0 per cent) whilst 10.0 per cent of the households reside either in informal, traditional and
other dwellings in 2016. Access to formal dwellings increased by 17.2 per cent from
163 078 households in 2011 to 191 077 households in 2016 and by 21.3 per cent across the
Province over the same period.
Area 2011 2016 %
Change
Cape Winelands
District 163 078 191 077 17.2
Western Cape 1 313 637 1 593 891 21.3
Area 2011 2016 % Change
Cape Winelands
District 158 426 192 974 21.8
Western Cape 1 738 554 1 679 520 -3.4

58
3.9 SAFETY AND SECURITY
The Constitution upholds the notion that everybody has the right to freedom and security of
the person. The safety of persons and property is therefore vitally important to the physical
and emotional well-being of people and business. Without the respect of person and property,
it would be impossible for people to live peacefully, without fear of attack and for businesses
to flourish.
The extent of crime in South Africa does however not only have a significant impact on the
livelihood of citizens, but also affects the general economy. Crime hampers growth and
discourages investment and capital accumulation. If not addressed with seriousness, it has
the potential to derail both social and economic prosperity.
People’s general impressions, as well as official statistics on safety and crime issues, mould
perceptions of areas as living spaces or place in which to establish businesses. The discussion
in this section that follows is limited to the reported contact and property-related crime such
as murder and sexual crimes, as well as crime heavily dependent on police action for detecting
drug-related crimes and driving under the influence of alcohol/drugs.
MURDER
Definition: Murder is a social contact crime resulting in the loss of life of the victim, but
excludes cases where the loss of life occurred as a result of a response to a crime, for example
self-defence.
The murder rate per 100 000 people within the Cape Winelands District area declined by 7.0
per cent from 37 in 2015 to 34 in 2016. The murder rate across the Western Cape however
remained at 52 reported cases in 2016. The Cape Winelands murder rate of 34 per 100 000
people remains below the Western Cape average.
Area 2015 2016 % Change
Cape Winelands District
(per 100 000) 37 34 -7.0
Western Cape
(per 100 000) 52 52 0.0

59
SEXUAL OFFENCES
Definition: Sexual offences includes rape (updated to the new definition of rape to provide for
the inclusion of male rape), sex work, pornography, public indecency and human trafficking.
In 2016, there were 122 cases of sexual crimes per 100 000 people recorded in Cape
Winelands District compared with 137 the previous year. This equates to a 10.8 per cent
decrease. The overall rate across the Western Cape also decreased, albeit at only 4.4 per
cent from 120 reported cases in 2015 to 115 in 2016. The Cape Winelands’ sexual offences
rate is therefore slightly above the Western Cape average of 115 per 100 000 people.
DRUG-RELATED CRIMES
Definition: Drug-related crimes refers to the situation where the perpetrator is found to be
in possession of, under the influence of, or selling illegal drugs. This is a crime detected
through police activity rather than reports by members of the public. An increase in crimes of
this nature may therefore reflect an increase in police.
Drug-related crimes has a severe negative impact on human development by degrading the
quality of life as it infiltrates all aspects of society including families, health, the work
environment and the economy. Drug-related crimes within the Cape Winelands District
increased by 3.1 per cent from 1 412 in 2015 to 1 456 in 2016. The Western Cape is no
exception, with drug-related crimes increasing by 4.7 per cent from 1 449 in 2015 to 1 517 in
2016.
Area 2015 2016 % Change
Cape Winelands District
(per 100 000) 137 122 -10.8
Western Cape
(per 100 000) 120 115 -4.4
Area 2015 2016 % Change
Cape Winelands District
(per 100 000) 1 412 1 456 3.1
Western Cape
(per 100 000) 1 449 1 517 4.7

60
DRIVING UNDER THE INFLUENCE
Driving under the influence (DUI): DUI refers to a situation where the driver of a vehicle
is found to be over the legal blood alcohol limit. This is a crime detected through police activity
rather than reports by members of the public.
In 2016, there were 110 cases of driving under the influence of drugs and alcohol (or 7.0 per
cent less) recorded in Cape Winelands District compared with 118 the previous year. Whilst it
declined by 12.4 per cent from 216 in 2015 to 189 in 2016 across the Western Cape. The
Cape Winelands’ driving under the influence of drugs and alcohol rate of 110 per 100 000
people in 2016 is therefore considerably below the Western Cape average.
RESIDENTIAL BURGLARIES
Definition: Residential burglary is defined as the unlawful entry of a residential structure
with the intent to commit a crime, usually a theft.
Given its regular occurrence and the psychological impact on victims, residential burglaries
are an obstinate concern in South Africa. It is therefore relieving to note that the number of
reported cases of residential burglaries per 100 000 people within the Cape Winelands District
dropped by 2.5 per cent from 817 in 2015 to 797 in 2016. Residential burglaries in the Western
Cape decreased by 1.6 per cent from 780 in 2015 to 768 in 2016. The Cape Winelands
District’s overall rate for 2016 remained above that of the Western Cape.
Area 2015 2016 % Change
Cape Winelands District
(per 100 000) 118 110 -7.0
Western Cape
(per 100 000) 216 189 -12.4
Area 2015 2016 % Change
Cape Winelands District
(per 100 000) 817 797 -2.5
Western Cape
(per 100 000) 780 768 -1.6

61
3.10 THE ECONOMY
Economic growth at the district/municipal level is essential for the attainment of economic
development, the reduction of poverty and improved accessibility (forward and backwards
linkages between the first and second economy). Fostering this growth requires an in-depth
understanding of the economic landscape within which each respective municipality operates.
The Cape Winelands District comprised R44.16 billion (or 11.3 per cent) of the Western
Cape’s R391.6 billion GDPR as at the end of 2015. GDP growth averaged 3.5 per cent per
annum over the period 2005 – 2015; this is marginally above the Provincial average of 3.3 per
cent per annum over this period. The region’s average annual growth of 2.8 per cent in the
post-recessionary period remains below the long-term trend but above the provincial average
of 2.5 per cent per annum over the period 2010 - 2015.
The Cape Winelands District employed 375 110 labourers (or 15.3 per cent of the Western
Cape’s labour force) in 2015. Cape Winelands’ employment growth averaged 1.9 per cent per
annum since 2005, which is on par with overall provincial employment growth. Employment
growth has however strengthened in the post–recessionary period (2010 - 2015) averaging
2.9 per cent per annum (which is significantly above the provincial employment growth rate of
1.9 per cent over the period 2010 – 2015). Approximately 66 732 net jobs have been created
in the District since 2005.
More than a quarter (27.9 per cent or 104 687 workers) of the District’s workforce operates
within the informal sector, which has experienced significant growth of 8.4 per cent per annum
since 2005. This sector similarly experienced robust growth of 5.9 per cent per annum in the
post-recessionary period suggesting that the informal sector absorbs job losses from the
formal sector. The semi-skilled sector similarly employs 102 095 workers (or 27.2 per cent of
the District’s workforce) and has grown moderately (with growth averaging 1.2 per cent per
annum since 2005), while the skilled sector employed 50 339 workers and grew by 1.9 per
cent per annum over this period. The low skilled sector employed 117 989 worker thus making
it the District’s largest employer among the four skill categories, and was the only sector to
shed jobs on net (contracting by 0.9 per cent per annum on average since 2005). A detailed
sectoral analysis is provided in the ensuing section.

62
PRIMARY SECTOR
Agriculture, Forestry and Fishing
This sector comprised R4.54 billion (or 10.3 per cent) of the Districts’ GDP in 2015. It
experienced steady growth of 2.0 per cent per annum over the period 2005 - 2015. Growth
has nevertheless slowed in the post-recessionary period as the sector contracted by of 0.2 per
cent per annum over the period 2010 – 2015.
Agriculture, forestry and fishing employed 76 820, or 20.5 per cent, of the Municipality’s
workforce and has contracted by 2.3 per cent per annum on average over the period
2005 - 2015. While employment growth rebounded post-recession and grew at a rate of
3.2 per cent per annum on average since 2010, not all the jobs lost in this industry prior and
during the recession have been recovered and 23 334 jobs have been lost in this industry on
net since 2005.
The labour force in the primary sector is characterised by a disproportionately large proportion
of unskilled labour. The majority (62.9 per cent) of the workforce in agriculture, forestry and
fishing operates within the low-skill sector, which has experienced the sharpest contraction
among all the categories (-3.0 per cent per annum over the period 2005 – 2015). Employment
growth has picked up since 2010, with the fastest growth emanating from the skilled and semi-
skilled sectors. The informal sector makes up 18.2 per cent of the District’s workforce and has
experienced a moderate long term employment growth rate of 1.2 per cent per annum
(between 2005 and 2015).
GDP
2015 Trend 2005 – 2015 Recovery 2010 – 2015
R4.54 billion 2.0% -0.2%
Employment 76 820 -2.3% 3.2%
Skill
Levels
Skilled 2 443 -1.9% 4.1%
Semi-skilled 12 069 -2.5% 3.5%
Low-skilled 48 335 -3.0% 3.1%
Informal 13 973 1.2% 3.3%

63
SECONDARY SECTOR
Manufacturing
The manufacturing industry comprised R6.68 billion (or 15.1 per cent) of the District’s GDP in
2015. The industry has stagnated as GDP growth averaged zero per cent per annum over the
period 2005 – 2015, which was significantly below the 1.9 per cent annual growth attained in
the manufacturing industry for the Province overall. GDP growth within the District’s
manufacturing sector has improved marginally since the recession and averaged 0.4 per cent
per annum over the period 2010 – 2015. The industry’s short and long-term GDP growth
remains below the District average economic growth rates.
The manufacturing industry employed 30 275 workers (or 8.1 per cent of the District’s
workforce) in 2015. Employment in the District’s manufacturing sector has contracted at a rate
of 0.7 per cent per annum over the past decade (as opposed to the overall District employment
growth rate of 1.9 per cent per annum over the period 2005 – 2015). On net,
4 776 jobs have been lost the industry since 2005.
The majority of the workers employed in the manufacturing sector are classified as
semi-skilled (41.1 per cent) and low-skilled (25.0 per cent). Employment within these
categories contracted at an average rate of 0.9 per cent and 2.3 per cent per annum
respectively over the period 2005 - 2015. Only 13.4 per cent of those employed in the
manufacturing sector are categorised as skilled workers. The skilled sector experienced
marginal long-term employment growth of 0.2 per cent per annum on average (between 2005
and 2015). Skilled-employment nevertheless contracted by 0.1 per cent per annum in the
post-recessionary period 2010 - 2015. The informal sector employed 20.5 per cent of the
manufacturing workforce and was the only sector to experience meaningful long-term
employment growth as employment within this category grew by 1.7 per cent per annum over
the period 2005 – 2015.
GDP
2015 Trend 2005 – 2015 Recovery 2010 – 2015
R6.68 billion 0.0% 0.4%
Employment 30 275 -0.7% -0.9%
Skill
Levels
Skilled 4 047 0.2% -0.1%
Semi-skilled 12 434 -0.9% -0.8%
Low-skilled 7 573 -2.3% -2.3%
Informal 6 221 1.7% 0.5%

64
Construction
The construction industry comprised R2.24 billion (or 5.1 per cent) of the District’s GDP in
2015, making it among the smallest sectors in the region. Construction has nevertheless been
the fastest growing industry since 2005, with growth averaging 8.2 per cent per annum. GDP
growth has nevertheless significantly slowed since the recession and averaged 4.2 per cent
over the period 2010 – 2015.
The construction industry employed 26 317 workers (or 7.0 per cent of the District’s workforce)
in 2015. Employment in the District’s construction sector has grown by 5.6 per cent per annum
since 2005. Approximately 9 119 jobs have been created on net since 2005, the majority of
which were created over the period 2010 – 2015 (where employment growth averaged 4.2 per
cent per annum).
The majority (48.2 per cent) of the workers employed in the construction industry operate
within the informal sector. Employment growth within this sector has been consistently high
since 2005. Low-skilled employment makes up 14.3 per cent of the workforce in the
construction industry, and has experienced moderate long-term employment growth
averaging 1.0 per cent per annum (2005 – 2015). Workers employed in the low-skill sector
who have lost their jobs may have found employment in the informal sector. Skilled
employment makes up only 5.6 per cent of the construction industry’s workforce, and has
experienced robust growth averaging 3.9 per cent per annum since 2005, whilst semi-skilled
employment (which made up 31.9 per cent of the construction industry’s workforce) grew at
slightly lower rate of 2.9 per cent per annum over the same period. Skilled and semi-skilled
employment growth nevertheless tapered downward after 2010 as these sectors struggle to
recover post-recession.
GDP
2015 Trend 2005 – 2015 Recovery 2010 – 2015
R2.24 billion 8.2% 4.2%
Employment 26 317 5.6% 4.2%
Skill
Levels
Skilled 1 474 3.9% 1.1%
Semi-skilled 8 384 2.9% 1.0%
Low-skilled 3 764 1.0% -1.4%
Informal 12 695 11.2% 10.3%

65
TERTIARY SECTOR
Commercial Services
Commercial services encompass the wholesale & retail trade, catering & accommodation,
transport, storage & communication and finance, insurance, real estate & business services
sectors. Commercial services comprised R22.28 billion (or 50.4 per cent) of the District’s GDP
in 2015 (the largest sector in the region). The industry grew at rates well above overall District
GDP growth, averaging 5.2 per cent over the period 2005 – 2015 and making commercial
services the 2nd fastest growing industry in the District over the past decade. Whilst growth in
the post-recessionary period tapered downward to 4.3 per cent per annum, the commercial
services industry was the best performing industry since the recession.
This sector employed the majority (41.0 per cent) of the District’s workforce. The commercial
services industry has experienced robust employment growth of 5.1 per cent per annum over
the period 2005 – 2015 (making it the 2nd fastest growing industry in terms of employment).
Employment growth slowed somewhat post-recession but the industry retains a favourable
employment growth rate (averaging 3.5 per cent per annum over the period 2010 – 2015)
which exceeds the overall District employment growth rate of 2.9 per cent over the same
period. On net, 57 978 jobs have been created since 2005.
More than a third (37.3 per cent) of the industry’s workforce operates within the informal sector,
which has been the fastest growing among the four skill categories and created the majority
of the 57 978 jobs mentioned above. Semi-skilled employment (the industry’s 2nd largest
employer) makes up 32.5 per cent of the commercial services industry workforce, whilst skilled
employment makes up 15.0 per cent and low skilled employment 15.2 per cent. The three skill
categories which constitute the formally employed/formal sector of the District’s commercial
services industry grew at similar rates i.e. 2.8 per cent per annum for skilled employment, 2.7
per cent per annum for semi- skilled employment and 2.6 per cent per annum for low-skilled
employment. Employment growth has tapered downward across all four skill categories post-
recession.
GDP
2015 Trend 2005 – 2015 Recovery 2010 – 2015
R22.28 billion 5.2% 4.3%
Employment 153 718 5.1% 3.5%
Skill
Levels
Skilled 23 013 2.8% 2.5%
Semi-skilled 49 959 2.7% 2.3%
Low-skilled 23 393 2.6% 2.1%
Informal 57 353 12.2% 5.9%

66
Government and Community, Social and Personal
Services
The general government & community, social and personal services industry comprised
17.3 per cent (or R7.65 billion) of the District’s overall GDPR in 2015. The industry
experienced GDPR growth of 3.1 per cent over the period 2005 – 2015 (and a marginally
decreased rate of 2.7 per cent per annum since 2010).
The industry employs a noteworthy share (23.2 per cent) of the Municipality’s workforce and
its employment growth over the period 2005 – 2015 (averaging 3.7 per cent per annum)
exceeded the District average employment growth rate over the period under review.
Employment growth has slowed since the recession (averaging 3.0 per cent per annum since
2010). This industry created 27 458 jobs on net since 2005.
The majority (39.9 per cent) of the industry’s workforce are classified as low-skilled, 22.1 per
cent fall within the skilled category and 21.5 per cent are classified as semi-skilled.
Employment growth within the skilled, semi-skilled and low-skilled categories has been
moderate-to-strong, averaging 2.0 per cent, 2.6 per cent and 2.7 per cent per annum
respectively since 2005. Employment growth within these categories slowed somewhat in the
latter half of the decade. Approximately 16.5 per cent of the industries workforce operates
within the informal sector. Informal employment within the general government & community,
social and personal services industry has seen significant growth since 2005 (averaging 17.6
per cent per annum). A significant portion of the new jobs created within the general
government & community, social and personal services industry since 2005 emanated from
within the informal sector.
GDP
2015 Trend 2005 – 2015 Recovery 2010 – 2015
R7.65 billion 3.1% 2.7%
Employment 86 897 3.7% 3.0%
Skill
Levels
Skilled 19 184 2.0% 1.6%
Semi-skilled 18 715 2.6% 2.3%
Low-skilled 34 658 2.7% 2.0%
Informal 14 340 17.6% 9.7%

67
3.11 BROADBAND
As broadband penetration is an official Western Cape Government (WCG) Game Changer,
the Province has a broadband vision that by 2030, every citizen in every town and village will
have access to affordable high speed broadband infrastructure and services, will have the
necessary skills to be able to effectively utilise this infrastructure and is actively using
broadband in their day to day lives.
Striving towards this vision, the WCG aims to by 2020 improve business competiveness and
the livelihoods of citizens through various broadband initiatives. This 2020 objective includes
the goal of increasing internet penetration in the Province to 70 per cent. The WCG has
allocated R1.6 billion towards this Game Changer across the 2016 MTEF.
One such initiative entails the establishment of a Wi-Fi hotspot at a provincial government
building (schools, libraries, clinics, community centres and other public facilities) in each ward
of each local municipality across the Province. These hotspots will allow limited access
(250 Mb per month) to each user, as well as to allow free of charge access to all gov.za
websites.
Wi-Fi hotspots will be installed in all of the 103 wards across the Cape Winelands District by
1 March 2018.
Development of the Nkqubela Community Commercial Node
This development will attract investment in the community by creating infrastructure that foster
a critical mass of community/commercial activity to bring investment to the townships
economy. The project is envisaged to start April 2017.
Free Internet: Free Wi-Fi Hotspot
The goal of the free Wi-Fi hotspot project is to provide free internet (Wi-Fi hotspots) to promote
learning and communication for residents in the municipality. Essentially the provision of
access to the internet will “bridge” the digital divide and identified Stellenbosch as the first town
in South Africa to provide free internet. The project involves the distribution of free Wi-Fi
hotspots throughout the Stellenbosch Municipality. The areas include the town, as well as the
lower income communities situated on the outskirts of the location. No funding structure
currently exists for the free internet: free Wi-Fi hotspot project.
Paarl CBD Upgrade
Paarl is the economic centre of the Drakenstein Municipality and is home to at least four major
international companies namely Pioneer Foods, Nampak, Imperial Logistics and Distell. As a
result, the relocation of businesses to the CBD and upgrade of the central town have been
identified as an important project and economic opportunity. The Municipality entered into a
Public Private Partnership Agreement with a consortium of property owners in the Paarl CBD
in 2010. The first phase of the Agreement included upgrades to parking facilities and
pavements in the area. The second phase of the Paarl CBD regeneration includes upgrades
to Wamakers Square which currently house Pick n Pay and Woolworths as anchor tenants.

68
Structural changes are planned with landscaping and beautification in the surrounding areas.
The CAPEX R-Value is estimated at R100 million.
Paarl Waterfront Development
Identified as a key catalytic project which will boost the tourism sector. The project consists of
mixed use developments (including a hotel, restaurants, office blocks, sport science institute,
etc.) located on the Berg River. This project is in the form of a PPP and the zoning of the land
has been as a luxury mixed use waterfront lifestyle development. This project has been put
on hold. The Land Use Rights are in place and the ROD was transferred back to the
Municipality. The Municipality envisages issuing a tender for development proposals with all
of the rights in place during the next 18 to 24 months. Total capital expenditure for the project
will be approximately between 40 and 60 million rand for the sale of the land. This excludes
any other infrastructural services. The anticipated total capex investment could be between
R500 million and R1 billion.
Drakenstein Waste to Energy Project
Municipality utilises the waste created by the area to generate electricity. The project will also
extend the lifespan of the landfills site. The project has resulted in a number of awards and
recognitions of the municipality, winning the “Greenest Municipality” award in two consecutive
years. The Municipality’s Public Private Partnership (PPP) Waste to Energy (WTE) project has
progressed over a number of years following a rigorous consultative process. This
consultative process included a Feasibility Study which indicated the necessity of the WTE
project. The project also received positive recommendations from National Treasury. The
Feasibility study was approved by the Municipal Council on 16 April 2014 which enabled the
lead department to commence with the statutory authorisation processes by Interwaste (the
Municipality’s private partner). The Municipality is currently busy with the EIA approval
processes. The total capex for this project amounts to approximately R1 billion.
3.12 Infrastructure spending - review and analysis
Introduction
This chapter looks at municipal infrastructure spending in the CWD in terms of the Cape
Winelands Integrated Development Plan (IDP, 2012 - 2017), local municipal IDPs, and
national and provincial policy directives and key performance areas.
Infrastructure investment is a catalyst for economic and social development. Quality
infrastructure that is well managed and maintained, provides major benefits to both
households and enterprises through opening up opportunities for the poor and supporting
growth in economic output (DBSA 2011). Within the Cape Winelands the following
infrastructure projects have been identified as key drivers of development.

69
Water and Sanitation Subsidy to Farmers Programme
This is an innovative programme implemented within the Municipal Health Services Division,
of the CWD Municipality, which has attracted national commendation. The subsidy scheme
serves as an incentive to farmers for improving the water and sanitation services for farm
workers. A maximum of R45 000 per farm is given for this purpose. Education in the form of
health guidance is also provided to the beneficiary communities.
Subsidies are provided for the following:
Running water over kitchen sinks; and
Bathrooms with flush toilets in houses.
The CWD Municipality through this project also intervenes directly in Hot Spot areas through
the provision of dry sanitation systems on farms and the rehabilitation of toilet facilities.
Small Town Regeneration Programme
This programme will be rolled out in Ceres, Wolseley and Tulbagh. The community will identify
projects and will be assisted in getting funding for the projects. Included in the initiative is the
EPWP job creation programme and various skills development programmes which will also
be rolled-out.
Western Cape Government Infrastructure Spending in the Cape Winelands
In addition to the infrastructure expenditure by the CWD Municipality, the Western Cape
Government with its education, environment, health, human settlements and transport and
public works mandates, makes important investments in infrastructure in the CWD. According
to the 2016 – 2019 WCG budget, the largest share of planned infrastructure expenditure will
be on transport and public works projects, followed by human settlement (housing), education,
health infrastructure and environmental projects (Cape Nature) projects (see Figure 4.1). This
provincial infrastructure investment will contribute to developing the economic infrastructure
of the CWD through the investment in roads by the Department of Transport and Public Works,
and in social infrastructure, through the investment by the Departments of Education, Health
and Human Settlements.

70
Figure 4.1 Western Cape Government forecast infrastructure expenditure 2016/17 to 2018/19
Source: Western Cape Government, 2016
The Western Cape Government’s expenditure will supplement the municipalities’ investment
in economic infrastructure such as roads and social infrastructure through investment in
human settlements (housing), and reflects the alignment of provincial infrastructure
investment with the National Development Plan.
0
100 000
200 000
300 000
400 000
500 000
600 000
700 000
800 000
900 000
2016/17 2017/18 2018/19
R'0
00
CapeNature Education Health Human Settlements Transport and Public Works

71
3.13 STATE OF THE DISTRICT
This section is informed by sector studies conducted and updated by the Cape Winelands District Municipality in pursuit of fulfilling its regional planning mandate as instructed by the Constitution, Local Government White Paper, and Local Government: Municipal Structures Act and others.
1.13.1 SERVICE PROVISION AND INFRASTRUCTURE ANALYSIS
A vital aspect of the function of the CWDM is the provision of high-level basic services and the infrastructure that can underpin economic and social development in the region. Below we analyse the situation with regards to water and sanitation, roads and storm water, waste management and electricity.
Water and Sanitation
The Government of South Africa has committed itself to the eradication of the water and sanitation backlog by the year 2014. The responsibility to achieve these targets lies with the Water Service Authorities and in the case of the CWDM; the Water Services Authorities are the B-Municipalities. The responsibility of the CWDM is to ensure that proper planning is done and to co-ordinate and oversee these processes and make sure that capacity exists within the B-Municipalities to ensure effective delivery. A comprehensive Bulk Infrastructure Master Plan for the district as well as for each municipality within the district was completed during the latter part of 2010 with funds provided from the Provincial Government. The main aim of this initiative was to develop a ten-year implementation plan to address the current and anticipated future backlogs and deterioration of bulk infrastructure. It was determined that an estimated R2, 126 billion will be required during the next fifteen years to fulfil this obligation.
Proclaimed Roads
Refer to table below for the surfaced and gravel provincial roads per Local Authority for the CWDM jurisdiction area. Cape Winelands District Municipality does not have ownership of any of the public roads in its area. Proclaimed National Roads are managed by the SANRAL (South African Roads Agency for the National Department), Provincial proclaimed Roads are owned by the Western Cape Provincial Government (Department of Transport and Public Works) and municipal streets by the different Local Authorities. A service delivery (MOA: memorandum of agreement) and financial level agreement exists between the Cape Winelands District Municipality (CWDM) and The Western Cape Provincial Administration, Department of Transport and Public Works where the emphasis is on provincial road maintenance activities performed by CWDM in conjunction with their Provincial Paarl Regional Office. (88% of their road network in CWDM jurisdiction are maintained by CWDM and the remaining 16% by Provincial Paarl Regional Office making use of their own staff and maintenance contracts.)

72
Other functions that are also performed under the MOA could include:
Delegated management duties;
Preparation of technical reports regarding land use application received from local B municipalities together with their Provincial Paarl Regional Office and Head Office;
Various administration duties are adhered to including dealing with the general public (road user) regarding all road matters (e.g. road safety, road maintenance, etc.); and
Assistance with capital infrastructure improvement, example re-gravel and resealing to complement such work performed by provincial contracts. The main objective is to encourage technical skills transfer relating to road maintenance and upgrading activities.
The planning, funding and provision of new provincial road infrastructure or major upgrading and rehabilitation contracts are the function of the Provincial Roads Authority. A Provincial Pavement Management System is used by Province to manage the technical requirements of their road network. Although the main high volume provincial road network in the Western Cape appears to be well maintained, funding shortages and maintenance backlogs are also a concern to the Province on these high mobility routes where it is critical to always maintain a high level of service. Regarding the preventative road maintenances of the Provincial Road network: The existing limited resources (financial and manpower) are therefore used to do daily maintenance activities such as:
Drainage maintenance (clearing the many pipes and box culverts under roads, clearing soil trenches on the sides of roads to prevent storm water from penetrating and weakening road layers);
Sealing the many open cracks that occur on older bitumen surface roads (better known as tarred roads) to prevent penetration of water;
Maintaining guard rails and road signs damaged daily through accidents or vandalism;
Removal of undesirable vegetation and collecting litter; and
Safeguarding the numerous kilometers of worn gravel verges along bitumen surfaced (tarred) roads.
There is a huge re-gravelling backlogs also affecting the majority of the 1133km higher order provincial gravel network (Main and Divisional roads). The funding, plant and human resources only allows annual re-gravelling of approximately 30km in the CWDM area making use of commercial gravel material resources. Of great concern to the CWDM and affecting the social and economic opportunities in the CWDM region are the poor condition and lack of maintenance relating to the 1764km low order provincial low order minor gravel road network.

73
Western Cape Provincial Administration: Surfaced & Gravel Distribution by Authority
DM: Cape Winelands
National Trunk Main Divisional Minor Totals Total Provincial
roads only
Surfaced
Gravel
Surfaced
Gravel
Surfaced
Gravel
Surfaced
Gravel
Surfaced
Gravel
Surfaced
Gravel
Surfaced
Gravel
LM: Stellenbosch
12.49
0.00
0.00
0.00
153.37
0.00
55.45
16.22
22.57
17.36
243.88
33.58
231.39
33.58
12.49 0.00 153.37 71.67 39.93 277.46 264.97
LM: Drakenstein
29.92
0.00
77.91
0.00
156.23
0.00
96.13
115.94
16.39
127.03
376.58
242.97
346.66
242.97
29.92 77.91 156.23 212.07 143.42 619.55 589.63
LM: Witzenberg
0.00
0.00
104.13
0.00
152.93
176.33
138.12
333.66
22.75
957.51
417.93
1467.50
417.93
1467.50
0.00 104.13 329.26 471.78 980.26 1885.43 1885.43
LM: Breede Vallei
124.59
0.00
91.51
0.00
83.18
0.00
139.80
146.19
55.80
210.19
494.88
356.38
370.29
356.38
124.59 91.51 83.18 285.99 265.99 851.26 726.67
LM: Langeberg
2.39
0.00
113.96
0.00
186.24
58.08
81.86
286.59
9.82 451.88
394.27
796.55
391.88
796.55
2.39 113.96 244.32 368.45 461.70 1190.82 1188.43
TOTAL
169.39 0
387.51 0
731.95
234.
41
511.36
898.60
127.33
1763.97
1927.54
2896.98
1758.15 2896.98

74
Municipal Streets There is a concern regarding the current condition of municipal infrastructure in South Africa, specifically related to the maintenance of this infrastructure. The condition of streets can briefly be explained as follows:
Very Good and Good: Roads still in serviceable condition with only routine maintenance to be done which could include minor patching or crack sealing;
Fair: Half of the network is approaching an unacceptable condition; and
Poor and Very Poor: Roads need to be rehabilitated. This figure also indicates the back-log which has developed due to the absence of maintenance on these roads.
The latest assessment (2011) of municipal streets in the district revealed that the average condition of the 1529 km of paved road network can be rated as fair to poor with 15% of the surfacing and 14% of the road structure in a poor to very poor state. The replacement value of the paved streets is estimated at R3.36 billion while the estimated funding backlog is R 525 million. Unpaved or gravel streets are of a slightly lesser magnitude with but in an even worse condition with 24% of these streets in a poor to very poor condition. It is estimated that an amount of R87 million is required to upgrade these streets to paved standards.
Waste Management Council has completed a third generations Integrated Waste Management Plan (IWMP) for the district as a whole. Most of the local municipalities have completed or are in the process of completing their own IWMP and in combining these plans into one strategic document, a holistic view of waste management in the district can be obtained. Through this, management issues of a district nature can be identified, investigated and implemented. The IWMP is a statutory requirement of the National Environmental Management: Waste Act (Act No. 59 of 2008) that has been promulgated and came into effect on 1 July 2009. Plan is borne out of the requirements of the National Waste Management Strategy and forms the first action plan in terms of this strategy. The IWMP will underline the following principles of the National Waste Management Strategy:
The prevention of waste generation;
The recovery of waste of which the generation cannot be prevented; and
The safe disposal of waste that cannot be recovered
The plan will address all areas of waste management – from waste prevention and minimization (waste avoidance), to its collection, treatment, recovery and final disposal. It will not only address the practicalities of waste management, but also the issues of public education and changing concepts, as these are vital to a successful management system. Stellenbosch, Witzenberg and Langeberg municipality’s area are in critical need for landfill airspace. To address this critical shortage, CWDM has embarked on the identification and licensing of one or more regional landfill sites. It is expected that this process will be completed during the first half of 2016.
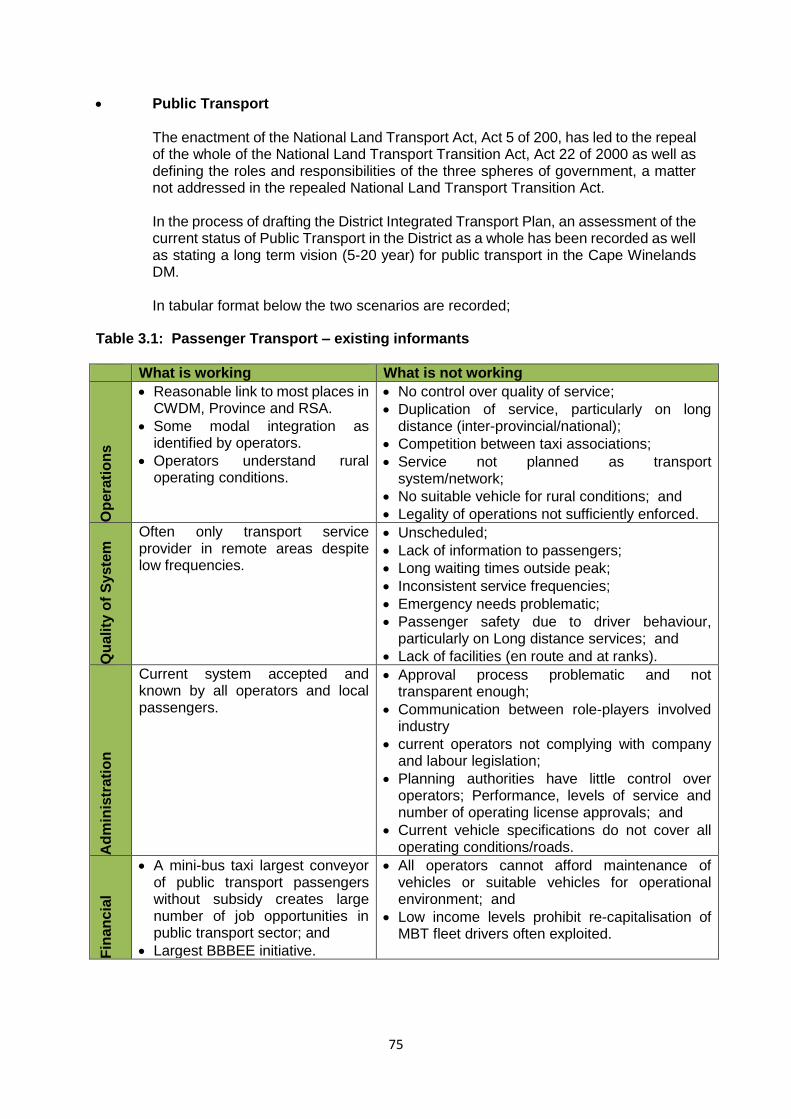
75
Public Transport The enactment of the National Land Transport Act, Act 5 of 200, has led to the repeal of the whole of the National Land Transport Transition Act, Act 22 of 2000 as well as defining the roles and responsibilities of the three spheres of government, a matter not addressed in the repealed National Land Transport Transition Act. In the process of drafting the District Integrated Transport Plan, an assessment of the current status of Public Transport in the District as a whole has been recorded as well as stating a long term vision (5-20 year) for public transport in the Cape Winelands DM. In tabular format below the two scenarios are recorded;
Table 3.1: Passenger Transport – existing informants
What is working What is not working
Op
era
tio
ns
Reasonable link to most places in CWDM, Province and RSA.
Some modal integration as identified by operators.
Operators understand rural operating conditions.
No control over quality of service;
Duplication of service, particularly on long distance (inter-provincial/national);
Competition between taxi associations;
Service not planned as transport system/network;
No suitable vehicle for rural conditions; and
Legality of operations not sufficiently enforced.
Qu
ality
of
Sy
ste
m Often only transport service
provider in remote areas despite low frequencies.
Unscheduled;
Lack of information to passengers;
Long waiting times outside peak;
Inconsistent service frequencies;
Emergency needs problematic;
Passenger safety due to driver behaviour, particularly on Long distance services; and
Lack of facilities (en route and at ranks).
Ad
min
istr
ati
on
Current system accepted and known by all operators and local passengers.
Approval process problematic and not transparent enough;
Communication between role-players involved industry
current operators not complying with company and labour legislation;
Planning authorities have little control over operators; Performance, levels of service and number of operating license approvals; and
Current vehicle specifications do not cover all operating conditions/roads.
Fin
an
cia
l
A mini-bus taxi largest conveyor of public transport passengers without subsidy creates large number of job opportunities in public transport sector; and
Largest BBBEE initiative.
All operators cannot afford maintenance of vehicles or suitable vehicles for operational environment; and
Low income levels prohibit re-capitalisation of MBT fleet drivers often exploited.

76
Table 3.2: Passenger Transport – long term vision
Long term vision
Op
era
tio
ns
Scheduled services for main destinations (large towns and metros);
Frequent shorter intra-town, commuter services;
Co-ordination of services and modes;
Long distance services provided by road, rail and air modes;
Information on services readily available;
Good road infrastructure on major routes/network;
Appropriate vehicles for rural areas; and
Public transport is affordable for the majority of CWDM citizens.
Qu
ality
of
Syste
ms
Reliability, waiting time minimised and waiting experience improved;
Comfortable service –no overcrowding and luggage/goods accommodated;
Maximum coverage of all areas with access to remote rural areas included;
Facilities provided on route for boarding and alighting commuters;
Interchanges and facilities cater for people not just vehicles (ablution facilities, amenities, markets, other modes); and
Safety of passengers prioritised and enforced.
Adm
inis
tration
Monitoring of services undertaken;
Passenger demand and vehicle usage tracked for purposes of planning new services;
Ensure monitoring of minimum levels of service;
Procurement systems and processes transparent and accessible to all;
Clear, transparent and effective administering of transport system;
Enforcement of service standards;
Responsible financial practices with audited statements; and
Compliance to all relevant and applicable legislation.
Fin
ancia
l
Multi-functional services in low demand areas for maximum efficiency;
Cost effectiveness ratios monitored continuously (cost per passenger, cost per kilometre, etc);
Labour practices within the transport industry is complaint with labour legislation;
Profitable for all operators; and
Transport operators are compliant with tax and other statutory requirements.
Rail Rail accounts for less than 10% of both work and educational trips as shown in tables E1 and E3. A high level of dependency on private car usage for all trips still exists in the CWDM. Table 3.3 – main mode to work
DM LM Percentage of trips
Number of Trips Train Bus MBT Car Walk Other
CW
DM
Witzenberg - 0.7 4.7 13.6 65.8 15.1 37 362
Drakenstein 9.6 - 18.3 29.8 30.6 11.6 72 149
Stellenbosch 9.7 - 13 33.2 36.4 7.7 42 801
Breede Valley
- - 4.1 35.5 48.4 12 58 237
Langeberg - - 7.5 18.3 58.9 15.3 27 863

77
Table 3.4 – main mode to education
DM LM Percentage of trips
Number of trips
Number of PT trips
Train Bus MBT Car Walk Other
CW
DM
Witzenberg - - 3.3 16.3 59.2 21.1 28 000 1 000
Drakenstein 6.8 - 15.4 14.5 51 13.3 57 000 12 600
Stellenbosch 5.8 - 4.6 21.9 46.8 20.9 37 000 3 900
Breede Valley
- - 6.5 15.3 53.2 26.1 44 000 2 800
Langeberg - - 0.7 8.4 71.8 19 25 000 200
* Excludes WCED subsidized learner transport
Freight
The migration of freight from rail-based to road-based is of great concern at National as well as Provincial levels of governance. The damage to road pavements increases exponentially with increased loading. The reduction of over-loading of freight vehicles is therefore of utmost importance. The increase in weighbridge operations is a welcome indication of the seriousness with which the Provincial Department of Transport is addressing the freight related impacts on the road infrastructure. In order to safeguard the Province’s road network, the Provincial Government will advocate interventions which promote a shift in freight haulage from road to rail modes. A measurable target of a 10% shift has been identified.
Figure 3.5 below represents the number of vehicles weighed at all weighbridges in the Western Cape.

78
Figure3.6 below represents overload patterns at the Rawsonville weighbridge

79
3.13 THUSONG CENTRES IN CAPE WINELANDS DISTRICT
The Department of Local Government (DLG) has developed a functionality score card for the Thusong Service Centres which is a concise management reporting system describing the operational functionality of Thusong Service Centres and effectively drives the communication of agreed upon goals and actions and the distribution of accountabilities between role-players.
3.13.1 BREEDE VALLEY MUNICIPALITY
The Breede Valley Municipality appointed new management at the Worcester Thusong Service Centre and the functionality of the centre has improved tremendously since the new Thusong Service Centre Manager was appointed. The centre was successfully re-launched on 27 March 2015. Figure 1 depicts the overall functionality of the Municipality. The Breede Valley: Worcester Thusong Service Centre is categorised as a well-functioning Thusong Service Centre with an overall score of 80 per cent. The following Government Departments and Non-Governmental Organisations render permanent services at the Thusong Centre: Department of Agriculture, Department of Social Development, Department of the Premier (Cape Access), Department of Local Government (Community Development Workers) Government Communication and Information System (GCIS), Valley Funerals, Sinethemba HIV/AIDS Group, Umzi Communications, Ikhwezi Community Newsletter, Zwelethemba Arts and Culture Forum. Graph 1: Breede Valley: Worcester Functionality Score Card
3.13.2 LANGEBERG MUNICIPALITY
Figure 2 depicts the overall functionality of the Municipality. Langeberg: Robertson Thusong Service Centre is categorised as a well-functioning Thusong Service Centre with an overall score of 90 per cent. The following Government Departments and NGOs render permanent services at the Thusong Centre: South African Social Security Services (SASSA), Department of Social Development, Western Cape Education Department, Department of Home Affairs, Department of Agriculture, Department of the Premier (Cape Access), Langeberg Municipality, Independent Electoral Commission (IEC) and Child Welfare.
TSC
Managed
by LM
Appointed
TSC
Manager
LM
rendering
services at
TSC
Anchor
Department
s
Lease
Agreements
Expanded
Service
Offering
Incl. in IDP &
SDBIPReports
Invol. in
Thusong
Mobile
Overall
Performanc
e Score
Worcester:
Unobuntu100 100 100 75 50 100 100 100 100 80
0
20
40
60
80
100
Sc
ore
%

80
Graph 2: Langeberg: Robertson Functionality Score Card
As per Figure 2, the Langeberg: Robertson Thusong Service Centre is categorised as a well-functioning Thusong Service Centre with an overall score of 90 per cent.
3.13.3 WITZENBERG MUNICIPALITY
Graph 3: Witzenberg: Ceres- Bellavista Functionality Score Card
As per the Figure 3, the Witzenberg: Ceres - Bellavista Thusong Service Centre is categorised as a progressing Thusong Service Centre with an overall score of 80 per cent.

81
3.13.4 DRAKENSTEIN MUNICIPALITY
Graph 4: Paarl-East Functionality Score Card
As per the Figure 4, the Paarl-East Thusong Service Centre is categorised as a well-functioning Thusong Service Centre with an overall score of 75 per cent.
Figure 5: Mbekweni Functionality Score Card
As per Figure 5, the Mbekweni Thusong Service Centre is categorised as a well-functioning Thusong Service Centre with an overall score of 75 per cent.
3.13.5 STELLENBOSCH MUNICIPALITY
The Thusong Programme provides integrated service and information from government, to communities close to where they live as part of a comprehensive strategy to better their lives. The Thusong Outreach Project is being implemented within the Municipality to ensure citizens have access to one of the Thusong Programme Projects.
TSC
Managed by
LM
Appointed
TSC Manager
LM rendering
services at
TSC
Anchor
Departments
Lease
Agreements
Expanded
Service
Offering
Incl. in IDP &
SDBIPReports
Invol. in
Thusong
Mobile
Overall
Performance
Score
Paarl - East 100 0 100 50 100 100 100 0 100 75
0
20
40
60
80
100
Sc
ore
%
TSC
Managed by
LM
Appointed
TSC Manager
LM rendering
services at
TSC
Anchor
Departments
Lease
Agreements
Expanded
Service
Offering
Incl. in IDP &
SDBIPReports
Invol. in
Thusong
Mobile
Overall
Performance
Score
Paarl:
Mbekweni100 0 100 75 100 67 100 0 100 75
0
20
40
60
80
100
Sc
ore
%

82
3.14 STATUS REPORT ON SECTOR PLANS
A summary of the status of sector plans is as follows:
Section Statutory Plans Status
Spatial Planning
District Spatial Development Framework
Approved by Council, March 2011
Non-Statutory Plans Status
Cape Winelands Biosphere Spatial Development Framework Plan
Approved by Council, March 2011
Guidelines for Assessing Land Use Management Applications in Rural Areas
Approved by Council, June 2007
Climate Change Strategy Draft document
Environmental Planning
Statutory Plans Status
Draft Environmental Management Framework for a portion of the CWDM
Draft
Non-Statutory Plans Status
Cape Winelands Strategic Environmental Assessment
Approved by Council of CWDM, June 2007
Regional Economic Development
Statutory Plans Status
Regional Local Economic Development Strategy
Approved by Council of CWDM, October 2012
Non-Statutory Plans Status
District Growth and Development Strategy (Review)
Approved by Council, May 2010
Emergency Services
Statutory Plans Status
Disaster Management Plan Approved by Council, 2009
Municipal Health Services
Air Quality Management Plan (AQMP)
AQMP completed & approved by Council – 26.08.2010
Non-Statutory Plans Status
Water & Sanitation Backlog Study (WSBS)
WSBS completed & approved by Council – 24.05.2010
Statutory Plans Status

83
Section Statutory Plans Status
Infrastructure Planning and Project Implementation
Integrated Waste Management Plan
Completed June 2015 (Pending approval)
Integrated Bulk Infrastructure Plan (Water and Sewerage)
Approved June 2010
Human Settlement Development
Integrated Human Settlement Plan
Approved by Council 2012
Public Transport and Regulations
Statutory Plans Status
District Integrated Transport Plan (2011 – 2016)
Approved – 17 February 2011. Currently drafting the District Integrated Transport Plan 2016 - 2020
Non-Statutory Plans Status
Safer Journeys to Rural Schools;
Integrated Public Transport Network Framework;
Freight Strategy for the CWDM;
Non-Motorised – Transport Master plan for the CWDM
Strategy in review to include urban schools;
Completed- Pending approval;
Completed – pending approval;
Work in progress
Risk Management Enterprise Risk Management Operational Plan
Approved
PMS PMS Framework In process of being reviewed, anticipated completion date before 30 June 2017
IDP
IDP Framework Approved October 2016
Process Plan Approved July 2016
IDP In process to be approved by April 2017
Budget
Financial Plan In process to be approved by April 2017
Budget n process to be approved by April 2017
HR Employment Equity Plan 01 October annually
Workplace Skills Plan 30 April annually
ICT
None N/A
Non-Statutory Plans Status
ICT Disaster Recovery Plan Approved by Council , March 2015
ICT Governance Framework Approved by Council , March 2015

84
Section Statutory Plans Status
ICT Strategy Approved by Council.
Communications
Statutory Plans Status
Communications Strategy and action plan
Communications strategy revised every five (5) years, action plan 30 June annually.

85
CHAPTER 4 DEVELOPING OUR STRATEGY
4.1 SUPPLY CHAIN MANAGEMENT AS A STRATEGIC ENABLER FOR ECONOMIC
OPPORTUNITIES
The Western Cape Provincial Treasury has actively driven the process and discussion with
municipalities on how Supply Chain Management can be utilised as a strategic enabler for
economic development. This theme was carried through at the Supply Chain Management
Indaba held on 3 and 4 November 2016 in Langebaan, West Coast District. It was discussed
and resolved at the SCM Indaba that a statement of intent regarding using SCM as a strategic
enabler for economic development should be contain in the Integrated Development Plan of
municipalities. To this end, Western Cape Provincial Treasury has worked with two pilot
Districts and their Local Municipalities.
THE CAPE WINELANDS DISTRICT MUNICPALITY WILL WHENEVER THE
PROCUREMENT OF GOODS AND SERVICES ARISES APPLY THE CONSTITUTIONAL
IMPARATIVES GOVERNING SCM IN TERMS OF SECTION 217 OF THE CONSTITUTION
IN RELATION AND ALIGNMENT TO SECTION 152 AND 153 OF THE CONSTITUTION AS
WELL AS THE NATIONAL DEVELOPMENT PLAN AND ITS 2030 VISION;
ENABLING THE MUNICIPALITY TO GIVE EFFECT TO SECTIONS 152 AND 153 OF THE
CONSTITUTION AND IN DOING SO:
• The Cape Winelands District Municipality will explore all possible avenues of
procurement strategies before any commitment for any procurement process will be
authorized.
• The municipality will ensure that all envisaged expenditure after the budget has been
approved will be populated in the various department’s procurement plans.
• The LED and SCM agree on the proposed procurement strategy after an in-depth
analysis of the market forces was performed.
• No procurement process will be allowed outside of the authorized signed off
procurement plans of the municipality, as this will ensure that all procurement
expenditure are aligned to a procurement strategy.
• The LED and SCM will report quarterly to council on the LED outcome and all
expenditure incurred via its procurement strategies and whether it was compliant in
terms of the alignment of the procurement plans with the procurement strategies.

86
• The above must be consolidated in the performance contracts of Section 56/57
appointments
• The reporting in terms of the above will be in terms of the top layer performance
indicators of all senior managers.
RESEARCH-LED SOCIAL DIALOGUE, POLICY AND STRATEGY DEVELOPMENT FOR
THE LONG-TERM SETTLEMENT OF FARM WORKERS ON AND OFF FARMS
The Cape Winelands District Municipality (CWDM) has been awarded a research, social
dialogue and strategy development grant by the Tirelo Bosha Public Service Improvement
Facility administered by the Department of Public Services and Administration (DPSA). These
awards are made for proposals which aim to improve service delivery in the District.
The process has been designed to enable CWDM and its state and social partners to better
understand complex and interrelated issues associated with the provision of farmworker
housing on and off farms, access to services and tenure security.
What were the objectives of this initiative?
The principal objective of this initiative is the development of practical strategies resulting in
improved integration of farm worker housing, service and tenure security needs in municipal
housing and social development planning. Other objectives included:
• Improved integration of farm worker housing, service and tenure security needs in
municipal housing strategies.
• Development of a supportive policy environment; innovative partnerships and institutional
arrangements to enable farm worker housing, service and tenure security needs to be
progressively met in the Cape Winelands.
• Research and social dialogue leading to deeper understanding of the housing, services
and tenure issues in and across localities
• Measures agreed to practically address the need for improved farm worker housing,
access to services and tenure security on and off-farm
• Proposals for policy review
The overall objective of the initiative is the improved integration of farm worker housing,
service and tenure security needs in municipal housing strategies.

87
Key Partners
• Cape Winelands District Municipality (CWDM)
• Local Municipalities:
– Witzenberg LM
– Drakenstein LM
– Breede Valley LM
– Stellenbosch LM
– Langeberg LM
• Department of Human Settlements
• Department of Agriculture (Farmworker Development)
• South African Police Service (Rural Safety – Worcester)
• PLAAS University of Western Cape
• CRUISE Stellenbosch University
• Phuhlisani – Land and Rural Development Specialist
The initiative has played an important role in raising the profile of farm worker housing, tenure
and access to services as issues on the provincial, district and local municipality development
agendas. The draft strategy has been anchored within current policy and legislative mandates
and draws on situated research and social dialogue to practically propose approaches to
address needs for farm worker housing, access to services and tenure security on and off-
farm within the Cape Winelands District.
It should be noted that in order to practically address many of the issues identified through
the research significant institutional and policy obstacles will have to be overcome and these
lie within policy domains beyond the municipal sphere.
All research and the strategy is made available on the project website
www.winelandsfarmworkers.net
88
4.2 ALIGNMENT AND ACCOUNTABILITY OF THE SPHERES OF GOVERNMENT
Government has the responsibility to make policies and laws about the rights and
responsibilities of citizens and the delivery of government services. Government collects
revenue (income) from taxes and uses this money to provide services and infrastructure that
improves the lives of all the people in the country, particularly the poor. The Constitution of
South Africa sets the rules for how government works.
There are three spheres of government in South Africa:
• National government
• Provincial government
• Local government
The spheres of government are autonomous and should not be seen as hierarchical. The
Constitution says: The spheres of government are distinctive, inter-related and inter-
dependent. At the same time they all operate according to the Constitution and laws and
policies made by national Parliament.
The government machinery is made up of three parts:
• The elected members (legislatures) – who represent the public, approve policies and laws
and monitor the work of the executive and departments.
• The Cabinet or Executive committee (executive) – who co-ordinate the making of policies
and laws and oversee implementation by the government departments
• The departments and public servants – who are responsible for doing the work of
government and account to the Executive
Alignment should occur around specific issues with the spheres of government engaging one
another around these issues. The relationships between the different spheres of government
are complex; all spheres have different perspectives which need to be harmonised.

89
A cabinet resolution resulted in two essential decisions:
Re-organising the state into Districts, the aim is for local and provincial government to come
together at the District Coordinating Forum (DCF), a joint planning forum of Executive Mayors
within the district space, established in terms of the Intergovernmental Relations Framework
Act. A common problem is that a lower level administrator is sent to the DCF to sign registers,
and not to engage. This does not facilitate alignment, nor does it improve the relationship
between the spheres of government. The DCF should control and contribute to the District
IDP. This would result in all stakeholders (national, provincial and local) having control of the
IDP and other plans.
Government is not prevalent enough on the ground. Therefore, it is essential that each cabinet
official must spend a certain number of days in the field.
Alignment and accountability will be achieved through all three spheres agreeing on
challenges to be addressed. Currently the more ‘powerful’ spheres go over the head of the
“lower” spheres of government, for example, Provincial government allocates money based
on their own set of priorities. In addition, different interest group has different understandings,
wants and needs (for example agriculture vs. housing or social development). However, there
are certain (National) targets that are non-negotiable. These targets need to be costed and a
clear understanding of how it can be achieved established. The challenge is on how to
prioritise, and to assess what can be achieved.
4.3 NATIONAL DEVELOPMENT PLAN – VISION FOR 2030
The plan, adopted by Cabinet on 11 November 2011, helps us to chart a new path for our
country. It focuses on putting in place the things that people need to grasp opportunities such
as education and public transport and to broaden the opportunities through economic growth,
the availability of jobs and change the life chances of our youth that remains underdeveloped
by our apartheid history. Everything in the plan is aimed at reducing poverty and inequality.
Overview
In eliminating poverty and reducing inequality, there must be a new approach, an approach
that moves from passive citizenry receiving services from the state to one that systematically
includes the socially and economically excluded, where people are active champions of their
own development, and where government works effectively to develop people’s capabilities
to lead the lives they desire.

90
This approach includes;
Active efforts and participation of all South Africans in their own development
Redressing the injustice of the past effectively;
Faster economic growth and higher investment and employment;
Rising standards of education with a healthy population and effective social
protection;
Strengthen the links of economic and social strategies;
Effective and capable government; and
Leadership from all sectors in society.
The inspired authors are of the opinion that the country must write a different story in the years
ahead. The story they propose to write involves;
Creating jobs and livelihoods;
Expanding infrastructure;
Transitioning to a low-carbon economy;
Transforming urban and rural spaces;
Improving education and training;
Providing quality health care;
Building a capable state;
Fighting corruption and enhancing accountability; and
Transforming society and uniting the nation.
The NSDP’s objective is to focus government and the private sector on investments that will
have the maximum economic and social impact, and address spatial integration. Guiding
principles are:
Coordinated investment in sectors such as transport, environment, and land use;
Increased productive investment in areas of high growth potential;
Investment in people and social services in areas of low growth potential; and
Reduced inequalities between people.
These principles need to inform investment decisions in the Cape Winelands through its
Spatial Development Framework (SDF) and key actions resulting from the recommendations
stemming from the SDF. This is critical in ensuring alignment of the IDP with national priorities.

91
The National Development Plan refers to the NSDP as to have had a focus on the tough
choices facing costly public investments, but to have taken a narrow view of the development
potential of different places. The Plan proposes the development of a National Spatial
Framework for South Africa and suggests the institutions and processes necessary for the
work to start. The development of the NSF for South Africa needs to involve government,
business and civil society sectors to create a shared perspective.

92
CHAPTER 5: PRIORITIES AND KEY INTERVENTIONS
5.1 INTRODUCTION
A more detailed exhibition of what interventions will contribute significantly to the attainment
of our undertaking that “all structures of the Cape Winelands will contribute together towards
effective, efficient and economically sustainable development” are provided in this chapter.
The discussion will emanate from the strategic support that the Office of the Municipal
Manager provides on the three strategic objectives of Cape Winelands District Municipality.
OFFICE OF THE MUNICIPAL MANAGER
The office of the Municipal Manager provides strategic support to achieve organisational objectives. The support is provided through:
1. Integrated Development Planning
The Cape Winelands District Municipality has a legal obligation to prepare an Integrated
Development Plan every five years. This plan, together with all sector plans, is reviewed on
an annual basis and the multi-year budget is likewise amended in accordance with the
Municipal Systems Act.
Chapter 5 and Section 25 (1) of the Municipal Systems Act (2000) indicate that:
“Each municipal council must, within a prescribed period after the start of its elected term,
adopt a single, all inclusive and strategic plan for the development of the municipality which-
Links integrates and coordinates plans and takes into account proposals for the
development of the municipality;
Aligns the resources and capacity of the municipality with the implementation of the
plan;
Complies with the provisions of this Chapter; and
Is compatible with national and provincial development plans and planning
requirements binding on the municipality in terms of legislation.”
On 3 August 2016 a new Council was elected during the Local Government Elections. The
newly elected Council embarked on a vigorous and very inclusive process of shaping the
vision and strategic direction of the Cape Winelands District Municipality for the duration of

93
their five-year tenure. The document as presented here, embodies the hopes, aspirations and
unwavering trust in the future of the Cape Winelands region by communities, public
representatives (Council) and the Administration. It is a shared commitment to work tirelessly
to ensure a better Cape Winelands for all.
During the course of the IDP a number of planned interventions have been formulated to
address the challenges and opportunities existing in the region in pursuing accelerated
sustainable development. This IDP integrates national, provincial strategies as well as the
CW-GDS, Cape Winelands Spatial Development Framework, the Environmental and Regional
Spatial Planning
2. Performance Management
Performance management for local government influences the creating of a performance
culture in the public service at municipal level. Performance management, as a key transversal
corporate process is employed to ensure that municipalities are delivering on their mandates.
Each municipality is legally required to develop a performance management system (PMS)
that will enhance organisational efficiency and effectiveness, account for the use of municipal
resources and indicate the achievement of outcomes. A Performance Management System is
also employed to serve as an early warning mechanism as it reflects non-performance or
underperformance, thus allowing for relevant intervention for improvement.
3. Risks Management
Section 62 of the Local Government: Municipal Finance Management Act 2003 (Act No. 56 of
2003), states that the Accounting Officer should take all reasonable steps to ensure that the
municipality has and maintains effective, efficient and transparent systems of financial, risk
management and internal control as well as the effective, efficient and economical use of the
resources of the municipality.
The Risk Management Strategy and Framework aims to ensure that risks that could impede
the achievement of objectives, are managed better and mitigated earlier, thereby improving
the District Municipality’s ability to carry out its mission and achieve its goals.

94
The Fraud and Risk Management Committee (FARMCO) is guided by a charter which is in
compliance with the Local Government: Municipal Finance Management Act, 2003 (Act No.
56 of 2003). The CWDM’s FARMCO consists of the Executive Directors, the Municipal
Manager, and the Manager: IDP, Performance and Risk Management and also the Manager:
Performance and Risk Management. In the period under review, the FARMCO performed its
mandated duties, which included the following:
Receiving feedback on progress with the risk registers at a strategic and operational
level;
Giving feedback on establishing a common understanding of Risk Management;
Monitoring progress with the updating of risk registers;
Review and monitor ERM processes and outputs regularly;
Review the Risk Management Policy;
Review the Risk Management Strategy and Framework;
Review the Risk Management Implementation Plan;
Guide the development and implementation of ERM; and
Brings serious risks to the senior manager’s attention, which contributes to a more
informed decision-making process.
During this current financial year, the unit was responsible for risk management training,
enhancing performance measurements, and monitoring compliance with the ERM policy and
framework. IRM further continues to endeavour to assist in enhancing service delivery through
the optimal utilisation of scarce resources.
4. Internal Audit
Internal auditing is an independent, objective assurance and consulting activity designed to
add value and improve the organisations operations. It helps an organisation accomplish its
objectives by bringing a systematic, disciplined approach to evaluate and improve the
effectiveness of risk management, controls and governance processes. The purpose of the
Internal Audit activity of the Municipality is to act as an independent appraisal function to assist
management in maintaining the required standard of internal control within the Council.
Our emphasis is to assist the operating units to prevent any control problems from becoming
significant in nature. The operating units are normally functioning in the eye of the public and
the community we serve and therefore all functions must be carried out in an economic,
efficient, effective and in the most ethical manner possible. The natural environment, in which

95
any business unit operates, should always be considered when conducting an audit, ensuring
that the environment in which it operates is not adversely affected.
In order to enhance the system of internal control the internal auditor and management must
work together to discover risk areas and suggest ways of reducing and eliminating risks. The
identification of risks will contribute to the effectiveness of the internal auditor’s function and
in audit planning. The internal auditor will be considered to have added value if the following
has been recommended:
Preventative controls, so as to avoid irregularities;
Detective controls, so as to detect any irregularities timely;
Corrective action, so as to rectify the problem in the most effective, efficient and
economical manner – minimising future losses;
Risks are appropriately identified and managed;
Interaction with the various governance groups within the organisation occurs as
appropriate;
Significant financial, managerial, and operating information is accurate, reliable, and
timely;
Employees actions are in compliance with policies, standard, procedures and
applicable laws and regulations;
Resources are acquired economically, used efficiently, and adequately protected;
Programmes, plans and objectives are achieved;
Quality and continuous improvement are fostered in the organisation’s control
processes; and
Significant legislative or regulatory issues impacting the organisation are recognised
and addressed appropriately.
The internal auditor should make practical recommendations in respect of reducing risk and
assist management to find solutions. In obtaining these objectives management can place
reliance on controls in order that the accountability placed on management can be protected
to a satisfactory level.
5. Communication
Creates effective communication mediums to inform or create awareness to all stakeholders.
The dawn of the new developmental government as elucidated in the White Paper on Local
Government presented all South Africans with an opportunity to participate in local
government initiatives. This new call for meaningful participation and inclusivity of
communities demands vigorous communication efforts from all local government structures.

96
The envisaged communication is meant to allow communities to register their needs and on
the other hand communication efforts allow the municipality to report back on a continuous
basis about the progress on changes in the adopted plans. The Local Government: Municipal
Systems Act, 2000 (Act No 32 of 2000) compels municipalities to facilitate community
participation and consultation in all the affairs of the council, hence the importance for on-
going and effective communication activities.
The CWDM Communication Strategy will be reviewed during the 2017/2018 financial year.
The following gaps prevent the achievement of the effectiveness and efficiency of the
Communication Strategy:
External environment
The following factors pose as obstacles to effective community participation in the
activities of the municipality:
Lack of knowledge on the role and function of the district municipality;
Poor communication between community and council;
Insufficient media coverage on activities of the council;
Lack of meaningful positive public participation due to the community not being
educated on the processes; and
Regulations of the three spheres of government.
Internal environment
One of the stakeholders that should not be overlooked is the relationship with its
internal stakeholder’s e.g. committees, departments and sections. Shortcomings in
this regard are as follows:
Lack of clearly defined processes of communication between council and its
committees and departments;
Decisions taken at management level’s accuracy when filtered down the
hierarchy;
Lack of understanding council’s functions and roles by administrative staff and
councillors; and
Utilizing the tools and communication resources to the optimum level.

97
Communication Challenges
The following have been identified as some of the major communication challenges
that face the municipality:
Public participation in municipal programmes and projects, given the
importance of meaningful public participation and the community’s rights and
responsibilities to participate in the activities of the municipality as alluded to in
this document, ensuring proper public participation mechanisms should be
designed;
Improving media coverage of the municipality, developing and implementing a
media relations plan to ensure favourable media coverage;
Keeping the community informed, ensuring that the flow of information and the
channels are appropriate to fit all the needs of the diverse community;
Municipal website, regular update of website and ensuring that it serves a
source of information for the Council and its public.
All communication objectives are aimed at achieving the following: public
participation:
To keep the community informed about the resolutions of council,
Encourage public participation in council activities and to build and maintain
healthy relationships between the council and its stakeholders; and
Community development – to educate the community about the roles and
functions of the spheres of government; image / branding – to maintain a
favourable image of the council.
Optimal usage of new media platforms such as social media to reach the
stakeholders in a cost effective and user friendly manner.

98
5.2 STRATEGIC OBJECTIVE 1
This section of the IDP provides a more detailed exhibition of what interventions will
contribute significantly to the attainment of our undertaking that all structures of the
Cape Winelands will co-operate together towards effective, efficient and economically
sustainable development.
COMMUNITY DEVELOPMENT AND PLANNING SERVICES DEPARTMENT
The CDPS department’s broad economic development priorities is linked to its High
Opportunity Society Strategy.
DEPARTMENTAL STRATEGIC AND PRE-DETERMINED OBJECTIVES
HOW WILL WE CREATE A HIGH OPPORTUNITY SOCIETY?
The departmental programmes are geared towards creating a high opportunity society in the
Cape Winelands District by:
(a) Ensuring the optimal functioning of our legislative functions (fire-fighting, municipal
health; disaster management and spatial planning);
PDO 1: Comprehensive
and equitable
Municipal
Health Service
PDO 2: Coordination
of multi-
disciplinary
and sectoral
disaster risk
reduction
PDO 3: Effective
planning and
coordination
of fire
prevention,
safety and
fire-fighting
services
PDO 4: Facilitate
environmentally
sustainable
economic
development
planning
PDO 5: Facilitate and
ensure the
development
and
empowerment
of the poor
SO 1: To ensure the health and safety of communities and to facilitate
the social and economic empowerment of the poor in the Cape
Winelands District through economic, environmental and social
infrastructure investment
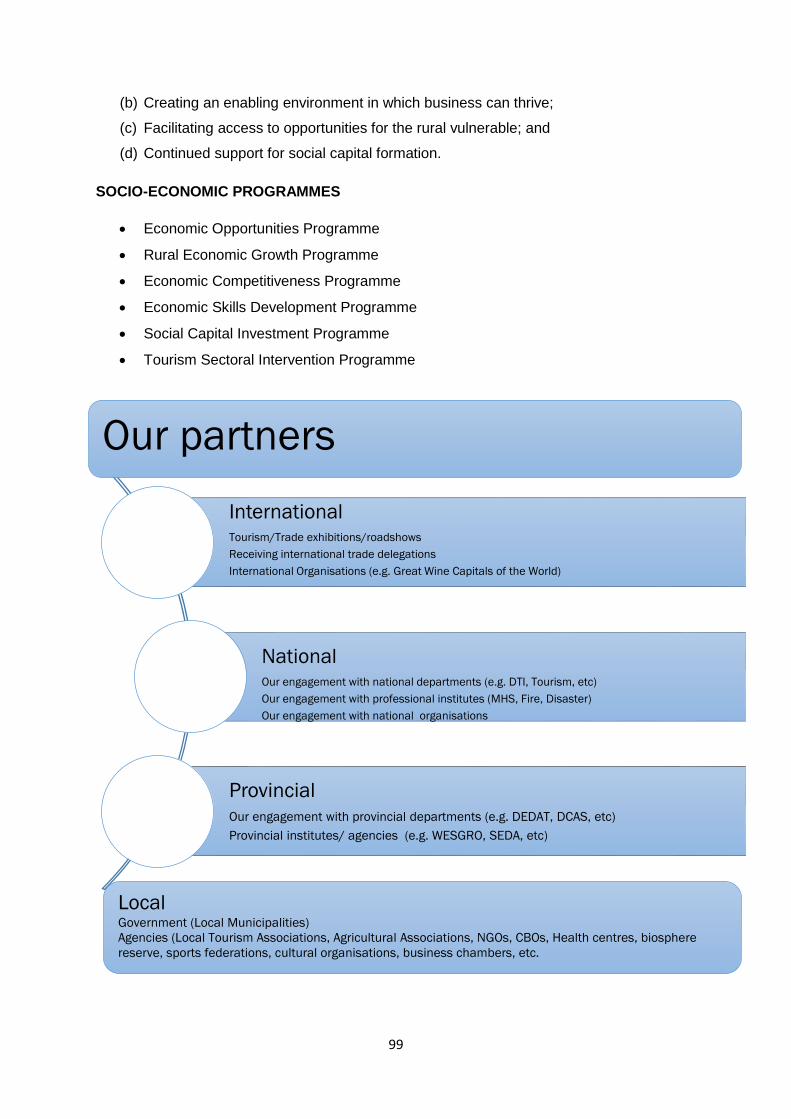
99
(b) Creating an enabling environment in which business can thrive;
(c) Facilitating access to opportunities for the rural vulnerable; and
(d) Continued support for social capital formation.
SOCIO-ECONOMIC PROGRAMMES
Economic Opportunities Programme
Rural Economic Growth Programme
Economic Competitiveness Programme
Economic Skills Development Programme
Social Capital Investment Programme
Tourism Sectoral Intervention Programme
InternationalTourism/Trade exhibitions/roadshows
Receiving international trade delegations
International Organisations (e.g. Great Wine Capitals of the World)
NationalOur engagement with national departments (e.g. DTI, Tourism, etc)
Our engagement with professional institutes (MHS, Fire, Disaster)
Our engagement with national organisations
Provincial
Our engagement with provincial departments (e.g. DEDAT, DCAS, etc)
Provincial institutes/ agencies (e.g. WESGRO, SEDA, etc)
Local Government (Local Municipalities)
Agencies (Local Tourism Associations, Agricultural Associations, NGOs, CBOs, Health centres, biosphere
reserve, sports federations, cultural organisations, business chambers, etc.
Our partners

100
Local government’s strength is its closeness to its communities. We want to use these
strengths to drive up service standards and foster a sense of community and civic pride. We
have been working tirelessly in building these partnerships with communities, business, non-
governmental organisations and other government bodies in the areas of rural and social
development, sports, tourism, economic development, environment, safety, etc.
PRE-DETERMINE OBJECTIVE 1.1: Ensure a comprehensive and equitable Municipal
Health Service within the CWDM.
MUNICIPAL HEALTH AND AIR QUALITY MANAGEMENT SERVICES
Vision
Municipal Health and Air Quality Management services of excellence.
Mission
To promote and ensure a safe and healthy environment through the provision of
comprehensive and equitable Municipal Health and Air Quality Management services
throughout the Cape Winelands District.
Divisional overview
The rendering of Municipal Health and Air Quality Management services are both statutory
functions placed upon the CWDM by the National Health Act, 2003 (Act 61 of 2003) and the
National Environmental Management: Air Quality Act, 2004 (Act 39 of 2004) respectively.
Legal Framework
It is the primary responsibility of this division to ensure the right of every person in the Cape
Winelands to an environment that is not harmful to their health or wellbeing, as set out in the
Constitution of the Republic of South Africa, 1996, Chapter 2 Bill of Rights, Section 24(a).
Municipal Health Services legal framework:
In terms of Part B of Schedule 4 of the Constitution of the Republic of South Africa, 1996,
Section 156(1)(a) Municipal Health Services had been entrusted to local authorities.
According to the Local Government: Municipal Structures Act, 1998 (Act No. 117 of 1998),
Section 84(1)(i), Municipal Health Services (MHS) were consequently declared the
responsibility of a District Municipality (Category C) and/or Metropolitan Area (Category A).
The National Health Act, 2003, (Act No. 61 of 2003), Section 32(1), tasks every metropolitan
and district municipality to ensure the provision/rendering of Municipal Health Services (MHS).

101
Therefore, the Minister of Local Government and Housing entrusted in Government Notice
No. 826, dated 13 June 2003, the delivery of Municipal Health Services (MHS) with effect from
1 July 2004 to district municipalities.
In terms of Section 1 of the National Health Act, 2003, (Act No. 61 of 2003) Municipal Health
Services were declared to be:
Water Quality Monitoring;
Food Control;
Solid Waste Management;
Health Surveillance of Premises;
Surveillance and Prevention of Contagious Diseases, excluding Immunisation;
Vector Control;
Environmental Pollution Control;
Disposal of the Dead, and
Safe Handling of Chemical Substances but excludes Port Health, Malaria Control and
control of Hazardous Substances.
Municipal Health Services are also responsible for the enforcement of the Foodstuffs,
Cosmetics and Disinfectants Act, 1972 (Act 54 of 1972) as well as the Municipal Health
Services legal framework:
Air Quality Management Services legal framework:
The Cape Winelands District Municipality is responsible for the rendering of an Air Quality
Management Function as determined by the National Environmental Management: Air Quality
Act, 2004 (Act 39 of 2004) and the National Framework for Air Quality Management in the
Republic of South Africa, 2012.
In terms of this legislation CWDM has the following statutory responsibilities:
The appointment/Designation of an Air Quality Officer
The development of air quality management plans as a component of integrated
development plans as required by the Municipal Systems Act
Implementing the atmospheric emission licensing system referred to in section 22, and
must for this purpose perform the functions of licensing authority as set out in this
Chapter and other provisions of this Act, subject to subsections (2), (3) and (4).
Monitor ambient air quality and point, non-point and mobile source emissions
The setting of municipal standards for emissions from point, non-point or mobile
sources in the municipality in respect of identified substances or mixtures of

102
substances in ambient air which, through ambient concentrations, bioaccumulation,
deposition or in any other way, present a threat to health, well-being or the environment
in the municipality
Monitoring potential illegal listed activities.
Monitoring compliance with emission standards in respect of the manufacture, sale or
use any appliance or conducting of an activity declared as a controlled emitter.
Monitoring compliance in respect to reasonable steps to prevent the emission of any
offensive odour caused by any activity.
Monitoring compliance with directives to submit an atmospheric impact report.
Monitoring compliance with conditions or requirements of an atmospheric emission
licence.
Monitoring any application for an atmospheric emission licence, or for the transfer,
variation or renewal of such a licence to ensure that it does not contain false or
misleading information.
Monitoring any information provided to an air quality officer to ensure that it does not
contain false or misleading information.
Divisional objectives for this IDP cycle:
Promulgation of an Air Quality Management Bylaw.
Review of the Municipal Health Services Bylaw.
Implementing a mobile application for the Municipal Health management system.
Review of the Cape Winelands District Municipality’s Air Quality Management Plan.
Implementation of an air quality sampling programme.
Projects
1. WATER AND SANITATION SUBSIDY SCHEME
This is an innovative programme implemented within the Municipal Health Services
Division, which has attracted national commendation. The subsidy scheme serves as an
incentive to farmers for improving the water and sanitation services provided to farm
workers.
Subsidies to a maximum of R 45,000 per annum is provided per farm for this purpose.
Subsidies are provided for the following:

103
Running water over kitchen sinks; and
Bathrooms with flush toilets in houses.
The CWDM through this project also intervenes directly in Hot Spot areas through the
provision of dry sanitation systems on farms and the rehabilitation of toilet facilities.
2. ANNUAL ENVIRONMENTAL HEALTH EDUCATION PROGRAMME
This project aims to create environmental awareness amongst the communities of the
CWDM in order to change negative behavioural patterns.
This is done through;
live theatre performances in schools,
the development of educational material
and formal health education at industries/businesses and organisations.
3. GREENING CAPE WINELANDS
This project entails the planting of indigenous trees and shrubs throughout the district
focusing on newly established housing developments, schools, crèches, public amenities
and organisations. The project also promotes local business through the procurement of
trees and shrubs from local nurseries. Small scale local contractors are also appointed to
plant these trees and shrubs which leads to the creation of temporary employment
opportunities.
This project has the following aims:
Promoting a greener environment;
Establishing environmental awareness amongst communities through
environmental education;
Improving the quality of life for all inhabitants of the Cape Winelands;
Creating income opportunities; and
Involving communities in environmental protection actions through the planting of
trees.
104
PRE-DETERMINE OBJECTIVE 1.2: Ensure coordination of multi-disciplinary and
sectoral disaster risk reduction through integrated institutional capacity for Disaster
Risk Management, Disaster Risk Assessment and Response and Recovery.
DISASTER MANAGEMENT
Disaster Management is a Schedule 4A function in terms of the Constitution Act, 1996. In
terms of Section 159(4) of the Constitution, Schedule 4A & 5A functions must be assigned to
local government by means of an agreement which would naturally include funding
arrangements.
A challenge facing the disaster management function is the persistent mind-set that it is
primarily a response entity and seemingly not focussing enough on a preventative, mitigation
and risk reduction approach as is intended by the Disaster Management Act, 2002 (Act 56 of
2002). This is especially relevant at municipal level, the closest form of government to
communities.
Whilst disaster management is intended to be primarily a co-ordination and planning function,
intergovernmental relations are therefor of the utmost importance. The Cape Winelands
District Disaster Management Forum has at least two meetings annually, while quarterly
meetings are held with the five local municipalities. The latter besides daily interaction with a
wide variety of role-players.
The District Disaster Management Centre is not always fully informed by other spheres of
government of their programmes and projects within the District. Challenges do exist, for
example, the sharing of external departments’ individual risks. The Disaster Management
Division is working towards addressing this situation.
RISK ASSESSMENT PROJECTS
The District Disaster Management Centre has initiated a Ward-based Risk Assessment
project. This project first of its kind risk assessment aims to conduct risk assessments in each
ward across the district. The reason for this approach is that not all wards in a municipality
have the same risks. Information concerning risks is obtained in the following ways:
1) Focus group consultations with each Ward Councillor and ward committee member
2) Focus group consultations with communities in each ward
3) Door to door sample survey in each ward
4) Interviews with municipal and provincial departments, agricultural organisations and
other organisations or services operating in the area

105
Since the initiation of this project, ward-based risk assessments have been conducted in
Witzenberg Municipality (2014/2015), Langeberg Municipality (2015/2016) and Breede Valley
Municipality (2016/2017).
These risk assessments must inform disaster risk management planning in the district,
including planning undertaken by local municipalities, the development and application of
disaster risk reduction policies, priority setting for risk reduction programming undertaken by
national and provincial organs of state, municipal departments and other role players.
DISASTER MANAGEMENT AMENDMENT ACT AND VOLUNTEER REGULATIONS
In terms of Section 43 of the Disaster Management Act, 2015 (Act 16 of 2015) local
municipalities must establish disaster management capacity at local level. This may either be
done at their own initiative or in conjunction with district municipalities. It might be a possibility
that a number of the local municipalities in the Cape Winelands District may need assistance
or venture into partnerships with CWDM placing an additional financial burden on the District.
The Disaster Management Volunteer Regulations promulgated on 17 December 2010 allows
metropolitan and district municipalities to establish disaster management volunteer units. It is
envisaged that the District Municipality will first develop a framework to implement the
regulations.
DIVISIONAL STRATEGY
The Disaster Management Amendment Act, 2015 (No16 of 2015) places a radically changed
approach to the function. More emphasis must be placed on prevention, mitigation, risk
reduction by all municipal departments. The disaster management function should bear the
responsibility to encourage all relevant role-players to comply with abovementioned
approaches.
PRE-DETERMINE OBJECTIVE 1.3: Provision of effective planning and coordination of
fire prevention, safety and fire-fighting services throughout the Cape Winelands.
FIRE-FIGHTING SERVICES
The Municipal Structures Act, 1998 (Act 117 of 1998) (as amended) Section 84(1) (j) states
that a district municipality has the following functions and powers –
planning, co-ordination, and regulation of fire services;
specialised firefighting services such as mountain, veld and chemical fire services;
co-ordination of the standardisation of infrastructure, vehicles, equipment and
procedures; and

106
training of fire officers
The risk profile of CWDM
+/- 60% of the CWDM surface area comprises of mountains and +/-20% ground coverage is
veld and fynbos. Farming and plantations make up the majority of the remaining ground cover.
The region experiences fires from November to April annually, therefore communities and the
environment are extremely vulnerable to these types of disasters that have the potential to set
back economic and social development, as the Agricultural Industry is the lead employer in
the region.
Major national and regional roads and rail routes transit the CWDM and carry hazardous
cargoes for local and national consumption.
Challenges
In terms of the CSIR Report No: CSIR/NRE/ECO/ER/2010/0023/C which is a national Veld
Fire Risk Assessment: analysis of exposure of social, economic and environmental assets to
veld fire hazards in South Africa and our own on the ground experiences, it is a given fact that
major veld fires has become an inherent phenomena of our region due to many factors, thus
resulting in stretching our current fire services resources to its optimum. Although much
planning and coordination is done with most stakeholders i.e. Landowners, B Municipalities
and Provincial Fire Services, the sheer magnitude of these fires causes it to remain a
challenge.
Recommendations
The current working relations and coordination within the Cape Winelands Fire
Workgroup, MOA’s with B Municipalities and the Metro Fire Services and Provincial
Fire Services are expanded and strengthened;
That Council maintains a core permanent fire personnel component to effect it
legislative functions;
That the peak veld fire periods be boosted with aerial firefighting support, reservists
and ground crew members; and
That Provincial Government continues and increases their financial support towards
aerial fire fighting resources, as CWDM is already budgeting a substantial amount for
it.

107
Fire and Rescue Training Academy
The Cape Winelands District Municipality (CWDM) is legislated to provide training for fire
personnel in terms of Section 84(1) (j) of the Local Government: Municipal Structure Act, 1998
(Act 117 No 1998) and has established the Cape Winelands Fire and Rescue Training
Academy to fulfil this mandate.
The Training Academy has accreditation with the South African Emergency Services Institute
(SAESI) / the International Fire Service Accreditation Congress (IFSAC) and has its head
office in Stellenbosch, which is a traditionally and culturally a town synonymous with education
and training. Over time, considerable investments were made in the Training Academy, thus
resulting in it being one of the leading training centres in Western Cape Province.
The National Fire Protection Association (NFPA) 1001 program which consists of Firefighter
I, Firefighter II, Hazmat Awareness and Hazmat Operations is being conducted at the
Academy annually, attended by Fire Fighters from various Municipal Fire Departments, SA
Navy, ACSA and Transnet from March to December.
To sustain the Cape Winelands Fire and Rescue Training Academy and the good work it is
doing in the Western Cape, Council has to revise its current staffing structure of 1 Regional
Commander: Training and Development and appoint at least 2 Fire Instructors and continue
to maintain and improve training facilities, resources and equipment.
Preparation Plan for Veld Fire Season
Cape Winelands District Municipality spearheads annually a planning session with its partners
for the veld fire season. The main purpose of this inclusive session is to ensure that all
firefighting resources of the relevant partners are utilised in an effective and efficient manner.
Due to the very high number of fires and major fires the area is generally experiencing during
the summer season, resources are stretched to optimal limits and therefore special planning
and organising are required. The Fire Services of the Cape Winelands District Municipality,
Cape Nature and Cape Pine partners with the objective of cooperating in the optimisation of
their organisations and resources to systematically and expeditiously manage veld fires within
the Cape Winelands District municipal area.
Fire Protection Association
The Fire Protection Association is a non-profit organisation which is formed in terms of the
Veld and Forest Act, by landowners who wish to work together for the purpose of preventing
and managing fire risks. Rules are drawn up and accepted by the members. The main role of
the Fire Protection Association Management is to ensure that members abide by the rules and

108
legislation. Fire Protection Association Management also arranges training and awareness
sessions.
The main constraint is finances that threaten sustainability. The Fire Protection Association
requests assistance with training, hand tools (such as beaters) and employment of contractors
to create strategic fire breaks and to assist with fire prevention operations such as burning of
fuel loads etc.
PRE-DETERMINE OBJECTIVE 1.4: To facilitate environmentally sustainable economic
development planning through the development and maintenance of strategic
partnerships, investment attraction, retention and opportunities, SMME support and
development, skills development and information and knowledge management.
SPATIAL PLANNING
CAPE WINELANDS SPATIAL DEVELOPMENT FRAMEWORK (CW SDF)
The purpose of the Cape Winelands District Spatial Development Framework (CWDSDF)
is to lay down a ‘set of guidelines’ to:
Interpret and apply higher-order spatial policy within the Cape Winelands district
Guide regional and local policy interventions
Act as a strategic forward-planning tool to guide planning and decisions on land use
and land development
Consider a spatial rationale to the development vision of the district that is clear enough
to allow decision-makers to deal with unanticipated/unplanned situations
Develop a spatial logic that guides public and private-sector investment
Ensure the social, economic, built and environmental sustainability of the area
Formulate proposals to redress the spatial legacy of apartheid, and
Propose (spatial) indicators to measure outcome.
Strategic Context
The CWDSDF conforms to, inter alia, the provincially-endorsed bioregional planning
principles, but adds the principles of consistency and vertical equity. The latter assumes that
the disadvantaged should be favoured above more advantaged people and refers to the

109
distribution of impacts (who receives benefits or bears costs). This is particularly relevant in
the provision of housing and infrastructure and implementation of land reform.
Strong emphasis is placed on cohesiveness and the democratization of spatial planning.
Hence, one planning imperative is to counter-balance the compartmentalisation of the so-
called pillars of sustainable development, viz. economic, social and environmental. This
invariably amplifies the implementation of the bioregional planning approach with which, we
believe, only moderate outcomes have been achieved. We also believe that areas of
bioregional homogeneity should not be broken up between different planning initiatives.
However, the mismatch between (existing) statutory administrative boundaries and the
domains people regard as their home territory, as well as ecosystem boundaries, is
synonymous with heterogeneity. In this regard we identified the need for reconsidering the
existing municipal boundary alignment at identified ‘hot spots’, viz. Faure, Klapmuts, the
Dwarsrivier Valley (Franschhoek area) and the area in Drakenstein Municipality to the north
of Wellington. At a more macro scale, this planning predicament required homogeneous
planning areas to be determined and used. Pragmatically, we demarcated three planning
clusters
A, B and C (see map
opposite). This is based on the
footprint of the four catchment
areas covering the district. In
line with this approach,
geographic differentiation of
strategies is achieved through
spatial referencing. This is
best illustrated by the decision
tool — developed to assist in
land use management —
that, on a line graph, place
land use, by type, according to cluster-specific preference.
It is proposed that efforts to “improve, strengthen or restructure” the local development
process have to focus on the spatial, racial and social-class spread of development and the
safeguarding of sustainability — rather than the “creation” of new growth sectors, nodes or
initiatives. In support of this development approach, the CWDSDF objectives centre on a
principle-led response, collective recognition, functional efficacy and integrated planning.

110
On a macro (district) scale, the rationale behind any spatial argument is underpinned by the
closeness to the Cape Metropolitan area and the Breede River Valley as the possible primary
linear settlement able to absorb much of the Province’s population growth in the near future.
We believe that the latter should be subject to an investment focus on Worcester as the only
major service centre in the easterly district — includes the Breede Valley, Witzenberg and
Langeberg municipal areas.
Probably the two most important outcomes of this spatial intervention are, firstly, the
introduction of (basic) spatial indicators to measure, over time, the ability of long-term
comprehensive planning meeting its objectives. Secondly, we developed a user-friendly
decision tool to assist in decision taking regarding the appropriate use of land.
CW SDF Objectives
Obj1 To improve the quality of life for the people of the region by ensuring principle-led
responses
Obj2 To ensure collective recognition of ensuing spatial guidelines
Obj3 To manage the impact and exposure of external and internal threats to growth and
development (read: sustainable development)
Obj4 To restructure urban settlements (where feasible)
Obj5 To promote the concentration and intensification of human and economic activities
within the current land footprint and in areas of high accessibility
Obj6 To promote sustainable resource use and responsible rural development
Obj7 To address housing backlogs within a settlement hierarchy and propose alternative
settlement options
Obj8 To foster the inclusion of an economic perspective in land use management and land
development
Obj9 To improve and conserve the district’s natural environment
Obj10 To consider the spatial rationale for the implementation of government policies within
the Cape Winelands district

111
Development Imperatives
Mapping out expected or feasible developments in the district’s space economy needs to
consider the following critical factors:
Population growth in the different municipalities
The changing economic base and sector structure of the towns and hamlets
Longer-run evolution of town centres (in the light of changing retail patterns)
Diversification, consolidation and racial integration of urban areas inside and between
the towns and smaller settlements
Land-use changes and land-reform opportunities inside and around the settlement areas
and the respective urban edges
Expected rural-area development patterns in the different local municipal areas and
around the towns
The impact of water-supply limitations (accelerated by longer-run climate change) and
of new energy sources on evolving local economic activities
Housing supply and demand trends and how these fit in with spatial development
guidelines
Existing structural deficiencies within all urban and rural configurations
Strengthening of existing development corridors (e.g. Mbekweni / Paarl / Wellington),
and
Facilitation of growth opportunities along transport corridors (e.g. along the N1 — Paarl
/ Klapmuts / Cape Town)
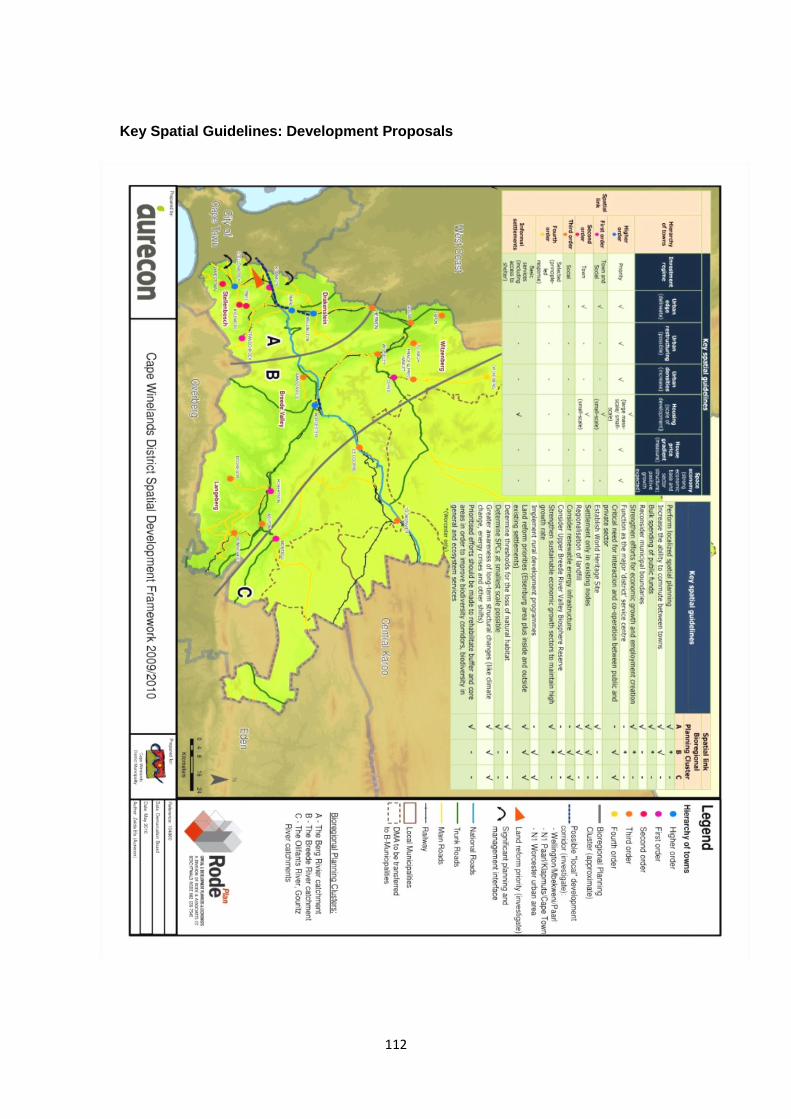
112
Key Spatial Guidelines: Development Proposals

113
5.2.1 DRAFT CAPE WINELANDS ENVIRONMENTAL MANAGEMENT FRAMEWORK
The Study Area
The study area for the EMF (see Error! Reference source not found.) encompasses some 2
0 000 km2 and comprises the three local municipalities within the CWDM that lie east of the
Berg River primary catchment.2
The three municipalities making up the study area include:
Witzenberg Municipality – this municipality covers an area of approximately 10 750 km2 in
the northern portion of the study area and includes the towns of Ceres, Tulbagh, Prince Alfred
Hamlet, Wolseley and Op-die-Berg. Rural areas within the municipal boundary include the
Ceres valley, Koue Bokkeveld, Achter-Witzenberg , the northern portion of the Breede River
as well as the majority of the former DMA;
Breede Valley Municipality – this municipality covers an area of approximately 3 834 km²
stretching from the Du Toitskloof Mountains in the south-west of the study area to its eastern
boundary, and includes the towns of Rawsonville, Worcester, De Doorns and Touwsrivier, as
well as the rural areas between these towns; and
Langeberg Municipality3 – this municipality covers an area of approximately 4 519 km2 in the
southern portion of the study area and includes the towns of Ashton, Bonnievale, McGregor,
Montagu and Robertson and well as the rural areas between these towns and to the northeast
of Montagu
2 Until July 2011, an 11 000 km2, area in the north east of the study area was designated as a District Management Area (DMA) and was
administered directly by the CWDM. The DMA has now been subdivided and incorporated mainly into the Witzenberg, Langeberg and Breede Valley Municipalities. A small portion in the south-east of the former DMA has been incorporated into the Overstrand District Municipality, and thus no longer form part of the study area for this EMF.
3 Formerly Breede River Winelands Municipality

114
What is an EMF?
EMFs are part of a suite of Integrated Environmental Management tools that support informed
and integrated environmental decision-making. EMFs present and integrate relevant
biophysical and socio-cultural information for a geographically defined area to identify and
inform appropriate land use and land use management.
Areas that are identified as being environmentally sensitive (Environmental Management
Zones (EMZ) are presented in the EMF on maps, facilitating the use of the tool in spatial
planning and decision-making by authorities and individuals. The management guidelines
associated with individual environmentally attributes in each EMZ are distilled from a multitude
of existing policies and guidelines, which are thus consolidated and given effect through the
EMF.
The broad objectives of the EMF are listed below, as identified by the Department of
Environmental Affairs (DEA, 2010):
Support informed and integrated decision-making by making significant and detailed
information about an area available before activity proposals are generated;
Contribute to environmentally sustainable development by anticipating potential impacts
and by providing early warnings in respect of thresholds, limits and cumulative impacts;

115
Support the undertaking of environmental impact assessments in the area by indicating
the scope of potential impacts and information needs that may be necessary for
environmental impact assessments;
Support the process of delineating geographical areas within which additional specified
activities are to be identified in terms of NEMA; and
Support the process of delineating geographical areas within which activities listed in terms
of NEMA may be excluded by identifying areas that are not sensitive to the potential
impacts of such activities.
The EMF will support informed and integrated decision-making by authorities and planning
and environmental management by conservation managers, developers, planners and
Environmental Assessment Practitioners (EAPs) by enabling them to:
Access a shared, spatially explicit inventory of agricultural and environmental informants
and desired development options;
Identify environmental and regulatory implications of different land use choices;
Assist in the adjudication of development and other Environmental Impact Assessment
(EIA) applications, particularly in relation to cumulative impacts;
Protect sensitive environments;
Develop agri-environmental plans that allow for productive use of farmland while
supporting biodiversity conservation; and
Promote sustainable development in the area.
As expectations on EMFs are often high and varied by stakeholders, Box 0-1 sets out what
this EMF compiled for the CWDM, and EMFs in general, can and cannot achieve.

116
Box 0-1:
What this EMF can and cannot achieve
The EMF for the Cape Winelands District Municipality WILL:
Indicate areas of higher environmental sensitivity within the study area, and what environmental attributes this sensitivity is linked to
Indicate activities which are undesirable and unlikely to be approved in certain areas
Assist decision-makers in deciding or commenting on land use applications by indicating appropriate developments for certain areas
Assist municipalities in spatial planning by indicating areas potentially appropriate for certain types of development
Provide guidance to EAPs in determining potential impacts of a proposed development
Indicate which types of activities may not need an EIA, once EIA Regulations allow for this
Reduce the need for detailed specialist studies in some areas, or assist in focussing the Terms of Reference (ToR) for specialist studies
The EMF for the Cape Winelands District Municipality WILL NOT:
Eliminate the need for informed decision-making, weighing up priorities for the area, as desirable and undesirable land uses for any one area may conflict
Provide detailed land use planning guidelines for urban areas
Provide detailed information for individual properties
Eliminate the need for undertaking EIAs for land uses or activities listed in terms of the NEMA EIA Regulations
Provide information on all individual environmental aspects of relevance in the area, e.g. remaining water availability, which need to be investigated further for individual applications

117
The Cape Winelands Biosphere Reserve (CWBR) 3220km² in extent was registered during
September 2007. The CWBR Non-Profit Organisation whom manages the CWBR affairs must
ensure that the following functions are met; A conservation function- to contribute to the
conservation of landscapes, ecosystems, species and genetic variation; A development
function- to foster economic and human development which is socio-culturally and ecologically
sustainable; A logistic function-to provide support for research, monitoring, education and
information exchange related to local, national and global issues of conservation and
development.
COMPOSITION OF THE BIOSPHERE RESERVE
As illustrated by the figure below, the proposed biosphere reserve consists of three broad land
use area (zones), namely core conservation areas, buffer areas and transition areas.

118
Cape Winelands Biosphere Reserve Map:
Cape Winelands Biosphere Reserve Non-Profit Organization’s Interventions/Projects:
A.) Bonnievale/ICE Schools Project
B.) Trails as an Economic Driver in the Cape Winelands Biosphere Reserve
C.) Cape Winelands Biosphere Reserve Education and Eco Centre.
D.) Eco Coffin Project
E.) Proposed Sustainable Utilization Plan Educational, Conservation, Tourism and Sport
Project
F.) Geocaching the Western Cape Biospheres
G.) CWBR Eco Educational Bus Project
H.) Schools Eco Club Program

119
For more information on the abovementioned interventions/projects please contact the
following person: Mark Heistein (CEO CWBR), Contact details: 0797474632, E-mail address:
[email protected] CWBR website: www.capewinelandsbiosphere.co.za.
LOCAL ECONOMIC DEVELOPMENT
CAPE WINELANDS INVESTMENT ATTRACTION AND OPPORTUNITIES PROGRAMME
The Cape Winelands District Municipality (CWDM) is compelled to formulate strategic policies
and developmental initiatives that would necessitate and thus, stimulate economic
development at local level. As a means of addressing this task and providing a strategic
facilitation role in regional investment the CWDM has develop the Cape Winelands Investment
Attraction and Opportunities Strategy (CW-IAOS).
The primary goal being, to provide guidelines that would promote and facilitate investment in
the Cape Winelands area by focusing on:
retaining and expanding existing businesses,
identifying investment opportunities in the area; and
attracting new investment into the area.
Business Retention and Expansion Programme
The BR & E Programme will continue to provide support to establishments within the Tourism
industry in order to retain and expand their business operations. Special focus is also placed
on the niche tourism development areas (i.e. sport/outdoor tourism (sports events, cycling,
mountain biking, canoeing, running, etc.); accessible tourism (focused on access for people
with disabilities) and multi-generational tourism (family friendly) as areas to be exploited for
further growth.
Investment Attraction Programme: Tourism Mobile Apps Project
The Tourism Mobile Apps project will be launched in Tourism Month 2016. During the
2015/2016 financial year, a smart mobile application has been created which can be
downloaded from an App store. The purpose of this tourism mobile app is to offer tourists a
product that is compatible with all media and can be an information guide about a specific
town, tourist routes, places of interest, monuments, restaurants, accommodation, leisure,

120
nightlife and shopping. Additional functionalities will be added during the 2016/2017 financial
year and the Apps will be launched.
Attracting new investment
The Cape Winelands District will participate at two exhibitions, the SMME Opportunity
Roadshow and the Namibia Tourism Expo. The SMME Opportunity Roadshow will be
attended for a third year and is held at the Cape Town International Convention Centre. This
expo is focused on providing a platform for local SMMEs within the district. The Namibia
Tourism Expo will be attended for the 6th year in Windhoek. The aim of these exhibitions is to
provide brand recognition of Cape Winelands products/services both domestically and
internationally and provide opportunities for generating additional revenue for the SMMEs and
thus expanding the District tax base.
BUSINESS SUPPORT PROGRAMME
Entrepreneurial Seed Fund Programme
This programme aims to provide seed funding to SMMEs within the District to either start or
expand their businesses in order to create self-employment as well as employment generation
opportunities for unemployed persons within the District. The selection process of the
beneficiaries has significantly improved and SMMEs which are more focused on a specific
trade has provided more prestige to the Programme. The entrepreneurs now have an
opportunity to showcase their talent and live their passion through the creation of a product or
service that they are proud of. The successful entrepreneurs receive funding in the form of
purchases of goods and equipment to be utilised in their businesses. It is expected of the
beneficiaries to participate on the Cape Winelands Mentorship Development Programme
where they receive support in the form of business mentoring. The allocated grant funding
ranges from R5000-R30 000.
Cape Winelands Mentorship Development Programme
The Programme provides mentorship to the beneficiaries of the Entrepreneurial Seed Fund
and Small Scale Farmers programmes. Incorporated in the mentorship programme is special
focus on business management, basic bookkeeping and accounting and marketing. This
programme will be facilitated by a service provider for the second year of a three year contract.
The service provider also administers the purchasing of equipment on behalf of CWDM.
Regular engagements will occur between the service provider and the LED officials regarding
the progress and challenges of each of the beneficiaries.

121
Small Scale Farmers Support Programme
This programme aims to contribute to the rural growth and development of sustainable food
security by providing financial support to emerging and small scale farming projects in the
Cape Winelands. Together with the service provider of the Cape Winelands Mentorship
Development Programme, opportunities to access additional funding and assistance from
other government institutions will be introduced to provide support to beneficiaries.
RESEARCH AND INFORMATION MANAGEMENT PROGRAMME
Tourism visitor tracking survey
The aim of this programme is to keep up to date economic information to make informed
decision and evidence based planning. The Cape Winelands District Municipality continuously
do an analysis of the major economic sectors in the Cape Winelands. This is to ensure that
the local government is informed on what sector specific interventions to implement to create
conducive environment for local economic development.
To make sure that we keep up to date information on the development of industries, the Cape
Winelands District Municipality is working more closely with Wesgro and the Local Tourism
Associations in the region in terms of data collection. The Cape Winelands District Municipality
will print and distribute the visitor tracking forms to the Local Tourism Offices and the big
tourism attractions.
Local Economic Development Management System
The Local Economic Development System is a system that is designed to make it easier for
LED Facilitators and for partnering stakeholders to do their LED work better. It helps the user
to understand their tasks better, communicate better and control operations. The system
introduces good practices for Information and knowledge management, quality management,
project management, LED system configuration management and stakeholder relations
management.
The LED System will be a platform to establish and manage economic development initiatives
amongst development partners. It will explicitly map and track and value added. It defines the
patterns of cooperation for all to understand.
The Cape Winelands District Municipality has acquired a licence for the LED Management
System. The system will be used as a tool to make economic development coordination better
amongst stakeholders. It will also allow the Council to track progress and performance real
time.

122
TOURISM
INTRODUCTION
Tourism is travel for pleasure and is described by the World Tourism Organization as people
traveling to and staying in places outside their usual environment for not more than one
consecutive year for leisure, business and other purposes. Tourism consists of both domestic
and international visitors and is a major source of income for many countries. Tourism in the
CWDM is divided into Tourism Product Development and Tourism Marketing.
TOURISM PRODUCT DEVELOPMENT
The focus is on developing new and existing products within the tourism industry. We try to
give the products the necessary training and skills to enhance their quality of service and
business management. In order to do so, new Products need to be developed that enables
the Tourism Industry to be a vibrant industry that can offer an array of different products and
experiences. Therefore, the following two projects, i.e. LTA Projects and Tourism Training
which are implemented in the whole Cape Winelands District Municipal area
LTA PROJECTS:
The tourism industry in CWDM is a predominantly white owned industry. In order to promote
and accomplish transformation in this industry the CWDM must encourage LTA’s to include
their local communities within the Tourism industry as equal role-players. LTA’s are mainly
funded by the B Municipality to whom they are accountable for spending this money. Their
main focus is marketing oriented and the CWDM cannot dictate to them on how to utilise these
funds. The CWDM however provides to these LTA’s limited incentive funding to be sued for a
developmental project that indirectly enables them to include and develop their local
communities. These projects uplift local communities and make them part of the mainstream
tourism industry, thereby also improving the quality of service and awareness of tourism in
previously disadvantaged areas.
TOURISM TRAINING
The CWDM with the assistance of local municipalities, community workers, tourism role
players and LTA’s managed to compile a comprehensive database of community members
needing assistance with training and tourism product development. In addition, linkages with
Tourism Help Desk Agents (THD’s), SEDA and other institutions also assist small businesses
with registering their businesses, applying for funding, tendering processes and mentoring.

123
Training offered by the CWDM focusses mainly up skilling the unemployed and youth, creating
appropriate platforms for them to acquire more skills, pursuing further studies and obtaining
employment in the tourism industry.
The following training has been identified as being essential for the development of tourism
businesses and to assist them to become sustainable businesses.
Culinary Training:
This training focus on Caterers, B&B Owners, Unemployed, Youth and Restaurant staff.
Trainees are trained in the culinary art both on a theoretical as well as practical basis covering,
life skills, personal and work hygiene, effective time management, etc. This training enables
trainees to acquire unit standards which can be used to further their studies at CPUT as
assistant chefs or obtain employment after acquiring their certificates on completion of the
training. Thus, achieving the goal of job creation or providing the necessary skills to get a job
or further their studies.
Events Management:
This training is sought after by LTA’s and SMME’s wanting the certificate in conjunction with
owning their tourism businesses. The tourism industry generates big revenues through
festivals and events and therefore it has become very important for tourism businesses to
have the knowledge on how to plan or manage an event. This certificate enables successful
participants to obtain employment at events management companies, etc.
Customer Care Training:
This training is essential for all staff working directly with tourists in the industry. Most
unemployed trainees need this training in order to provide quality services to tourists entering
our region. Most of our communities do not know how to speak or relate to tourists and see
them as a threat or they are scared to communicate. The customer care training addresses
all issues relating to tourism and how to take care of tourists. The hospitality industry uses
local people to work in their establishments, but neglect to provide proper training. The CWDM
by providing these training ensures that Service Excellence can be experienced can be
experienced in our destination.

124
Introduction to Wine:
The CWDM is the Wine Capital of the African continent and is obliged to educate people living
within the Cape Winelands region. The wine industry is huge and provides a vast number of
jobs where it is expected of people to know their wines. The introduction to wine training gives
trainees a background on the history of wine in South Africa, teach them to do wine tasting
and enables them to know the differences between various types of wines. The CWDM in
conjunction with the Cape Wine Academy attempt to rollout this training as far as possible to
bring thee knowledge about wine to people in our destination. The certificate enables quite a
number of unemployed trainees to obtain employment at wine farms and in various wine
tasting venues.
First Aid Training:
This training is a prerequisite for all tour guides and operators to be able to operate legally.
LTA’s also requested this training as it is also essential for them to have it as they work with
tourists on a daily basis.
Computer Training:
The ability to be computer literate is an absolute necessity as lack of computer literacy limits
the chances of finding employment. There is a huge demand for computer training ranging
from unemployed, older people having tourism businesses but not being proficient in doing
emails or bookings online or browsing the internet. The CWDM successfully completed a
number of training in the district enabling people to generate their own emails through using
internet café’s or working on computers at libraries, LTA’s and municipalities in order to assist
them searching for employment and job opportunities online.
TOURISM MARKETING
Tourism marketing is the business discipline of attracting visitors to a specific location.
In this regard specific marketing strategies are developed around broad tourism themes selling
the uniqueness of the destination to tourists. The CWDM focusses mainly on promotion such
as websites, mobile applications, brochures, DVDs, exhibitions, roadshows, trade shows and
other stakeholder engagements to market the destination to tourists. The main promotional
projects are:
MEDIA/TOUR OPERATORS AND STAFF EDUCATIONALS
This project aims to promote the hidden gems and the cultural heritage of the Cape Winelands
region through the hosting of media journalist and tour operators throughout the Cape
Winelands region. Approximately seven educationals are planned and executed per financial

125
year, promoting new and niche products to the domestic and international market. Journalists
invited on these educationals do write ups and place it in different magazines and newspapers.
TOURISM MONTH
This project aims to honour and acknowledge the important role played by various tourism
stakeholders within the tourism industry in the Cape Winelands region. The month of
September is known as the tourism awareness month and the 24th is the international tourism
day which is celebrated throughout the world. The CWDM celibates the launch of Tourism
month during the first week of September each year. In addition, the Executive Mayor honours
the tourism industry by bestowing special awards to exemplary tourism stakeholders in various
categories as part of the tourism month celebrations. However, due to the complexity in
awarding these stakeholders that excelled in tourism, the actual gala event has moved to
March month.
TOURISM EVENTS
Tourism events is a systematic and a planned marketing tool to attract more tourist, improve
the image of a destination, increase tourist arrivals improve seasonality and geographic
spread within a destination. The CWDM supports approximately 20 events throughout the
region that supports local produce and encourages involvement of the previous disadvantage
groupings in their events.
EXHIBITIONS, ROAD SHOWS, EXPOS
This project provides a platform to promote tourism offerings; attracts investments;
creates employment opportunities, opening niche markets to national and international
markets, enable SMMEs to new and existing business networks with established business;
foster tourism partnerships; improve planning, coordination, alignment and integration
between all spheres of government, private sector and communities.
SPORT TOURISM, WINTER CAMPAIGN
This projects provides a platform for the region to address seasonality. Attracts domestic
visitors to the hinterlands. Promotes affordable short breaks for the domestic market; capitalise
on the economic impact of Sports Tourism. Connect diverse culture and heritage experiences
that can be enjoyed all year round; and Showcase interdepartmental cooperation.

126
MARKETING COLLATERAL: VIDEOS AND DVDS
Provides a platform for the municipality to, promote the region as the preferred tourist
destination on various marketing platforms. Traditional marketing material such as brochures
and e-brochures are very effective in traditional target audience that still prefers utilising hard
copy brochures. Therefore, some of the marketing material have to be translated into
Mandarin, French, Spanish and German; and DVDS are also used as promotional material to
visually entice the target audiences.
BRANDING ITEMS
This project provides a platform for the region to:
Brand the destination through branded items such as t-shirts, wine glasses, paper
carrier bags etc.;
Strengthen the impact of the region at various marketing platforms; and
Create a form of unity between all participants at the regional stand.
PRE-DETERMINE OBJECTIVE 1.5: To facilitate and ensure the development and
empowerment of the poor by graduating people out of poverty, social inclusion and
improving the livelihood of the poor, vulnerable groups, rural farm dwellers and rural
communities
Vision
Integrated rural and social development service of excellence
Mission
To initiate, facilitate, coordinate, catalyse and implement integrated rural and social
development programmes that enables and empowers the poor, the vulnerable and those with
special needs.
Divisional overview
The Division Rural and Social Development of the Cape Winelands District Municipality focus
on building and maintaining social capital through access to the programmes and services.
Related programs aim to increase physical activity, enhance education, improve skills levels,
enhance employability, access to assistive devices, providing funding for community based
organisations and promoting the rights of vulnerable groups. The success of these
programmes were based on the strong and vibrant partnerships with National and Provincial

127
Governments, B-Municipalities, Civil society organisations, Communities across the district
and Training institutions.
Legal Framework
Section 153 of the South African Constitution (Act 108 of 1996) defines developmental
duties for all categories of Municipalities, stating that a Municipality must:
(a) Structure and manage its administration, budgeting and planning processes to give
priority to the basic needs of the community; and to promote the social and economic
development of the community; and must
(b) Participate in national and provincial development programmes.
Constitutional Schedules 4B and 5B define the core functional services of local
government, which need to be effectively planned, delivered and regulated, as the
foundation for social & community development in our Municipal Integrated Development
Plans and performance management systems.
Policy Alignment
National Development Plan
• Chapter 3: Economy and Development (e.g. economic & social infrastructure
investment)
• Chapter 6: Inclusive Rural Economy (e.g EPWP, skills training,)
• Chapter 9: Improving education, training and innovation ( e.g. awareness and capacity
building programmes)
• Chapter 10: Health Care for all (e.g. HIV/AIDs, TB, Alcohol abuse)
• Chapter 11: Social Protection (e.g. food security, opportunities for unemployed, public
employment)
• Chapter 12: Building Safer Communities (e.g.16 days of activism, domestic violence
awareness, holiday programmes)
• Chapter 15: Nation Building & Social Cohesion (e.g. sport, recreation, arts and culture)

128
Cape Vision 2040
• Enterprising Cape (e.g. EPWP; social enterprise creation; entrepreneurship)
• Living Cape (e.g. multi-opportunity communities)
• Educating Cape (e.g. skills development, innovation)
• Leading Cape ( Leadership skills training, Grade 12 top achievers awards)
Divisional objectives for this IDP cycle:
Provide skills development and employment creation (youth, women, people living with
disabilities);
Initiate and support Social cohesion and access to human and social capital programmes
To provide support to programmes that reduce the psycho-social impact of HI/AIDS of
individuals and families infected and affected by HIV/AIDS
To support integrated programmes and services for elderly and persons disabilities,their
families and caregivers
To support Early Childhood Development staff capacity building programmes
To provide access to immediate and temporary social relief and material support for
those affected by undue hardship and minor disasters.
Provide support to comprehensive child and family care and support services in
partnership with stakeholders and civil society organisations.
Support and implement care and support programmes for victims of domestic violence
Support integrated developmental social crime prevention and anti-substance abuse
services to the most vulnerable in partnership with stakeholders,civil society organisations
and treatment centres.
Facilitate opportunities that promote positive life styles and responsible citizenship for
young people
Projects
Community Support Programme:
Funding is provided to support civil society organizations in rendering services focusing
on poverty alleviation and rural development amongst rural poor and impoverished
households. This programme enhances the capacity of 50 beneficiary organisations to
render service that will contribute to the achievement of our strategic objectives.

129
Disability
This project aims to improve the livelihoods of people with disabilities and to address social
barriers that exclude people with disabilities from the various systems of society.
Accessibility is important to achieve the principles of full inclusion, equality and
participation in mainstream society. Skills training programmes for persons with disabilities
provides access to employment in the open Labour market. The provision of assistive
devices enhance removes social and educational barriers that exclude persons with
disabilities on the basis of their hearing, visual and physical impairments. The
commemoration of the International Day for Persons with Disabilities was implemented as
part of the interventions in support of breaking barriers and stigma posed to people with
disabilities in the district.
Elderly
Through the implementation of such a project, the Municipality strives to maintain and
protect the status, wellbeing, safety and rights of older persons. This project also aims to
promote and create an enabling environment for elderly to participate actively in healthy
lifestyle, wellness and cultural activities. The vibrant partnership with Service Centres,
Western Cape Older Persons forum, Age –in-Action; B-Municipalities; Department of
Health, Department of Social Development and Department of Cultural Affairs and Sport
contributes to the successful implementation of this project.Elderly persons have made
valuable contributions in building communities in the Cape Winelands District. 1000 Elderly
persons from Service Centres across the district annually participate in the Regional
Golden Games. The finalists of this event participate in the Provincial Golden Games
where after a team is selected for the National Golden Games. The More Living – Active
Age programme provide opportunities for elderly persons from the district to participle in
cultural heritage programmes, health, recreational, wellness and capacity building
programmes.
Families and Children
Families are the corner stone of communities. Dysfunctional families lead to dysfunctional
communities. Interventions to support vulnerable families are vital in alleviating abuse,
neglect and poverty. The project aims to strengthen the capacity of families and
communities to care for and protect children. Through this project poor rural schools were
afforded opportunities to embark on educational excursion which are related to the school
curriculum.

130
Holiday Programmes
Children and young people are experiencing greater vulnerability during school holidays
because in most cases parents are employed and they are left unattended. During this
period children, especially in impoverished communities have little or no recreational
space where they can give expression to their need for positive socialisation and
interaction with their peers. This in itself places them at risk of being drawn into negative
activities such as criminality, increase in substance abuse and inappropriate sexual
behaviour. It has been proven over time that where children and young people find them
to be occupied with positive interaction, the issues listed above is mitigated and therefore
reduces the risk of being influenced negatively. Holiday programmes are implemented in
order to create a safe space for children during school holidays. Partnerships were formed
with various NGOs to implement these programmes which included educational Tours, life
skills training; leadership camps and arts and culture activities.
Victim Empowerment Programmes
Victim empowerment is an approach to facilitate access to a range of services for all
people who have individually or collectively suffered harm, trauma or material loss due to
violence, crime, natural disaster human accident or through socio-economic conditions. It
aims to restore the loss or damages. Victim empowerment programmes focus taking
control, having a voice, being heard, be recognized and respected as an individual. These
initiatives focus on empowering people but especially, women and children with
information and skills. Through these types of programmes they learn to understand and
mange emotions, set and achieve positive goals feel and show empathy for other. It also
teaches them to establish and maintain positive relationships and make responsible
decisions. These programmes are implemented in partnership with Government
Departments, B-Municipalities, SAPS, NGO’s CBO’s and Farm Watches.

131
Substance Abuse
Fetal Alcohol Syndrome
A Pregnant Women Mentorship programme is implemented in partnership with FASFacts.
The objective of the programme is to prevent the increase of FAS by assisting girls and
adult women making the decision not to drink any alcohol when they will be pregnant, or
when they plan to become pregnant. The Mentors are responsible for ensuring that the
pregnant women abstain from alcohol during pregnancy and breastfeeding period. They
are also providing support for the family during this period. International Foetal Alcohol is
annually observed on 09 September. The municipality in partnership with stakeholders
take a stand to recognize and raise awareness about the dangers of drinking during
pregnancy and the plight of individuals and families affected with Foetal Alcohol
Syndrome (FAS) and Foetal Alcohol Spectrum Disorders (FASD).
Substance Abuse Awareness
“As die Dopskop” and “Draailkolk” are dvd’s which the municipality has produced in order
to raise awareness on substance abuse and family violence. Awareness and rehabilitation
programmes are implemented with various stakeholders and treatment centres. The
purpose of these programmes are to enhance safe communities, crime prevention and
healthy life style promotion. Mock court sessions and visits to Youth Centres of
Department of Correctional Services forms part of the awareness and prevention
programmes. Family support programmes are implemented in partnership with
Department of Social Development and treatment centres.
HIV/AIDS
HIV and AIDS impact on the sustainability of communities and their development conditions.
The implementations of interventions are crucial in ensuring that the vulnerability of infected
and affected persons are increased. The interventions namely HIV/Aids awareness
campaigns, World Aids day, HIV/Aids &Male circumcision; HIV & breastfeeding and 16 Days
of Activism against the Abuse of Women and Children are implemented in partnership with
the Multi Sectoral Action Team (MSAT) structures in each B-Municipal area. These
programmes focus on reversing the effects of the HIV/AIDS pandemic and support to infected
and affected families in the district. Educational items were provided for children living with
HIV/AIDS ECD programme. The Ithemba Fun walk is implemented annually in partnership
with Department of Education to raise awareness on HIV/AIDS amongst primary schools.

132
Women
Women month’s programmes are implemented in partnership with various stakeholders
during August. These programmes focus on empowerment of women and raise awareness
on issues of Gender Based Violence. The partners included the Worcester Thuthuzela Care
Centre, Department of Social Development, Legal Aids South Africa-Worcester;
ACVV,FAMSA, BADISA,SAPS and the Women’s Network. Material support is provided to
survivors of sexual offences through the Thuthuzela Care Centre and SAPS.
Youth
Youth Development initiatives are crucial for the economy and the prevention of social crimes.
The municipality implement Youth Dialogues; Life Skills Camps; Young People @ Work
Workshops; Media Training Workshops for unemployed youth in partnership with Government
Departments; Koinonia; B-Municipalities and Civil society organisations. These programmes
are implemented to address issues that are affecting youth. Activities like career exhibitions,
honouring of the Grade 12 Top Achievers awards, Matric Motivation programmes and Spring
school programmes are supported in order to enhance opportunities for Grade 11 and 12
Learners. Youth month initiatives are implemented to raise awareness on available skills
training, employment and SMME development opportunities.
Skills Training
Skills development is identified as one of the priority needs for sustainable development in
rural communities within the Cape Winelands District Municipality. Violence, social isolation
and low education levels makes young unemployed women more vulnerable and increases
their risks of sexual exploitation. Economic empowerment opportunities reduces conditions of
vulnerability and improve the resilience of young women. Young people and women are the
important focus and a priority because the lack of skills development contributes to increasing
unemployment rate amongst them in rural areas. Skills development programmes enhance
the employability and SMME development amongst women and youth. The Skills
development programme also formed part of the EPWP programmes of the Municipality.
Trainees receive a stipend for the duration of the training. The municipality identify training
needs in partnership with B-municipalities, Department of Social Development and
NGOs and rotate amongst the B-municipal areas each year.
133
SPORT, RECREATION AND CULTURAL PROGRAMMES
Sports Statistics have shown that sport and recreation participation plays a big role in the
decrease of the crime rate and crime activity in communities who regularly participate in sport
and recreation. Community based mass participation recreation, cultural and sports
development programmes focus more non-competitive fun rather than competitive sport so as
to create and build social cohesion among youth and in communities. The objectives of these
programmes are to promote social development, youth empowerment, social cohesion and
community upliftment. Sports, recreational and cultural programmes provide opportunities for
vulnerable groups to participate in mass participation programmes. It allow children, families,
senior citizens, disabled, men and women to participate in and attend numerous events that
would have otherwise been denied.The Cape Winelands Sports Awards; Freedom Run;
Rieldans regional competitions; Business Against Crime Tournaments; co-hosting of FNB Cup
for Secondary Schools; Sports Derby’s, Arts Cape Rural Outreach Programme; Heritage Day
programmes; Cape Winelands Dominoes Tournament and Cape Winelands Drama Festival
are some of the key programmes that were implement. A call for proposals is advertised
annually and funding is provided to approved organisations to host mass participation Sports
and Culture events or to purchase equipment.
5.3 STRATEGIC OBJECTIVE 2
TECHNICAL SERVICES
PRE-DETERMINE OBJECTIVE 2.1: Promoting sustainable infrastructure services and
transport system which fosters social and economic opportunities.
Maintenance of proclaimed roads:
The first objective is to comply with the administrative and financial conditions of the Western
Cape Government roads agency function agreement.
Cape Winelands District Municipality does not have ownership of any of the public roads in its
area. Proclaimed National Roads are managed by the SANRAL (South African Roads Agency
for the National Department), Provincial proclaimed Roads are owned by the Western Cape
Provincial Government (Department of Transport and Public Works) and municipal streets by
the different Local Authorities.

134
A service delivery (MOA: memorandum of agreement) and financial level agreement exists
between the Cape Winelands District Municipality (CWDM) and The Western Cape Provincial
Government, Department of Transport and Public Works. The emphasis of the MOA is on
provincial road maintenance activities performed by CWDM in conjunction with the Provincial
Paarl Regional Office. (88% of the road network in CWDM jurisdiction area are maintained
by CWDM and the remaining 16% by Provincial Paarl Regional Office making use of their own
staff and maintenance contracts.)
Other functions that are also performed under the MOA include:
Delegated management duties;
Preparation of technical reports regarding land use application received from local B
municipalities together with their Provincial Paarl Regional Office and Head Office;
Various administration duties are adhered to including dealing with the general public
(road user) regarding all road matters (e.g. road safety, road maintenance, etc.); and
Assistance with capital infrastructure improvement, example re-gravel and resealing
to complement such work performed by provincial contracts. The main objective is
to encourage technical skills transfer relating to road maintenance and upgrading
activities.
The planning, funding and provision of new provincial road infrastructure or major upgrading
and rehabilitation contracts are the function of the Provincial Roads Authority. A Provincial
Pavement Management System is used by the Provincial Government to manage the
technical requirements of their road network.
Although the main, high volume provincial road network in the Western Cape appears to be
well maintained, funding shortages and maintenance backlogs are a concern as it is critical
to always maintain a high level of service. Of great concern to the CWDM is the poor
condition and lack of maintenance relating to the provincial low order minor gravel road
network as this is affecting the social and economic opportunities in the CWDM region. The
second objective therefore for CWDM is to facilitate with the different role players a process
to start attending to the maintenance and upgrading needs of the provincial minor roads in the
CWDM taking into account the following:
Current legislation stipulates that the Road Authority shall only be responsible for all
construction and maintenance costs relating to trunk, main and divisional roads (not

135
minor roads) and that any construction and maintenance costs (whole or a percentage)
relating to any proclaimed minor roads can be recovered from the owners of properties
that benefitted from a minor road;
To understand the current legislation’s requirements relating to minor roads, it is
important to understand their establishment history during the 1950’s when trek paths
went through a process (as described in the then Divisional Council Ordinance, 1952)
to be privatised or to be proclaimed as public minor roads or public paths during the time
when the Divisional Councils were the Road Authorities and received an income from
rural property tax. This income was suspended when Divisional Councils were replaced
with Regional Services Councils and Road Authority status changed to the Western
Cape Government, Department of Transport and Public Works;
Finalising the process involved for property owners to obtain written permission from the
Western Cape Government, Department of Transport and Public Works to perform such
activities on their minor road network; and
Requesting the Road Authority to revisit their current approved geometric standards
where lower traffic volumes are involved to ensure the lowest financial implications for
the property owners funding any minor road upgrading.
PRE-DETERMINE OBJECTIVE 2.2: To implement sustainable infrastructure services
Waste management
Council has developed an Integrated Waste Management Plan (IWMP) for the district as a
whole and has also assisted some municipalities in the compilation of their IWMP. This
integrated strategic document gives a holistic view of waste management processes in the
district. Through this, management issues of a district nature can be identified, investigated
and implemented.
Waste management in the local municipalities are generally well done insofar as the collection
of domestic municipal waste is concerned with waste collection provided for the vast majority
of urban residents. However, the management of waste disposal is generally poor. Waste
avoidance is not significantly practiced anywhere in the district except for at certain private
enterprises. Reference must be made that certain municipalities within the district do use a

136
clear bag system to enhance separation at source and improve recycling. Waste avoidance
will only be achieved through the implementation of public awareness campaigns.
Waste Recovery of any significance is only done at the Materials Recovery Facilities (MRFs)
at Paarl and Touws River. Scavenging takes place at a number of the waste disposal sites in
the area, contributing to operational difficulties. It is recommended that MRF’s be constructed
in all larger towns with populations larger than 50 000.
Composting is done successfully near Stellenbosch, Klapmuts and Robertson and should be
extended to all larger towns in the district.
The Stellenbosch area and in a lesser extent the Witzenberg and Langeberg areas are in
critical need for landfill airspace. A Service Provider has been appointed for the identification
and licensing of regional landfill sites in the Cape Winelands District Municipality’s area. One
site has been identified and a license was issued. Appeals against the license were lodged
and the appeals were rejected after being assessed by the MEC.
Planning of services
Municipalities sometimes find it difficult to make provision for planning projects in their budgets
due to financial constraints and the public pressures of delivering services. The Cape
Winelands District Municipality has over the years engaged in supporting municipalities in this
regard by completing master planning projects for water and sanitation, storm water and
pavement management systems. Access to these master plans, allows municipalities the
opportunity to invest in the most critical elements of these services and thereby making the
investment sustainable and effective.
PRE-DETERMINE OBJECTIVE 2.3: To increase levels of mobility in the whole of the
CWDM area
Section 84 of the Local Government: Municipal Structures Act, Act 117 of 1998, lists the
function “Regulation of Passenger Transport Services” as a district municipal competency.
The Cape Winelands structured their administration such that the Sub-Directorate Public
Transport Planning and Regulation would be responsible for the administration of this function.

137
The Act however does not offer a definition for “regulation” neither “passenger transport
services”. The word “regulate” is defined in the Shorter Oxford Dictionary as “to bring into
conformity with a rule, principle or usage”.
In terms of the Constitution of the Republic of South Africa, Act 108 of 1996, section 156 and
Part B of Schedule 4, a Municipality has executive authority in respect of “Municipal Public
Transport”.
Section 155 of the Constitution, Establishment of municipalities, lists the three Categories of
municipalities being Categories A, B and C. Thus all municipalities have the responsibility of
“Municipal Public Transport”.
The National Land Transport Act (NLTA), 2009 (Act No 5 of 2009), was promulgated on 27th
November 2009, thus repealing in full the previous Act, namely, the National Land Transport
Transition Act, 2000 (Act 22 of 2000. Chapter 2 of Act 5 of 2009) addresses the institutional
arrangements for land transport and the responsibilities of the three spheres of Government
are listed in Section 11. Section 11(1) c (i to xxviii), addresses the responsibilities of the
municipal sphere of government. The National Land Transport Act (NLTA) defines
“municipality” as including all types of municipalities contemplated in section 155 of the
Constitution, thus Metropolitan (category A) municipality, District Municipality (category C) and
Local Municipality (category B).
Based on the definition of the word “regulate” in the Shorter Oxford Dictionary, it is possible
that the functions listed under section 11(1) c xviii to xxvii of the NLTA could possibly fall within
the ambient of this definition.
A determination of the function should therefore be done to establish the responsibilities of the
District Municipality now that the NLTA is quite explicit in defining the role Local Government
in Section 11 of such Act.
An avenue to be followed is to involve SALGA in such an endeavour. The MEC could also be
prompted as follows – Section 85(1) of the Local Government : Municipal Structures Act, Act
117 of 1998, provides that the MEC for local government may adjust the division of functions
and powers between District – and Local Municipalities by allocating powers vested in a Local
Municipality to the District Municipality or vice versa, excluding certain powers. The power to
regulate passenger transport services is not excluded, so an adjustment may take place. The
MEC may so allocate functions only if the municipality in which the power is vested lacks the

138
capacity to perform it and the MEC has consulted the Municipal Demarcation Board (MDB),
which must have assessed the capacity of the municipality concerned.
Supportive Statutory and Non-statutory Plan
District Integrated Transport Plan (DITP)
Cape Winelands District Municipality has developed the District Integrated Transport Plan D
(ITP) and submitted and approved by the MEC on 10 October 2016.
In the process of drafting the District Integrated Transport Plan, an assessment of the current
status of Public Transport in the district as a whole has been recorded as well as stating a
long term vision (5-20 year) for public transport in the Cape Winelands DM.
Transport of patients especially from rural areas remains a challenge where urgent attention
should be given by all relevant role-players. The same applies to sheltering those patients
while waiting at Health Care facilities after hours. The development and eventual
implementation of Integrated Public Transport Networks will address most public transport
needs of the captive rural communities.
However, the CWDM is currently developing an Integrated Public Transport Network based
on an incremental implementation approach for the Drakenstein Municipal area whereafter a
similar approach will be followed for Breede Valley, Langeberg and Witzenberg. The big
challenge lies in sourcing the required level of funding for the incremental implementation
approach as well as securing a minimum level of staffing required to manage the Integrated
Public Transport Network.

139
KEY INTERVENTIONS PLANNED
A. Transportation Precinct Plan for the Tulbagh CBD’s
The key components guiding the investigation listed below:
• Non-motorised transport network (NMT)
Develop a non-motorised transport network for the Tulbagh CBD’s that includes a focus
on cyclists, pedestrians, physically impaired and disabled persons. The development of
the network should take into consideration pedestrian hazardous locations, key attractors
and generators, transportation infrastructure, tourism and public space environments.
Apart from providing NMT connectivity between various land uses, the focus of this
network should also be to provide NMT users with a priority NMT network that provides
for safe and convenient movement in an attractive environment.
• Parking Management Strategy
Develop a parking management strategy for the Tulbagh CBD’s that focuses on the best
location for parking areas, identify areas for paid and free parking and maximise the
availability of parking.
B. Safer Journeys to Schools Strategy
The implementation of this strategy is currently two-fold -
B1 Development of educational material
Distribution of road safety themed brochures, posters, colouring books and learner back-
packs developed by the CWDM duly assisted by the Law Enforcement units of the Local
Municipalities and the Western Cape Government. The major thrust of this intervention is
to improve the visibility of learners walking to their respective schools.
B2 Upgrading Public Transport Facilities at rural and urban schools
The construction of sidewalks, bus embayments and upgraded access off the road
network to the respective schools.

140
C. Development of an Integrated Public Transport Network for Drakenstein Local
Municipality
Phases of IPTN development
The following phased approach to the development of the IPTN is envisaged:
• Phase 0: Development of the IPTN Framework – COMPLETED;
• Phase 1: Initial Detailed Planning Activities;
• Phase 2: Industry Negotiations and Business Plan;
• Phase 3: Detailed Design and Development of Specifications and Tender
Documentation; and,
• Phase 4: Procurement and Implementation.
Guiding Principles
The Framework was developed in accordance to the requirements and guidelines that
were available at time of writing, amongst others;
• National Land Transport Act, 5 of 2009;
• National Public Transport Strategy and Action Plan 2006/7;
• Rural Transport Strategy, 2007;
• Urban and Rural Development Strategies; and
• NDoT Guidelines and Requirements: Public Transport Infrastructure and Systems
Grant, 2011-12.
However, the CWDM is not convinced that the current IPTN or IRPTN model, which is
being implemented in other areas of South Africa, is in any way sustainable, affordable,
or financially viable especially when applied to a predominantly rural area or district. It is
thus a specific requirement that the successful tenderer must demonstrate their ability to
be innovative and progressive in the concept of public transport network and services
planning.
D. Improved traffic- and pedestrian safety
Investigate the improvements required to raise the level of service at two pre-determined
intersections in Worcester for traffic and pedestrian movements.

141
Construction of sidewalk in Robertson (Nkqubela) and between Mbekweni and
Daljosaphat industrial area.
PRE-DETERMINE OBJECTIVE 2.4: To improve infrastructure services for rural dwellers
A vital aspect of the function of CWDM is the provision of high-level basic services and the
infrastructure that can underpin economic and social development in the region. Below we
analyse the situation with regards to various services:
Water and Sanitation
The responsibility to eradicate the water and sanitation backlogs is the responsibility
of the Water Service Authorities supported by the DW&S and the national water and
sanitation task team. In the case of the CWDM, the Water Services Authorities are
the B-Municipalities.
The responsibility of the CWDM is to ensure that proper planning is done and to co-
ordinate and oversee these processes and make sure that capacity exists within the
B-Municipalities to ensure effective delivery. It is estimated that the amount needed
to eradicate the existing bulk and internal backlogs in the district is in excess of R 1.2
billion. Careful technical planning and financial management will need to be employed
to eradicate these backlogs.
This Council assists rural schools in upgrading and/or improving the potable water
supply and sanitation facilities at the schools. In some cases, the toilet facilities are
extended to cater for additional learners while water storage facilities and purification
of water is regularly attended too.
Electricity
In most instances electricity in the rural areas are provided by ESKOM. Although the
grid is comprehensive, it does not cover all areas. This Council has a subsidy scheme
for the provision of solar lighting systems as well as solar hot water systems. The
installation of these systems in rural dwellings improves the living conditions of poor
rural dwellers tremendously and also contributes to the use of renewable energies.
Rural sport facilities
There is a dire need for the upgrading of existing and/or the development of sport
facilities in the rural areas. Partnerships with Land Owners, Sport Organisations and

142
the Department of Sport and Culture will be fostered in the provision of these facilities.
Recently various tennis/netball courts, rugby fields, clubhouses and flood lights at
sport fields were completed.
143
5.4 STRATEGIC OBJECTIVE 3
FINANCIAL AND STRATEGIC SUPPORT SERVICES
To provide effective and efficient financial and strategic support service to the Cape Winelands
District.
PRE-DETERMINE OBJECTIVE .3.1: To facilitate and enhance sound financial support
services
LONG TERM FINANCIAL PLAN (LTFP)
The municipality will embark on a process to develop a long term financial plan which is in
accordance with the Municipal Budget and Reporting Regulations (Section 7). The financial
plan will be funded by Provincial Government Western Cape.
The LTFP is a financial framework that combines and integrates financial strategies to achieve
the main objective of the financial viability of the municipality. i.e. the ability of the municipality
to meet the current and future service delivery needs of the community whilst remaining
financial sustainable on the long term.
The development of the LTFP is an output of financial and other strategies and aims to identify
financial imbalances or opportunities and to develop strategies to counteract the imbalances.
Furthermore the financial plan assist the municipality to effectively manage the financial
position of the municipality in accordance with the Integrated Development Plan (IDP) and
secure sound and sustainable management of its financial affairs of the Local Government:
Municipal Finance Management Act, 2003 (Act No. 56 of 2003) (MFMA). Furthermore, it
provides for democratic, accountable and effective governance of finances.
1) Financial overview
The envisaged long-term financial plan will provide strategic direction and support the
objectives of the Municipality. In addition, it includes a 10-year plan linked to business plans
for delivery over the medium term. The aim thereof is to realise government grants and private
finance to accomplish budgeting in a viable, sustainable and credible manner and
simultaneously compile the three-year budget as per MFMA requirements.
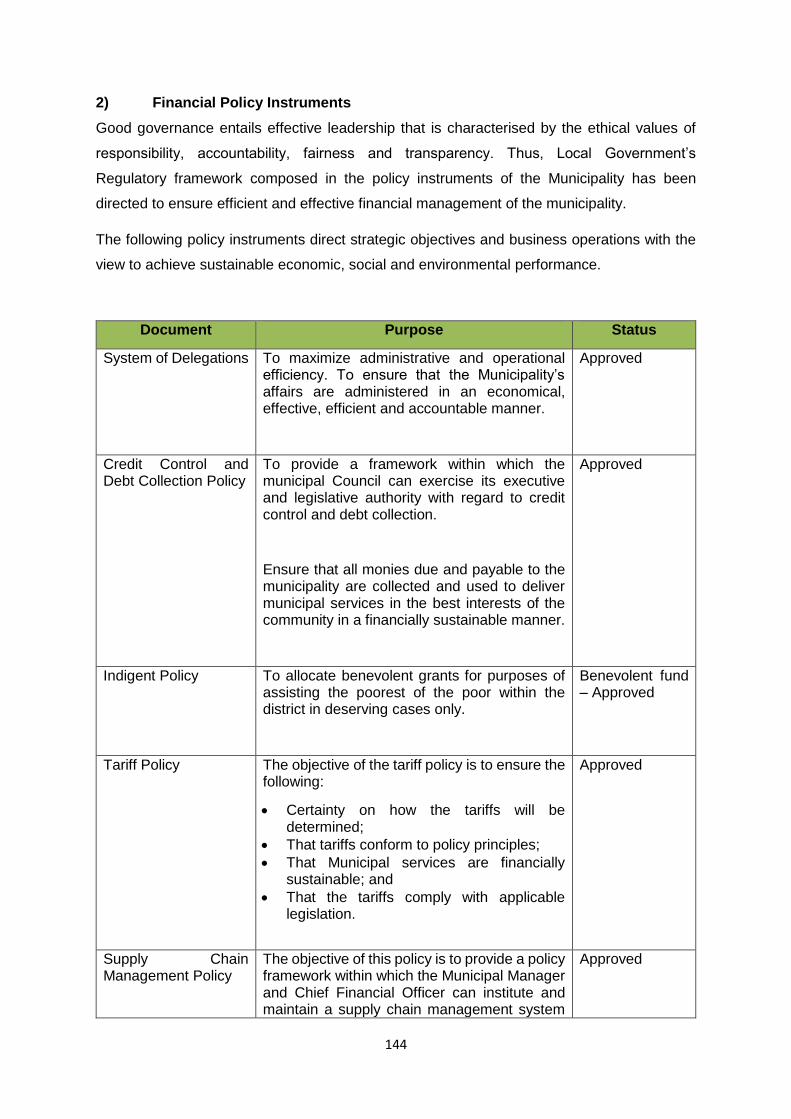
144
2) Financial Policy Instruments
Good governance entails effective leadership that is characterised by the ethical values of
responsibility, accountability, fairness and transparency. Thus, Local Government’s
Regulatory framework composed in the policy instruments of the Municipality has been
directed to ensure efficient and effective financial management of the municipality.
The following policy instruments direct strategic objectives and business operations with the
view to achieve sustainable economic, social and environmental performance.
Document Purpose Status
System of Delegations To maximize administrative and operational efficiency. To ensure that the Municipality’s affairs are administered in an economical, effective, efficient and accountable manner.
Approved
Credit Control and Debt Collection Policy
To provide a framework within which the municipal Council can exercise its executive and legislative authority with regard to credit control and debt collection.
Ensure that all monies due and payable to the municipality are collected and used to deliver municipal services in the best interests of the community in a financially sustainable manner.
Approved
Indigent Policy To allocate benevolent grants for purposes of assisting the poorest of the poor within the district in deserving cases only.
Benevolent fund – Approved
Tariff Policy The objective of the tariff policy is to ensure the following:
Certainty on how the tariffs will be determined;
That tariffs conform to policy principles;
That Municipal services are financially sustainable; and
That the tariffs comply with applicable legislation.
Approved
Supply Chain Management Policy
The objective of this policy is to provide a policy framework within which the Municipal Manager and Chief Financial Officer can institute and maintain a supply chain management system
Approved
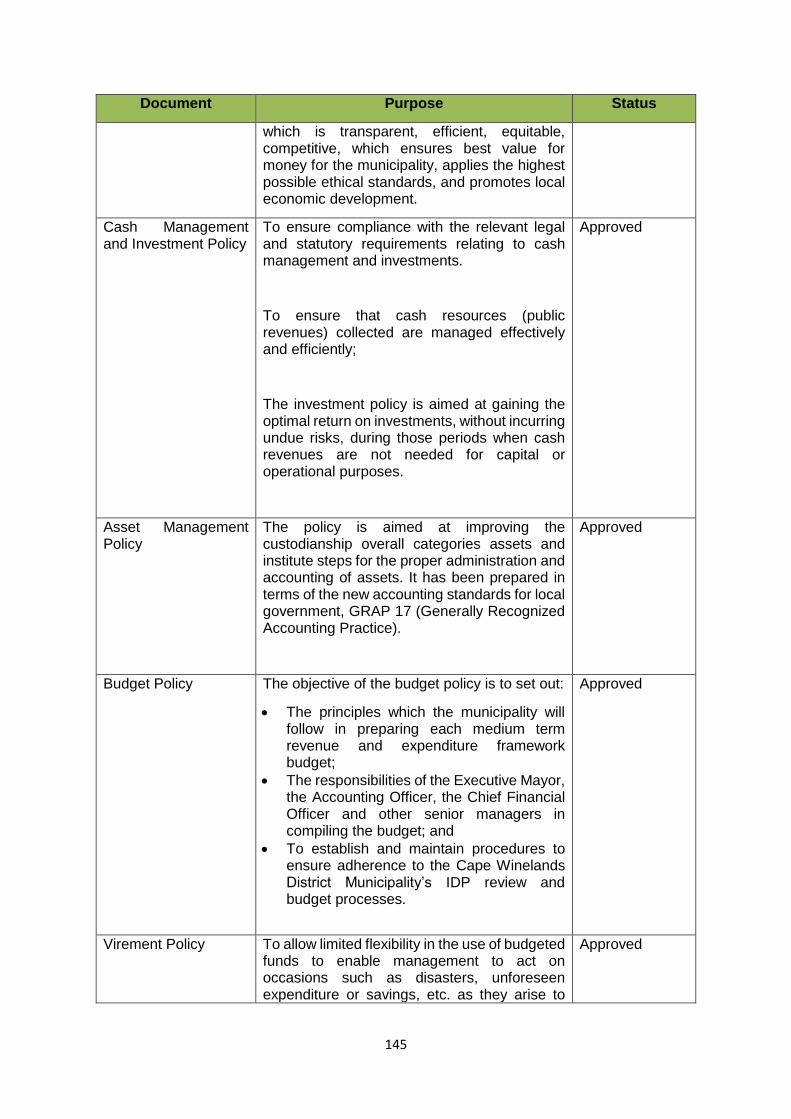
145
Document Purpose Status
which is transparent, efficient, equitable, competitive, which ensures best value for money for the municipality, applies the highest possible ethical standards, and promotes local economic development.
Cash Management and Investment Policy
To ensure compliance with the relevant legal and statutory requirements relating to cash management and investments.
To ensure that cash resources (public revenues) collected are managed effectively and efficiently;
The investment policy is aimed at gaining the optimal return on investments, without incurring undue risks, during those periods when cash revenues are not needed for capital or operational purposes.
Approved
Asset Management Policy
The policy is aimed at improving the custodianship overall categories assets and institute steps for the proper administration and accounting of assets. It has been prepared in terms of the new accounting standards for local government, GRAP 17 (Generally Recognized Accounting Practice).
Approved
Budget Policy The objective of the budget policy is to set out:
The principles which the municipality will follow in preparing each medium term revenue and expenditure framework budget;
The responsibilities of the Executive Mayor, the Accounting Officer, the Chief Financial Officer and other senior managers in compiling the budget; and
To establish and maintain procedures to ensure adherence to the Cape Winelands District Municipality’s IDP review and budget processes.
Approved
Virement Policy To allow limited flexibility in the use of budgeted funds to enable management to act on occasions such as disasters, unforeseen expenditure or savings, etc. as they arise to
Approved

146
Document Purpose Status
accelerate service delivery in a financially responsible manner.
Funding and Reserves Policy
The policy intends to set out the assumptions and methodology for estimating the following:
Projected billings, collections and all direct revenues;
The provision for revenue that will not be collected;
The funds the municipality can expect to receive from investments;
The proceeds the municipality can expect to receive from the transfer or disposal of assets;
The municipality’s borrowing requirements; and
The funds to be set aside in reserves.
Approved
Accounting Policy To ensure that the Annual Financial Statements fairly present the state of affairs of the municipality and the results of its operations and cash flows.
To ensure that the Annual Financial Statements are prepared in accordance with South African Statements of generally Recognised Accounting Practice (GRAP) including any interpretations, guidelines and directives issued by the Accounting Standards Board.
Approved
5.) Strategy
The financial strategy is an integral component of the IDP with the following key elements,
contributing to a successful strategy:
The optimal use of available resources;
The maximum of revenue; and
The sustainable delivery of services.

147
The Municipality’s key financial strategies are illustrated in the table below:
Strategy Description
Revenue Management Strategy
To collect all Government Grants and Subsidies as published in the Annual Division of Revenue Act
To ensure optimal billing for services rendered and cash collection
To ensure effective credit control and debt collection
Maintain realistic tariff structuring to allow full cost recovery
Expenditure Management Strategy
Effective follow up of outstanding commitments
To ensure the approval, authorisation, withdrawal and payment of funds
Budget process strategy Credible budget to minimise under spending, unauthorised expenditure and virements.
Align adjustments budget to the Service Delivery and Budget Implementation Plan
Annual Financial Statements strategy
Review of Quarterly Annual Financial Statements
GRAP application training
Optimal utilisation of financial statements reporting system
Improved monthly reconciliations of ledger accounts
Asset management strategy
Effective and efficient asset stocktakes
Updating an improved asset register
Cash management strategy
Continued cash flow management
Centralised pay-point
Capital financing strategy Maintain acceptable levels of Own Capital Reserves (CRR)
Liability management strategy
Investigate the continued affordability of future medical aid and pension fund liabilities
Pricing strategy Investigate the implementation of realistic Fire Fighting tariff structure
Strategies to enhance cost-effectiveness
Implementation of an electronic procurement system
Investigation to utilise current systems optimally - both as a financial and performance management system
148
PRE-DETERMINE OBJECTIVE 3.2: To strengthen and promote participative and
accountable governance
To provide an effective and efficient support services to the Cape Winelands District
Municipality’s departments so that the organisational objectives can be achieved through the
provision of –
• Human Resources; and
• Administrative Support Services.
INTRODUCTORY REMARKS
The lead department responsible for achieving Strategic Objective 3 is the Department:
Financial and Strategic Support Services which is the portal of entry to the Cape Winelands
District Municipality’s vision of “A Unified Cape Winelands of Excellence!” and is guided by the
following core values:
Good Governance,
Professionalism,
Integrity, Impartiality,
Quality,
Honesty,
Effectiveness,
Transparency,
Openness; and
Consistency in providing support services.
Human Resources ensures that the Cape Winelands District Municipality employs the best
and suitable qualified employees to serve our communities, within the context of relevant
legislative arrangements, policies and collective agreements, taking into account the following
values –
Respect: we value a workplace culture where people respect one another in their
interactions with co-workers and members of the public;
Integrity: we value a workplace culture where personal and professional integrity
cause us to behave in a non-partisan and ethical way and to make the best use of
the resources entrusted to us;

149
Diversity: we value a workplace where diversity in all forms is encourage and
recognised for its contribution to a more creative, rewarding, and productive force to
our broader community; and
Accountability: we value a workplace where accountability for our actions, our
interactions, the objective and wise use of resources, and responsibilities for our
successes and failures is reflected in how we conduct ourselves. We are accountable
to the citizens of the district, to our co-workers, and to our many partners in service
delivery.
Administrative Support Services provides Secretarial, Legal, Archives, Registry and
Logistical Support Services to all Departments of the Cape Winelands District Municipality.
PRE-DETERMINE OBJECTIVE 3.3: To ensure skilled and competent workforce in order
to realise organisational strategic objectives
Cape Winelands District Municipality has realized that skilling of its own workforce is key in
achieving its strategic objectives as noted in the Integrated Development Plan by developing
and building capacity of employees to perform their tasks in an effective, economic and
accountable manner and to report on monthly training, as well as the annual submission of
the Workplace Skills Plan.
Cape Winelands District Municipality’s will ensure the development of the workforce in order
to improve productivity in the workplace and the competitiveness of the employees. Cape
Winelands District Municipality (CWDM), Council and employees are fully committed to
educating, training and developing all employees within the financial muscle and resources
available by:
Development of Training and Skills Development Strategy in line with the stipulations
of the Skills Development Act, 1998 (Act No 97 of 1998), as amended and other
relevant legislation;
Introducing fair, reasonable and objective principles for education, training and
development of employees in the employment of Council;
Providing guidelines for training and development of employees in the employment
of Council.
Conduct thorough skills audits and identify gaps existing and devise strategies in
terms of the broader vision of Council;
Allocate significant training resources, within the means of Council;

150
Ensuring that people with disabilities have easy access to all learning opportunities
by removing any learning barriers; and
Putting up comprehensive education, training and development programmes that
focus on literacy, numeracy, technical competencies and management and
development programmes.
IMPROVED LABOUR RELATIONS AND INFORMED WORKFORCE
Cape Winelands District Municipality recognizes that in order for service delivery to be
maintained and improved, every employer requires labour peace, hence continuously
promotes sound and dynamic labour relations environment by facilitating an atmosphere of
collective bargaining at the workplace and employer-employee relations. In addition, to this
also to promote equal opportunities and fair treatment to all in the workplace by eliminating
unfair discrimination; and to implement affirmative action measures to redress the
disadvantages in employment experienced in the past by members from designated groups.
Employee relations at the Cape Winelands District Municipality are enhanced by continuous
interaction between management and employees through executive management road shows
at least once annually, and through publication in the internal newsletter and regular staff
circulars. Maintaining good employee relations helps reduce workplace conflict, raise
staff morale and increase overall productivity.
ORGANISATIONAL DEVELOPMENT
Organisational development within the Cape Winelands District Municipality (CWDM)
continuously focus on the increase of the District Municipality’s effectiveness and efficiency in
order to develop the CWDM to its full potential and seeking to increase effectiveness in terms
of the strategic objectives as defined in the Integrated Development Plan.
The objective of organisational development is to improve the District Municipality’s capacity
to handle its internal and external functioning and relationships, inclusive of more effective
communication, enhanced ability to cope with organisational challenges, more effective
decision-making processes, more appropriate leadership styles, improved skills and higher
levels of trust and cooperation among employees.

151
Organizational development further focuses on improving performance at individual and
organisational level and improving the District Municipality’s ability to effectively respond to
changes in its external environment, and increasing internal capabilities by ensuring the
organisational structures, human resources systems, communication systems, and
leadership/managerial processes fully harness human motivation and help employees
function to their full potential.
Cape Winelands District Municipality (CWDM) did embark on a comprehensive process to
have all posts on the approved staff establishment evaluated in terms of the TASK Job
Evaluation System. The purpose of the implementation of the TASK Job Evaluation
Systems is to:
Achieve uniform norms and standards in the description of similar posts and their
grading;
Provide for the necessary structures, institutional arrangements and procedures for the
evaluation of posts at the Cape Winelands District Municipality;
Ensure that a single job evaluation system is implemented;
Monitor adequate implementation of the TASK Job Evaluation System in order to
achieve uniform remuneration within the Cape Winelands District Municipality;
Provide guidelines for job evaluation at the Cape Winelands District Municipality; and
Ensure that objective job descriptions are compiled for all posts on the approved staff
establishment of the Cape Winelands District Municipality which will be to the advantage
of both the employer and the employees.
Implementation of the TASK grading outcomes were affected with effect from
01 November 2014 on acceptance of the Final Outcomes Report by the Municipal Manager.

152
6. ORGANISATIONAL PERFORMANCE TARGETS (PER STRATEGIC OBJECTIVE)
CAPE WINELANDS DISTRICT MUNICIPALITY – STRATEGIC OBJECTIVES:
Office of the Municipal Manager:
Strategic Support to the organisation to achieve the objectives as set out in the Integrated Development Plan through:
A well-defined and operational IDP Unit;
A well-defined and operational Performance Management Unit;
A well-defined and operational Risk Management Unit;
A well-defined and operational Internal Audit Unit; and
A well-defined and operational Communication Unit.
NO. STRATEGIC OBJECTIVES
S0 1 To create an environment and forge partnerships that ensures the health, safety, social and economic development of all communities including the empowerment of the poor in the Cape Winelands District through economic, environmental and social infrastructure investment.
SO 2 Promoting sustainable infrastructure services and a transport system which fosters social and economic opportunities.
SO 3 To provide an effective and efficient financial and strategic support services to the Cape Winelands District Municipality.

153
STRATEGIC OBJECTIVE 1 – To create an environment and forge partnerships that ensures the health, safety, social and economic development of all communities including the empowerment of the poor in the Cape Winelands District through economic, environmental and social infrastructure investment.
Outcome Indicator KPI Baseline 5 Year Revised Targets
2017/18 2018/19 2019/20 2020/21 2021/22 To administer an effective ENVIRONMENTAL HEALTH MANAGEMENT SYSTEM, in order to achieve all environmental health objectives set.
1.1.1.1 Monthly Report (Sinjani report) to PGWC on all MHS matters by the 15th of every following month.
12 12 12 12 12 12
To ensure effective ENVIRONMENTAL POLLUTION CONTROL via the identification, evaluation, monitoring and prevention of the pollution of soil, water and air, in as far as it relates to health; and to institute remedial action accordance with Regulation 37 of the CWDM Municipal Health By-Law.
1.1.2.1 Number of water samples taken (Wastewater, Water milking sheds, Drinking water, Water sources, water used for recreation).
1800 1800 1800 1800 1800 1800
1.1.2.2 Annual Air Quality report to DEA in the prescribed format by 30 September of every year.
1 1 1 1 1 1
Build Institutional Capacity. 1.2.1.1 Number of Disaster Management Advisory Forum meetings
2 2 2 2 2 2
Effective planning and co-ordination of specialized firefighting services in CWDM.
1.3.1.1 One Veld Fire Season preparedness report approved by Council by 31 December 2016.
1 1 1 1 1 1
To fulfil a coordination role in terms of Town and Regional Planning within the Cape Winelands District.
1.4.1.1 Number of stakeholder consultations attended or facilitated.
4 4 4 4 4 4

154
STRATEGIC OBJECTIVE 1 – To create an environment and forge partnerships that ensures the health, safety, social and economic development of all communities including the empowerment of the poor in the Cape Winelands District through economic, environmental and social infrastructure investment.
Outcome Indicator KPI Baseline 5 Year Revised Targets
2017/18 2018/19 2019/20 2020/21 2021/22 To fulfil a coordination role in terms of Economic and Tourism Development within the Cape Winelands District.
1.4.2.2 Number of stakeholder consultations attended or facilitated.
8 8 8 8 8 8
To fulfil a coordination role in terms of Rural and Social Development within the Cape Winelands District
1.5.1.1 Number of stakeholder consultations attended or facilitated.
4 4 4 4 4 4
STRATEGIC OBJECTIVE 2 – Promoting sustainable infrastructure services and a transport system which fosters social and economic opportunities.
Outcome Indicator KPI Baseline 5 Year Revised Targets
2017/18 2018/19 2019/20 2020/21 2021/22 2.1.1 Support the maintenance of
proclaimed roads in the district on an agency basis for the provincial roads authority.
2.1.1.1 Monthly claim on production to Provincial Government (Roads Agency) By the 20th of the following month.
12 12 12 12 12 12
2.2.1 Enhance the planning of infrastructure services in the district.
2.2.1.2 Investigate the development of a regional solid waste disposal site.
1 1 1 1 1 1
2.3.1 Improved pedestrian safety at rural
2.3.1.1 Review District Integrated Transport Plan.
1 1 1 1 1 1

155
STRATEGIC OBJECTIVE 2 – Promoting sustainable infrastructure services and a transport system which fosters social and economic opportunities.
Outcome Indicator KPI Baseline 5 Year Revised Targets
2017/18 2018/19 2019/20 2020/21 2021/22 2.4.1 To improve infrastructure
services for rural dwellers throughout the area of the Cape Winelands District Municipality.
2.4.1.1 % of project budget spent on rural projects. (Clearing road reserves, provision of water & sanitation to schools, renewable infrastructure and upgrade rural sport facilities)
95% of annual target
95% of annual target
95% of annual target
95% of annual target
95% of annual target
95% of annual target
2.5.1 Improving ITC support 2.5.1.1 Quarterly ICT Reports to Mayoral Committee
4 4 4 4 4 4
STRATEGIC OBJECTIVE 3 – To provide effective and efficient financial and strategic support services to the Cape Winelands District Municipality.
Outcome Indicator KPI Baseline 5 Year Revised Targets
2012/13 2013/14 2014/15 2015/16 2016/17 Credible Budget 3.1.1.1 Compilation of the
budget. End May End May End May End May End May End May
Transparent and accountable reporting to all stakeholders
3.1.2.1 Compilation of Quarterly Section 52 reports to Council (Including Performance Reports)
4 4 4 4 4 4
Effective systems, procedures and internal control of expenditure and revenue.
3.1.3.1 Monthly Creditor and Debtor age analysis.(Section 71 reports) to Executive Mayor
12 12 12 12 12 12
Fair, Equitable, Transparent, Competitive and cost-effective SCM Policy and Regulatory Framework.
3.1.4.1 Effective Supply Chain Management.
Less than 5%
successful appeals
Less than 5% successful appeals
Less than 5% successful appeals
Less than 5% successful appeals
Less than 5% successful appeals
Less than 5% successful appeals

156
STRATEGIC OBJECTIVE 3 – To provide effective and efficient financial and strategic support services to the Cape Winelands District Municipality.
Outcome Indicator KPI Baseline 5 Year Revised Targets
2012/13 2013/14 2014/15 2015/16 2016/17 To ensure well functional statutory and other committees.
3.2.1.1 Number of council and mayoral committee meetings supported administratively (Minutes of all meetings on collaborator)
14 14 14 14 14 14
To ensure a skilled and competent workforce
3.3.1.1 Number of Workplace Skills Plan Submissions to the LGSETA
1 1 1 1 1 1
Improved Labour Relations and informed Workforce.
3.3.2.1 Number of Employment Equity Report submissions to the Department of Labour
1 1 1 1 1 1

157
1. To create an environment and forge partnerships that ensures the health, safety, social and economic development of all communities including the empowerment of the poor in the Cape Winelands District through economic, environmental and social infrastructure investment
R 146 204 724.00
1.1 Provide a comprehensive and equitable Municipal health Service including Air Quality Management throughout the CWDM.
R 42 658 277
1.2 Ensure coordination of multi-disciplinary and sectoral disaster risk reduction through integrated institutional capacity for Disaster Risk management, Disaster Risk Assessment and Response and Recovery
R 5 952 946
1.3 Effective planning and coordination of specialized fire-fighting services throughout the CWDM
R55 197 960
1.4 To facilitate environmentally sustainable economic development planning through the development and maintenance of strategic partnerships, investment attraction, retention and opportunities, SMME support and development, skills development and information knowledgement.
R 25 869 539
1.5 To facilitate, ensure and monitor the development and empowerment of the poor by graduating people out of poverty, social inclusion and improving the livelihood of the poor, vulnerable groups, rural farm dwellers and rural communities.
R 16 526 002
2. Promoting sustainable infrastructure services and a transport system which
R 169 526 774.00
2.1 To comply with the administrative and financial conditions of the Western Cape Government roads agency function agreement.
R 119 289 843
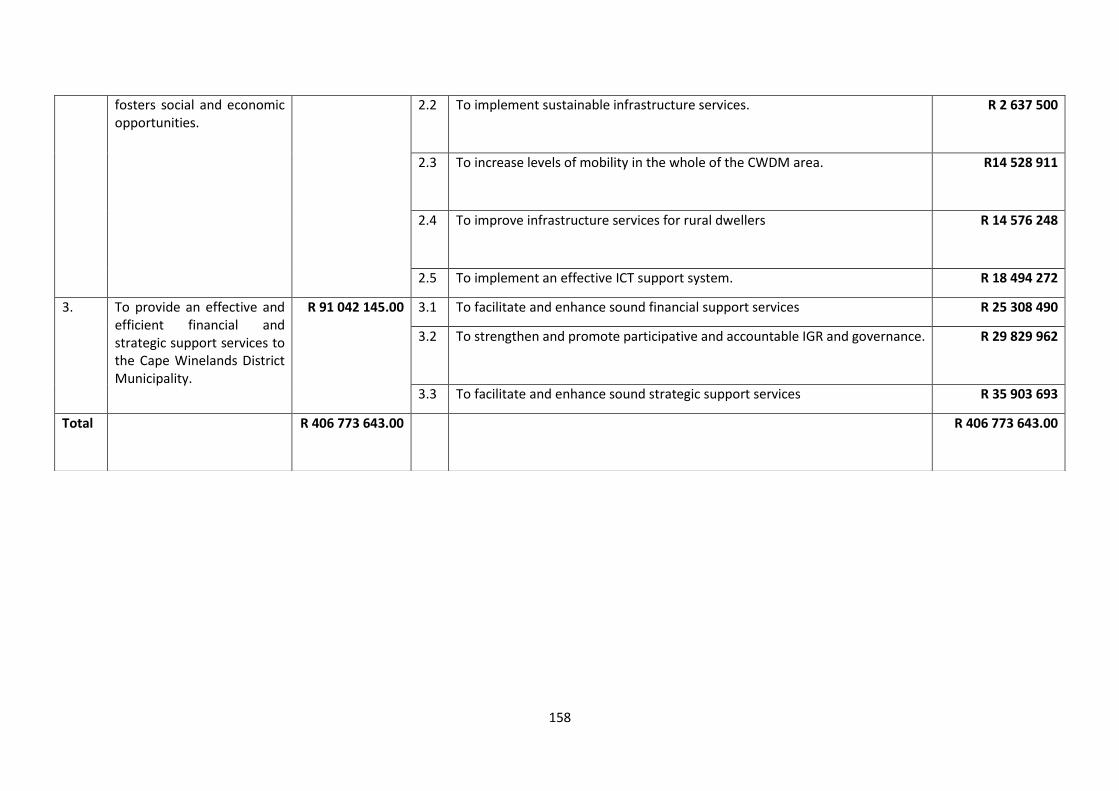
158
fosters social and economic opportunities.
2.2 To implement sustainable infrastructure services. R 2 637 500
2.3 To increase levels of mobility in the whole of the CWDM area. R14 528 911
2.4 To improve infrastructure services for rural dwellers R 14 576 248
2.5 To implement an effective ICT support system. R 18 494 272
3. To provide an effective and efficient financial and strategic support services to the Cape Winelands District Municipality.
R 91 042 145.00
3.1 To facilitate and enhance sound financial support services R 25 308 490
3.2 To strengthen and promote participative and accountable IGR and governance. R 29 829 962
3.3 To facilitate and enhance sound strategic support services R 35 903 693
Total R 406 773 643.00 R 406 773 643.00

159
CHAPTER 7: INSTITUTIONAL/GOVERNANCE FRAMEWORK
The Cape Winelands District Municipality is an organ of state within the local sphere of
government exercising legislative and executive authority within its area of jurisdiction as
specified by the Local Government: Municipal Structures Act No. 117 of 1998. It consists of
the political segment, an administrative component and the community.
7.11 POLITICAL SEGMENT
The political structure and composition is based on the Executive Mayoral Committee (MayCo)
system.
The Mayoral Committee reports to the Municipal Council whose duties are defined so as to
ensure proper decision making and appropriate allocation of funds. The Council must adhere
to the Protocol of Corporate Governance in the Public Sector (1997) and a host of relevant
legislation.
Council has the following decision making structures:

160
Municipal Council

161
Cape Winelands District Mayoral Committee
Executive Mayor: Dr H Von Schlicht (Front row middle) Deputy Executive Mayor: Cllr. D Swart Portfolio:Rural and Social Development (Front row left) Back row from left to right: Cllr. P.C. Ramokhabi – Portfolio: Strategic Support Services Cllr. L.W. Niehaus – Portfolio: Fire Services, Disaster Management and Environmental Health Cllr. G.J. Carinus – Portfolio: Technical Services Cllr. J.J. Du Plessis – Portfolio: Local Economic Development Cllr. J.D.F. Van Zyl – Portfolio: Financial Services Cllr. A. Florence – Portfolio: Tourism and Sport Municipal Manager: Mr Mike Mgajo (Front row right)

162
Governance Structure
Leadership by the Governing Body (Corporate Governance)
The King IV Report on Corporate Governance, launched on 1 November 2016, contain the
philosophy, principles and leading practices for corporate governance in South Africa. The
overarching objective of King IV is to make corporate governance more accessible and
relevant, and to be the catalyst for a shift from a compliance-based mindset to one that sees
corporate governance as a lever for value creation. Much emphasis is placed on integrated
reporting and integrated thinking.
King IV has taken the decisive step to focusing on outcomes as a way of driving acceptance
of corporate governance as integral to value creation by organisations characterised by an
ethical culture, good performance, effective control and legitimacy. Linking governance to
outcomes should therefore result in organisations practising quality governance.
Governance Structure
Section 79 Committees
Statutory Committees
Municipal Public Accounts Committee (MPAC)
With Councillors
Rules Committee
Local Labour Forum;
Training Committee;
Annual Performance Evaluation Panel;
Budget Steering Committee;
Special Committee to investigate and make findings on any alleged breach of the Code of Conduct for Councillors.
Without Councillors
Audit Committee; With officials only
Bid Specification Committee;
Bid Evaluation Committee;
Bid Adjudication Committee;
Health and Safety Committees.

163
Composition of Council
Political Party Number of seats
Democratic Alliance 27
African National Congress 11
Economic Freedom Fighters 2
Breedevallei Onafhanklik 1
7.2 ADMINISTRATIVE COMPONENT
The development priorities of the municipality as contained in the IDP cannot be achieved
without people (human resources) and therefore the effective management of human
resources makes a vital contribution to achieving these goals. The Cape Winelands District
Municipality, through its salary budget, human resource management policies, practices,
systems, etc. recognises that its employees are central in realising the vision and mission of
the organisation. There is, therefore, close alignment between the way in which the
administration is structured and resourced through its operational and salaries budget, the IDP
objectives and the performance targets of the municipality.

164
TOP ADMINISTRATIVE STRUCTURE
Executive Director:
Community Development
and Planning Services
Mr CV Schroeder
Chief Financial Officer
Financial and Strategic
Support Services
Ms FA du Raan-Groenewald
Executive Director:
Technical Services
Mr F van Eck
Municipal Manager:
Mr M Mgajo

165
7.3 ORGANISATIONAL DESIGN PROJECT
Predetermined Strategic Objective 3.2
To strengthen and promote participative and accountable governance.
To provide an effective and efficient support services to the Cape Winelands District
Municipality’s executive departments so that the organisational objectives can be achieved
through the provision of –
• Human Resources; and
• Administrative Support Services.
INTRODUCTORY REMARKS
The lead Department responsible for achieving Strategic Objective 3 is the Department:
Financial and Strategic Support Services as this Department is the portal of entry to the Cape
Winelands District Municipality’s vision of “A Unified Cape Winelands of Excellence!” and is
guided by the following core values: Good Governance, Professionalism, Integrity, Impartiality,
Quality, Honesty, Effectiveness, Transparency, Openness and Consistency in providing
support services.
Human Resources ensures that the Cape Winelands District Municipality employs the best
and suitable qualified employees to serve our communities, within the context of relevant
legislative arrangements, policies and collective agreements, taking into account the following
values -
Respect: we value a workplace culture where people respect one another in their
interactions with co-workers and members of the public.
Integrity: we value a workplace culture where personal and professional integrity cause
us to behave in a non-partisan and ethical way and to make the best use of the resources
entrusted to us.
Diversity: we value a workplace where diversity in all forms is encourage and
recognised for its contribution to a more creative, rewarding, and productive force to our
broader community.
Accountability: we value a workplace where accountability for our actions, our
interactions, the objective and wise use of resources, and responsibilities for our
successes and failures is reflected in how we conduct ourselves. We are accountable
166
to the citizens of the district, to our co-workers, and to our many partners in service
delivery.
Administrative Support Services provides Secretarial, Legal, Archives, Registry and
Logistical Support Services to all Departments of the Cape Winelands District Municipality.
Predetermined Strategic Objective 3 .3
TO ENSURE SKILLED AND COMPETENT WORKFORCE IN ORDER TO REALISE
ORGANISATIONAL STRATEGIC OBJECTIVES
Cape Winelands District Municipality has realized that skilling of its own workforce is key in
achieving its strategic objectives as enshrined in the Integrated Development Plan by
developing and building capacity of employees to perform their tasks in an effective, economic
and accountable manner and to report on monthly training, as well as the annual submission
of the Workplace Skills Plan to ensure the development of the Cape Winelands District
Municipality’s workforce in order to improve productivity in the workplace and the
competitiveness of the employees. Cape Winelands District Municipality (CWDM), Council
and employees are fully committed to educating, training and developing all employees within
the financial muscle and resources available by:
Development of Training and Skills Development Strategy in line with the stipulations
of the Skills Development Act, 1998 (Act No 97 of 1998), as amended and other
relevant legislation.
Introducing fair, reasonable and objective principles for education, training and
development of employees in the employment of Council.
Providing guidelines for training and development of employees in the employment of
Council.
Conduct thorough skills audits and identify gaps existing and devise strategies in terms
of the broader vision of Council.
Allocate significant training resources, within the means of Council.
Ensuring that people with disabilities have easy access to all learning opportunities by
removing any learning barriers.

167
Putting up comprehensive education, training and development programmes that focus
on literacy, numeracy, technical competencies and management and development
programmes.
IMPROVED LABOUR RELATIONS AND INFORMED WORKFORCE
Cape Winelands District Municipality recognizes that in order for service delivery to be
maintained and improved, every employer requires labour peace, hence continuously
promotes sound and dynamic labour relations environment by facilitating an atmosphere of
collective bargaining at the workplace and employer-employee relations and to promote equal
opportunities and fair treatment to all in the workplace by eliminating unfair discrimination; and
to implement affirmative action measures to redress the disadvantages in employment
experienced in the past by members from designated groups.
Employee relations at the Cape Winelands District Municipality are enhanced by continuous
interaction between management and employees through executive management road shows
at least once annually, an internal newsletter and regular staff circulars. Maintaining good
employee relations helps reduce workplace conflict, raise staff morale and increase overall
productivity.
ORGANISATIONAL DEVELOPMENT AND REVIEW
Organisational development within the Cape Winelands District Municipality (CWDM)
continuously focus on the increase of the District Municipality’s effectiveness and efficiency in
order to develop the CWDM to its full potential and seeking to increase effectiveness in terms
of the strategic objectives as defined in the Integrated Development Plan.
The objective of organisational development is to improve the District Municipality’s capacity
to handle its internal and external functioning and relationships, enhance the ability to cope
with organisational challenges, more effective decision-making processes, more appropriate
leadership styles, improved skills and higher levels of trust and cooperation among
employees.
Organisational development further focuses on improving performance at individual and
organisational level and improving the District Municipality’s ability to effectively respond to
changes in its external environment, and increasing internal capabilities by ensuring the

168
organisational structures, human resources systems, communication systems, and
leadership/managerial processes fully harness human motivation and help employees
function to their full potential.
To this extend the Cape Winelands District Municipality (CWDM) embarked on a
comprehensive process to have all posts on the approved staff establishment evaluated in
terms of the TASK Job Evaluation System and is currently participating in the Cape
Winelands Regional TASK Job Evaluation Committee.
In terms of Regulation 4 of the Local Government: Regulations on Appointment and
Conditions of Employment of Senior Managers stipulates, the Cape Winelands District
Municipality is currently in the process to review its staff establishment.

169
CHAPTER 8: SPATIAL BUDGET FOOTPRINT

170

171
2017/18
Total Investment: R133 759

172
2017/18
Total Investment: R147 803

173
2017/18
Total Investment: R43 632

174
2017/18
Total Investment: R23 884
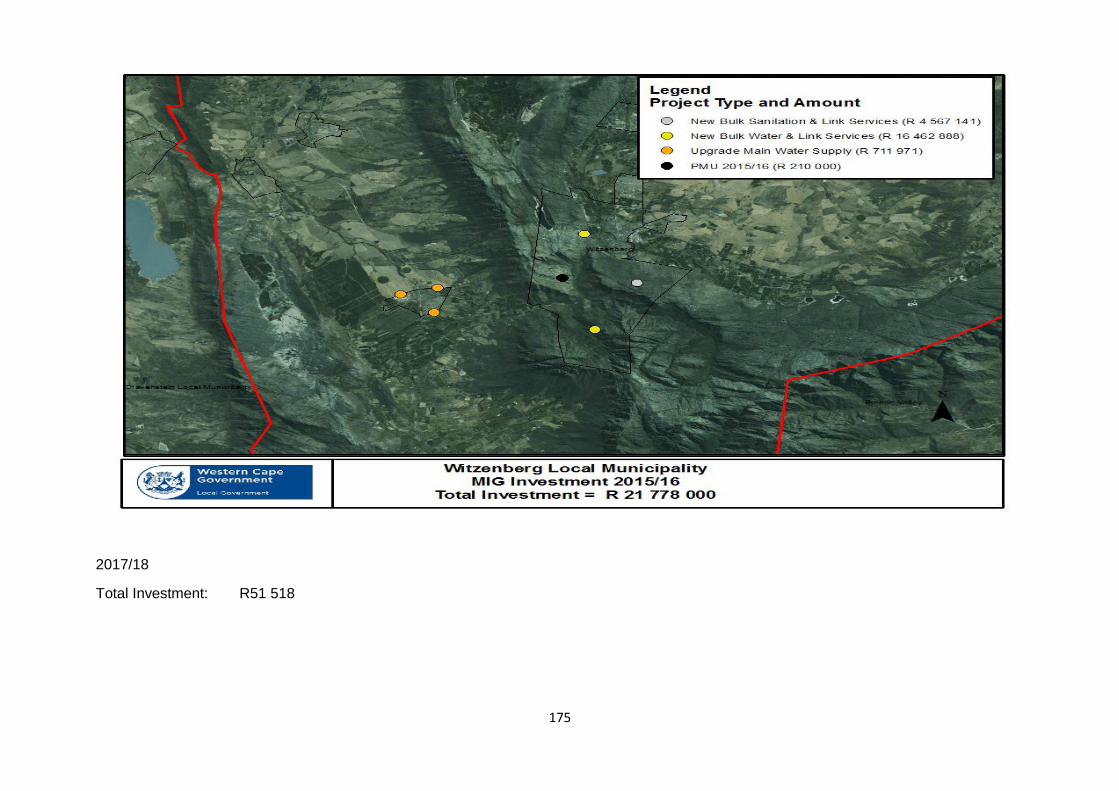
175
2017/18
Total Investment: R51 518

176
CHAPTER 9: NATIONAL AND PROVINCIAL PROGRAMMES 9.1 NATIONAL GOVERNMENT
SoNA-In-Numbers – February 2017
10 Feb 2017 Economy 1.3% – the anticipated economic growth rate in 2017. 0.5% – estimated economic growth achieved in 2016.
Energy 7 million – households that have been connected to the grid and now have electricity.
Water and sanitation 37% – the national average of water losses in some municipalities. 10 000 – unemployed youth being trained as plumbers, artisans and water agents. 15 000 – the total number to be trained as plumbers, artisans and water agents by end
of 2017.
Education 173 – the number of inappropriate school structures that have been eradicated since
2011. 895 – new schools that provide a conducive learning environment for children. 87 – points achieved by South Africa in Mathematics. 90 – points achieved by South Africa in Science.
Science 8 – African partners who supported South Africa to win the bid to host the Square
Kilometre Array telescope. R2 billion – the cost of constructing the MeerKAT telescope. 75% – local content used to construct the MeerKAT telescope.
Roads R4.5 billion – the cost of the project to upgrade the Moloto road.
Tourism 9 million – number of tourist arrivals for January to November 2016. 13% – growth in tourist arrivals.
Social development 17 million – people receiving social grants, mainly older persons and children.
Employment 2 million – work opportunities created by the Expanded Public Works Programme since
2014. 6 million – target of Expanded Public Works Programme work opportunities by the end
of March 2019. 1 million – Expanded Public Works Programme work opportunities benefiting the youth. 61 000 – work opportunities created through the environmental programmes such as
Working for Water, Working for Wetlands, Working on Fire and Working for Ecosystems. 60% – young people who benefited from environmental programmes such as Working
for Water, Working for Wetlands, Working on Fire and Working for Ecosystems.

177
Health 14 – the number of years for implementing the National Health Insurance in three
phases.
Inequality 5 – the ratio of white households earning more than black households. 10% – the number of the top 100 companies on the Johannesburg Stock Exchange
owned by black South Africans. 72% – the representation of whites at top management level by 2015/16. 10% – the representation of Africans at top management level by 2015/16. 4.5% – the representation of coloureds at top management level by 2015/16. 8.7% – the representation of Indians at top management level by 2015/16. 67.6% – male representation at top management level by 2015/16. 32.4% – female representation at top management level by 2015/16.
Procurement R500 billion – amount spent by the State a year to buy goods and services. R900 billion – government’s annual infrastructure budget. 30% – compulsory amount of business to be subcontracted to black-owned enterprises
by big contractors. 10 – number of years in jail for cartels.
Housing 4 million – houses built by government since 1994. R7 trillion – the value of the property market in South Africa. R1.5 trillion – the value of the subsidised property sector in South Africa. -5% – stake owned and managed by black people and Africans in particular in the
property sector. 22 – number of entrepreneurs supported by the Black Industrialists Programme. R100 million – to be invested by the Department of Public Works in 2017 on critical
capital and maintenance programmes to modernise harbours.
Agriculture and land reform 8 million – hectares of arable land that have been transferred to black people. 9.8% – percentage of the eight million hectares of arable land in South Africa that have
been transferred to black people. 82 million – total hectares of arable land in South Africa. 19% – decline in households involved in agriculture between 2011 and 2016. 2.9 million – number of households whose involvement in agriculture declined in 2011. 2.3 million – number of households whose involvement in agriculture declined in 2016. 13 – approved proposals for the Strengthening the Relative Rights of People Working
the Land programme (50-50 programme). 921 – farm dweller households benefiting from the Strengthening the Relative Rights of
People Working the Land programme (50-50 programme). R631 million – value of the Strengthening the Relative Rights of People Working the
Land programme (50-50 programme) benefitting farm dweller households. 90% – land claims settled through financial compensation. 450 – black smallholder farmers expected to benefit from government’s
commercialisation support programme.

178
R2.5 billion – amount made available for the provision of livestock feed, water infrastructure, drilling, equipping and refurbishment of boreholes, auction sales and other interventions.
R500 million – funding provided by the Industrial Development Corporation and the Land Bank to distressed farmers to manage their credit facilities and support with soft loans.
Higher education R600 000 – the combined family income of students who will not face fee increases at
universities and Technical and Vocational Education and Training colleges in 2017. R32 billion – the amount government has reprioritised to support higher education. R122 000 – the National Student Financial Aid Scheme threshold considered too low by
students.
Anti-corruption 98% – compliance levels with parole and probation conditions achieved by the
Department of Correctional Services. 389 – asset forfeiture cases completed by the Asset Forfeiture Unit. R349 million – the value of asset forfeiture cases completed by the Asset Forfeiture
Unit. 326 – freezing orders obtained by the Asset Forfeiture Unit. R779 million – the value of freezing orders obtained by the Asset Forfeiture Unit. R13 million – the amount recovered in cases where government officials were involved
in corruption and other related offences in 2016.
Foreign trade 99% – South African products that will have preferential market access in the European
Union. 96% – South African products that will enter the European Union market without being
subjected to customs duties or quantitative restrictions. 1 000 – tariff lines being provided preferential access by the Southern African Customs
Union Mercosur Preferential Trade Agreement. 20 000 – tons of beef to be exported to China per year for 10 years. 10 – number of years to export 20 000 tons of beef to China per year.
9.2 WESTERN CAPE PROVINCIAL GOVERNMENT PRIORITIES FOR 2016/2017
1. Create opportunities for growth and jobs: We're committed to creating an enabling environment to attract investment, grow the economy and create jobs by supporting high growth economic sectors.
2. Improve education outcomes and opportunities for youth development: We’re committed to expanding quality education across the province and providing opportunities for youth to realise their full potential.
3. Increase wellness and safety, and tackle social ills: We’re committed to addressing health, safety and social ills by supporting healthy communities, a healthy workforce, and healthy families, youth and children.

179
4. Enable a resilient, sustainable, quality and inclusive living environment: We’re committed to improving urban and rural areas through enhanced management of land, an enhanced climate change plan, and better living conditions for all.
5. Embed good governance and integrated service delivery through partnerships and spatial alignment: We’re committed to delivering good governance and an inclusive society that increases access to information, in partnership with active citizens, business

180
9.3 PROVINCIAL JOINT PLANNING INITIATIVES
JPI Ref Municipality Lead Dept/Municipality
PSG Linkage JPI type Agreed JPI outcomes/objectives
Supporting departments Latest update from leading Dept/Municipality
Latest update from supporting Dept/Municipality
JP 1_037
Stellenbosch municipality
DEADP
PSG 4: Enable a resilient sustainable, quality and inclusive living environment
Environment management
Solid Waste management
Stellenbosch Municipality Drakenstein Municipality CoCT CWDM
5 October 2016 A meeting was held on 13 April 2016 between Stellenbosch, Drakenstein, Cape Winelands District Municipality and City of Cape Town. It was agreed to work together. City of Cape Town would investigate the possibility of waving the fee for the use of its facilities. DEA & DP through its Directorate Waste Management has championed region waste solutions in particular through actively assisting municipality with the development of their integrated waste management plans (IWMP).
Stellenbosch Municipality (August 2016) Stellenbosch Municipality is in agreement with June 2015 update from Lead Sector Department. No suitable regional landfill site could be found for the 2 neighbouring municipalities (impact study confirmed this). Funding application for both the Klapmuts and Landfill Gas to Energy projects were submitted on 05 August 2016. Leonardo di Caprio fund, through the through R20 and ICLEI office. To date no feedback from CoCT with regards to the utilisation of their facility, and for a tariff applicable to the users within the CoCT boundary. This request was submitted to the Executive Mayor and Municipal Manager of CoCT. Stellenbosch Municipality will be advertising its tender for the design and tender of the aboveground landfill gas channelling and beneficiation from landfill site to waste water treatment works. Would like to request a meeting with DEADP at the JPI sessions
JPI 2_002
Stellenbosch Municipality
DoCS
PSG 3: Increased Wellness, safety and reducing social skills
NONE
Update 31 July Number of Youth trained at CA and monetary value 6 youth – R108,000 Number of Youth trained at WK and monetary value Number of Youth on the YWP and monetary value 2015/2016:8
Stellenbosch Municipality (July 2016): Currently a MOU in existence between Stellenbosch Municipality and Security Cluster of Stellenbosch (WC024) and Stellenbosch University Campus Control. In addition to this a MOU between Stellenbosch Municipality and Stellenbosch University is in place
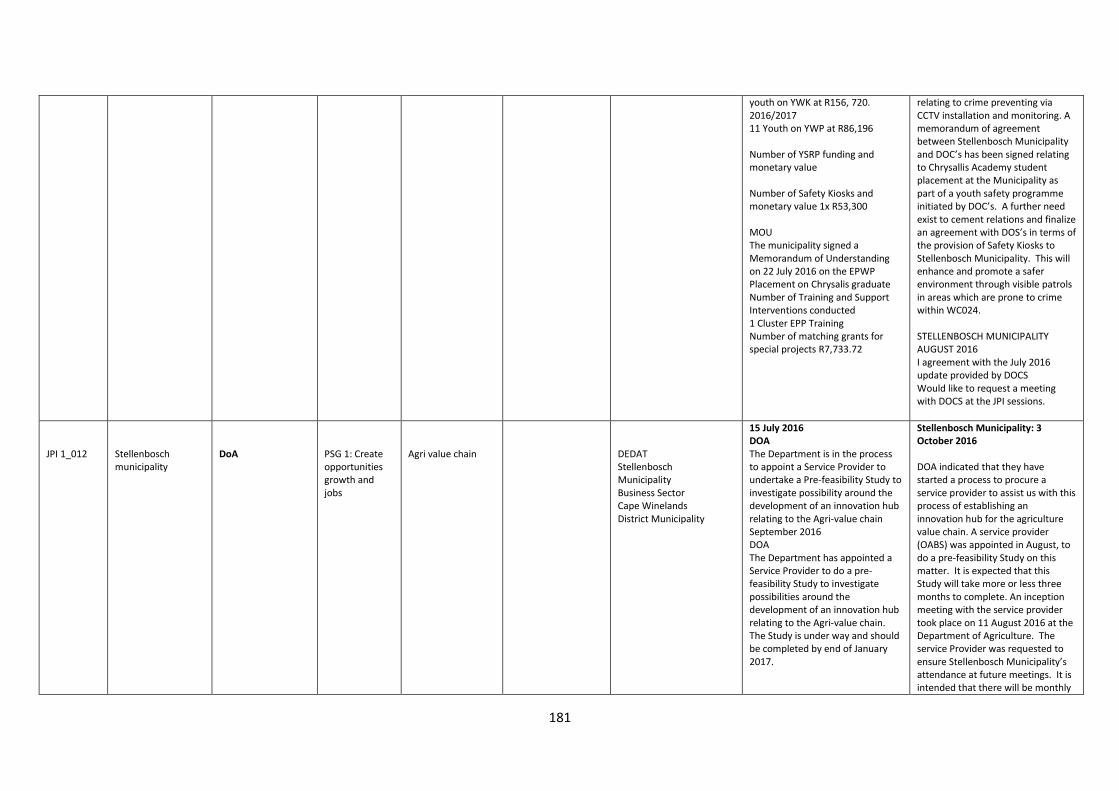
181
youth on YWK at R156, 720. 2016/2017 11 Youth on YWP at R86,196 Number of YSRP funding and monetary value Number of Safety Kiosks and monetary value 1x R53,300 MOU The municipality signed a Memorandum of Understanding on 22 July 2016 on the EPWP Placement on Chrysalis graduate Number of Training and Support Interventions conducted 1 Cluster EPP Training Number of matching grants for special projects R7,733.72
relating to crime preventing via CCTV installation and monitoring. A memorandum of agreement between Stellenbosch Municipality and DOC’s has been signed relating to Chrysallis Academy student placement at the Municipality as part of a youth safety programme initiated by DOC’s. A further need exist to cement relations and finalize an agreement with DOS’s in terms of the provision of Safety Kiosks to Stellenbosch Municipality. This will enhance and promote a safer environment through visible patrols in areas which are prone to crime within WC024. STELLENBOSCH MUNICIPALITY AUGUST 2016 I agreement with the July 2016 update provided by DOCS Would like to request a meeting with DOCS at the JPI sessions.
JPI 1_012
Stellenbosch municipality
DoA
PSG 1: Create opportunities growth and jobs
Agri value chain
DEDAT Stellenbosch Municipality Business Sector Cape Winelands District Municipality
15 July 2016 DOA The Department is in the process to appoint a Service Provider to undertake a Pre-feasibility Study to investigate possibility around the development of an innovation hub relating to the Agri-value chain September 2016 DOA The Department has appointed a Service Provider to do a pre-feasibility Study to investigate possibilities around the development of an innovation hub relating to the Agri-value chain. The Study is under way and should be completed by end of January 2017.
Stellenbosch Municipality: 3 October 2016 DOA indicated that they have started a process to procure a service provider to assist us with this process of establishing an innovation hub for the agriculture value chain. A service provider (OABS) was appointed in August, to do a pre-feasibility Study on this matter. It is expected that this Study will take more or less three months to complete. An inception meeting with the service provider took place on 11 August 2016 at the Department of Agriculture. The service Provider was requested to ensure Stellenbosch Municipality’s attendance at future meetings. It is intended that there will be monthly
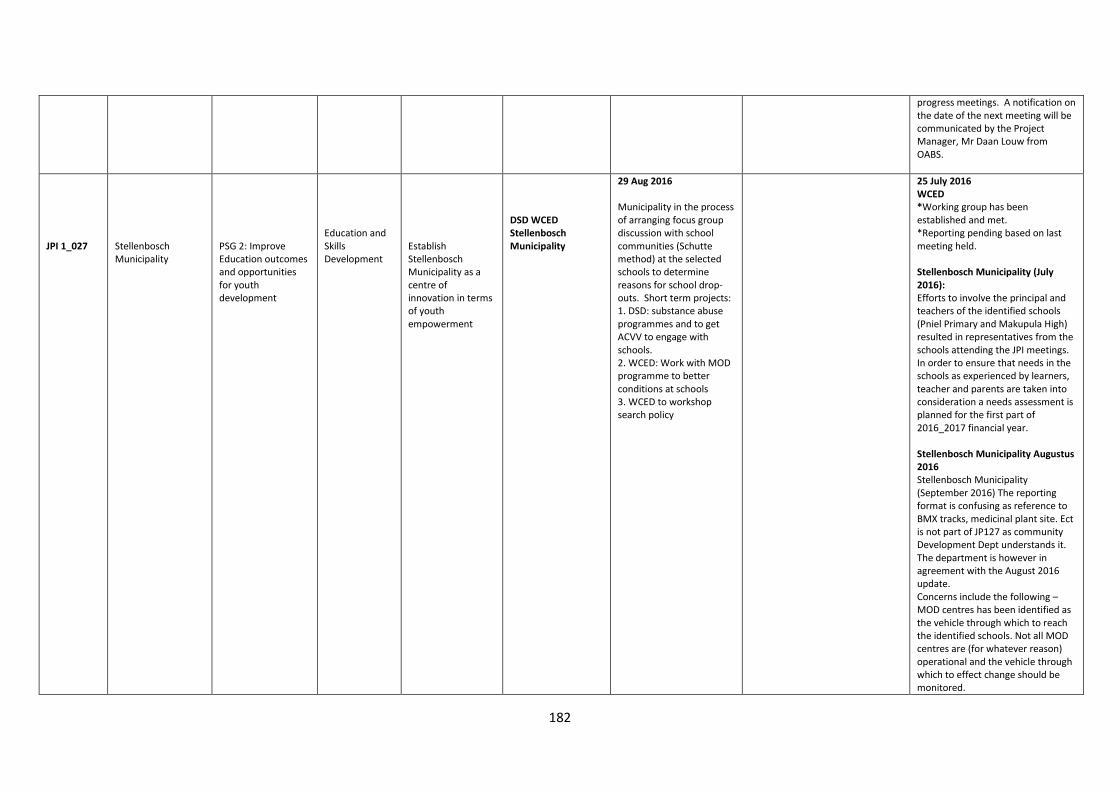
182
progress meetings. A notification on the date of the next meeting will be communicated by the Project Manager, Mr Daan Louw from OABS.
JPI 1_027
Stellenbosch Municipality
PSG 2: Improve Education outcomes and opportunities for youth development
Education and Skills Development
Establish Stellenbosch Municipality as a centre of innovation in terms of youth empowerment
DSD WCED Stellenbosch Municipality
29 Aug 2016 Municipality in the process of arranging focus group discussion with school communities (Schutte method) at the selected schools to determine reasons for school drop-outs. Short term projects: 1. DSD: substance abuse programmes and to get ACVV to engage with schools. 2. WCED: Work with MOD programme to better conditions at schools 3. WCED to workshop search policy
25 July 2016 WCED *Working group has been established and met. *Reporting pending based on last meeting held. Stellenbosch Municipality (July 2016): Efforts to involve the principal and teachers of the identified schools (Pniel Primary and Makupula High) resulted in representatives from the schools attending the JPI meetings. In order to ensure that needs in the schools as experienced by learners, teacher and parents are taken into consideration a needs assessment is planned for the first part of 2016_2017 financial year. Stellenbosch Municipality Augustus 2016 Stellenbosch Municipality (September 2016) The reporting format is confusing as reference to BMX tracks, medicinal plant site. Ect is not part of JP127 as community Development Dept understands it. The department is however in agreement with the August 2016 update. Concerns include the following – MOD centres has been identified as the vehicle through which to reach the identified schools. Not all MOD centres are (for whatever reason) operational and the vehicle through which to effect change should be monitored.

183
JPI 1_028
JPI 1_029
Witzenberg Municipality
WCED PSG 2: Improve Education outcomes and opportunities for youth development
Education and skills Development
Human Resource Department
DOA Witzenberg Municipality
25 July 2016 WCED . Matters at Nduli Primary has been resolved through communication with the principal, because some at the information was not correct. Fencing and safety is under control. *The issue regarding outstanding rates will be addressed by our head office. *The new primary school in Tulbagh is almost ready for occupation – planned date is 2017. This will relieve schools like WF Loots and Errie Moller. *Refurbishment of Tulbagh HS and replacing Waveren is also is discussion and activated on the UAMP at the WCED. 30 Augustus 2016 WCED *Ms Frederics (CWD-education) investigated and liaise with the Municipality and informed them that two erfs/plots/stands have been registered in the schools name, but the school only occupied one. The other plot’s rates and taxes is the responsibility of Public Works.
30 September 2016: Witzenberg Municipality DLG: The Municipality took note of the sector response received and provided no further input.
Langeberg Municipality
DSD PSG 3: Increased Wellness, safety and reducing social ills
Social Initiatives Implementation of a Comprehensive Youth Empowerment Plan 1.Drug Master Plan (used as a vehicle to coordinate youth activity);
DoCS Langeberg Municipality
26 September 2016: Langeberg Municipality The Municipality took note of responses and provided no further input
02 Aug 2016 Drakenstein Municipality

184
JPI 1_057
Drakenstein Municipality
Drakenstein Municipality
PSG 4: Enable a resilient, sustainable, quality and inclusive living environment
Integrated Settlement Development
Tenure security and farm evictions
DLG CWDM DoJ DRDLR DHS DoA SALGA
Further to this, progress regarding the proposed emergency sites previously reported are as follows: Gouda: An application has been submitted to the Provincial Department of Human Settlements for funding. The province have requested additional information that the municipality still need to submit before the application can be processed/approved. Simonduim: Due to dynamics in the area, the site that was proposed for emergency housing has now been earmarked for formal BNG housing. Vlakkeland: The emergency housing is a component within the proposed vlakkeland Development which will cater for over 2500 opportunities. Over 500 opportunities has been set aside in the development proposal for emergency cases. This will however require further discussion with the provincial Department of Human Settlements in terms of roll out and implementation. It is envisaged that the civil works for the bigger Vlakkenland Development will commence in March / April 2017 and phase one which includes opportunities for emergency accommodation to follow toward the third quarter of 2017.
JPI 1_058
Stellenbosch Municipality
DEADP
PSG 4:
Integrated Settlement Development
Urban redevelopment
Stellenbosch Municipality DTPW DEDAT
5 October 2016 The SDF / HSP project is in its initial stages. The process is being driven by the Municipality and therefor the timeframes are for the most part dependant on the Municipality. The municipality has decided to start with an Urban Development Strategy which will
Stellenbosch municipality (July – August 2016): As reported previously (our letter dated 21 May 2016 to DEA & DP), there has been no progress in this matter. No spending of the provincial grant funding or of municipal funding for project has occurred. Due to the need to first

185
Enable a resilient, sustainable, quality and inclusive living environment
DHS later evolve into a Spatial Development Framework. (The HSP will form part of the SDF). The first project Committee Meeting. Attended by the Department of Human Settlements, Environmental Affairs and Development Planning and the provincial Department of Agriculture was held on the 1st of September 2016. DEA & DP to provide technical assistance on the HSP and SDF. Assistance to municipalities regarding the development of their SDF’s is a core function of the Directorate Spatial Planning in DEA & DP. DEA & DP will provide ongoing technical support to the Municipality as part of the Municipality’s TOD initiative. This matter has been institutionalised and moving forward this matter will therefore no longer be reported on as a JPI.
conclude the professional service provider procurement process (clearance for the appointed of the consultant team was only given in June 2016). A final meeting on the final draft terms of reference and the program was held with the project manager and lead consultant on 21 July 2016, subsequent to which the requisite service provider contracts were concluded (signed providers by the municipality on 17 August 2016) and the work will proceed after signing of the contracts by the service providers before 25 August 2016. We envisage the actual starting date immediately following the joint stakeholder meeting on 01 September 2016, to which all stakeholders have been invited. Funding acquired from DEAP DP to do an Urban Development Strategy (R900.000). Stellenbosch Municipality to appoint a service provider. To establish a pilot to test and demonstrate new technologies. CPUT has a similar plant to test mechanical technology, but not suitable for animal or wine testing purposes.
JPI 1_058
Stellenbosch Municipality
Stellenbosch Municipality
PSG 4: Enable a resilient, sustainable, quality and inclusive living environment
Integrated Settlement Development
Transit orientated development
DTPW DEDAT DEADP
24 Aug 2016
Schedule appointment with Dept of Transport to confirm specs for the appointment of service provider for a further study to be done
Internal JPI team meeting to compile process plan with actions, responsible persons and key milestones

186
JPI team meeting with internal and external stakeholders to discuss way forward and report on progress
Private sector involvement: schedule appointment with main investor and land owners for a discussion of possible partnership in the project with the aim of centralising investment in support of the TOD
N/A- Stellenbosch Municipality is the Lead Department and feedback not needed for the purpose of this exercise. A separate meeting with internal and external stakeholders will be convened.
JPI 1_059
Witzenberg Municipality
Witzenberg Municipality
PSG 4: Enable a resilient, sustainable, quality and inclusive living environment
Integrated Settlement Development
Implementation Of infrastructure Master Plans
DTPW DHS DLG
30 Aug 2016: DHS Funding has become available for the development of the Witzenberg HSP. DoHS has developed a terms of reference that could provide some guidance on how to plan on proceeding with the appointment of consultants, ect To discuss the issue a meeting are planned for Friday 2 September 2016 between the DoHS and municipality.
30 September 2016: Witzenberg Municipality A meeting is planned for Wednesday 12 October 2016 at 12:00 to discuss the Witzenberg HSP. The discussion will be very preliminary and the purpose of the meeting will be to begin conceptualizing the contents of the HSP as well as a way forward for its development
JPI 1_060
Langeberg Municipality
Langeberg Municipality
PSG 4: Enable a resilient, sustainable, quality and inclusive living environment
Integrated Settlement Development
Identify and secure land for low income housing development
DEADP DHS DoA
26 September 2016: Langeberg Municipality DLG: The municipality took note of responses and provided no further input.
24 Aug 2016: Langeberg Municipality Land has been earmarked in Robertson for the project and is currently finalizing processes.
JPI 1_060
Langeberg Municipality
Langeberg Municipality
PSG 4: Enable a resilient, sustainable, quality and
Integrated Settlement Development
Mobility Strategy DTPW 24 Aug 2016 This is an on going process and the ITP has not been reviewed yet. 26 September 2016: Langeberg Municipality

187
inclusive living environment
DLG: The municipality took note of responses and provided no further input.
JPI 1_061
Breede Valley Municipality
DHS
PSG 4: Enable a resilient, sustainable, quality and inclusive living environment
Integrated Settlement Development
Fast tracking of housing delivery within Breede Valley Municiplaity
Breede Valley Municipality DTPW DEADP
31 Aug 2016 DEADP to assist with the mand issue The catalytic project had been prioritised for the financial year
Update July 2016 Breede Valley Municipality “This is a provincial project and has been prioritised and is following the statutory processes (EIA and LUPO). Council approved the extra pockets of land (off-sets) and both Cape Nature and DEAP have accepted the offset land. DoHD has agreed to allocate funding for the bulk infrastructure for Transhex. This will be a multi-year funding: an amount of 10 million has been budgeted for 2016/2017. The final Environment impact Assessment Report was submitted to the DEA & DP on 01 July 2016. The final approval is expected during October 2016. The appointment of service providers to complete the detailed designs. Construction is scheduled to start during 2017/2018. “UPDATE: September 2016 BREEDE VALLEY MUNICIPALITY DEA & DP have accepted the final Environment Impact Assessment Report on 15 September 2016. The final approval is expected within a month from the date of acceptance (October 2016). The appointment o service providers to complete the detailed designs has been completed and that draft SLA’s are currently been circulated. Construction is scheduled to start during 201/2018”

188
JPI 1_080 Stellenbosch Municipality
DLG:MI PSG 4: Enable a resilient, sustainable, quality and inclusive living environment
Investment in Bulk Infrastructure
Infrastructure provision
PT Stellenbosch Municipality
14 September 2016 All future IGP’s will form a section within the SDF. DLG working with DEADP to produce an integrated collaborator document.
A separate meeting with internal and external stakeholders will be convened.
JPI 1_083 Breede Valley Municipality
DEDAT PSG 1: Create opportunities growth and jobs
Investment in Bulk Infrastructure
Development of economic infrastructure
DoA DTPW Breede Valley Municipality Transnet
26 September 2016: Breede Valley Municipality 19 September 2016: The municipality took a resolution to budget for the expenditure in the MTREF as this is the only manner how capital funding could be allocated. We are busy to develop an urban vision framework to provide more clarity on infrastructure, transport and sustainable design issues. Furthermore the urban vision framework will frame the scope and constraints of such s development. After we have completed the urban vision framework we will award the tender to a developer after we have undertaken a competitive bidding process.
JPI 1_099 Drakenstein Municipality
Drakenstein Municipality
PSG 3: Increase wellness, safety and reducing social skills
Social initiatives Unlocking key economic drivers
DoE DoA DTPW DEDAT DsD DoCS
2 Aug 2016 Update: The Homeless people was adopted by municipality. One of the strategic objectives that was adopted at the summit was a 5 year plan to deal with the challenge of street people in the Drakenstein Municipal area. The 2015/16 objectives that were achieved in the first year included; To develop links between the stakeholders, government, non-governmental and civil society institutions and the Drakenstein municipality (DM) To set up effective, well-represented street people committee that review and develop policy, a local government

189
strategy, and a consistent approach and facilitate approved actions. 31 Aug 2016 The strategic objective of the municipality was to 1.Establish a street people’s stakeholders forum in the Drakenstein municipal area; with the aim of developing links between the stakeholders , government, non-government and civil society institutions are the Drakenstein municipality (DM) and to allocate a budget for following year, to allocate role and functions, to finalise a job description of a dedicated official for street people and to approve operational plans to deal
JPI 1_100 Witzenberg Municiplaity
DoCs PSG 3: Increase wellness, safety and reducing social ills
Social initiatives Implementation Of safety promotion strategy
DSD DoH DCAS Witzenberg Municipality SAPS
Update 31 July: DoCS Number of youth trained at CA and monetary value 9 youth-R162.00 Number of Youth trained at WK and monetary value 7 youth-R24.640 Number of youth on the YWP and monetary value 2016/2016: 47 youth on the YWP at R920.730 2016/2017: 57 youth on YWP at R446.652 Number of YSRP funding and money value Badisa funded during June and December 2015 to the value of R25.00 Number of safety kiosk and monetary value 1XR53.300 MOU A partnership meeting was held with senior Manager Mrs Kriegler on rollover of kiosk; Wolwekloof placements and Chrysalis placements
30 September 2016: Witzenberg Municipality DLG: The municipality took note of the sector response received and provided no further input.

190
The former EPWP placements and kiosk partnership agreements was finalised. Number of CPF Exco and Cluster board meetings attended 1X Cluster Board Meeting
JPI 1_101 Breede Valley Municipality
Breede Valley Municipality
PSG 3: Increase wellness, safety and reducing social ills
Social initiatives Coordinated skills Development Plan:
CWDM DoA DEDAT DoE DTPW DHET
UPDATE JULY 2016 Breede Valley Municiplaity Municipality No response received from DHET. 26 September 2016: Boland College has submitted a project proposal targeting 150 learners in two programmes: NC: Building and Construction NQF L3: Masonry or painting NC: Plant production NQF L2
25 July 2016 WCED
WCED (Cape Winelands District) has been successful to engage with DHET as per department, but the municipal have met the Boland College already.
JPI 1_101 Breede Valley Municipality
DEADP PSG 3: Increase wellness, safety and reducing social ills
Social initiatives Implementation of RSEP model throughout the municipality:
DoCS DSD SAPS Breede Valley Municipality
5 October 2016 21 projects were approved for implementation: Some are minor projects but still making a huge impact on the safety and well-being of the communities. Eleven of these projects have been completed and 10 others are well under way. A service provider has recently been appointed for the urban design of the Zwelethemba commercial corridor (from RSEP/VPUU funding, in addition to the transfer payments). Two BMX tracks have been completes, as well as additional upgraded standpipes in informal settlements. The RSEP/VPUU is a provincial flagship project that DEA & DP was tasked by provincial cabinet to be the project manager and implementation agent. The RSEP/VPUU project steering committee comprises the HOD’s and MMs of participating municipalities. The steercom also
UPDATE: JULY 2016 BREEDE VALLEY MUNCIPALITY Progress with implementation of RSEP in the municipality during 2015/16 financial year the following projects were implemented: Avian Park: Construction of a tar-surfaced multipurpose sports court, facilitation of construction of a BMX track, dirt netball court and mini-cricket pitch with associate training programmes by an NGO, paving of 1800m former dirt roads, installation of lighting in area plagued by muggings, upgrading of 4 existing stand pipes in informal settlement with seating, drainage and a tree for shade Riverview: Construction of tar-surfaced, multipurpose sports court, planting of roll-on lawn for a grassed sports field, paving and gravel for construction of walkways and bus parking to improve safety at Breerivier High School, construction of netball court using crusher dust and lighting of dark areas to improve pedestrian safety

191
reports to the PSG4 work group 4. There are also regular updates to the premier. As such, moving forward this item will no longer be reported on as a JPI.
Roadwal: Construction of a tar-surfaced, multipurpose sports court, electrification of modified shipping container for use by SAPS and construction of a BMX “pump” track Zwelethemba: Upgrading of 2 more existing stand pipes in informal settlement with seating, drainage and a tree for shade, construction of braai stands and benches in public open space, planting of roll-on lawn to create new park and appointment of VPUU NPC as consultant for the development of the Zwelethemba node and corridor All areas: Drafting and approval by council of portfolio of
J{I 1_003 Breede Valley Municipality
DLG:MI PSG 4: Enable a resilient, sustainable, quality and inclusive living environment
Infrastructure development of the following rural towns in the Breede Valley Municipality:
RDLR DOA
14 Sept 2016: DLG:MI MIG projects planned for implementation in the MTEF period outside of Worcester Within Breede Valley Municipality:
DE Doorns: upgrade water treatment works: Augmentation of DAF unit
DE Doorns: Rehabilitate roads
De Doorns: South of N1: upgrade Bus Route
De Doorns: Street 425: upgrade bus route
De Doorns: South N1: New retention ponds
De Doorns: New High mast lighting
De Doorns: Rawsonville, De Wet Brug: New high Street Lights & Reticulation
De Doorns: Sunny Side Orchards: New high mast lighting
De Doorns: Material Recovery Facility &transfer station: New Refuse Removal
JULY 2016 BREEDE VALLEY MUNICIPALITY DRD & LR to be included 26 September 2016 19 Sept 2016 BREEDE VALLEY MUNICIPALITY MG projects planned for implementation in the 2016/2017 MTEF period outside of Worcester within Breede Valley Municipality:
De Doorns material recovery facility and transfer station
De Doorns, Rawsonville. De Wet Brug, New street lights & reticulation
De Doorns: Sports Grounds –upgrade sport facilities
Rawsonville –upgrade soccer field
Touws River –steenvliet –upgrade cricket field
Touws River: touw park –upgrade sports facilities (Building & Irrigation)
De Doorns: New Fire station

192
Rawsonville: upgrade Waste Water Treatment Works
Rawsonville: Rehabilitate Roads
Trans Hex Housing Development: New Sewer pump Station & Rising main
Touws River: Rehabilitate Roads

193
CHAPTER TEN: SUMMARY OF LOCAL MUNICIPALITIES’ IDP 2017/18 – 2020/21
10.1 WITZENBERG MUNICIPALITY
Witzenberg Municipality Vision Mission Strategic Priorities
A Municipality
that cares for
its community,
creating
growth and
opportunities
The Witzenberg Municipality is
committed to improve the quality
of life of its community by:
Providing and maintaining affordable services.
Promoting Social and Economic Development;
The effective and efficient use of available resources; and
Effective Stakeholder and Community participation
KPA 1: Essential Services
KPA 2: Governance
KPA 3: Communal Services
KPA 4: Socio-Economic Support Services
Major challenges Actions to address
Bulk electricity supply from Eskom. The recent growth in the local agro-economy has resulted in the expansion of agroprocessing industries in the rural and built environment. The implementation of notified maximum demand limits by Eskom due to the under-capacity of bulk supply infrastructure has restricted further expansion and it was indicated that sufficient infrastructure upgrade will only be completed by 2021. This will severely impact on the region’s economic
Various deliberations has taken place between the Municipality, Eskom, local business and the agricultural section to address the issue. Discussions with various Government Departments is underway to obtain funding to upgrade Eskom bulk infrastructure on a short term basis to address the need up to 2021

194
Growth Waste Management. The operating of the municipal landfill sites and overall all management of waste has become a major challenge due to drastically increased maintenance cost of the sites, vandalism, theft and public ignorance on by-laws. The delay in the establishment of a regional waste site at Worcester also contributes to the uncertainty of strategy to be followed in terms of investment into the current sites or towards a material recovery facility aligned with the regional site Drought and Water Sources. The Witzenberg area has experienced a severe drought during 2015/16 and has been declared a disaster area by National- and Western Cape Government. The municipal storage dams at Tulbagh and Ceres has reached critical low points during the summer. Strict water restrictions was implemented by Council since October 2015 and various infrastructure projects funded by the municipality and local/national government was implemented to utilise additional water sources and upgrade existing storage infrastructure. Various local landowners in Tulbagh assisted with provision of surplus water and storage capacity during the drought Provision of bulk infrastructure for subsidised housing projects. The implementation of the Vredebes housing project with 2900 residential plots will have to be phased over a longer period due to the bulk infrastructure required for the occupation of the project. The allocation of the
The municipality has started with the development of a long-term strategy with regards to waste management in the municipal area. It is expected that the introduction of bins for business premises from October 2016 will increase recycling initiatives by business. A business plan for the establishment of a Material Recovery Facility and drop-off points was developed with our twinning municipality, Essen in Belgium. The business plan will be submitted in October 2016 to the Belgium Federal Government for funding
The insufficient capacity of the Tulbagh storage dam remains critical and although funding for the construction of a new dam was approved by the Department of Water Affairs, the implementation of the project are being delayed. Further investigations on the long term capacity of water sources will be done in 2016/17 as part of the revision of the Water Services Development Plan
The Vredebes project will be phased 1 over a mediumto long term period to ensure that bulk infrastructure as well as social infrastructure are completed and available when phases are occupied. This will also ensure that grant funding is not totally take up by the
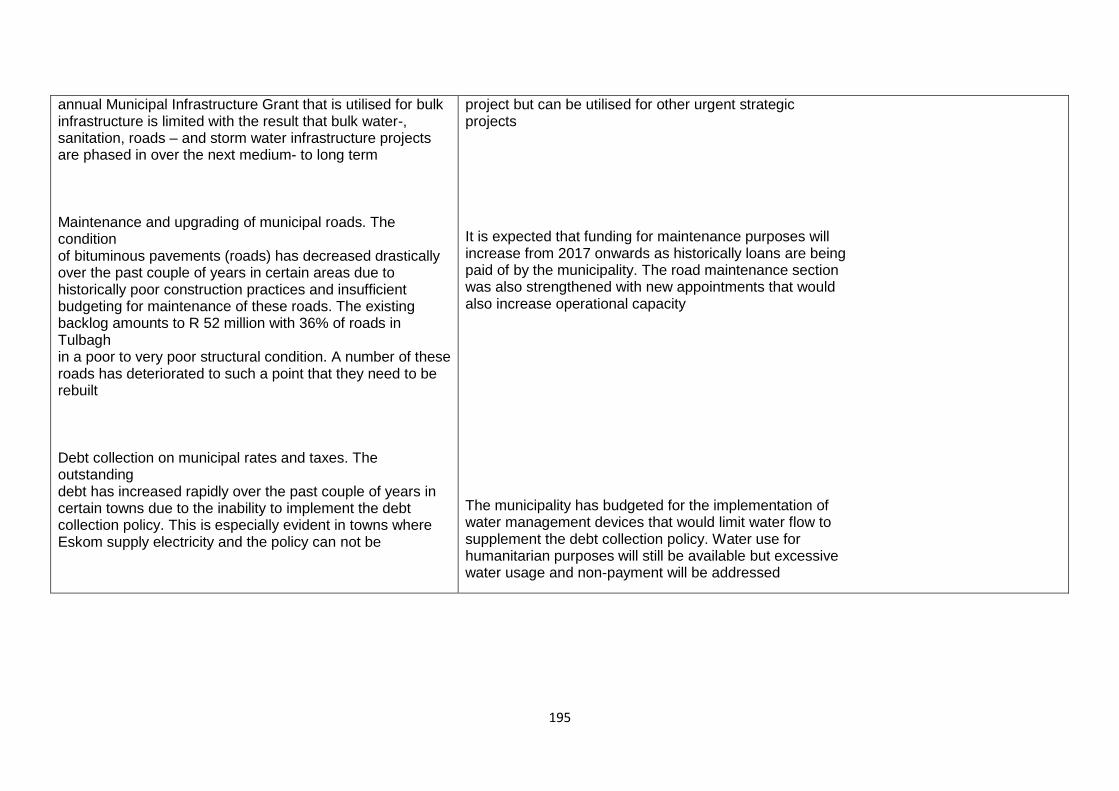
195
annual Municipal Infrastructure Grant that is utilised for bulk infrastructure is limited with the result that bulk water-, sanitation, roads – and storm water infrastructure projects are phased in over the next medium- to long term Maintenance and upgrading of municipal roads. The condition of bituminous pavements (roads) has decreased drastically over the past couple of years in certain areas due to historically poor construction practices and insufficient budgeting for maintenance of these roads. The existing backlog amounts to R 52 million with 36% of roads in Tulbagh in a poor to very poor structural condition. A number of these roads has deteriorated to such a point that they need to be rebuilt Debt collection on municipal rates and taxes. The outstanding debt has increased rapidly over the past couple of years in certain towns due to the inability to implement the debt collection policy. This is especially evident in towns where Eskom supply electricity and the policy can not be
project but can be utilised for other urgent strategic projects
It is expected that funding for maintenance purposes will increase from 2017 onwards as historically loans are being paid of by the municipality. The road maintenance section was also strengthened with new appointments that would also increase operational capacity
The municipality has budgeted for the implementation of water management devices that would limit water flow to supplement the debt collection policy. Water use for humanitarian purposes will still be available but excessive water usage and non-payment will be addressed

196
10.2 DRAKENSTEIN MUNICIPALITY
Drakenstein Municipality Vision Mission Strategic Priorities
A place of excellence
Mission statement: Drakenstein Municipality will execute its vision through the following:
(a) Protecting and enhancing of the
quality of life of our residents and
the unique environment of our area;
(b) Providing efficient and effective
delivery of services which is
responsive to the community’s
needs;
(c) Promoting the principles of access,
equity and social justice in the
development of services;
(d) Delivering an effective
organisational culture which strives
for service excellence;
(e) Exercising regulatory functions of
Council consistently and without
bias;
(f) Encouraging community
participation in the processes of
Council by consulting widely on its
activities and policies;
Key Performance Areas KEY PERFORMANCE AREA (KPA) 1: GOVERNANCE AND STAKEHOLDER PARTICIPATION
KEY PERFORMANCE AREA (KPA) 2: FINANCIAL SUSTAINABILITY
KEY PERFORMANCE AREA (KPA) 3: INSTITUTIONAL TRANSFORMATION
KEY PERFORMANCE AREA (KPA) 4: PHYSICAL INFRASTRUCTURE AND SERVICES
KEY PERFORMANCE AREA (KPA) 5: PLANNING AND ECONOMIC DEVELOPMENT
KEY PERFORMANCE AREA (KPA) 6: SAFETY AND ENVIRONMENTAL MANAGEMENT
KEY PERFORMANCE AREA (KPA) 7: SOCIAL AND COMMUNITY DEVELOPMENT
Values:
Transparency;
Excellence;
Responsiveness;
Accountability;
Accessibility; and
Integrity
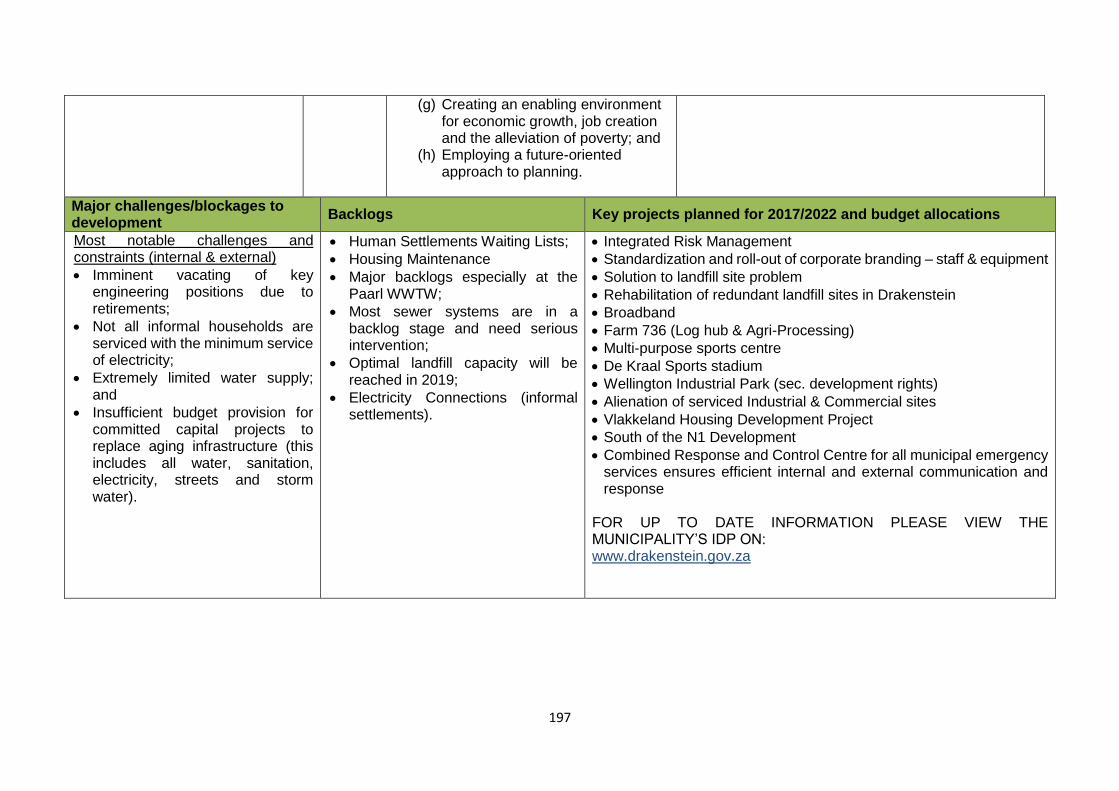
197
(g) Creating an enabling environment for economic growth, job creation and the alleviation of poverty; and
(h) Employing a future-oriented approach to planning.
Major challenges/blockages to development
Backlogs Key projects planned for 2017/2022 and budget allocations
Most notable challenges and constraints (internal & external)
Imminent vacating of key engineering positions due to retirements;
Not all informal households are serviced with the minimum service of electricity;
Extremely limited water supply; and
Insufficient budget provision for committed capital projects to replace aging infrastructure (this includes all water, sanitation, electricity, streets and storm water).
Human Settlements Waiting Lists;
Housing Maintenance
Major backlogs especially at the Paarl WWTW;
Most sewer systems are in a backlog stage and need serious intervention;
Optimal landfill capacity will be reached in 2019;
Electricity Connections (informal settlements).
Integrated Risk Management
Standardization and roll-out of corporate branding – staff & equipment
Solution to landfill site problem
Rehabilitation of redundant landfill sites in Drakenstein
Broadband
Farm 736 (Log hub & Agri-Processing)
Multi-purpose sports centre
De Kraal Sports stadium
Wellington Industrial Park (sec. development rights)
Alienation of serviced Industrial & Commercial sites
Vlakkeland Housing Development Project
South of the N1 Development
Combined Response and Control Centre for all municipal emergency services ensures efficient internal and external communication and response
FOR UP TO DATE INFORMATION PLEASE VIEW THE MUNICIPALITY’S IDP ON: www.drakenstein.gov.za

198
10.3 LANGEBERG MUNICIPALITY
Langeberg Municipality Vision Mission Strategic Priorities
To create a stable
living
environment and
sustainable living
conditions for all
citizens
By providing cost effective
quality services to the
Citizens, exercise good
leadership, ensuring sound
governance and financial
management
SO 1: Sustainable integrated human settlement
SO 2: Sustainable civil engineering infrastructure services
SO 3: Energy efficiency for a sustainable future
SO 4: Provision of a safe and efficient road network
SO 5: Promote public safety
SO 6: Provision of a clean environment
SO 7: Social and Community Development
SO 8: Growth and economic development
SO 9:Sound Financial Management
SO 10: Institutional Development and Corporate governance
SO 11: Good Governance
Major challenges/blockages
to development
Backlogs Key projects planned for 2012/16 and budget allocations
LED
Tarring of gravel roads;
Storm water channels;
Seasonality;
Acquisition of land;
Special Skills shortage; and
Lack of Investment – Private
sector
Housing Backlogs
Ashton 2667
Bonnievale 1921
McGregor 595
Montagu 1186
Robertson 3898
Installation of Services Housing R 1,772,455.38
Upgrading Waste Water Works R 2,445,171.23
Resealing of Roads R 4,500 000.00
Upgrading Water Treatment Works Ashton R 889,490.22
Replacements / Repairs: Water Network R13,209,071.68
Building of Library in Nkqubela R 541,583.23
FOR MORE NFORMATION VIEW THE MUNICIPALITY’S IDP ON
www.langeberg.gov.za

199
10.4 STELLENBOSCH MUNICIPALITY
Stellenbosch
Municipality Vision Mission Strategic Goals
We describe the vision of where we want to be as a
municipality and the Greater Stellenbosch area as:
“Greater Stellenbosch: …
This means that we will work to establish the Greater
Stellenbosch area as:
A sustainable municipality that offers a future to our children and their children;
A dignified municipality that is tolerant, non-racist and non-sexist;
An accessible municipality that extends the benefits of urban society, our history, institutions, and enterprises to all and builds the capacity of its people;
A credible municipality that is well governed and trusted by its citizens and partners;
A competent municipality with appropriate skills to deliver needed services, associated capabilities and a competitive edge and learning culture;
A safe and caring municipality that cares for its citizens and values the safety and security of all who live, work, and play in it; and
A prosperous municipality known for its ability to compete globally and its commitment to tackle
It is our mission to offer the people of the
Greater Stellenbosch area:
Trustworthy, accountable, efficient and transparent municipal governance;
Responsible decision-making and processes on the allocation of public money and resources;
Dignified and meaningful engagement with municipal structures and service areas;
Opportunities to help shape the future of the municipality;
The opportunity to benefit from national, provincial and local partnerships and cooperation;
Equitable, affordable and sustainable municipal services;
Fair access to the benefits of urban society and capacity building opportunities; and
The opportunity to contribute to global, national, provincial, regional, and local economic growth and development.
Strategic Goals
A leader in governance, partnership, and civic participation;
A skilled and customer focused administration;
Sound and sustainable municipal financials;
A treasured, protected environment;
Responsible development management;
Opportunity for enterprise development, creativity and business development;
Dignified living;
Efficient infrastructure and services; and
A safe town.

200
issues facing its broader region and world. A municipality known for its leadership, willingness and commitment to work in partnership with others.
CHALLENGES
Housing - A high incidence of farm evictions places additional stresses on municipal service provision. Housing “backlogs” far outstrip available resources or technical capacity to deliver. Slow pace of housing delivery for low-income and “gap” sectors; The administration as a whole is not geared to contribute to in-situ upgrade of informal settlements;
LED / Job creation - There has been limited transformation of the rural/agricultural economy in terms of land and agrarian reform. The formally developed urban economy contrasts strongly with the informal under-developed township economy. A lack of local economic development information inhibit smaller entrepreneurs to respond to opportunity;
Community Safety - Inadequate traffic enforcement; Inadequate facilities for vehicle testing and impoundment; Inadequate fleet and essential equipment; Inadequate staff to man essential services/ facilities;
Infrastructure - Failure to rehabilitate infrastructure specifically poses the risk that ongoing deterioration will escalate to uncontrollable proportions, with considerable impact on citizens, the economy of the area, and the image of the municipality; and
Municipal Finance - Inadequate resources to meet foreseen infrastructure and housing need.
VALUES
In all of our work and engagements, we subscribe to the following values:
Integrity: We undertake to perform the functions and operations of the Municipality in an honest and ethical manner;
Accountability: As servants of the public we accept that we are liable to be called to account for all that we do;
Respect: We will treat all our councillors, colleagues, customers and business partners with the utmost dignity and respect. This we will do irrespective of their economic status, race, gender, religion, political affiliation, language or place of origin;
Excellence: As an organization and individually, we will consistently strive to deliver services of the highest standard. Our aim is to exceed the expectations of our customers; and
Innovation: We will continuously review our systems, procedures and processes to make them less bureaucratic and more responsive to customer needs. We will acknowledge and reward initiatives which show creativity and ingenuity.

201
Backlogs
Housing Backlogs
± 20 000 units service backlogs
Upgrade /reconstruction of roads in WC024
Increase of capacity at WWTW's including Stellenbosch & Wemmershoek
Water & Sewer pipe replacement including Bulk Sewer Outfall.
Key projects planned for 2012/16 and budget allocations
Housing Project: Erf 342, Klapmuts – R 34 778 000 over 3 years;
Civil Engineering-Upgrade of WWTW-Wemmershoek - R 51 080 000 over three years;
Civil Engineering: Upgrade of WWTW: Klapmuts – R 21 680 000 over 3 years; and
Civil Engineering: Waterpipe replacement – R 24 000 000 over 3 years
FOR UP TO DATE INFORMATION PLEASE VIEW THE
MUNICIPALITY’S IDP ON:
www.stellenbosch.gov.za

202
10.5 BREEDE VALLEY (2012/2013-2016/2017 IDP)
Breede Valley Municipality Vision Mission Strategic Priorities
A unique and caring Valley of service excellence, opportunity and growth
To be a South African care capital by providing sustainable and affordable basic services in a safe and healthy environment which, promotes social and economic welfare through participative governance in a committed service orientated approach, and appreciates committed staff as the organisation’s most valuable resource and key to service delivery.
To create a unique and caring valley of service excellence, opportunity and growth;
To provide, maintain and assure basic service and social upliftment for the Breede Valley community;
To create an enabling environment for employment creation and poverty eradication through proactive economic development and tourism;
To ensure a safe, healthy, clean and sustainable external environment for all Breede Valley’s people;
To actively participate in determining the future of our country (nation building;
To ensure a healthy and productive workforce and an effective and efficient work environment; and
Assure a sustainable future through: sound financial management; continuous revenue growth; corporate governance and risk management practices; quality resources; and, value- adding partnerships..
Values OPPORTUNITY Breede Valley municipality wishes to provide an opportunity for every resident to have access to all basic services and live in a safe, caring and well-managed municipal environment SAFETY Breede Valley municipality aims on partnering with community, other government departments and community organisations to provide a safe environment for communities to thrive< especially women and children in pursuit of good community values
Key development focus: Build, grow and diversify local economy Build social capital in communities and address high demand for community safety and by a reduction in crime levels Address the backlog in the rehabilitation and replacement of ageing infrastructure Rural development Stem the proliferation of informal settlements/backyard dwelling and address high demand for housing FOR UP TO DATE INFORMATION PLEASE VIEW THE MUNICPALITY’S IDP ON: www.breedevallei.gov.za

203
CARING Breede Valley municipality will take and provide care to all vulnerable groups, encourage social investment by our partners with, a focus on youth development and opportunities for youth to play a meaningful role in developing a better and caring Breede Valley community INCLUSIVE Breede Valley community plans in consultation with all residents and partners to create and stimulate social cohesion, restore hope and break down social divide WELL-RUN MUNICIPALITY Breede Valley municipality continues to build on being a well-run municipality, with strong committed administration, uphold the principles of good governance, maintain a good credit rating, provide good basic services to all and improve our good productivity rating into becoming the best run municipality

204
10.6 SUPPORT TO LOCAL MUNICIPALITIES – FINANCIAL IMPACT
All projects, planning initiatives and programmes are implemented within the jurisdiction areas of the applicable local municipality’s or district
wide, as illustrated in the following table:
District Wide Support
Type of support Deliverable Financial Impact
Subsidies – Water & Sanitation Number of farms serviced (44) Educational’ s (20)
R 1 790 000
Environmental Health Education Number of theatre performances R 425 000
Clearing of road reserves 643 km Cleaned R 1 400 000
Rural infrastructure support Provision of water to schools R 600 000
Renewable Infrastructure – Rural Areas
Solar systems supply to farmers R 700 000
Upgrading of Sport Facilities Number of Sport Facilities Upgraded
R 2 712 000
Greening Project Number of trees planted R 258 000
Entrepreneurial Seed Funding Number of SMME's supported R 500 000
Business Retention Expansion Programme
Number of action plans for tourism sector
R 700 000
Investment Attraction Programme Number of projects implemented R 400 000
Small Farmers Support Programme
Number of small farmers supported
R 500 000
SMME Training and Mentorship Number of processes implemented
R 611 000
Tourism Business Training Number of training and mentoring sessions
R 850 000
Tourism Educational Number of educational R 150 000
Tourism Month Tourism month activities R152 000
Township Tourism NEW PROJECT R 400 000
School Awareness NEW PROJECT R 400 000
LTA Projects Number of LTA’s participating R 300 000

205
District Wide Support
Type of support Deliverable Financial Impact
Tourism Events Number of tourism events R 700 000
Sport Tourism Winter Campaign Campaign implemented R 109 000
EPWP Invasive Alien Management Programme
Number of hectares cleared R 2 030 000
HIV/AIDS Programme Number of HIV/AIDS Programmes Implemented
R 233 000
Elderly Number of Active Age programmes implemented
R 415 500
Disabled Number of interventions focussing on improving the mobility of people with disability.
R 1 041 000
Community Support Programme Number of on interventions implemented which focus on the rights of people with disabilities.
R 800 000
Families and Children (Substance Abuse)
Number of Service Level Agreements signed with community based organisations
R 522 500
Sport, Recreation and Culture Programmes
Programmes and support for vulnerable children
R 3 356 000
Youth Number of programmes R 445 500
Women Number of youth development programmes
R 160 000
Sidewalks and Embayment’s Number of sidewalks and Embayment’s completed
R 8 980 000
Road Safety Education Number of Road Safety Education programmes
R 1 148 000
River rehabilitation (EPWP) Hectares cleared R 360 000
Skills Development (EPWP) Number of skills development initiatives implemented
R 200 000
Disaster Risk Assessment Number of community-based risk assessment workshops
R 253 500

206
CHAPTER ELEVEN: MEDIUM TERM REVENUE AND EXPENDITURE FRAMEWORK
11.1 INTRODUCTION
The application of sound financial management principles for the compilation of the Municipality’s financial plan is essentia l and
critical to ensure that the Municipality remains financially viable and that municipal services are provide sustainably, economically
and equitably to all communities.
The Municipality’s business and service delivery priorities were reviewed as part of this year’s planning and budget process. The
municipality also strives to deliver sustainable services to its community without overburdening the consumers with excessive tariffs.
The ten highest risks identified by the strategic planning exercise and approved by Council can be summarised as follows:
Major Risk
Lack of resources
No Firewall security is in place
Not sufficient IP addresses
No ownership for password control
Lack of policies
Weaknesses in the environmental and physical controls
Misstatements in the Annual financial statements
Water quality in the district - river water
Workload on fire fighting vehicles,
Ageing vehicles exhausting maintenance budget.
For each of the above risk areas the municipality has put mitigating measures in place aligned to the specific department in the
budget. These measures will be implemented over the MTREF period.

207
Due to the decreasing Equitable Share Allocation the municipality could not budget for a surplus, which will have a negative effect
on its Accumulated Surplus. In addressing the key considerations contained in National Treasury’s MFMA Circular 74, the following
are highlighted in the budget:
The municipality cut back on capital and operating expenditure related to the upgrading of rural roads (which is the property
of the Provincial Government) to maintain accumulated reserves and ensure long term sustainability of the municipality
Capital projects were spread out over the MTREF to avoid large fluctuations in spending and ensure that priority is given to
projects with high importance
Tariff increases were kept as low as possible to ensure affordability thereof, whilst keeping in mind the cost of delivering
services of a high quality.
The municipality recognizes the importance of cash reserves and therefor strives to maintain a current ratio of not lower than
2.1(Current Assets : Current Liabilities)
In view of the aforementioned, the following table is a consolidated overview of the proposed 2015/2016 Medium-term Revenue and
Expenditure Framework:
OPERATING BUDGET
YEAR EXPENDITURE
INCOME
SURPLUS(-) /DEFICIT
2017 / 2018 406 773 643 -406 773 643 0
2018 / 2019 415 949 492 -415 949 492 0
2019 / 2020 421 572 764 -421 572 764 0

208
Capital Budget:
YEAR EXPENDITURE INCOME SURPLUS(-) /DEFICIT
2017 / 2018 27 469 344 -27 469 344 0
2018 / 2019 16 224 400 -16 224 400 0
2019 / 2020 20 466 200 -20 466 200 0
OPERATING BUDGET – REVENUE
The Cape Winelands District Municipality is reliant on Grant funding as its main source of revenue. This is as a result of the
abolishment of the RSC Levies. National Treasury increases the RSC replacement grant with only 1.88%, 1.04% and 2.94% over
the MTREF period.
The following table reflects the revenue sources for the 2017/2018 to 2019/2020 financial years:

209
Sources of Income 2017/2018 2018/2019 2019/2020 % Inc./- Dec
Interest on Investment (Not Certain) -52 000 000 -54 000 000 -56 000 000 4
Rental of facilities and equipment -131 000 -131 000 -131 000 -
Sales: Training -108 000 -108 000 -10 800 -
Sales: Waste paper -800 -800 -800 -
Sales: Scrap material -100 000 -100 000 -100 000 -
Licence, Permits and Health Certificates -250 000 -250 000 -250 000 -
Electricity income -4 000 -4 000 -4 000 -
Income: Exhibitions -50 000 -50 000 -50 000 -
Tender fees -150 000 -150 000 -150 000 -
Service charges -200 000 -200 000 -200 000 -
Seta refunds -271 000 -271 000 -271 000 -
Public Contirbutions -700 000 -700 000 -700 000 -
EPWP Programme -1 000 000 - - -100
Grants: -227 887 000 -233 590 000 -236 932 000 2.50
- RSC Replacement Grant -220 853 000 -223 157 000 -229 717 000 1.04
- Equitable Share -1 886 000 -2 043 000 -2 143 000 8.32
- LG Finance Management Grant -1 250 000 -1 000 000 -1 000 000 -20.00
- WC Finance Management Grant -240 000 -360 000 - 50.00
- Municipal Systems Improvement Grant - -3 124 000 - 100.00
- CWDM Integrated Transprot Plan -900 000 -900 000 -900 000 -
- Community Development Workers -75 000 -75 000 -75 000 -
- Rural Roads Asset Man, System (Dora) -2 683 000 -2 931 000 -3 097 000 9.24
Working for Water -4 732 000 -4 743 000 -4 743 000 0.23
Roads Agency Function -119 189 843 -121 651 692 -122 030 164 2.07
Total -406 773 643 -415 949 492 -421 572 764 2.26

210
OPERATING BUDGET – EXPENDITURE The table below illustrates the operating Expenditure for 2017/2018 to 2019/2020 financial years:
Expenditure Categories 2017/2018 2018/2019 2019/2020 % Inc./- Dec
Employee Related Costs 201 306 372 210 731 433 217 741 837 4.68
Remuneration of Councillors 11 042 100 11 679 400 12 354 700 5.77
Depreciation 11 055 729 11 055 720 11 055 720 -0.00
Bad debt 2 476 000 86 000 86 000 -96.53
Finance Charges 11 000 9 000 9 000 -18.18
Transfers and Subsidies 8 250 000 10 045 589 7 763 105 21.76
Contracted Services 68 790 261 66 700 759 68 398 649 -3.04
Operational Cost 82 101 757 82 536 392 82 641 899 0.53
Operating leases 429 000 472 000 419 000 10.02
Inventory 21 291 424 22 613 199 21 082 854 6.21
Gains and Losses 20 000 20 000 20 000 -
Total 406 773 643 415 949 492 421 572 764 2.26
EMPLOYEE RELATED COST: Employee related costs Increased with 10.06% from the 2016/2017 financial year opposed to the budgeted increase of 7% due to
the following:
Vacant posts were only budgeted for the period that it will be filled in the 2016/2017 financial year. The same vacant posts have to be budgeted for the full 2017/2018 financial year to ensure funded positions should the posts be filled in the 2016/2017 financial year.
Remuneration of Councilors is budgeted for in terms of the Public Office Bearers Act and the approval of the MEC.

211
OPERATIONAL COST: The increase in Operational Cost is mainly due to the increase in petrol prices and the increases in municipal service accounts. This expenditure consists mainly of maintenance on roads performed by the Road Agency Function and is subject to the fluctuation in the Roads Agency allocation. CAPITAL BUDGET The capital budget decreased from R 27 469 344 in 2017/2018 to R 16 224 400 in 2018/2019. The detail is reflected in Table A5 .
In terms of the MFMA, the Mayor must at least 90 days before commencement of the new financial year, table a draft budget for
consideration. The budget must be approved in May 2015 after the completion of the public participation process. The Annual
Budget of a municipality must be prepared in terms of Section 17 of the MFMA. Council’s Budget must be in line with the
Government’s spending priorities. Key legal provisions are to be Strictly Enforced.
All grants, including national, provincial and local allocations, should be included in the 2017/18 budget of the municipality as reflected under both the revenue and expenditure budget components. A three year capital and operating budgets for 2017/18, 2018/19 and 2019/20 MTREF period should be prepared. Reporting requirements for conditional grants must be satisfied. The budget must be tabled for consultation at least 90 days before the start of the Budget year (Section. (16)(2)) of the MFMA. There must be a clear link between the Budget, IDP and Performance Targets. Municipalities are required to seriously assess their revenue situation and financial health for purposes of determining whether or not they have sufficient revenue and adequate financial stability to fund and deliver on their proposed budget. The Cape Winelands District Municipality will implement a five-year Medium Term Revenue and Expenditure Framework, aligned to the five-year Integrated Development Plan for the 2017/18-2021/22 cycle.

212
11.2 TOTAL ACTUAL BUDGET
2017/2018 2018/2019 2019/2020
Operating Expenditure 373 171 642 378 862 663 385 373 301
Project Expenditure 33 602 000 37 086 829 36 199 463
Sub Total 406 773 643 415 949 492 421 572 764
Capital Expenditure 27 469 344 16 224 400 20 466 200
Total Budget 434 242 987 432 173 892 442 038 964
11.3 COMPARISON BETWEEN THE ADJUSTMENT BUDGET AND THE 2015/2016 BUDGET
Adjustment budget Feb 2017
2017/2018 % Variance
2016/2017
Operating Expenditure 357 837 907 373 171 642 4.2%
Project Expenditure 40 938 090 33 602 000 -17.9%
Sub Total 398 775 997 406 773 643 2%
Capital Expenditure 11 783 917 27 469 344 133%
Total Budget 410 559 914 434 242 987 5.7%
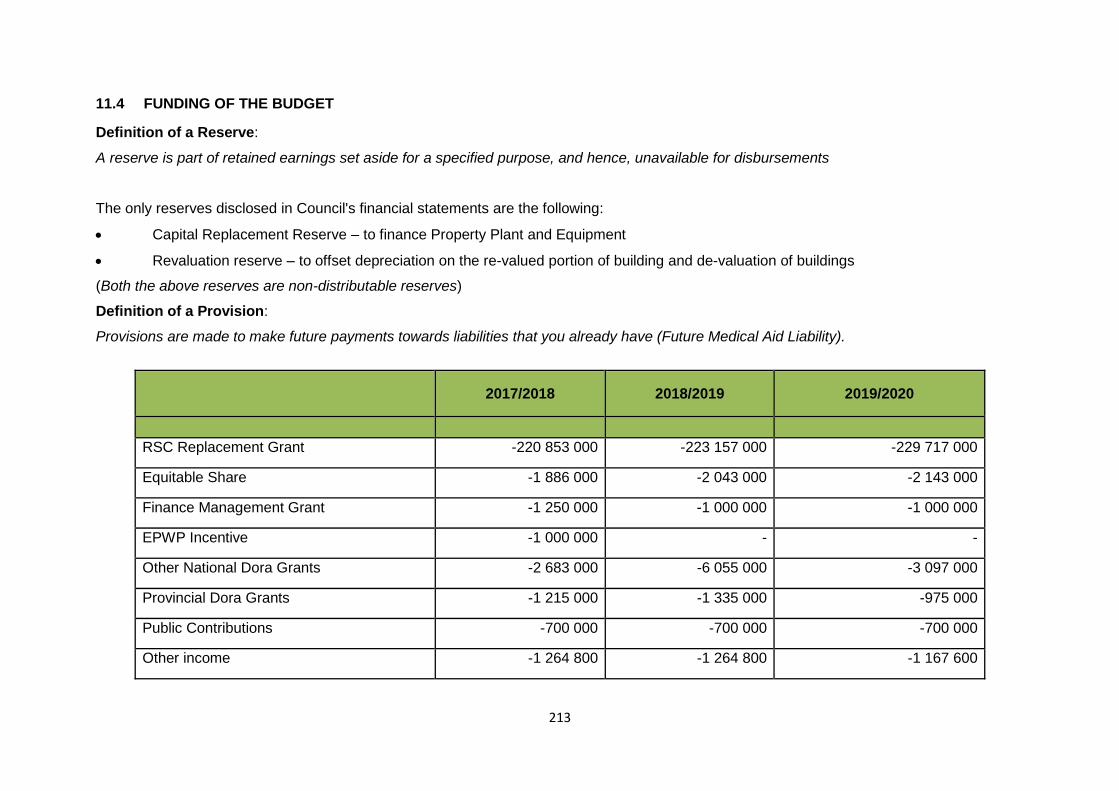
213
11.4 FUNDING OF THE BUDGET
Definition of a Reserve:
A reserve is part of retained earnings set aside for a specified purpose, and hence, unavailable for disbursements
The only reserves disclosed in Council's financial statements are the following:
Capital Replacement Reserve – to finance Property Plant and Equipment
Revaluation reserve – to offset depreciation on the re-valued portion of building and de-valuation of buildings
(Both the above reserves are non-distributable reserves)
Definition of a Provision:
Provisions are made to make future payments towards liabilities that you already have (Future Medical Aid Liability).
2017/2018 2018/2019 2019/2020
RSC Replacement Grant -220 853 000 -223 157 000 -229 717 000
Equitable Share -1 886 000 -2 043 000 -2 143 000
Finance Management Grant -1 250 000 -1 000 000 -1 000 000
EPWP Incentive -1 000 000 - -
Other National Dora Grants -2 683 000 -6 055 000 -3 097 000
Provincial Dora Grants -1 215 000 -1 335 000 -975 000
Public Contributions -700 000 -700 000 -700 000
Other income -1 264 800 -1 264 800 -1 167 600

214
Interest Received -52 000 000 -54 000 000 -56 000 000
Agency Services: -123 921 843 -126 394 692 -126 773 164
Total Budget - 406 773 643 - 415 949 492 -421 572 764

215
11.5 FINANCIAL POSITION
Adjustment Budget Feb2017
2017/2018 2018/2019 2019/2020
Operating Expenditure 398 775 997 406 773 643 415 949 492 421 572 764
Operating Income -398 775 997 -406 773 643 -415 949 492 -421 572 764
(Surplus) / Deficit 0 0 0 0
11.6 LIQUIDITY AND DEBT- EQUITY RATIO’S
Current Ratio = Current Assets / Current Liabilities 2014/15 2015/16 15.49:1 13.42:1 This ratio indicates that Council’s Current Assets exceed its Current Liabilities Cash Ratio = Cash and Cash Equivalents / Current Liabilities 2014/2015 2015/16 14.91:1 12.85:1 This ratio indicates that Council will be able to honour current payments

216
11.7 CAPITAL REPLACEMENT RESERVE FOR THE 2015/2016-2017/2018 MTREF
Capital Replacement Reserve
Adjust. Budget Feb 2017
2017/2018 2018/2019 2019/2020
Opening Balance 69 195 379 63 411 462 41 942 118 31 717 718
Acquisitions for the year (11 783 917)
(27 469 344) (16 224 400) (20 466 200)
Contributions to Reserve
6 000 000 6 000 000 6 000 000 6 000 000
Closing Balance 63 411 462 41 942 118 31 717 718 17 251 518
11.8 KEY PROJECTS
VOTE NUMBER DESCRIPTION FEB 2017 2017/2018 2018/2019 2019/2020 LOCAL ECONOMIC DEVELOPMENT
1 1004 5037 ENTREPRENURIAL SEED FUNDING
452 000 500 000 500 000 500 000
1 1004 5040 SMALL FARMER SUPPORT PROGRAMME
500 000 500 000 500 000 500 000
1 1004 5511 BUSINESS RETENTION EXPANSION PROJECT
700 000 700 000 700 000 700 000
1 1004 1079 INVESTMENT ATTRACTION PROGRAMME
500 000 400 000 400 000 400 000
1 1004 5514 MENTERSHIP PROGRAMME (US)
515 000 611 000 700 000 700 000
2 667 000 2 711 000 2 800 000 2 800 000
TOURISM
1 1103 5306 TOURISM TRAINING 566 000 850 000 850 000 850 000
1 1103 5307 TOURISM MONTH 100 000 152 000 152 000 152 000

217
VOTE NUMBER DESCRIPTION FEB 2017 2017/2018 2018/2019 2019/2020
1 1103 5311 EDUCATIONALS 103 000 150 000 150 000 150 000
1 1103 5412 LTA PROJECTS 150 000 300 000 300 000 300 000
1 1103 5430 SPORT TOURISM WINTER
CAMPAIGN 106 090 109 000 109 000 109 000
1 1103 5440 CULTURE CLINICS - - - -
TOWNSHIP TOURISM 400 000 400 000 400 000
SCHOOL AWARENESS 400 000 400 000 400 000
1 1103 5441 TOURISM EVENTS 500 000 700 000 700 000 700 000
1 525 090 3 061 000 3 061 000 3 061 000
LAND-USE AND SPATIAL PLANNING
1
1521 5140 EPWP INVASIVE ALIEN VEGETATIONMANAGEMENT PROGRAMME
2 030 000 2 030 000 2 030 000 2 030 000
1 1521 4001
RIVER REHABILITATION 360 000 360 000 360 000 360 000
2 390 000 2 390 000 2 390 000 2 390 000
PROJECTS AND HOUSING
1
1330 5102 INFRASTRUCTURE RURAL AREA (REN. ELECT.) FARMERS
700 000 700 000 700 000 700 000
1 1330 5155 PROVISION OF WATER TO
SCHOOLS: COUNCIL 600 000 600 000 600 000 600 000
1 1330 9195 UPGRADING OF RURAL
SPORT FACILITIES 3 300 000 2 712 000 2 712 000 2 712 000
1 1330 5094 CLEARING OF ROAD
RESERVES 1 000 000 1 400 000 1 400 000 1 400 000
5 600 000 5 412 000 5 412 000 5 412 000

218
VOTE NUMBER DESCRIPTION FEB 2017 2017/2018 2018/2019 2019/2020
PUBLIC TRANSPORT REGULATION
1 1615 5018 ROAD SAFETY EDUCATION 1 614 000 1 148 000 1 197 840 1 247 975
1 1615 5179 SIDEWALKS AND EMBAYMENTS
8 000 000 8 980 000 9 249 400 9 526 882
9 614 000 10 128 000 10 447 240 10 774 857
MUNICIPAL HEALTH SERVICE
1
1441 5210 SUBSIDY: WATER/SANITATION - FARMS
1 880 000 1 790 000 1 790 000 1 790 000
1
1441 5219 ANNUAL ENVIRONMENTAL HEALTH EDUC. PROG.
425 000 425 000 425 000 425 000
1 1441 5190 GREENING 508 000 258000 258000 258000
2 813 000 2 473 000 2 473 000 2 473 000
DISASTER MANAGEMENT
1 1610 0449 REVISION OF RISK ASSESSMENT
250 000
253 500 253 500 253 500
250 000 253 500 235 500 253 500
SOCIAL DEVELOPMENT
1 1475 5203 HIV/AIDS PROJECTS 500 000 233 000 248 400 263 600
1 1475 1115 ELDERLY 1 000 000 415 500 393 100 403 400
1 1475 1118 FAMILIES AND CHILDREN (substance abuse)
1 900 000 522 500 553 500 584 000
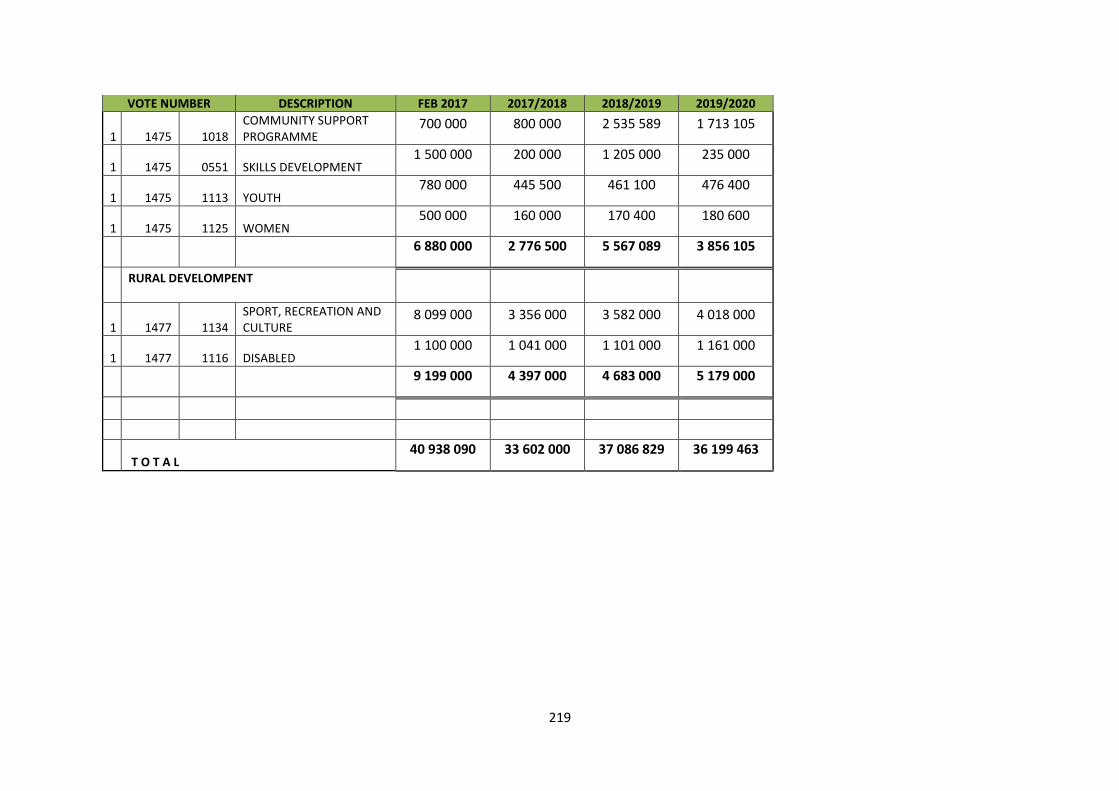
219
VOTE NUMBER DESCRIPTION FEB 2017 2017/2018 2018/2019 2019/2020
1 1475 1018 COMMUNITY SUPPORT PROGRAMME
700 000 800 000 2 535 589 1 713 105
1 1475 0551 SKILLS DEVELOPMENT 1 500 000 200 000 1 205 000 235 000
1 1475 1113 YOUTH 780 000 445 500 461 100 476 400
1 1475 1125 WOMEN 500 000 160 000 170 400 180 600
6 880 000 2 776 500 5 567 089 3 856 105
RURAL DEVELOMPENT
1 1477 1134 SPORT, RECREATION AND CULTURE
8 099 000 3 356 000 3 582 000 4 018 000
1 1477 1116 DISABLED 1 100 000 1 041 000 1 101 000 1 161 000
9 199 000 4 397 000 4 683 000 5 179 000
T O T A L 40 938 090 33 602 000 37 086 829 36 199 463

220
11.9 AREAS OF POTENTIAL SAVING
There is a strong strategic understanding that Cape Winelands District Municipality must
exercise its functions as a Planning and Co-ordinating authority and not as an Executing
authority. Therefore, these areas of potential savings must be contextualized accordingly:
Council should concentrate on performing its own functions;
Stop funding the functions of other state departments;
Don’t spend funds on unnecessary items such as:
Catering for meetings between officials and officials and councillors;
Excessive traveling; and
Replacement of old office furniture still in good condition.
Save on Salary Bill;
Co-operational agreements between councils;
Excessive use of stationary;
Decrease the use of consultants;
Attend only necessary congresses; and
Alienate under-utilized buildings.

221
CHAPTER TWELVE: MONITORING AND EVALUATION.
CWDM Performance Calendar – 2016/17 Financial Year:
No Activity Responsible Person Action Due Date
4 IDP Update IDP Office January/February 2017
5 Budget Review Finance February/March 2017
6 Review of Organisational KPI PMS Office March/April 2017
7 Individual Scorecards Review PMS
Office/Management
April/May 2017
8 Organisational KPI (SDBIP)
Finalisation and Approval
Mayor 30 April 2017
9 Budget approval Council 30 April 2017
10 IDP Approval Council 30 April 2017
11 Performance Agreements reviewed,
signed by Executive Management and
approved by Mayor
Municipal
Manager/Executive
Directors/Mayor
31 May 2017
12 Monthly Monitoring of Performance
(including update of SAMRAS)
PMS Office Monthly effective 1
July 2017
13 Quarterly Performance Reporting PMS Office 15th day following the
end of the quarter:
September 2017
December 2017
March 2018
June 2018
14 Quarterly Performance Report to
Council
PMS Office At the end of each
quarter (1st following
Council meeting):
September 2017
December 2017
March 2018
June 2018
15 Internal Audit Report on Performance
Management System
Chief Audit
Executive/Internal
Audit
Internal audit each
quarter:
September 2017
December 2017
March 2018
June 2018
16 Revisit budget and link to SDBIP PMS Office/Finance December
2017/January 2018
17 Annual Performance Report PMS Office 31 August 2017
18 Oversight Report to Council MPAC January 2018

222
CHAPTER THIRTEEN: IDP/BUDGET/PMS LINK
13.1 PREDETERMINED DEVELOPMENT OBJECTIVES (IDP) LINK TO SDBIP AND
PMS
Background
The Service Delivery and Budget Implementation Plan (SDBIP) seek to promote municipal accountability and transparency and is an important instrument for service delivery and budgetary monitoring and evaluation. The SDBIP is a partnership contract between the administration, council and community, which expresses the goals and objectives, set by the council as quantifiable outcomes that can be implemented by the administration over the next financial year as illustrated in Diagram 1.
Section 1 of the MFMA defines the SDBIP as: A detailed plan approved by the mayor of a municipality in terms of section 53(1)(c)(ii) for implementing the municipality’s delivery of services and the execution of its annual budget and which must include (as part of the top-layer) the following:
Projections for each month of-
Revenue to be collected, by source, and
Operational and capital expenditure, by vote;
Service delivery targets and performance indicators for each quarter.
In terms of National Treasury’s Circular No. 13 the SDBIP must provide a picture of service delivery areas, budget allocations and enable monitoring and evaluation. It specifically requires the SDBIP to include;
Monthly projections of revenue to be collected for each source;
Monthly projections of expenditure (operating and capital) and revenue for each vote;
Council Administration
SDBIP
Service Delivery
Targets
Performance
Indicators
Revenue and
IDP
BUDGET
Monthly Reports
Mid-Year Performance
Assessment
Annual Report
Employee Contracts
and Annual
Performance
Agreements for the
Municipal Manager
and Senior Managers

223
Quarterly projections of service delivery targets and performance indicators for each vote;
Information for expenditure and delivery; and
Detailed capital works plan.
In terms of Sections 69(3)(a) and (b) of the MFMA the accounting officer of a municipality must submit to the Mayor within 14 days after the approval of an annual budget, a draft SDBIP for the budget year and drafts of the annual performance agreements as required in terms of section 57(1)(b) of the Municipal Systems Act (MSA) for the municipal manager and all senior managers. Furthermore, according to Section 53(1)(c)(ii) and (iii) of the MFMA, the Executive Mayor is expected to approve the SDBIP within 28 days after the approval of the budget.
This coincides with the need to table at Council, drafts of the annual performance agreements for the municipal manager and all senior managers as required in terms of Section 57(1)(b) of the MSA. The budget implementation section of the SDBIP is categorised in terms of Votes as prescribed by the MFMA, In case of the CWDM, Votes indicate a budget allocation for Core Administration as per Strategic Objective.
Regional Development and Planning;
Community and Development Services;
Corporate Services;
Office of the Municipal Manager;
Rural and Social Development;
Financial Services;
Engineering and Infrastructure; and
Roads Agency.
Framework for Managing Performance Information: Key Concepts:
Monitoring and assessment of outcomes and impacts take cognizance that government interventions can also have unintended consequences. These also need to be identified and monitored so that risks can be managed and corrective action can be taken. In managing for results, budgets are developed in relation to inputs, activities and outputs, while the aim is to manage towards achieving the outcomes and impacts.

224
The figure below illustrates the relationship between these core performance information concepts.
Auditor General (AG) interest in Performance Management System when auditing
AFS (Annual Financial Statements):
Auditing of predetermined objectives can be defined as:
An annual audit of reported actual performance against predetermined objectives, indicators and targets. This is an integral part of the annual regularity audit, confirming the credibility of the reported performance information in the annual performance report.
The figure below illustrates the relationship between;
The predetermined objectives, key performance indicators and targets (the IDP) as well as the actual achievements of council against these indicators and targets in the IDP (Annual Report) link to a system to measure performance (PMS) delivery. This approach emphasises planning and managing a focus on desired results, and managing inputs and activities to achieve these results.
IMPACTS
OUTCOMES
OUTPUTS
INPUTS
ACTIVITIES
The developmental results of achieving
specific outcomes
The medium-term results for specific
beneficiaries that are the consequence
of achieving specific outputs
The final products, or goods and
services produced for delivery
The processes or actions that use a
range of inputs to produce the desired
outputs and ultimately outcomes
The resources that contribute to
the production and delivery of
outputs
What we use to do the work?
What we do?
What we produce or deliver?
What we wish to achieve?
What we aim to change?
Plan, budget,
implement and
monitor
Manage towards
achieving these
results

225
13.2 PLANNING, BUDGETING AND REPORTING
The performance information reported in accountability documents enables Council and the public to track government performance, and to hold the individual accountable. Performance information also needs to be available to managers at each stage of the planning, budgeting and reporting cycle so that they can adopt a results-based approach to managing service
The next table below illustrates the accountability reports of local government:
Accountability Cycle Accountability Documents Performance Information
Policy development Policy documents
Explanatory memoranda accompanying ordinances
Identify baseline information policy
Set out desired effects of policy
Strategic planning IDP Indicate outputs to be produced
Specify performance indicators
Operational planning Municipal budget
SDBIP
Performance agreements
Set performance targets
Indicate available resources
Allocate responsibilities
Implementation and in-year reporting
Monthly budget statements
Mid-year budget and performance assessments
Report progress with implementation of plans and budgets
End-year reporting Annual reports Report on performance against plans and budgets
0
Crux of PMS
Community / Public
IDP
Annual Report /
Integrated
Reporting
Performance Management System (PMS)
CWDM Administration
• Policy / Framework
• Processes / Templates
• Reporting – Communication
and monitoring
Auditor General (AG) interest in PMS as part of AFS review
IDP
Annual Report /
Integrated
Reporting
Performance Management System (PMS)
CWDM Administration
• Policy / Framework
• Processes / Templates
• Reporting – Communication
and monitoring
Auditor General (AG) interest in PMS as part of AFS review
Community / Public
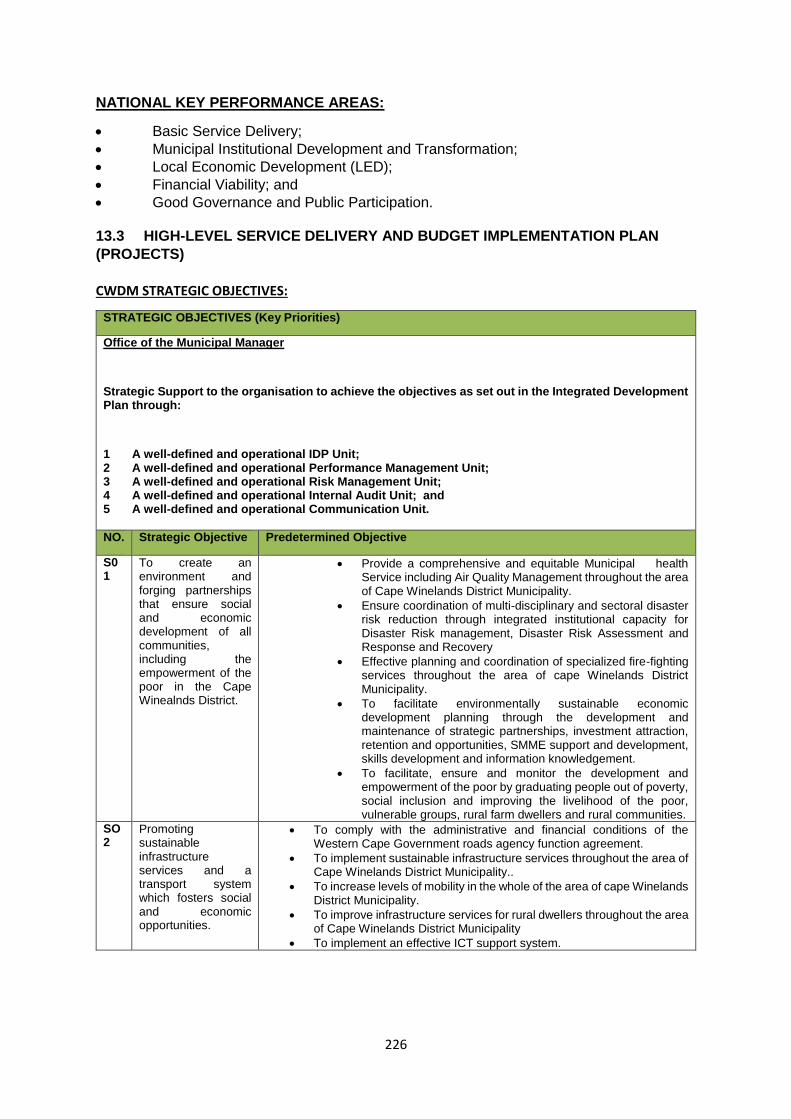
226
NATIONAL KEY PERFORMANCE AREAS:
Basic Service Delivery;
Municipal Institutional Development and Transformation;
Local Economic Development (LED);
Financial Viability; and
Good Governance and Public Participation. 13.3 HIGH-LEVEL SERVICE DELIVERY AND BUDGET IMPLEMENTATION PLAN
(PROJECTS)
CWDM STRATEGIC OBJECTIVES:
STRATEGIC OBJECTIVES (Key Priorities)
Office of the Municipal Manager
Strategic Support to the organisation to achieve the objectives as set out in the Integrated Development Plan through:
1 A well-defined and operational IDP Unit; 2 A well-defined and operational Performance Management Unit; 3 A well-defined and operational Risk Management Unit; 4 A well-defined and operational Internal Audit Unit; and 5 A well-defined and operational Communication Unit.
NO. Strategic Objective Predetermined Objective
S0 1
To create an environment and forging partnerships that ensure social and economic development of all communities, including the empowerment of the poor in the Cape Winealnds District.
Provide a comprehensive and equitable Municipal health Service including Air Quality Management throughout the area of Cape Winelands District Municipality.
Ensure coordination of multi-disciplinary and sectoral disaster risk reduction through integrated institutional capacity for Disaster Risk management, Disaster Risk Assessment and Response and Recovery
Effective planning and coordination of specialized fire-fighting services throughout the area of cape Winelands District Municipality.
To facilitate environmentally sustainable economic development planning through the development and maintenance of strategic partnerships, investment attraction, retention and opportunities, SMME support and development, skills development and information knowledgement.
To facilitate, ensure and monitor the development and empowerment of the poor by graduating people out of poverty, social inclusion and improving the livelihood of the poor, vulnerable groups, rural farm dwellers and rural communities.
SO 2
Promoting sustainable infrastructure services and a transport system which fosters social and economic opportunities.
To comply with the administrative and financial conditions of the Western Cape Government roads agency function agreement.
To implement sustainable infrastructure services throughout the area of Cape Winelands District Municipality..
To increase levels of mobility in the whole of the area of cape Winelands District Municipality.
To improve infrastructure services for rural dwellers throughout the area of Cape Winelands District Municipality
To implement an effective ICT support system.

227
S0 3
Providing effective and efficient financial and strategic support services to the Cape Winelands District Municipality.
1. To facilitate and enhance sound financial support services. 2. To strengthen and promote participative and accountable Governance. 3. To facilitate and enhance sound strategic support services.

228
CWDM SO
CWDM PDO
Project ID Nat. KPI Project Name Vote Number
Budget 2016/17
Unit of Measurement Target per Financial Year
17/18 18/19 19/20
STRATEGIC OBJECTIVE – 1: To create an environment and forge partnerships that ensures the health, safety, social and economic development of all communities including the empowerment of the poor in the Cape Winelands District through economic, environmental and social infrastructure investment.
1 1.1 1.a 1 Subsidies – Water & Sanitation
114415210 R 1 880 000 Number of farms serviced (44). Educational’s (20, Q4)
69 69 69
1 1.1 1.b 1 Environmental Health Education
114415219 R 425 000 Number of theatre performances
60 60 60
1 1.1 1.c 1 Greening Project 114415590 R 258 000 Number of trees planted 1200 1200 1200
1 1.2 1.d 5 Risk Assessment 116100449 R 250 000 Number of community-based risk assessment profiles
10 10 10
1 1.4 1.e 5 River Rehabilitation (EPWP)
115214001 R 360 000 Hectares Cleared 100 100 100
1 1.4 1.f 5 Entrepreneurial Seed Funding
110045037 R 500 000 Number of SMME's supported
20 20 20
1 1.4 1.g 3 Business Retention Expansion Programme
110045511 R 700 000 Number of action plans for tourism sector
13 13 13
1 1.4 1.h 3 Investment Attraction Programme
110041079 R 400 000 Number of projects implemented
2 2 2
1 1.4 1.i 3 Small Farmers Support Programme
110045040 R 500 000 Number of small farmers supported financially
6 6 6
1 1.4 1.j 3 SMME Training and Mentorship
110045514 R 495 000 M&E Report 4 4 4

229
1 1.4 1.k 3 Tourism Month 111035307 R 100 000 Tourism month activities 2 2 2
1 1.4 1.l 3
Tourism Business Training
111035306 R 566 000 Number of training and mentoring sessions
6 6 6
1 1.4 1.m 3 Tourism Educational 111035311 R 103 000 Number of educationals 6 6 6
1 1.4 1.n 3 LTA Projects 111035412 R 150 000 Number of LTA’s participating
15 15 15
1 1.4 1.o 3 Tourism Events 111035441 R 500 000 Number of tourism events 25 25 25
1 1.4 1.p 3 Sport Tourism Winter Campaign
111035430 R 106 090 Campaign implemented 1 1 1
1 1.4 1.r 3 EPWP Invasive Alien Management Programme
115215140 R 1 030 000 Number of hectares cleared
400 400 400
1 1.5 1.s 1 HIV/AIDS Programme 114755203 R 250 000 Number of HIV/AIDS Programmes Implemented
10 10 10
1 1.5 1.t 1
Artisan Skills Development (Youth and Women) EPWP
114750551 R 800 000 Number of skills development initiatives implemented
3 3 3
1 1.5 1.u 1 Elderly 114751115 R 500 000 Number of Active Age programmes implemented
10 10 10
1 1.5 1.v 1 Disabled 114771116 R 600 000 Number of interventions focussing on improving the mobility of people with disability and the rights of people with disabilities.
5 5 5
1 1.5 1.w 1 Community Support Programme
114751018 R 700 000
Number of Service Level Agreements signed with community based organisations
46 46 46

230
1 1.5 1.x 1 Families and Children (Substance Abuse)
114751118 R900 000 Programmes and support for vulnerable children
30 30 30
1 1.5 1.y 1 Sport, Recreation and Culture Programmes
114771134 R 3 499 000 Number of programmes 50 50 50
1 1.5 1.y.1 1 Youth 114751113 R 500 000 Number of youth development programmes
10 10 10
1 1.5 1.y.2 1 Women 114751125 R 250 000 Number awareness programmes
6 6 6
STRATEGIC OBJECTIVE – 2: Promoting sustainable infrastructure services and a transport system which fosters social and economic opportunities.
2 2.1 1.z 3 Clearing Road Reserves
113305094 R 1 400 000 Kilometres of road reserve cleared
550 550 550
2 2.2 1.aa 3 Upgrading Infrastructure at various Schools
116155017 R 0 Number Sidewalks/embayment’s completed.
2 2 0
2 2.1 1.bb 3 Road Safety Education 116155018 R 1 114 000 Number of Road Safety Education Programmes/events
1 1 1
2 2.2 1.dd 3 Provision of Water to Schools
113305155 R 849 000 Number of Schools 4 4 4
2 2.4 1.ee 3 Renewable Infrastructure – Rural Areas
113305102 R 2 000 000 Number of solar systems supplied to farmers
250 250 250
2 2.4 1.ff 3 Upgrading of Sport Facilities
113309195 R 2 700 000 Number of Sport Facilities Upgraded
9 9 9
2 2.4 1.ff.1 3 Upgrading entrances to towns (Fencing)
R 0 Meters completed 0 200 0
2 2.3 1.hh 3 Sidewalks and Embayment’s
116155179 R 8 500 000 Number of sidewalks and embayment’s completed
2 2 3
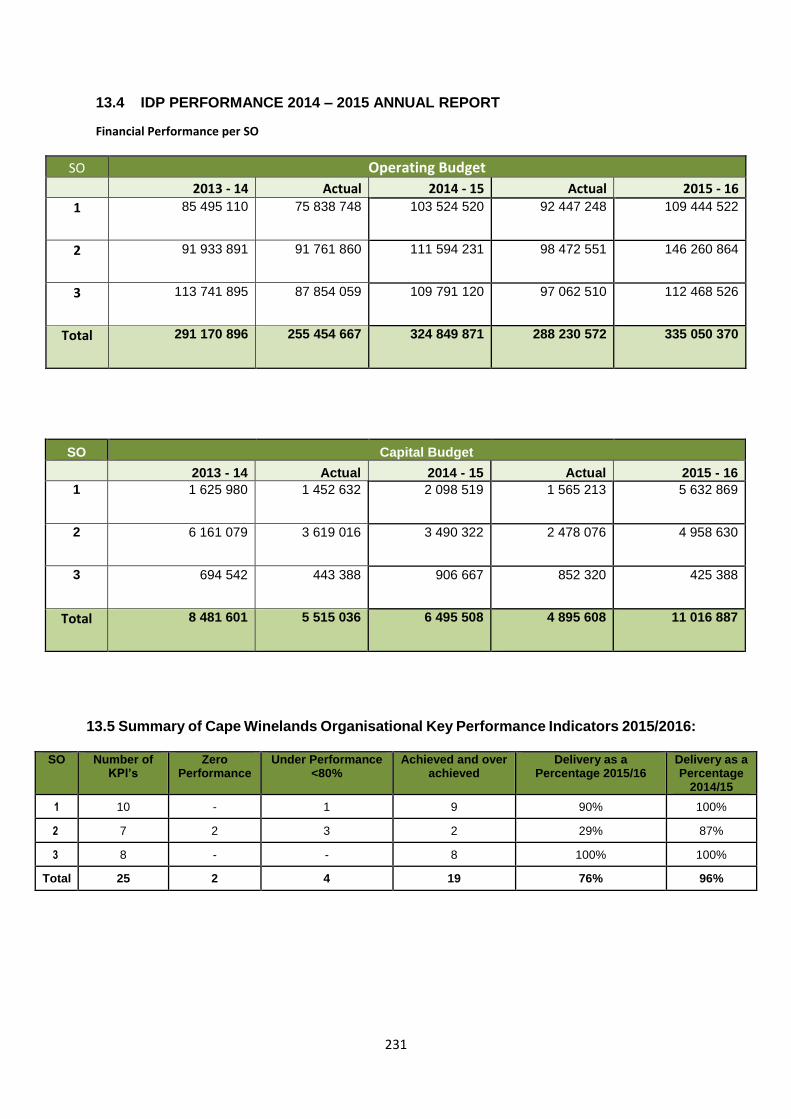
231
13.4 IDP PERFORMANCE 2014 – 2015 ANNUAL REPORT
Financial Performance per SO
13.5 Summary of Cape Winelands Organisational Key Performance Indicators 2015/2016:
SO
Number of
KPI’s Zero
Performance Under Performance
<80% Achieved and over
achieved Delivery as a
Percentage 2015/16 Delivery as a Percentage
2014/15
1 10 - 1 9 90% 100%
2 7 2 3 2 29% 87%
3 8 - - 8 100% 100%
Total 25 2 4 19 76% 96%
SO Operating Budget
2013 - 14 Actual 2014 - 15 Actual 2015 - 16
1 85 495 110 75 838 748 103 524 520 92 447 248 109 444 522
2 91 933 891 91 761 860 111 594 231 98 472 551 146 260 864
3 113 741 895 87 854 059 109 791 120 97 062 510 112 468 526
Total 291 170 896 255 454 667 324 849 871 288 230 572 335 050 370
SO Capital Budget
2013 - 14 Actual 2014 - 15 Actual 2015 - 16
1 1 625 980 1 452 632 2 098 519 1 565 213 5 632 869
2 6 161 079
3 619 016
3 490 322 2 478 076 4 958 630
3 694 542 443 388 906 667 852 320 425 388
Total 8 481 601 5 515 036 6 495 508 4 895 608 11 016 887

232
Annexures:
Annexure A: Cape Winelands Agri Parks
Annexure B: Integrated Water Service Master Plan
Annexure C: Process Plan/Time frame of SDF
Annexure D: Cape Winelands Disability Conference Report
Annexure E: CWD Integrated Transport Plan
Annexure F: Individual Performance Management Policy
Annexure G: Framework for a draft Climate Change Responds Strategy
Annexure H: Disaster Management Risk Plan