capacity of airport passenger buildingsaviation.itu.edu.tr/img/aviation/datafiles/lecture...
TRANSCRIPT

Capacity of Airport Passenger BuildingsProf. Richard de Neufville
Airport Planning and Management
Module 16
January 2016
Istanbul Technical University
Air Transportation Management
M.Sc. Program Capacity of Airport Passenger Buildings RdN ©

Capacity of Airport Passenger Buildings RdN ©
Defining Capacity of
Airport Passenger Buildings
Objectives: To Present and Explain “Capacity” of Terminals
Describe latest IATA recommendations
Topics Concepts of Capacity
Design Tradeoff: Levels of Service (LOS) <-> Cost
IATA LOS Standards (traditional and 2004 Versions)
IATA 2014 Recommendations
Importance of “Dwell Time”
Flow Standards
Summary of KEY POINTS
Capacity of Airport Passenger Buildings RdN ©
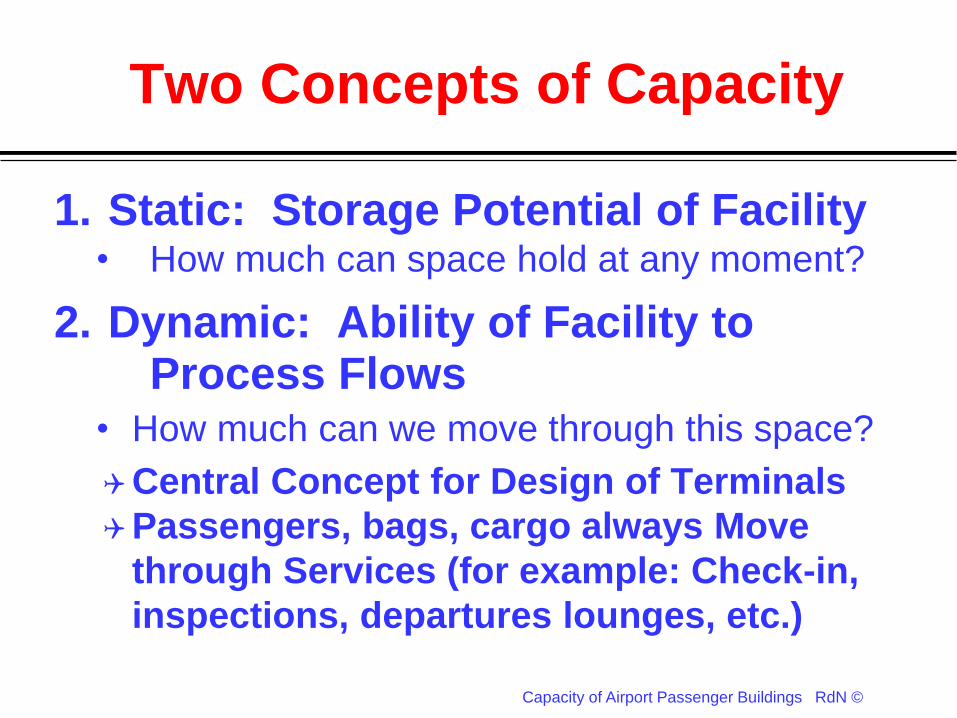
Two Concepts of Capacity
1. Static: Storage Potential of Facility• How much can space hold at any moment?
2. Dynamic: Ability of Facility to Process Flows
• How much can we move through this space?
Central Concept for Design of Terminals
Passengers, bags, cargo always Move
through Services (for example: Check-in,
inspections, departures lounges, etc.)

Capacity of Airport Passenger Buildings RdN ©
Dynamic Capacity
Dynamic Capacity can be:1. Sustained: Flow over a significant period
Example: 3 or 4 hours morning departure of
hub-based aircraft, as at Singapore
2. Maximum: Flow over a brief peak period
Example: passengers of 1 A380 at customs
Why this difference?
Because:
• Delays are what makes flow uncomfortable
• It takes time for queues to build up

Capacity of Airport Passenger Buildings RdN ©
Dynamic Capacity is variable
Dynamic Capacity not a fixed amount!
Differs from definite Static Capacity
See demo with glass
It depends on “Level of Service”, its quality.
Delays – when traffic is high, queues and
delays build up, system seems ‘full’, even if
more could jam in
Unreliability – queues vary, service then
unreliable, unsuitable for hub connections
Crowding – example: what is bus capacity?

Capacity of Airport Passenger Buildings RdN ©
Basic Queuing Diagram: Delays
Delays ~ 1/rho
Rho = ratio of actual load to nominal maximum capacity
As loads on system increase, average delay increases exponentially
So practical capacity = less than nominal maximum
Caveat: this is steady-state, “sustained” situation…
Ave
rag
e D
ela
y
Rho = 1.0

Capacity of Airport Passenger Buildings RdN ©
Basic Queuing: Reliability
Moreover, variance in
delays ~ 1/rho
Variance in delays increases with 1/rho
System thus becomes less reliable
To insure meeting deadline (aircraft departure), reduce rho
Denver Example: rho max ~ 40% for sustainable bag transfer system at this hub
Ave
rag
e D
ela
y
Rho = 1.0

Capacity of Airport Passenger Buildings RdN ©
Central Concepts for Design
“Capacity” determined by
acceptable “Level of Service” (LOS)
Acceptable LOS depends on clientPremium Passengers demand better LOS
LCC Passengers satisfied with lower LOS
Design is tradeoff betweenCost of facility against benefits of reduced
delays and crowding
IATA recommends: balanced design
Capacity of Airport Passenger Buildings RdN ©
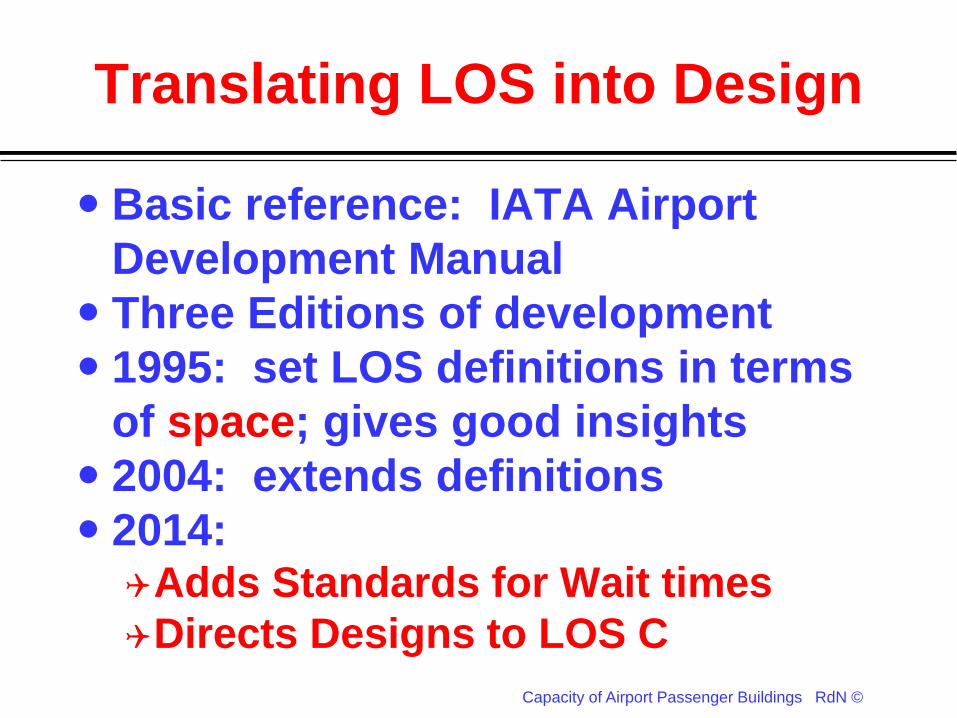
Translating LOS into Design
Basic reference: IATA Airport
Development Manual
Three Editions of development
1995: set LOS definitions in terms
of space; gives good insights
2004: extends definitions
2014: Adds Standards for Wait times
Directs Designs to LOS C

Capacity of Airport Passenger Buildings RdN ©
Level of Service Descriptions
6 Categories: A (best) to F (unacceptable)
These describe Quality of Service based on
Ease of Flow and Quality of Delays
Traditional view, presented by IATA (Airport
Development Manual):
LOS Flows Delays Comfort
A - Excellent Free None Excellent
B - High Stable Very Few High
C - Good Stable Acceptable Good
D - Adequate Unstable Passable Adequate
E - Inadequate Unstable Unacceptable Inadequate
F - Unacceptable --- System Breakdown --- Unacceptable

Capacity of Airport Passenger Buildings RdN ©
IATA LOS Space Standards(1995 version: Airport Development Manual, 8th ed.)
Traditional view states LOS standards entirely
in term of space: square meters per person
Left to right: less space means lower LOS
Top to bottom: more space necessary when
people are moving and have bags
Area A B C D E F
Wait/circulate 2.7 2.3 1.9 1.5 1.0
Bag Claim 2.0 1.8 1.6 1.4 1.2
Check-in Queue 1.8 1.6 1.4 1.2 1.0
Hold-roomInspection
1.4 1.2 1.0 0.8 0.6
Capacity of Airport Passenger Buildings RdN ©
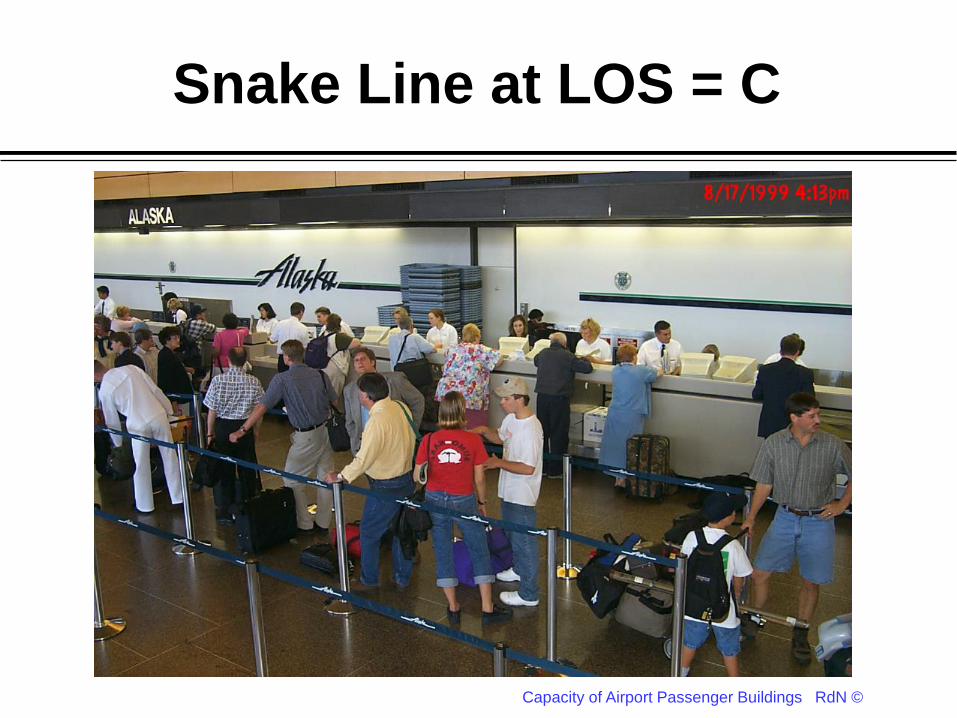
Snake Line at LOS = C

Capacity of Airport Passenger Buildings RdN ©
Snake line at LOS = E

Capacity of Airport Passenger Buildings RdN ©
LOS provided by any space varies
Example Distribution from Toronto
Poor LOS OK for short periods

Capacity of Airport Passenger Buildings RdN ©
IATA Standards: Wait / Circulate(2004 version: Airport Development Manual, 9th ed.)
Old:
New:
Distinguishes locations, likelihood of carts
References speed
Square meters / Passenger for Level of Service
A B C D E
2.7 2.3 1.9 1.5 1.0
Location Carts Space M2/pax
Speed m / sec
Airside None 1.5 1.3
After check-in Few 1.8 1.1
Departure area many 2.3 0.9
Capacity of Airport Passenger Buildings RdN ©
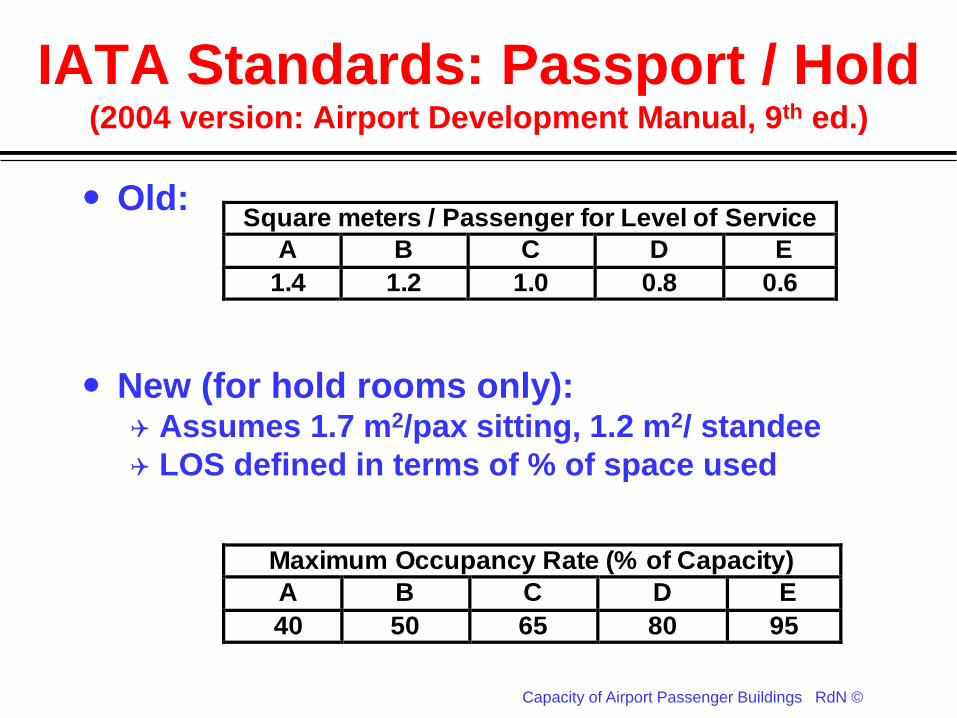
IATA Standards: Passport / Hold(2004 version: Airport Development Manual, 9th ed.)
Old:
New (for hold rooms only): Assumes 1.7 m2/pax sitting, 1.2 m2/ standee
LOS defined in terms of % of space used
Square meters / Passenger for Level of Service
A B C D E
1.4 1.2 1.0 0.8 0.6
Maximum Occupancy Rate (% of Capacity)
A B C D E
40 50 65 80 95

Capacity of Airport Passenger Buildings RdN ©
IATA Standards: Bag Claim Area(2004 version: Airport Development Manual, 9th ed.)
Old:
New:
Assumes 40% of Passengers use carts
Has a wider range: more for A, less for E
Square meters / Passenger for Level of Service
A B C D E
2.0 1.8 1.6 1.4 1.4
Square meters / Passenger for Level of Service
A B C D E
2.6 2.0 1.7 1.3 1.0

Capacity of Airport Passenger Buildings RdN ©
IATA Standards: Check-in Area(2004 version: Airport Development Manual, 9th ed.)
Old:
New:
Reflects impact of number of bags, carts
Square meters / Passenger for Level of Service
A B C D E
1.8 1.6 1.4 1.2 1.0
Square meters / Passenger for Level of Service Row width
Carts bags A B C D E
few 1.7 1.4 1.2 1.1 0.9 1.2m
more 1.8 1.5 1.3 1.2 1.1
high 2.3 1.9 1.7 1.6 1.5 1.4 m
heavy 2.6 2.3 2.0 1.9 1.8

Capacity of Airport Passenger Buildings RdN ©
2014 IATA LOS Standards(Airport Development Manual, 10th ed.)
2 important contributions: Adds standards for waiting time
Directs designers to LOS “C”
Idea is to replace previous versions.
Instead of tables, it proposes a
computer simulation – Unfortunately
this is not transparent, so designers
have no easy way to check!
Thus old standards still useful!

Capacity of Airport Passenger Buildings RdN ©
2014 IATA LOS Time Standards
Sets waiting time standardsFor areas (departure halls, check-in, security,
immigration, bag claim) as for space standards
For two classes: Economy ; Business/First
For example, for economy check-inLOS A, B: Wait time < 10 minutes
LOS C: Wait time between 10 to 20 minutes
LOS D, E: Wait time > 20 minutes
Note: Wait times must be estimated
by simulation! Not verifiable on
plans!

Capacity of Airport Passenger Buildings RdN ©
2014 IATA LOS Space-Time Matrix
Source: BrightTALK “Optimise your airport resources with the new Level of Service
Concept” 1 December 2015
Translating the
code:
“optimum” =
LOS C
“over design” =
LOS A or B
“sub optimum” =
LOS D or E
IDEA IS TO
FOCUS
DESIGNERS ON
GOOD SERVICE
WITHOUT BEING
EXTRAVAGANT

Capacity of Airport Passenger Buildings RdN ©
2014 IATA LOS References
IATA Airport Development Manual,
10th edition, 2014 (list price US$900)Gives complete tables for wait time standards
BrightTALK Dec. 2015 sales pitch
presentation by IATA consultants:
https://www.brighttalk.com/webcast/10625/173
423?autoclick=true&utm_source=brighttalk-
recommend&utm_campaign=network_weekly_
email&utm_medium=email&utm_content=colla
b

Capacity of Airport Passenger Buildings RdN ©
Dwell Time Concept
Determines Capacity of any space or process
A Central Concept: Source of Major Problems
Is Average Time a body is in a space or process
When a person leaves a space, Replacement can use it
As people move fasterDwell time is shorterMore replacements can use space in any
period

Capacity of Airport Passenger Buildings RdN ©
Formula for Space Required
Space Required, sq. meters =(Load, pers./hour) (Std, sq.m./person) (Dwell
time, hours)
= (Persons/Time) (Area/Person) (Time) = Area
Example (from Australia):
What space required for passport control of
2000 passengers/hour when maximum wait is
20 minutes? Their answer: 2000 sq. m.
Space Needed = 2000 (1) (1/3) = 667 sq. m.

Capacity of Airport Passenger Buildings RdN ©
Formula for Capacity of a Space
Load, persons per hour =(Space, sq. m.) / (Std, sq. m. per pers)(Dwell time, hrs)
Examples: What is the recommended load (LOS =C) for a
waiting room 30x50m, in which transit passengers
average 90 minutes?Recommended load = (30) (50) / (1.9) (1.5) = 1500 / 2.85 = 527
What is crush capacity (LOS = D) of same space?
Crush load = (30) (50) / (1.5) (1.5) = 667 pers. per hr.

Capacity of Airport Passenger Buildings RdN ©
Flow Standards
Level of Service StandardType of
Passageway A B C D E F
Corridor 10 12.5 20 28 37 More
Stairs 8 10 12.5 20 20 More
In terms of PMM = Persons/Minute/Meter

Capacity of Airport Passenger Buildings RdN ©
Assumptions of Flow Standards
Two Factors1. Space per Person
e.g.: 1.9 sq. m. per person for LOS = C
2. Walking Speede.g.: 66 meters/min = 4 km/hour=> Low Dwell Time => High Capacity
Example:Capacity of Corridor, 5m. wide, 40m. long
Dwell time = 40 / 4000 = 0.01 hour
Recommended Load, persons per hour
= (5) (20) / (1.9) (0.01) = 5,000
Capacity of Airport Passenger Buildings RdN ©
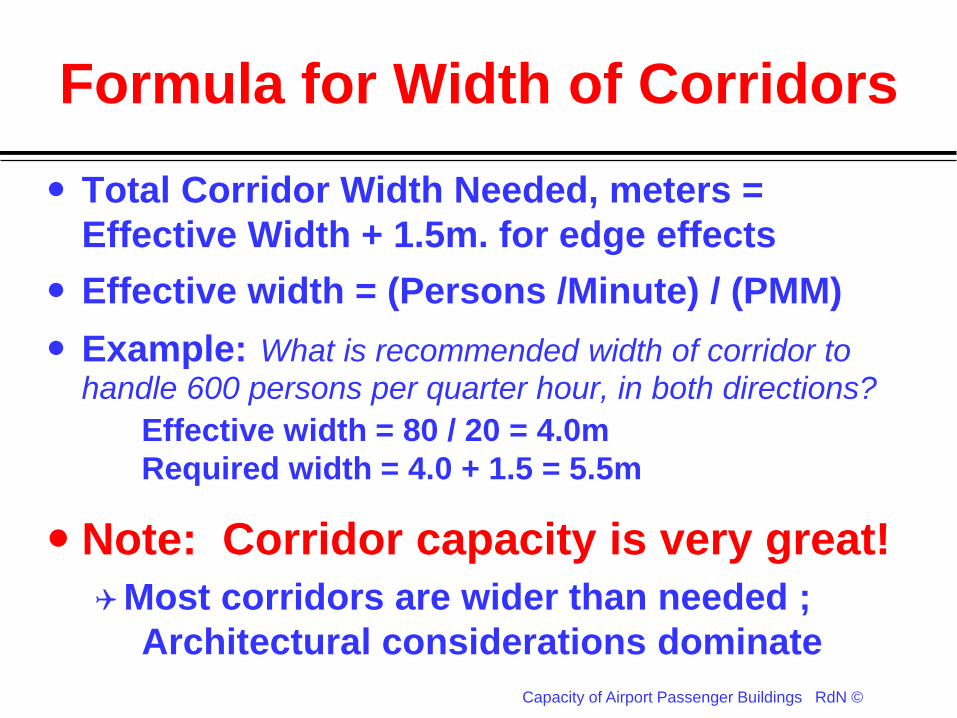
Formula for Width of Corridors
Total Corridor Width Needed, meters =
Effective Width + 1.5m. for edge effects
Effective width = (Persons /Minute) / (PMM)
Example: What is recommended width of corridor to
handle 600 persons per quarter hour, in both directions?
Effective width = 80 / 20 = 4.0m
Required width = 4.0 + 1.5 = 5.5m
Note: Corridor capacity is very great!
Most corridors are wider than needed ;
Architectural considerations dominate

Capacity of Airport Passenger Buildings RdN ©
Why Snake Queues?
What is a Snake Queue? (S-band)1 longer line (leading to many servers)
instead of many lines, one for each server
Why might this be better?No one stuck behind long delay for a server
Why might be worse? Long line does not look attractive
Wasted time going from head of queue to open
server (can be fixed by pre-positioning of one
or two persons in front of each server)

Capacity of Airport Passenger Buildings RdN ©
Snake Queue issues
Snake Queue can reduce average service
rate by servers. Why is that?
Think about how process works: Customer served
Agent signals for new customer from snake queue
New customer does not notice right away, then
takes time to get to agent…
How do we solve issue?
Small one or two person queues between
agent and snake queue – becoming
standard for US, Canadian immigration
Capacity of Airport Passenger Buildings RdN ©
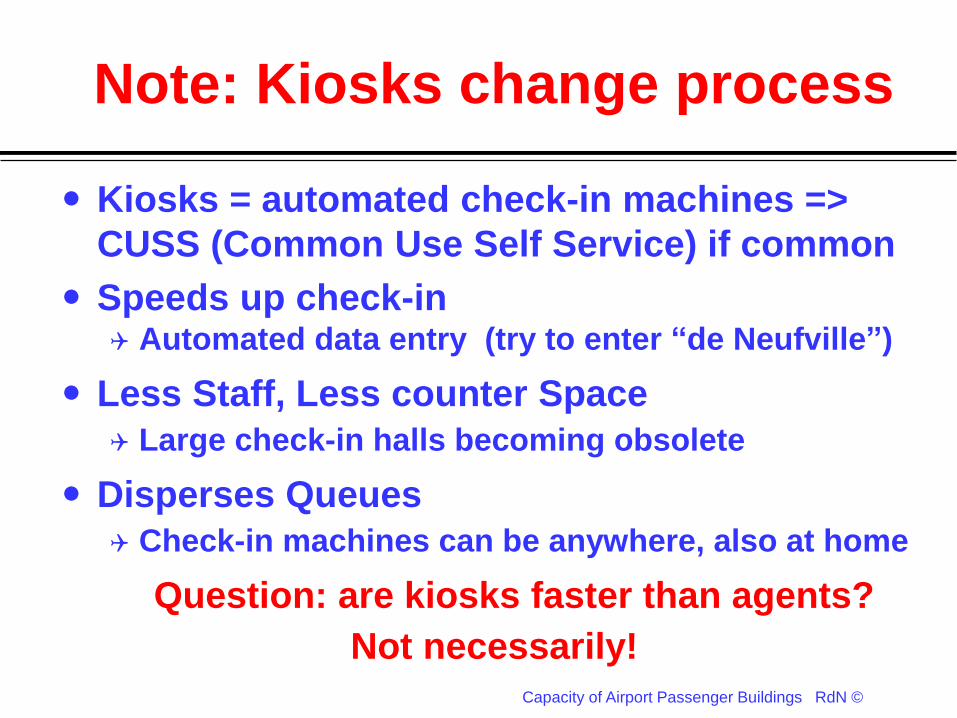
Note: Kiosks change process
Kiosks = automated check-in machines =>
CUSS (Common Use Self Service) if common
Speeds up check-in Automated data entry (try to enter “de Neufville”)
Less Staff, Less counter Space
Large check-in halls becoming obsolete
Disperses Queues
Check-in machines can be anywhere, also at home
Question: are kiosks faster than agents?
Not necessarily!

Capacity of Airport Passenger Buildings RdN ©
Key Take-aways
Concepts about capacity:Management decision about tradeoffs
between Cost and LOS (crowding, waits)
IATA Evolution of standardsTradition standards based on space
New standards adding wait time and
requiring simulation
Some technical details:1. Dwell time critical factor
2. Through flows slash dwell time
3. Capacity of corridors enormous