capacity availability report 2017 updated · pdf filethe capacity availability report for...
TRANSCRIPT

CAPACITY AVAILABILITY REPORT
August 1, 2017
Economic Development Department City Planning Division

CONTENTS PURPOSE ....................................................................................................................... 1
SUMMARY OF DEVELOPMENT ACTIVITY ................................................................... 1
POPULATION ................................................................................................................. 3
EVALUATION OF LOS & CAPACITY AVAILABILITY
Roads ........................................................................................................................... 3
Transit , Pedestrian & Bicycle Facilities ........................................................................ 4
Potable Water .............................................................................................................. 6
Wastewater .................................................................................................................. 9
Solid Waste ................................................................................................................ 10
Parks .......................................................................................................................... 12
Schools ...................................................................................................................... 17
Stormwater ................................................................................................................. 17
SUMMARY .................................................................................................................... 17
FIGURES
Figure 1: Future Park Conditions .................................................................................. 18
APPENDICES
APPENDIX A: MOBILITY (ROADWAYS, TRANSIT, PEDESTRIAN, AND BICYCLE)
APPENDIX B: POTABLE WATER
APPENDIX C: WASTEWATER
APPENDIX D: SOLID WASTE
APPENDIX E: PARKS

Capacity Availability Report August 1, 2017
Page 1
PURPOSE
This report has been prepared in accordance with Section 59.702 of the City’s Concurrency Management Regulations (Chapter 59 of the City Code) for the twelve-month period beginning July 1, 2016 and ending June 30, 2017. The report summarizes the impact that development has had on the provision of the following public services and facilities: roadways, mass transit, wastewater, potable water, solid waste, parks, stormwater and schools. The report also evaluates the impact that existing and new development has had on adopted Level of Service (LOS) standards and shows the amount of capacity available for future growth.
Each applicable department or service provider has evaluated their respective LOS and capacity availability for roads, mass transit, wastewater, potable water, solid waste and parks. Evaluation of stormwater LOS was not necessary because the City requires all development within the City to meet stormwater LOS standards (Engineering Standards Manual requirements) at the time of permit issuance.
This report also provides projections of available capacity for a five-year period for fiscal years 2017/18 through 2021/2022. Each fiscal year begins on October 1. If a LOS deficiency is identifies, either during the reporting period or during one of the five year projections, a capital improvements project or other strategy to address the deficiency will be identified in this report, as well as the corresponding Capital Improvements Fund Schedule, shown in Figure CI-14 and amended annually concurrent with this report.
DEVELOPMENT ACTIVITY
This evaluation of LOS and capacity availability reflects the City’s overall development as of June 30, 2017. Existing and projected development is tracked through the City Land Use Database and reported as of June 30, 2017 in the City’s 2015-2045 Growth Projections Report. Certificates of occupancy issued and demolitions permitted between July 1, 2016 and June 30, 2017 were used to determine the amount of development activity up through the end of the reporting period for this report. The Growth Projections report also provides projected development activity, which was used to project LOS over the next five years. The total quantity of existing and projected development by land use is shown in the table on the following page.

Capacity Availability Report August 1, 2017
Page 2
Existing and Projected Development 2017-2022
Sources: City of Orlando, 2015-2045 Growth Projections Report, June 30, 2017. City of Orlando Tidemark Permit Tracking System.
Time Period Single Family Dwelling Units
Multifamily Dwelling Units
Office Sq. Ft.
Retail Sq. Ft.
Hotel Rooms
Industrial Sq. Ft.
Hospital Sq. Ft.
Civic Sq. Ft.
Existing June 30, 2017 41,711 91,035 36,012,179 31,581,785 23,344 44,369,593 8,167,860 19,404,728
Projected Remainder 2017
140 1,106 296,534 281,386 0 258,244 0 251,001
2018 427 2,233 454,451 578,581 421 320,957 32,608 580,373
2019 427 2,233 454,451 578,581 421 320,957 32,608 580,373
2020 427 2,233 454,451 578,581 421 320,957 32,608 580,373
2021 716 979 708,817 619,481 676 643,896 152,914 437,666
2022 716 979 708,817 619,481 676 643,896 152,914 437,666
2022 Cumulative 44,564 100,816 39,089,700 34,837,876 25,959 46,878,500 8,571,512 22,272,180

Capacity Availability Report August 1, 2017
Page 3
POPULATION For purposes of evaluating the impact of increased population on public facilities, this report is based on the City’s projected population, as shown in the 2015-2045 Growth Projections Report. The projected population is summarized in the table below.
Northwest Northeast Downtown Southwest Southeast TOTAL
2020 34,007 29,851 24,521 88,192 115,591 292,162 2025 34,579 31,187 27,536 90,067 135,342 318,711
The City-wide population estimate as of June 30, 2017 is 278,669. This is a decrease of 1.1% from projected growth.
TRANSPORTATION MOBILITY The transportation mobility analysis depicts the transportation facilities’ performance within the City of Orlando for the period of July 2016 through June 2017. This analysis encompasses the following four modes of transportation: roadways, transit, pedestrian facilities, and bicycle facilities. These modes provide Orlando citizens and visitors with their mobility availability needs.
Roadways For many years, an annual analysis of roadways was completed to determine if new developments were achieving concurrency as defined in the Growth Management Plan (GMP) and the City Code. Following direction from Florida legislative acts, all areas within the City Limits are exempt from the requirements of transportation concurrency. Roadway concurrency is not a requirement for continued development. Network performance is now measured against the standard historically been used for the more densely developed areas of the City. The overall network is performing adequately if 85% of the total lane miles of surface roadways are performing at or below their capacities. 2017 Capacity Availability The Capacity Availability Report for traffic circulation and roadway performance is based on the latest annual counts and assessments the Florida DOT conducts of the primary automobile corridors throughout the state. The City utilizes these counts in transportation studies as a baseline condition for these corridors. The 2016/2017 Average Annual Daily Traffic (AADT) value given for these roadways is compared in this report to the Quality Level-of-Service Handbook capacity values for the associated roadways. The resulting ratio provides an estimated Level-of-Service (LOS) and a volume to capacity ratio. It is generally understood that, as the volume to capacity ratio of a segment approaches 1 or 100% of the LOS D/E capacity is used, the segment’s traffic flows become less stable and the operations becomes less reliable. In this report a cut-off of 85% of LOS D/E capacity is used to indicate areas where network connective is most demanded to allow for vehicular choices in the region.
In general, roadway segments throughout the City identified in last year’s report as experiencing volume/capacity ratios over 85% have seen traffic demand volume increases of 1-5% since 2015. Several segments indicated year to year increases of more than 10%, but all of these are close to active construction zones, such as near Interstate 4, and are more affected by diverted construction traffic than by overall traffic growth. No segments were identified in this study that have substantially poorer performance due only to growth or that pose greater concern than in previous Capacity Availability Reports. There are certainly major roadways that can clearly be

Capacity Availability Report August 1, 2017
Page 4
categorized as congested during peak travel periods of typical days, but the network is not exhibiting signs that reasonable levels of traffic growth cannot continue to be served. Roadway System Improvement Projects There are five (5) roadway construction projects planned in and around the City for the next five years that should provide alternatives and improvements to existing facilities with elevated travel demands. Three of these projects are on FDOT facilities, are included in the current FDOT adopted work program, and are expected to begin construction during the upcoming 5 years.
Project:
Status:
Narcoossee Road – Beachline (SR 528) to Greeneway (SR 417) – Widening to 6 lanes In Design - Construction to begin in 2018.
Project:
Status:
Econlochatchee Trail – Curry Ford Rd to Lee Vista Boulevard – Widening to 4 lanes In Design - Construction to begin in 2019.
Project:
Segments Improved:Status:
Hoffner Rd/Narcoosee Rd (SR 15) – Conway Rd to Lee Vista Blvd Widening to 4 lanes Narcossee Road & Hoffner Road Construction is ongoing.
Project:
Segments Improved:Status:
Sand Lake Rd (SR 482) – Dr. Phillips Blvd to John Young Pkwy Widening to 6 lanes Sand Lake Road Construction has begun and is expected to be completed by 2020.
Project:
Segments Improved:Status:
John Young Parkway (SR 423) – Colonial Drive to Shader Road Widening to 6 lanes John Young Parkway Construction scheduled to begin in 2018.
Outside of these, there are a number of turn lane and other point location improvements expected to enhance operations at point specific concerns. Overall, the City plans to spend more than $47 million in roadway and traffic operations improvements over the next 5 years.
Transit Service The transit service throughout the City of Orlando is provided by Central Florida Commuter Rail System operating under the name of SunRail, and the Central Florida Regional Transportation Authority, operating under the name of LYNX. SunRail provides the region with a north-south high quality alternative to I-4 for weekday travel with four stations within the City of Orlando and two of those within the Central Business District. LYNX provides a fixed-route bus transit service as well as a fixed route primary circulator called LYMMO. Last year, the LYMMO service expanded operation by extending the footprint of its Orange Line to include the emerging “North Quarter” of the central business district. A new Lime Line is opening in August 2017.
According to the Growth Management Plan Transportation Policy 1.13.1, “Throughout the planning period, the City shall strive to maintain or improve a 30-minute weighted average headway on the majority of the designated transit service corridors shown in Figure TE-52.” Citywide, there are 156.5 miles of designated Transit Corridors and 106.3 miles or 68% of those corridors currently have LYNX service available for some portion of a typical day. Analysis of the existing public transit levels of service shows that 60% of the designated transit corridors (9 out of 15) are operating at 30-minute or less weighted average headways. The City plans to invest

Capacity Availability Report August 1, 2017
Page 5
more than $25 million over the next 5 years on transit services and related developments between SunRail, LYNX, LYMMO and future planning.
Pedestrian Facilities During the past year, slight changes were made to the City of Orlando sidewalk network. As of June 30, 2017, there are more than 1,002 miles of sidewalks within the City of Orlando. This total includes approximately 90% along City streets and 10% of sidewalks along State and County roads. Over the next 5 years, the City plans to invest more than $10 million on pedestrian infrastructure in the forms of trails, overpasses and sidewalks.
Bicycle Facilities During the past year, changes were made to the City of Orlando bicycle network. Currently, there are 267.68 miles of directional bicycle lane, 40.49 miles of trails, and 53.37 miles of signed bicycle routes for on-street riding. Over the next 5 years, the City plans to spend more than $10 million on bicycle infrastructure in the form of trails & overpasses.

Capacity Availability Report August 1, 2017
Page 6
Potable Water
Adopted Level of Service Standards The City has adopted Level of Service Standards for various land uses. For each land use shown below, the LOS requires the City (through Orlando Utilities Commission, the City’s water provider) to provide potable water equal to gallons of water per increment of development per day. In areas where reclaimed water is available for irrigation, the level of service for single family homes is lower, because demand for potable water is less.
Land Use LOS Without LOS With Reclaimed Water Reclaimed Water Single-Family 325 g/du/d 160 g/du/d Multi-Family 200 g/du/d 200 g/du/d Hotel 187 g/rm/d 187 g/rm/d Commercial 0.13 g/sqft/d 0.13 g/sqft/d Office 0.15 g/sqft/d 0.15 g/sqft/d Industrial 0.22 g/sqft/d 0.22 g/sqft/d Government 0.15 g/sqft/d 0.15 g/sqft/d Hospital 0.22 g/sqft/d 0.22 g/sqft/d
2017 Capacity Availability Orlando Utilities Commission provides potable water to its service area from 11 treatment plants through an interconnected system. Service is therefore measured on a system-wide basis, and the service area extends beyond the City limits. LOS is monitored by the availability of potable water, measured in million gallons per day (MGD). The physical capacity of the plants is 121.18 MGD, however OUC is limited by its Consumptive Use Permit (CUP) to a smaller annual average withdrawal. The CUP allows for annual increases through 2016, after which additional water demand must be met by water supplies from alternative sources. The following table shows 33.23 MGD of permitted surplus potable water capacity as of July 1, 2017.
Potable Water Capacity Availability (Million Gallons per Day) July 1, 2016 through June 30, 2017
Capacity Used Available System Wide 121.18 87.95 33.23
2017 CUP Allowance 109.20 87.95 21.25 Source: Orlando Utilities Commission. NOTE: Rated capacity based on average day demand. System wide capacity includes areas outside City due to interconnected system.
Projected Capacity Availability: 2018-2022 For future potable water needs, OUC projects demand system-wide and by planning area. The projections are based on data provided by the City and by Orange County. The methodology for the projections is provided in the City’s Water Supply Plan. Specifically, Figure 6 provides water demand through 2045 for each planning area, separate by land use type (Single Family, Multi-family, Commercial, Hotel, School, and Other).

Capacity Availability Report August 1, 2017
Page 7
The figure below provides five year capacity and demand projections for the entire OUC service area, which includes property within the City limits as well as substantial acreage outside City limits. The 2017 data is the actual reported demand provided by OUC as shown in the previous section. The 2018-2022 demand projections show the annual incremental increase in demand as calculated from the 2015-2045 Growth Projections Report. The 2018-2022 capacity projections show the maximum additional amount of daily withdrawals permitted by OUC’s Consumptive Use Permit.
Reported Projected Annual Increases
2017 2018 2019 2020 2021 2022Service Area Capacity (MGD)
109.2 0 0 0 0 0
Service Area Demand (MGD)
87.95 0.86 0.86 0.86 0.91 0.91
Surplus (MGD) 21.25 20.39 19.53 18.67 17.76 16.85
MGD = Millions of Gallons per Day
As shown in the table above, a surplus is expected to remain through 2022. The physical capacity of OUC’s plants allows for withdrawals of up to 121.18 MGD, which exceeds projected demand. Therefore, no new physical capacity for potable groundwater withdrawals is needed. However, OUC’s Consumptive Use Permit (CUP) limits the amount that can be withdrawn to 109.2 MGD from henceforth.
Strategies to Address Future LOS Deficiencies OUC projected demand for 2017 at 105.9 MGD. As reported this year, actual demand is 87.95 MGD. Because the growth rate in water consumption has slowed dramatically from what was projected, LOS deficiencies are not expected within the 5 year reporting period. Over a longer time horizon, OUC needs to continue to prepare for potential deficiencies because alternative water supply projects have lengthy lead times. OUC may also consider focusing on conservation as a low-cost way to further defer potential LOS deficiencies. In addition to the on-going projects included in the Five-Year Capital Improvements Schedule (Figure CI-14), OUC is developing the following water supply projects:
1. Project RENEW. Project RENEW is a regional reuse project. The project will be re-evaluated in the future in order to determine the best location for reclaimed water in the region that is environmentally, technologically, and economically feasible. Project RENEW may also be used to meet adopted MFL prevention and recovery strategies. Phase I of Project RENEW must be completed no later than October 2020 and Phase II must be completed no later than October 2022. OUC has $7.5 million budgeted in its 5 year capital plan to complete the design and start construction of Project RENEW.

Capacity Availability Report August 1, 2017
Page 8
2. Eastern Regional Reclaimed Water Distribution System (ERRWDS). This project constructed reclaimed water transmission facilities from the City’s Iron Bridge Treatment Plant to east Orlando, including Lake Nona and Baldwin Park. The majority of the project, including transmission mains and booster pump station, has been completed and is operational. The Lake Nona Remote Storage and Re-Pumping Facility has been put on-hold until it is needed when reuse demands increase. OUC has $1.7 million budgeted in the 2017 5-year capital plan for its share of the costs to complete the construction of the Lake Nona storage and repump station. OUC has paid approximately $16.9 to date of the estimated OUC capital contribution share of $17.6 million for the project.
3. OUC has committed to develop at least 5 MGD of alternative water supplies either
independently or in partnership with other regional utilities. OUC is partnering with various organizations to investigate the feasibility of developing a surface water supply from the St. Johns River/Taylor Creek Reservoir Project. This project involves diverting fresh water from the St. Johns River to the Taylor Creek Reservoir. Additional facilities will be built to treat the water and transport it from the reservoir, located in the northeast portion of Osceola County, to central Orange County. OUC has $2 million budgeted in its 2017 5-year capital plan to pay for OUC’s portion of permitting and initial design costs for the project.

Capacity Availability Report August 1, 2017
Page 9
Wastewater
Adopted Level of Service Standards The City’s Water Reclaim Division operates three wastewater treatment facilities: Iron Bridge, Water Conserv I and Water Conserv II. The City has adopted Level of Service Standards for various land uses. For each land use shown below, the LOS requires the City to provide capacity at its treatment plants equal to gallons of flow per increment of development per day.
Single Family 250 g/du/ac Multi-Family 190 g/du/d Office 0.08 g/sqft/d Commercial 0.09 g/sqft/d Industrial 0.12 g/sqft/d Lodging 119 g/rm/d Government 0.08 g/sqft/d Hospital 0.08 g/sqft/d
2017 Capacity Availability The City monitors LOS by the availability of treatment plant capacity, measured in million gallons per day (MGD). As shown in Appendix C, the City measures the actual average flow to each treatment plant annually. The following table summarizes this information, and demonstrates that surplus wastewater capacity was available at each wastewater treatment facility, as of June 30, 2017.
Wastewater Capacity Availability (Million Gallons per Day) July 1, 2016 through June 30, 2017
Capacity Used Capacity
Facility Capacity (12 mo avg) Available Iron Bridge 40.000 20.428 19.572 Conserv I 7.500 4.789 2.711 Conserv II 21.000 14.126 6.874 Source: Technical Support Section, Water Reclamation Division
Projected Capacity Availability: 2018-2022 The Wastewater Element Support Document includes Appendix A, which projects wastewater flows by treatment plant at five-year increments: 2010, 2015, 2020, 2025 and 2030. The projections are created by using the adopted LOS standards as multipliers for the City’s projected growth, shown by land use in the City’s 2015-2045 Growth Projections Reports. The results were updated to reflect the 2015-2045 Projections and are shown in the table below. The City’s allocated treatment plan capacity, as shown in Wastewater Support Document Figure WW-13, is 52.162 MGD. This capacity is projected to remain the same for 2018-2022. The 2017 demand is the actual reported demand as shown in the table above. The 2018-2022 demand projections were calculated using the City’s growth projections and level of service standards.

Capacity Availability Report August 1, 2017
Page 10
Reported Projected Annual Increases
2017 2018 2019 2020 2021 2022
City-wide Capacity (MGD) 52.16 0 0 0 0 0
City-wide Demand (MGD) 39.34 0.61 0.61 0.61 0.55 0.55
Surplus (MGD) 12.82 12.21 11.60 10.99 10.44 9.89
MGD = Millions of Gallons per Day As shown in the table above, a surplus is expected to remain through 2022. Furthermore, the City’s wastewater system includes interconnected pipes that allow the City to re-route flows to different treatment plants as needed. Re-routing of sewage from Water Conserv I and Water Conserv II to the available surplus in Iron Bridge will alleviate any potential deficits through 2020. No additional capacity is needed over the five year period, therefore capital improvement projects will focus adding sewer service for new development (funded by the developer) and maintenance of existing facilities.
Solid Waste Level of Service Standards The Solid Waste LOS standard is expressed as a commitment to collect a given amount of solid waste (including recycling materials) per increment of development per day. The following LOS standard has been adopted: Residential: 8.29 lb/unit/day Commercial: 3.96 lb/1,000 sq.ft./day This is accomplished by providing two (2) pick-ups per week for residential and providing pick-ups on an as needed basis six days a week for commercial. The LOS applies to 208 working days per year for residential and 260 working days per year for non-residential. 2017 Capacity Availability The City’s Solid Waste Management Division has a fleet of 69 vehicles, including 17 front-end loaders, 11 rear-end loaders, 31 automated side-loaders, 6 claw bulk collection vehicles, and 4 recycling vehicles. The City provides service on twenty-two (22) automated residential routes, four (4) yard waste routes, four (4) recycling routes, one (1) food waste route, and eleven (11) commercial routes. During the review period, the City collected 100,782 tons of commercial solid waste, 51,249 tons of residential solid waste, 13,219 tons of recycled yard waste, and 8,478 tons of recycled waste. On a per-unit basis, the annual collection results in LOS performance as shown on the following page.

Capacity Availability Report August 1, 2017
Page 11
Solid Waste Capacity Availability June 30, 2016 through July 1, 2017
Land Use LOS Performance Residential 5.67 lbs./d.u./day Commercial 5.66 lbs. / 1000 sq. ft. /day Source: Solid Waste Management Division
The City collected less residential solid waste per unit than the capacity identified in the LOS standards, therefore additional capacity is available to serve future development, even without the purchase of new vehicles. The City collected more commercial solid waste per thousand square feet than the amount committed to the LOS standards. Given the flexibility inherent in deployment of the fleet of existing vehicles, the City was able to meet this demand and exceed its LOS standard. The City disposes waste at the Orange County landfill. The Orange County Solid Waste Division has projected that adequate landfill capacity will be available for the next twenty years. Projected Capacity Availability: 2018-2022 Demand for solid waste pick-up is projected using the City’s growth projections and multiplying by the adopted LOS standards. As shown in the Solid Waste Element Support Document, as of 2008 the Division had 55 vehicle which collect a total of 166,462 tons per year, or approximately 3,027 tons per vehicle per year. This figure was used to project the need for new vehicles. As of 2017, the City has 69 vehicles, which exceeds the projected need for 63 vehicles through the 5-year projection.
Year Projected Solid Waste Generation (Tons Per Year)
Number of Solid Waste Collection Vehicles Needed
Number of New Vehicles Being Purchased
Total New
2017 173,728 57 0 0
2018 177,121 59 0 0
2019 180,514 60 0 0
2020 183,907 61 0 0
2021 186,827 62 0 0 2022 189,747 63 0 0
Capacity Availability Report August 1, 2017
Page 12
Reported (Tons Per Year)
Projected Annual Increases
2017 2018 2019 2020 2021 2022
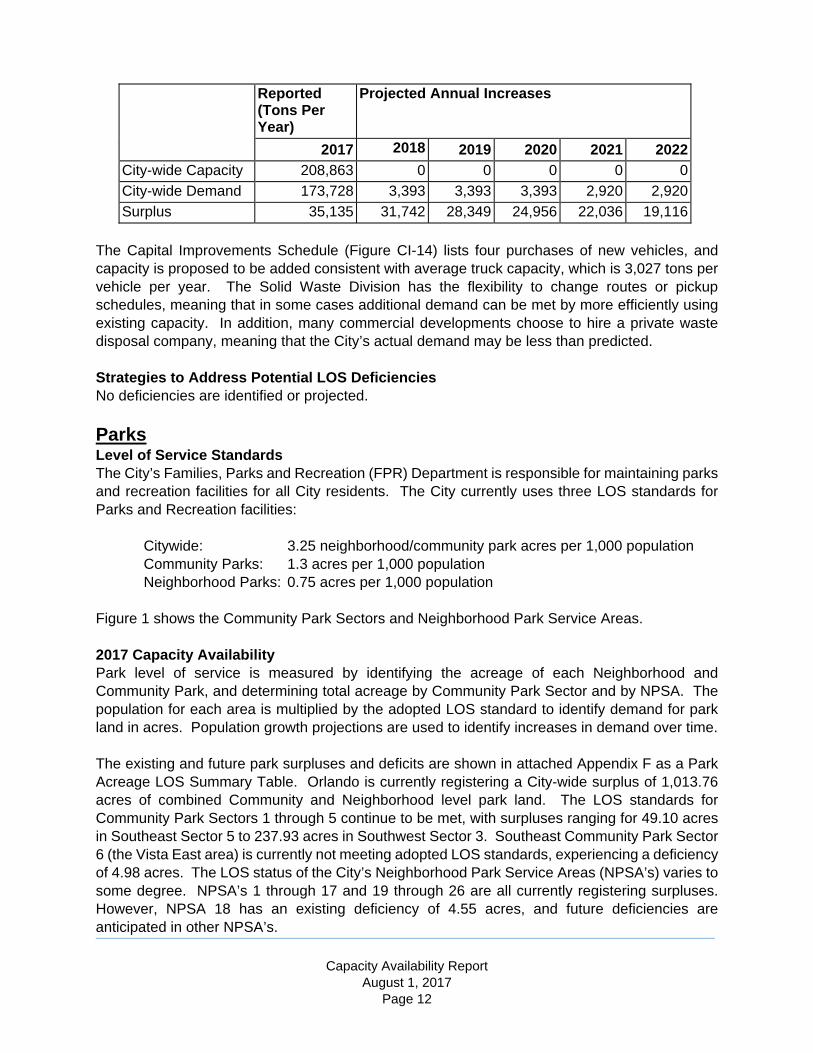
City-wide Capacity 208,863 0 0 0 0 0
City-wide Demand 173,728 3,393 3,393 3,393 2,920 2,920
Surplus 35,135 31,742 28,349 24,956 22,036 19,116
The Capital Improvements Schedule (Figure CI-14) lists four purchases of new vehicles, and capacity is proposed to be added consistent with average truck capacity, which is 3,027 tons per vehicle per year. The Solid Waste Division has the flexibility to change routes or pickup schedules, meaning that in some cases additional demand can be met by more efficiently using existing capacity. In addition, many commercial developments choose to hire a private waste disposal company, meaning that the City’s actual demand may be less than predicted. Strategies to Address Potential LOS Deficiencies No deficiencies are identified or projected.
Parks Level of Service Standards The City’s Families, Parks and Recreation (FPR) Department is responsible for maintaining parks and recreation facilities for all City residents. The City currently uses three LOS standards for Parks and Recreation facilities: Citywide: 3.25 neighborhood/community park acres per 1,000 population Community Parks: 1.3 acres per 1,000 population Neighborhood Parks: 0.75 acres per 1,000 population Figure 1 shows the Community Park Sectors and Neighborhood Park Service Areas. 2017 Capacity Availability Park level of service is measured by identifying the acreage of each Neighborhood and Community Park, and determining total acreage by Community Park Sector and by NPSA. The population for each area is multiplied by the adopted LOS standard to identify demand for park land in acres. Population growth projections are used to identify increases in demand over time. The existing and future park surpluses and deficits are shown in attached Appendix F as a Park Acreage LOS Summary Table. Orlando is currently registering a City-wide surplus of 1,013.76 acres of combined Community and Neighborhood level park land. The LOS standards for Community Park Sectors 1 through 5 continue to be met, with surpluses ranging for 49.10 acres in Southeast Sector 5 to 237.93 acres in Southwest Sector 3. Southeast Community Park Sector 6 (the Vista East area) is currently not meeting adopted LOS standards, experiencing a deficiency of 4.98 acres. The LOS status of the City’s Neighborhood Park Service Areas (NPSA’s) varies to some degree. NPSA’s 1 through 17 and 19 through 26 are all currently registering surpluses. However, NPSA 18 has an existing deficiency of 4.55 acres, and future deficiencies are anticipated in other NPSA’s.

Capacity Availability Report August 1, 2017
Page 13
Projected Capacity Availability: 2018-2022 Community Parks are typically at least fifteen acres in size, with a variety of ball fields and community facilities. Neighborhood Parks are typically five acres in size, with neighborhood-serving facilities such as a playground or a multi-purpose field. If a small deficiency develops, as new park may not be needed right away. Most parks can handle excess demand over the short term. Furthermore, a new park should not be built until sufficient demand is expected in the near term, otherwise a substantial park investment might be underutilized. Therefore, Recreation Policy 1.1.1 states that a new park must be added to the capital improvement schedule in the following circumstances:
A Community Park Sector deficiency of 7.5 acres or greater is identified or projected within the next five years
A NPSA deficiency of 2.5 acres or greater is identified or projected within the next five years
In addition, some locations within the City are not inside a NPSA. These areas, each for unique reasons, cannot be served with the same LOS as the rest of the City. Therefore, Recreation Element Policies 1.1.7 through 1.1.11, 1.1.17 and 1.1.18 address how park service shall be provided within each of those areas. From a technical acreage standpoint, a new Community Park would not be required to be incorporated into the GMP Capital Improvements Element and CIP until after 2035. As shown in Appendix F, all Community Park Sectors and NPSA’s are expected to maintain a surplus of park capacity except for the following: Community Park Sector 6 has an existing deficiency of 4.98 acres, which is expected to grow to 5.07 acres in 2020, 11.36 acres in 2030, and 19.43 acres by 2045. Given the criteria in Recreation Policy 1.1.1 described above, a funded park project would need to be added to the CIP and CIE to address this current and projected deficiency sometime between 2021 and 2025. Residents in Community Park Sector 6 will ultimately need an additional 2 little league ballfields, 4 softball fields, and 2 soccer/multi-purpose fields. NPSA 18 (South Semoran East Area): This area includes a small number of single family homes, as well as a number of multifamily developments which have private recreational amenities. However, there are no City neighborhood park facilities in this area. Unfortunately, this service area is experiencing a fairly significant neighborhood park LOS deficiency of 4.55 acres. In the past, the City was able to utilize the recreational amenities associated with McCoy Elementary School through a Joint Use Agreement (JUA). However, because of the rebuilding of the school and the subsequent reconfiguration of the recreational amenities including lack of physical accessibility, FPR has found that operating recreational programs at this location is problematic. Because the previous JUA is no longer in place, the City can no longer count the school’s recreational amenities in our neighborhood park LOS calculations. NPSA #18 has 9,830 residents generation a neighborhood park need for 7.37 acres. While the 2.82 acres of privately owned park land associated with the Carter Glen and Grandville at Jubilee Park projects can be counted in the analysis, a deficiency of 4.55 acres remains. That deficiency is expected to grow to 5.41 acres by 2020 and 6.37 acres by 2030. This level of deficiency exceeds all of the thresholds described in Recreation Policy 1.1.1. Therefore, the City will need to address this deficiency in one or a combination of the following ways:

Capacity Availability Report August 1, 2017
Page 14
1) Renew the City/OCPS Joint Use Agreement at McCoy Elementary. This option could
include a redesign of the existing substandard little league ballfield into a multi-purpose field that would better serve the needs of the school and the City.
2) Add a neighborhood park project to the City’s Capital Improvement Program budget and build a new 5 to 6 acre neighborhood park (or two smaller parks).
3) Utilize Recreation Policy 1.1.3, which states that “If no developable land is available for parks in a neighborhood park service area exhibiting measurable unmet demand, suitable alternate sites in adjacent service areas shall be identified and developed as appropriate. Such sites may be used to satisfy the minimum acreage requirements for that service area for the purpose of concurrency.”
4) Initiate an amendment to GMP Recreation Policy 1.1.15 to state that, because of the unique physical characteristics of the service area and presence of private recreational amenities associated with multifamily projects, the recreation needs within NPSA 18 shall be met by utilization of the City-wide combined level of service standard for community and neighborhood parks.
Option 3 was utilized during the previous three years to ensure concurrency is technically met. NPSA’s 19-24 and 26 (Vista East, Southeast Orlando Sector Plan, and Storey Park Areas): To date, the developers of the residential projects in NPSA’s 19-24 have provided neighborhood-level park land consistent with the City’s Growth Management Plan. The developers of properties within the Southeast Orlando Sector Plan area (NPSA’s 21-24) are required to provide neighborhood parks to serve their projected population according to the LOS standards specified in the Growth Management Plan. Similar requirements were incorporated into the Vista Park PD in NPSA 20, as well as the Storey Park and Starwood PD’s in NPSA 26. In fact, these are currently the only areas of the City where some form of mandatory park land dedication is required. As residential Specific Parcel Master Plans are brought forward, staff will work with the developers to appropriately locate those neighborhood park facilities. As an example, construction of Lake Nona’s Laureate Park residential project is in full swing. As part of this residential project, Lake Nona will be developing over 20 acres of publicly accessible neighborhood-level park land, which will be maintained by the applicable homeowner’s association. Because of this and other similar privately funded park development activity, no additional action in terms of providing neighborhood-level park land is required by the City for these areas at this time. Additional Park Needs The Level of Service analysis only addresses acreage. Park facilities, and distribution of parks within service areas, are also important factors to consider when building new parks. In order to address the Community Park needs in the southeast portion of the City, it is recommended that six (6) to seven (7) new community level parks be developed. The proposed amenities for each park are conceptual only and would necessarily be refined in the park master planning, budgeting, and public input process.

Capacity Availability Report August 1, 2017
Page 15
Community Park #1 – Lake George Property. The 25.57 acre Lake George site (in
Community Park Sector 4) should be developed within the next 2 to 3 years, containing 2 to 3 soccer/multipurpose sports fields and other park amenities. Located adjacent to Orange County’s Barber Park, the City and County have reached an agreement that calls for the County to design, permit and construct the park in coordination with the City’s FPR Department, while simultaneously modifying the existing Barber Park so that the two parks can operate as efficiently as possible.
Community Park #2 – OIA East Airfield Property. Located north of Dowden Road and west of Narcoossee Road (in Community Park Sector 5), the City of Orlando, Greater Orlando Aviation Authority, and Tavistock/Lake Nona are partnering to create a 25 acre community park that will not only provide much needed recreational amenities, but also essential land use buffering between aircraft operations associated with the Orlando International Airport and the North Lake Park residential neighborhood. The park land will be acquired by Lake Nona from GOAA, and then designed, permitted and constructed by Lake Nona. Following completion, the park will be conveyed to the City of Orlando. Planned amenities include 1 adult and 2 Little League baseball fields, 1 softball/coach pitch Little League field, a community garden and a playground. It is anticipated that this park will be built within the next year.
Community Park #3 – Laureate Park. Located south of Laureate Boulevard and west of Kellogg Avenue in Lake Nona’s Laureate Park neighborhood (in Community Park Sector 5), this ±20.2 acre community park will provide much needed recreational amenities for residents in this rapidly developing neighborhood. Similar to the OIA East Airfield property, the City and Tavistock/Lake Nona are partnering to create this activity based community park. The park will be designed, permitted and constructed by Lake Nona. Following completion, the park will be conveyed to the City of Orlando. Planned amenities include 4 multi-purpose fields, and it is anticipated that the park will be built within the next year. The proposed park is located adjacent to a new elementary school and so there is a possibility of a joint use agreement between Orange County Public Schools (OCPS) and the City.
Community Park #4 – Southport property. Located south of Barnstable Place and west of Daetwyler Drive (in Community Park Sector 4), the ±50.46 acre Southport Community Park currently features six baseball fields, tennis courts, a basketball court, and other amenities. The FPR Department has identified the possibility of creating a premier baseball facility by adding to the 6 baseball fields existing on site. At least 15 additional acres of parkland would be required if property is available directly adjacent to the existing Southport Community Park (approximately 23 acres would be needed to the existing park). Anticipated amenities include 4 additional baseball fields, a playground and other park amenities, as well as a potential community center. The timing for development of this potential park is unknown as it is associated with the redevelopment of the Southport/former Orlando Naval Training Center Annex property.
Capacity Availability Report August 1, 2017
Page 16
Community Park #5 – Wewahootee PD (Storey Park). Located north of Moss Park Road and east of the Central Florida Greeneway (SR 417) (in Community Park Sector 5), the Storey Park consists of 2,752 residential units. The project is required to provide a minimum of 7.2 acres of community-level park land and 4.1 acres of neighborhood-level park land, with specific acreage amounts timed with residential unit counts in individual phases. All community and neighborhood parks within Storey Park will be developed and owned by the developer (i.e., privately owned and maintained) but open to the general public. Residential construction has already begun within the project. It is anticipated that the first community park acreage will be developed sometime in the next 4 to 5 years based on residential absorption.
Community Park #6 – Vista Park PD Property. Located north of the Beachline Expressway (SR 528) and east of Narcoossee Road (in Community Park Sector 6), the Vista Park PD consists of 3,800 single family and 500 multi-family units. The developer is required to provide 30 acres of community-level park land and 10 acres of neighborhood-level park land. However, the PD language states that the 30 acres of community park land may be transferred to the Starwood PD located south of the Beachline Expressway subject to approval of an agreement between the developer and the City. The reason for this provision is to provide the City with flexibility in determining if a larger 60 acre regional park on the Starwood property would be preferable in terms of operations and efficient service provision. The timing for acquisition and development of this park is unknown at this time, being dependent on the remediation and clean-up of the subject property which is part of the former Pinecastle Jeep Range (a Formerly Use Defense Site). If developed on the Vista Park site (rather than the Starwood site), FPR staff have determined that the park should include at least 2 basketball courts, 2 tennis courts, a soccer/multi-purpose field, and a 4-field softball complex, along with a playground and other park amenities including the possibility of a community center.
Community Park #7 – Starwood PD Property. Located south of the Beachline Expressway
(SR 528) and east of Storey Park (in Community Park Sector 5), the Starwood PD consists of 4,400 single family and 2,000 multifamily residential units. The project is required to provide a minimum of 47.36 acres of community and neighborhood-level park land, with at least a 30 acre community park site being provided. The community park acreage associated with the Vista Park PD may be combined with the Starwood PD community park acreage to create a 60 acre regional community park, with the specific location, type of facilities, timing and construction responsibilities being executed through an agreement with the City. The PD notes that the community park must be constructed concurrent with the construction of 33% of the residential units (or by the Certificate of Occupancy for the 2,112th residential unit). Staff estimates that the timing of construction for the community park will occur sometime between 2020 and 2030. As the project proceeds, staff will continue to analyze the project and market conditions to provide a more accurate estimation.

Capacity Availability Report August 1, 2017
Page 17
Strategies to Address Potential LOS Deficiencies Park Impact Fee - City Council approved an ordinance creating a park impact fee to provide a funding source to assist in increasing the capacity of Orlando’s park system to meet residents’ recreation needs as the population increases. This impact fee went into effect on March 1, 2017. The demand for new and enhanced parks increases as our residential population increases. As such, the fee is assessed on new residential development at a rate of $966 for each newly constructed single family home and $825 for each newly constructed multi-family unit. Credits may be given for demolished residential units at the time of permitting for new ones or for certified affordable housing units. Although the fee per unit is significant, it is but a fraction of what it costs to build new amenities. Supplemental funding from traditional sources such as the City’s Capital Improvement Program funds or grants will still be needed on many projects. The Park Impact Fee organizes the City into three sections: the North Benefit Area, the Southeast Benefit Area, and the Southwest Benefit Area. Park Impact Fee revenues for each area must be spent on increasing park capacity within the area in which it is collected, with the exception of regional parks, where funds from any area can be used since regional parks serve a citywide need.
Schools The City of Orlando is dedicated to supporting Orange County Public Schools (OCPS) in their endeavor to create and maintain a high quality public education system. Residential development within Orange County is well coordinated with OCPS, and much of the residential development that occurs is mitigated prior to approval. OCPS is responsible for submitting to DEO annual updates to the data and analysis demonstrating available and projected capacity. The City in turn, has committed to annually adopting by reference the OCPS 10-year Capital Outlay Plan. Capital Improvements Element Policy 2.2.30 adopts the most recent OCPS plan by reference.
Stormwater The City maintains the adopted LOS standards for stormwater by requiring all development to be consistent with the Engineering Standards Manual at time of building permit issuance. SUMMARY The City of Orlando is maintaining its adopted LOS standards for potable water, solid waste, wastewater, citywide parks and stormwater.

Capacity Availability Report August 1, 2017
Page 18
Figure 1: Future Park Conditions

Capacity Availability Report August 1, 2017
Page 19
APPENDICES Appendices A through E provide the technical documentation that City departments and other service providers submitted to the City Planning Division.

Capacity Availability Report August 1, 2017
Page 20
APPENDIX A: MOBILITY (ROADWAYS, TRANSIT, PEDESTRIAN, AND BICYCLE)

MOBILIT Y REPORT
J U L Y 2 0 1 6— J U N E 2 0 1 7
City of Orlando Transportation Department Transportation Planning Division

Mobility Report (Capacity Availability) - July 1, 2016- June 30, 2017
TRANSPORTATION DEPARTMENT Billy Hattaway, PE, Department Director
F.J. Flynn, AICP, Deputy Department Director
TRANSPORTATION PLANNING Gus Castro, Project Manager
John K. Rhoades, Project Manager
ECONOMIC DEVELOPMENT DEPARTMENT Brooke Devon Rimmer-Bonnett, AICP, Department Director
CITY PLANNING DIVISION Dean Grandin, AICP, Division Manager
Paul Lewis, FAICP, Chief Planning Manager
Comprehensive Planning Studio Elisabeth Dang, AICP, Chief Planner
Colandra Jones, AICP, Planner III

Mobility Report (Capacity Availability) - July 1, 2016- June 30, 2017
Page 2
PURPOSE
The purpose of this report is to document the availability of transportation infrastructure for mobility
within the City of Orlando for the period of July 2016 through June 2017. This analysis encompasses
four major modes of transportation: transit services, pedestrian facilities, bicycle facilities and major
roadways, which provide Orlando citizens and visitors with their mobility needs. This report is intended
to comply with the Chapter 59 requirements of the City Code.
TRANSIT SERVICES
Transit throughout the City of Orlando is comprised of three primary services assisted by several shuttle
services. The primary services are provided by Central Florida Commuter Rail System operating under
the name of SunRail, and the Central Florida Regional Transportation Authority, operating under the
name of LYNX. SunRail provides the region with a north-south high quality alternative to I-4 for
weekday travel with stations from Volusia County to south Orange County, including four in the City of
Orlando and two in the central business district. LYNX operates a fixed-route bus service, as well as a
fixed route primary circular called LYMMO. Last year, the LYMMO service expanded operation by
extending the footprint of its Orange Line to include the emerging “North Quarter” of the central
business district.
This report synopsis will focus on the transit corridors as prescribed in the Growth Management Plan.
These transit corridors are still vital to providing access to many of the City’s employment centers and
have remained relatively unchanged. The attached table for composite headways (average time
between consecutive buses) and performance is based on the City’s designated Transit Corridor
segments, currently served by one or more LYNX routes (see Exhibit 1). Policy 1.13.2 of the Growth
Management Plan, Transportation Element states that the City shall strive to enhance transit coverage
along the designated Transit Corridors. Citywide, there are 156.5 miles of designated Transit Corridors;
106.3 miles or 68% of those corridors currently have LYNX service available for some portion of a typical
day. Of the fifteen (15) designated transit corridors with service available, nine (9) have headways of 30
minutes or less. The City plans to invest more than $25 million dollars over the next 5 years on transit
services and related developments between SunRail, LYNX, LYMMO and future planning (see Exhibit 3).
PEDESTRIAN FACILITIES
Between July 1st, 2016 and June 30th, 2017, slight changes were made to the sidewalk network in the
City of Orlando. As of June 30, 2017, there are more than 1,002 miles of sidewalks within the City of
Orlando. This total includes approximately 90% along City streets and 10% of sidewalks along State and
County roads. Over the next 5 years, the City plans to invest more than $10 million dollars on
pedestrian infrastructure in the form of trails, overpasses and sidewalks (see Exhibit 3).

Mobility Report (Capacity Availability) - July 1, 2016- June 30, 2017
Page 3
BICYCLE FACILITIES
Changes were made to the bicycle network in the City of Orlando between July 1st, 2016 and June 30th,
2017; currently, there are 267.68 miles of directional bicycle lane in the City, 40.49 miles of trails, and
53.37 miles of signed bicycle routes for on-street riding. Over the next 5 years, the City plans to spend
more than $10 million dollars on bicycle infrastructure in the form of trails & overpasses (see Exhibit 3).
ROADWAYS & RELATED FACILITIES
For many years, an annual analysis of roadways was completed to determine if new developments were
achieving concurrency, as defined in the City Code and Growth Management Plan (GMP). Following
direction from Florida legislative acts, all areas within the City Limits are now exempt from
transportation concurrency requirements. Policy 1.8.2 of the GMP Transportation Element states that:
“The City shall exempt development within a transportation mobility area, as shown in Figure TE-3, from
transportation concurrency for roadways in order to promote infill development and encourage use of
alternative transportation modes”. Roadway concurrency is not a requirement for continued
development. Network performance is now measured against the standard historically used for the
more densely developed areas of the City. The overall network is performing adequately if 85% of the
total lane miles of surface roadways are performing at or below their peak capacities.
Roadway concurrency was eliminated in part due to a shift in perception about what constitutes a good
urban transportation network. With these ideas in mind, the City is focused on automotive solutions
that positively impact the connectivity of the roadway system and provide alternatives to the major
regional arterials. Among these solutions are the requirements for Cross-Access Easements, Joint Use
Driveways and a continued effort to connect roadways, sidewalks and trails to the surrounding system
without requiring movements onto the major roadway. Limited access facilities, such as Interstate 4 or
the Beachline Expressway/SR 528, that lie within the City limits, are not included in this assessment, as
their operation is governed by non-City agencies.
Methodology for System Analysis and Current State
The Florida DOT conducts annual counts and assessments of the primary automobile corridors
throughout the state. The City utilizes these counts in transportation studies as a baseline condition for
these corridors. The 2016/2017 Average Annual Daily Traffic (AADT) value given for these roadways is
compared in this report to the Quality Level-of-Service Handbook capacity values for the associated
roadways. The resulting ratio provides an estimated Level-of-Service (LOS) and a volume to capacity
ratio. It is generally understood that, as the volume to capacity ratio of a segment approaches 1 or
100% of the LOS D/E capacity used, the segment’s traffic flows become less stable and the operations
becomes less reliable. A cut-off of 85% of LOS D/E capacity is used in this report to indicate areas where
network connectivity is most demanded to allow for vehicular choices in the region (see Exhibit 2).

Mobility Report (Capacity Availability) - July 1, 2016- June 30, 2017
Page 4
Findings
Most of the roadway segments throughout the City identified in last year’s report as experiencing
volume/capacity ratios over 85% have seen traffic demand volume increases of 1-5% since 2015.
Several segments indicated year to year increases of more than 10%, but all of these are close to active
construction zones, such as near Interstate 4, and are more affected by diverted construction traffic
than by overall traffic growth.
Six additional roadway segments have reached the 85% threshold that is considered as having high
demand. Four of these are segments of longer roadways that have long been identified as experiencing
high volumes relative to their capacity: Mills Avenue, Orange Blossom Trail, John Yong Parkway and
Boggy Creek Road. Silver Star Road, between Princeton Street and John Yong Parkway, and Edgewater
Drive, north of Par Street, are the only 2 segments that were identified as having volume/capacity ratios
over 85% that were not on the 2015 list of high demand corridors (see Exhibit #2).
The data for 2016 indicate that traffic demand is generally increasing throughout Orlando, as expected,
given the level of growth in the City and surrounding areas. However, the roadway network as a whole
still has substantially more than 85% of road segments that are performing well below capacity and is
meeting the total demand for movement of freight and people. No segments were identified in this
study that have substantially poorer performance due only to growth or that pose greater concern than
in previous Mobility Availability Reports. There are certainly major roadways that can clearly be
categorized as congested during peak travel periods of typical days, but the network is not exhibiting
signs that reasonable levels of traffic growth cannot continue to be served.
Roadway System Improvement Projects
There are five (5) roadway construction projects planned in and around the City for the next five years
that should provide alternatives and improvements to existing facilities with elevated travel demands.
Three of these projects are on FDOT facilities, are included in the current FDOT adopted work program,
and are expected to begin construction during the upcoming 5 years.
Project: Narcoossee Road – Beachline (SR 528) to Greeneway (SR 417) – Widening to 6 lanes Status: In Design Construction to begin in 2018.
Project: Econlochatchee Trail – Curry Ford Road to Lee Vista Boulevard – Widening to 4 lanes Status: In Design Construction to begin in 2019.
Project: Hoffner / Narcoossee Road (SR 15) – Conway Road to Lee Vista Blvd - Widening. Segments Improved: Narcososee Road & Hoffner Road. Status: Construction is ongoing.
Project: Sand Lake Road (SR 482) – Dr Phillips Blvd. to John Young Pkwy - Widening. Segment Improved: Sand Lake Road. Status: Construction has begun and is expected to be completed by 2020.

Mobility Report (Capacity Availability) - July 1, 2016- June 30, 2017
Page 5
Project: John Young Pkwy (SR 423) – Colonial Drive to Shader Road - Widening. Segment Improved: John Young Parkway. Status: Construction scheduled to begin in 2018.
Outside of these, there are a number of turn lane and other point location improvements expected to
enhance operations at point specific concerns. Overall, the City plans to spend more than $47 million
dollars in roadway and traffic operations improvements over the next 5 years (see Exhibit 3).

Mobility Report (Capacity Availability) - July 1, 2016- June 30, 2017
Page 6
CONCLUSION
In 2016 - 2017, the performance of all aspects of the City of Orlando transportation networks was similar
to previous years; from a transit perspective, SunRail has provided the region with new transit
opportunities and is developing as the backbone of Central Florida’s transit system. Regular bus and
other local circulator systems are in place to reinforce the availability of non-automotive options
through the City.
The total lengths of sidewalks, multi-use trails, and bike lanes were increased slightly within the City.
Plans are in place to improve some of the more highly demanded corridors with roadway modifications
that are estimated to be constructed prior to 2022; there are also plans moving forward to increase the
availability of the other three modes discussed in this report.
The anticipated development activity for the 2016 - 2017 reporting period indicates that continued
increases in certificates of occupancy for residential single family and apartment dwellings will impact
the roadway network in Orlando. The roadway network will have capacity to serve this growth for a
number of foreseeable years. Several significant planned and programmed roadway enhancements will
also be underway in the next 5 years to add to that overall capacity.


Exhibit 1
Designated Transit Corridors Analysis
From To
Total
Length
Served
(ft)
Total
Length
Served
(mi)
% of Corridor
Served by
Segment
Segment
Length (ft)
Segment
Length
Served
(mi)
Route No.
Serving
Segment
Routes
Peak
Headway
Buses
per
Hour
Adjusted
Segment
Headway
(min)
Old
Segment
Headway
(min)
Adjusted CHC
Reciprocal
A KIRKMANCOLONIAL DR WESTGATE DR 33,080 6.3 22.8% 7,550 1.4 301 1,440 0.042 1,440 1440 0.000158496
37 30 2
301 1,440 0.042
21 30 2
37 30 2
301 1,440 0.042
302 1,440 0.042
305 1,440 0.042
21 30 2
37 30 2
40 60 1
301 1,440 0.042
302 1,440 0.042
305 1,440 0.042
37 30 2
301 1,440 0.042
302 1,440 0.042
303 1,440 0.042
37 30 2
38 20 3
304 1,440 0.042
Corridor Length Served 100.0% 33,080 6.3 18.1
B LEE RD/ JOHN YOUNG PYSHADER RD SILVER STAR RD 42,930 8.1 6.1% 2,640 0.5 25 30 2 30 30 0.002049849
25 30 2
125 20 3
20 60 1
25 30 2
302 1,440 0.042
303 1,440 0.042
20 60 1
21 30 2
303 1,440 0.042
COLUMBIA ST AMERICANA BV 42,930 8.1 34.7% 14,900 2.8 57 60 1 60 60 0.005784611
57 60 1
305 1,440 0.042
OAK RIDGE RD SAND LAKE RD 42,930 8.1 21.1% 9,060 1.7 57 60 1 60 60 0.003517354
Corridor Length Served 100.0% 42,930 8.1 34.6
C OBTCLARCONA-OCOEE RD AMELIA ST 35,500 6.7 76.6% 27,200 5.2 106 30 2 30 30 0.025539906
AMELIA ST GRAND ST 35,500 6.7 23.4% 8,300 1.6 107 30 2 30 30 0.007793427
Corridor Length Served 100.0% 35,500 6.7 30.0
D ORANGE AVMILLS AV CENTRAL STATION 63,320 12.0 24.5% 15,500 2.9 102 15 4 15 15 0.016319225
3 60 1
7 60 1
11 30 2
13 60 1
15 30 2
18 60 1
40 60 1
313 60 17 60 1
11 30 218 60 140 60 111 30 2
18 60 1
18 60 1
418 60 1
Corridor Length Served 100.0% 63,320 12.0 13.5
E FERN CREEK/ MILLSROLLINS ST ROBINSON ST 10,000 1.9 100.0% 10,000 1.9 125 20 3 20 20 0.050000000
Corridor Length Served 100.0% 10,000 1.9 20.0
F BUMBY/PRIMROSECORRINE DR COLONIAL DR 17,170 3.3 30.2% 5,180 1.0 313 60 1 60 60 0.005028150
6 60 1
13 60 1
313 60 1
6 60 113 60 151 60 1
313 60 16 60 1
13 60 151 60 1
SOUTH/ANDERSON CURRY FORD RD 17,170 3.3 30.0% 5,150 1.0 15 30 2 30 20 0.009998059
CURRY FORD RD LAKE MARGARET DR 17,170 3.3 7.7% 1,320 0.3 3 60 1 60 60 0.001281305
Corridor Length Served 100.0% 17,170 3.3 29.7
G CONWAY/TRADEPORT/BOGGY CREEKCURRY FORD RD HOFFNER AV 15,960 3.0 100.0% 15,960 3.0 51 60 1 60 60 0.016666667
Corridor Length Served 100.0% 15,960 3.0 60.0
H SEMORAN/OIA/MEDICAL CITY28 30 2
436S 30 2
6 60 1
28 30 2
436S 30 2
28 30 2
436S 30 2
GRANT ST LAKE MARGARET DR 43,280 8.2 9.6% 4,150 0.8 436S 30 2 30 30 0.003196242
3 60 1
436S 30 2
GATLIN AV HOFFNER AV 43,280 8.2 12.3% 5,340 1.0 436S 30 2 30 30 0.004112754
436S 30 2
51 60 1
Corridor Length Served 100.0% 43,280 8.2 19.1
I HOFFNER/ NARCOOSSEEREDDIT RD OLD GOLDENROD RD 4,460 0.8 100.0% 4,460 0.8 3 60 1 60 120 0.016666667
Corridor Length Served 100.0% 4,460 0.8 60.0
1 SILVER STAR/PRINCETON/VIRGINIA/CORRINE20 60 1
25 30 2
302 1,440 0.042
JOHN YOUNG PY EDGEWATER DR 34,400 6.5 25.0% 8,600 1.6 125 20 3 20 20 0.012500000
EDGEWATER DR MILLS AV 34,400 6.5 23.5% 8,100 1.5 125 20 3 20 20 0.011773256
BUMBY AV BENNETT RD 34,400 6.5 16.9% 5,800 1.1 313 60 1 60 60 0.002810078
Corridor Length Served 100.0% 34,400 6.5 6.5 22.4
2 COLONIAL DR48 30 2
49 30 2
105 30 2
25 30 248 30 249 30 2
105 30 248 30 2
49 30 2
105 30 2
28 30 2
29 30 2
104 30 2
Corridor Length Served 100.0% 40,670 7.7 9.8
3 OLD WINTER GARDEN/SOUTH/ANDERSON/LK UNDERHILLKIRKMAN RD JOHN YOUNG PY 44,900 8.5 34.1% 15,300 2.9 54 60 1 60 60 0.005679287
25 60 1
54 60 1
13 60 1
15 60 1
6 60 1
51 60 1
Corridor Length Served 100.0% 44,900 8.5 36.2
4 RALEIGH/GORE/CURRY FORDHIAWASSEE RD KIRKMAN RD 62,200 11.8 6.8% 4,200 0.8 37 30 2 30 30 0.002250804
21 30 2
302 1,440 0.042
20 60 1
21 30 2
36 30 2
319 30 2
DIVISION AV ORANGE AV 62,200 11.8 4.2% 2,600 0.5 40 60 1 60 60 0.000696677
ORANGE AV GOLDENROD RD 62,200 11.8 47.4% 29,500 5.6 15 60 1 60 60 0.007904609
Corridor Length Served 100.0% 62,200 11.8 32.6
5 LB MCLEOD/MICHIGAN/LK MARGARET/PERSHINGWILLIE MAYS BV RIO GRANDE AV 53,800 10.2 21.2% 11,400 2.2 36 30 2 30 30 0.007063197
RIO GRANDE AV ORANGE AV 53,800 10.2 15.4% 8,300 1.6 40 60 1 60 60 0.002571252
ORANGE AV GOLDENROD RD 53,800 10.2 63.4% 34,100 6.5 3 60 1 60 60 0.010563817
Corridor Length Served 100.0% 53,800 10.2 49.5
6 SAND LAKE RD/BEACHLINE EXPY304 1,440 0.042
305 1,440 0.042
MANDARIN DR ORANGE BLOSSOM TL 59,800 11.3 24.4% 14,600 2.8 37 30 2 30 30 0.008138239
11 30 2
42 30 2
11 30 2
42 30 2
111 60 1
Corridor Length Served 100.0% 59,800 11.3 17.6
7 LAKE NONABOGGY CREEK RD NARCOOSSEE RD 0 0.0 100.0% 0 0.0 0 0 0 0 0 0.000000000
Corridor Length Served 100.0% 0 0.0 0.0
8 POITRASBOGGY CREEK RD NARCOOSSEE RD 0 0.0 100.0% 0 0.0 0 0 0 0 0 0.000000000
Corridor Length Served 100.0% 0 0.0 0.0
Total Corridor Length Served (miles) = 106.3 CORRIDOR HEADWAYS
15 min or less: 2
more than 15 min: less than or equal to 30 min: 7
over 30 min: 6
Percentage of Corridors with 30 min or less Headways 60%
0.010820990
WASHINGTON ST COLUMBIA ST 42,930 8.1 12.6% 1.05,400 0.00637666020 60
0.006017548
19 30 0.003016539
15 0.013377926
12 10 0.035117057ORANGE AV OIA 59,800 11.3 42.1% 25,200 4.8
Corridor
15ORANGE BLOSSOM TL ORANGE AV 59,800 11.3 20.1% 12,000 2.3
GARLAND AV OLD CHENEY HY 40,670 7.7 47.9% 19,500
720
3.7
FERGUSON DR JOHN YOUNG PY 40,670 7.7 4.9% 2,000 0.4
720 0.000185805INTERNATIONAL DR MANDARIN DR 59,800 11.3 13.4% 8,000 1.5
30BUMBY AV SEMORAN BV 44,900 8.5 31.0% 13,900 2.6 60 0.010319228
15 20 0.008788853W. SUPERSTOP DIVISION AV 62,200 11.8 13.2% 8,200 1.6
0.006728966
20 20 0.004340836IVEY LN WASHINGTON SUPERSTOP 62,200 11.8 8.7% 5,400 1.0
29 29KIRKMAN RD IVEY LN 62,200 11.8 19.8% 12,300 2.3
0.004602821
30 30GARLAND AV BUMBY AV 44,900 8.5 21.2% 9,500 1.8 0.007052710
30 30JOHN YOUNG PY GARLAND 44,900 8.5 13.8% 6,200 1.2
1.7PINE HILLS RD FERGUSON DR 40,670 7.7 21.7% 8,820
JOHN YOUNG PY GARLAND AV 40,670 7.7 25.4% 10,350 2.0
0.017536741
10
8
10
10
10
9
10
10
0.021686747
0.025448734
0.047946890
0.006556840
202.311,90034.6%6.534,400KINGSLAND AV JOHN YOUNG PY 19
20 20 0.021487985HOFFNER AV OIA 43,280 8.2 43.0% 18,600 3.5
20 0.00448244020LAKE MARGARET DR GATLIN AV 43,280 8.2 9.0% 3,880 0.7
15 20 0.0058841650.73,8208.8%8.243,280LA COSTA DR GRANT ST
12,500
LAKE UNDERHILL RD LA COSTA DR 43,280 8 9.6% 4,160 0.8 12 15 0.008009858
15 30 0.005129390HIBISCUS RD LAKE UNDERHILL RD 43,280 8.2 7.7% 3,330 0.6
37.8%6.3
33,080RALEIGH ST
0.3
2,520
INTERNATIONAL DR 33,080 6.3 12.9% 0.84,260
0.5
1.0
WESTGATE DR
1515
29
2.433,080CONROY RDRALEIGH ST
301,5004.5%6.3 0.3
0.6
MAJOR BV I-4
0.001542977
0.025978688
0.015157069
0.00149889233,080 6.3 4.2% 1,400
5,87017.7%6.333,080
28 29
15
3,1007.2%8.142,930PRINCETON STSILVER STAR RD 12 30
121.1CONROY RD MAJOR BV
I-4 12 30
58 58 0.002147391
PRINCETON ST WASHINGTON ST 42,930 8.1 5.9%
AMERICANA BV OAK RIDGE RD 42,930 8.1 12.4% 5,310
4.0
6,42010.1%12.063,320GORE STCENTRAL STATION 6 13 0.0168982941.2
21,19033.5%12.063,320HOFFNER AVGORE ST 12 15 0.027887450
9,01014.2%12.063,320SAND LAKE/ McCOYHOFFNER AV 0.00711465620201.7
15.6% 2,670 0.5 20 20 0.007775189COLONIAL DR ROBINSON ST 17,170 3
0.3
0.3
15 12
20 15
0.005280528
0.004338963CENTRAL BV SOUTH/ANDERSON 17,170 3.3 8.7% 1,490
ROBINSON ST CENTRAL BV 17,170 3.3 7.9% 1,360
SAND LAKE/ McCOY 30 60 0.0058959782.111,20012.0 17.7%63,320TRADEPORT DR
Prepared by City of Orlando Transportation Department, July 2017

Served Corridor Headway: 18.1 Minutes
Colonial Dr. to Westgate Drive
DESIGNATED TRANSIT CORRIDOR: A (KIRKMAN - 6.3 miles served)
Westgate Drive to Raleigh Street
Raleigh Street to Conroy Road
Conroy Road to Major Boulevard
Major Boulevard to I-4
I-4 to International Drive
(22.8% - 1,440 minutes segment headway)
(4.5% - 29 minutes segment headway)
(37.8% - 15 minutes segment headway)
(17.7% - 12 minutes segment headway)
(4.2% - 28 minutes segment headway)
(12.9% - 12 minutes segment headway)

Shader Rd. to Silver Star Rd.
DESIGNATED TRANSIT CORRIDOR: B (LEE RD/JOHN YOUNG - 8.1 miles served)
Silver Star Rd. to Princeton St.
Princeton St. to Washington St.
Washington St. to Columbia St.
Columbia St. to Americana Blvd.
Americana Blvd. to OakRidge Rd.
(6.1% - 30 minutes segment headway)
(7.2% - 12 minutes segment headway)
(5.9% - 19 minutes segment headway)
(12.6% - 20 minutes segment headway)
(34.7% - 60 minutes segment headway)
(12.4% - 58 minutes segment headway)
Served Corridor Headway: 34.6 Minutes
OakRidge Rd. to Sand Lake Rd.
(21.1% - 60 minutes segment headway)

DESIGNATED TRANSIT CORRIDOR: C (OBT - 6.7 miles served)
Amelia Street to Grand Street
(23.4% - 30 minutes segment headway)
Served Corridor Headway: 30.0 Minutes
Clarcona-Ocoee Rd. to Amelia St.
(76.6% - 30 minutes segment headway)

DESIGNATED TRANSIT CORRIDOR: D (ORANGE AV - 12.0 miles served)
Mills Ave. to Central Station
Gore Street to Hoffner Av.
(24.5% - 15 minutes segment headway)
(33.5% - 12 minutes segment headway)
Served Corridor Headway: 13.5 Minutes
Central Station to Gore Street
(10.1% - 6 minutes segment headway)
Sand Lake Rd. to Tradeport
(17.7% - 30 minutes segment headway)
Hoffner Av. To Sand Lake Rd.
(14.2% - 20 minutes segment headway)
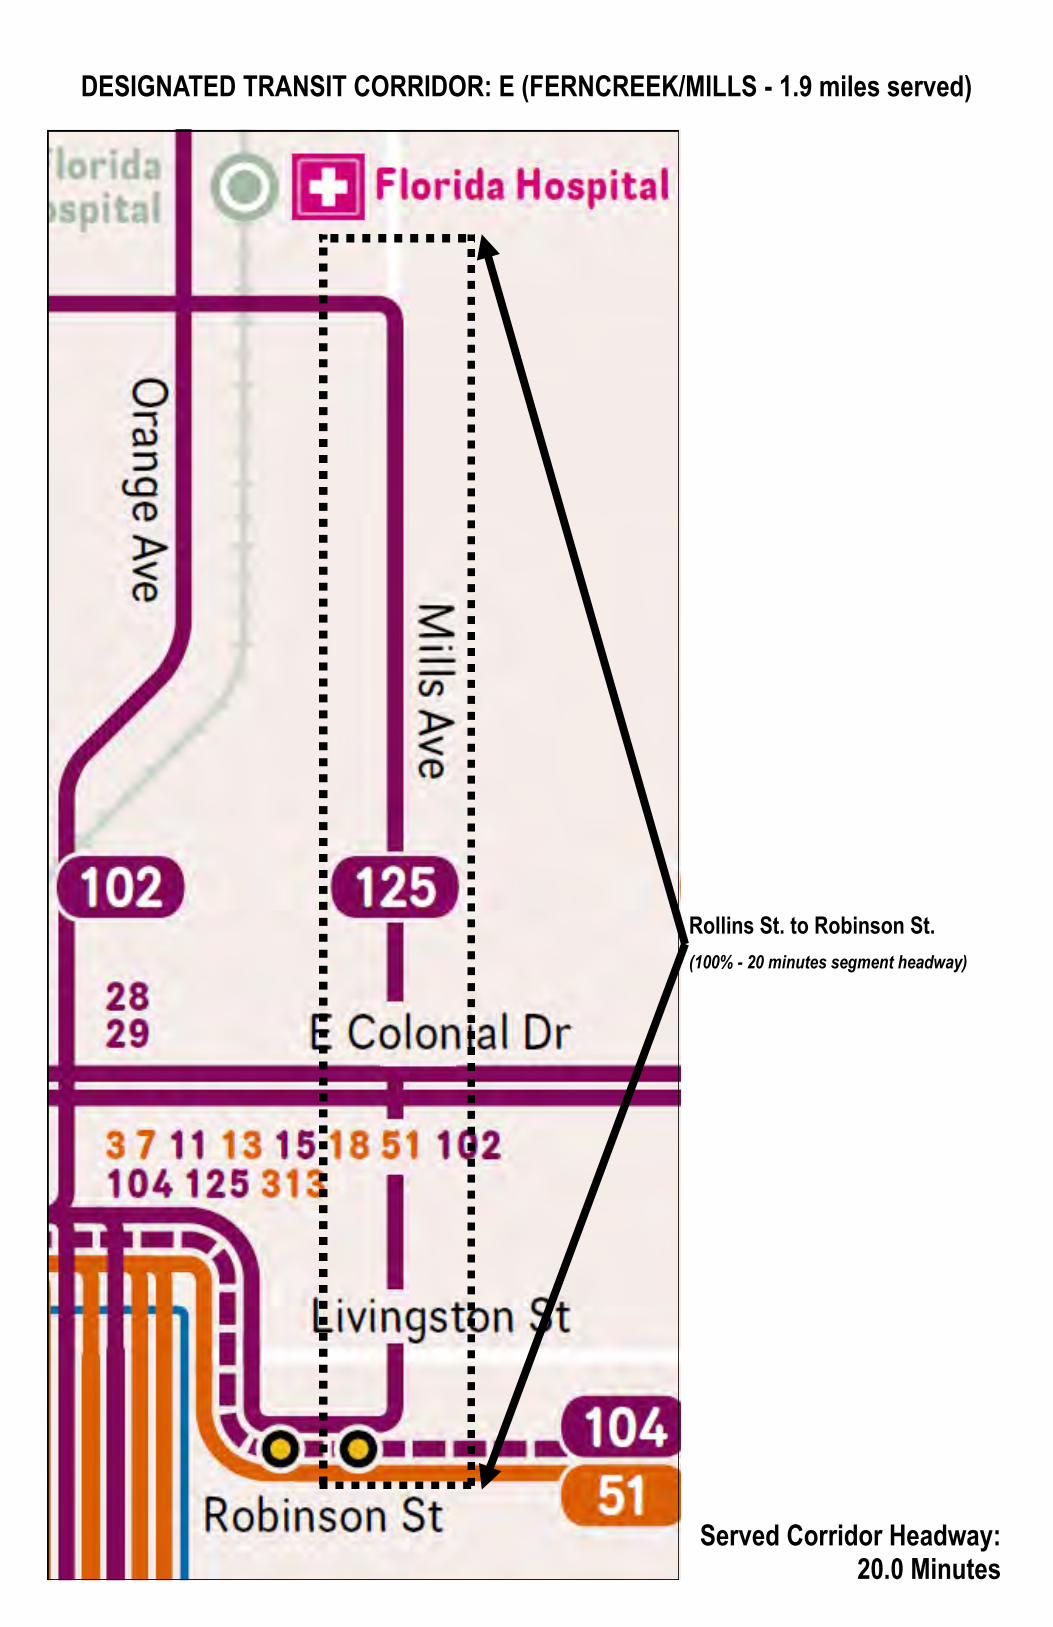
DESIGNATED TRANSIT CORRIDOR: E (FERNCREEK/MILLS - 1.9 miles served)
Rollins St. to Robinson St.
(100% - 20 minutes segment headway)
Served Corridor Headway: 20.0 Minutes

DESIGNATED TRANSIT CORRIDOR: F (BUMBY/PRIMROSE - 3.3 miles served)
Colonial Dr. to Robinson St.
(15.6% - 20 minutes segment headway)
Served Corridor Headway: 29.7 Minutes
Robinson St. to Central Blvd.
(7.9% - 15 minutes segment headway)
Corrine Dr. to Colonial Dr.
(30.2% - 60 minutes segment headway)
Central Blvd. to South/Anderson
(8.7% - 20 minutes segment headway)
South/Anderson to Curry Ford
(30.0% - 30 minutes segment headway)
Curry Ford to Lake Margaret Dr.
(7.7% - 60 minutes segment headway)

DESIGNATED TRANSIT CORRIDOR: G (CONWAY/TRADEPORT - 3.0 miles served)
Served Corridor Headway: 60.0 Minutes
Curry Ford Rd. to Hoffner Av.
(100% - 60 minutes segment headway)

DESIGNATED TRANSIT CORRIDOR: H (SEMORAN/OIA - 8.2 miles served)
Served Corridor Headway: 19.1 Minutes
La Costa Dr. to Grant St.
(8.8% - 15 minutes segment headway)
Hibiscus Rd. to Lake Underhill
(7.7% - 15 minutes segment headway)
Hoffner Av. to Orlando Airport
(43.0% - 20 minutes segment headway)
Gatlin Av. to Hoffner Av.
(12.3% - 30 minutes segment headway)
Lake Margaret Dr. to Gatlin Av.
(9.0% - 20 minutes segment headway)
Grant St. to Lake Margaret Dr.
(9.6% - 30 minutes segment headway)
Lake Underhill to La Costa Dr.
(9.6% - 12 minutes segment headway)

DESIGNATED TRANSIT CORRIDOR: I (HOFFNER/NARCOOSSEE - 0.8 miles served)
Served Corridor Headway: 60.0 Minutes
Reddit Rd. to Old Goldenrod Rd.
(100% - 60 minutes segment headway)

DESIGNATED TRANSIT CORRIDOR: 1 (SILVER STAR/PRINCETON/CORRINE - 6.5 miles served)
Kin
gslan
d A
v. to Jo
hn
Yo
un
g P
rky.
(34.6.1% - 20 m
inu
tes segm
ent h
eadw
ay)
Served Corridor Headway: 22.4 Minutes
Ed
gew
ater Dr. to
Mills A
venu
e
(23.5% - 20 m
inu
tes segm
ent h
eadw
ay)
Mills A
venu
e to B
enn
ett Rd
.
(16.9% - 60 m
inu
tes segm
ent h
eadw
ay)
Joh
n Y
ou
ng
Prky to
Ed
gew
ater Dr.
(25% - 20 m
inu
tes segm
ent h
eadw
ay)

DESIGNATED TRANSIT CORRIDOR: 2 (COLONIAL DRIVE - 7.7 miles served)
Pin
e Hills R
d. to
Ferg
uso
n D
r.
(21.7% - 10 m
inu
tes segm
ent h
eadw
ay)
Served Corridor Headway: 9.8 Minutes Jo
hn
Yo
un
g P
rky. to G
arland
Ave.
(25.4% - 10 m
inu
tes segm
ent h
eadw
ay)
Garlan
d A
ve. to O
ld C
hen
ey Hw
y.
(47.9% - 10 m
inu
tes segm
ent h
eadw
ay)
Ferg
uso
n D
r. to Jo
hn
Yo
un
g P
rky.
(4.9% - 8 m
inu
tes segm
ent h
eadw
ay)

DESIGNATED TRANSIT CORRIDOR: 3 (OLD WINTER GARDEN/SOUTH/ANDERSON/LK UNDERHILL - 8.5 miles served)
Kirkm
an R
d. to
Joh
n Y
ou
ng
Prw
y.
(34.1% - 60 m
inu
tes segm
ent h
eadw
ay)
Served Corridor Headway: 36.2 Minutes
Joh
n Y
ou
ng
Prky. to
Garlan
d A
ve.
(13.8% - 30 m
inu
tes segm
ent h
eadw
ay)
Garlan
d A
ve. to B
um
by A
ve.
(21.2% - 30 m
inu
tes segm
ent h
eadw
ay)
Bu
mb
y Ave. to
Sem
oran
Blvd
.
(31.0% - 30 m
inu
tes segm
ent h
eadw
ay)

DESIGNATED TRANSIT CORRIDOR: 4 (RALEIGH/GORE/CURRY FORD - 11.8 miles served)
Hiaw
assee Rd
. to K
irkman
Rd
.
(6.8% - 30 m
inu
tes segm
ent h
eadw
ay)
Served Corridor Headway: 32.6 Minutes
Kirkm
an R
d. to
Ivey Lan
e
(19.8% - 29 m
inu
tes segm
ent h
eadw
ay)
Wash
ing
ton
Su
persto
p to
Divisio
n A
ve.
(13.2% - 15 m
inu
tes segm
ent h
eadw
ay)
Ivey Lan
e to W
ashin
gto
n S
up
erstop
(8.7% - 20 m
inu
tes segm
ent h
eadw
ay)
Oran
ge A
ve. to G
old
enro
d R
d.
(47.4% - 60 m
inu
tes segm
ent h
eadw
ay)
Divisio
n A
ve. to O
rang
e Ave.
(4.2% - 60 m
inu
tes segm
ent h
eadw
ay)

DESIGNATED TRANSIT CORRIDOR: 5 (LB MCLEOD/MICHIGAN/LK MARGARET/PERSHING - 10.2 miles served)
Served Corridor Headway: 49.5 Minutes
Willie M
ays Blvd
. to R
io G
rand
e Ave.
(21.2% - 30 m
inu
tes segm
ent h
eadw
ay)
Rio
Gran
de A
ve. to O
rang
e Ave.
(15.4% - 60 m
inu
tes segm
ent h
eadw
ay)
Oran
ge A
ve. to G
old
enro
d R
d.
(63.4% - 60 m
inu
tes segm
ent h
eadw
ay)

DESIGNATED TRANSIT CORRIDOR: 6 (SAND LAKE ROAD/BEACHLINE EXPRESSWAY - 11.3 miles served)
Served Corridor Headway: 17.6 Minutes
Intern
ation
al Dr. to
Man
darin
Dr.
(13.4% - 720 m
inu
tes segm
ent h
eadw
ay)
Man
darin
Dr. to
Oran
ge B
losso
m Tr.
(24.4% - 30 m
inu
tes segm
ent h
eadw
ay)
Oran
ge A
ve. to O
rland
o In
ternatio
nal
(42.1% - 12 m
inu
tes segm
ent h
eadw
ay)
Oran
ge B
losso
m Tr. To
Oran
ge A
ve.
(20.1% - 15 m
inu
tes segm
ent h
eadw
ay)

Exhibit #2 - Highly Demanded Roadway Corridors
Roadway To From Type
AADT-
2016 Lanes
LOS D/E
Capacity
LOS D/E
Capacity
Daily Volume:
LOSD/E Capacity
Peak Hour Peak Direction
Volume : LOSD/E Capacity
BOGGY CREEK RD ORANGE COUNTY LINE SR 417 Arterial 20,400 2 17,700 880 115% 111%
BOGGY CREEK RD AIRPORT PARK DR LANDSTREET RD Arterial 16,900 2 17,700 880 95% 92%
BRIERCLIFF DR DELANEY AVE CURRY FORD RD Collector 15,500 2 15,600 800 99% 93%
COLUMBIA ST SR 435 / KIRKMAN RD JOHN YOUNG PKWY Collector 16,500 2 15,600 800 106% 99%
CONROY RD SR 435 KIRKMAN RD US 441 S OBT Arterial 37,500 4 33,800 1,700 111% 106%
E COLONIAL DR ORANGE AVE SUMMERLIN AVE Arterial 42,500 4 33,800 1,700 126% 120%
E COLONIAL DR SUMMERLIN AVE N FERN CREEK AVE Arterial 33,000 4 33,800 1,700 98% 93%
E COLONIAL DR N FERN CREEK AVE N PRIMROSE DR Arterial 50,000 4 33,800 1,700 148% 141%
E COLONIAL DR PRIMROSE AVE SEMORAN BV Arterial 67,000 6 59,900 3,020 112% 106%
EDGEWATER DR SR 527 / ORANGE AVE PAR ST Arterial 15,300 2 15,600 800 98% 92%
HOFFNER AVE SR 436 CONWAY RD Arterial 22,000 2 17,700 880 124% 120%
HOFFNER AVE GOLDENROD RD SR 436 Arterial 19,300 2 17,700 880 109% 105%
LAKE UNDERHILL RD C526/LK UNDERHILL RD PALMER ST Arterial 17,800 2 15,600 800 114% 107%
LAKE UNDERHILL RD PALMER ST SR 408 EB ON Arterial 17,100 2 15,600 800 110% 102%
LAKE UNDERHILL RD SR 15 / CONWAY RD S SEMORAN BLVD Arterial 16,500 2 15,600 800 106% 99%
LAKE UNDERHILL RD SEMORAN BLVD GOLDENROD RD Arterial 16,200 2 15,600 800 104% 97%
N JOHN YOUNG PKWY CR 526/WINTER GDN RD SR 50 / COLONIAL DR Arterial 54,000 6 59,900 3,020 90% 86%
N JOHN YOUNG PKWY SR 50/ COLONIAL DR SR 438 /PRINCETON ST Arterial 52,500 4 39,800 2,000 132% 126%
N MILLS AVE SR 50/COLONIAL DR LAKE HIGHLAND DR Arterial 31,500 4 33,800 1,700 93% 89%
N MILLS AVE LAKE HIGHLAND DR PRINCETON ST Arterial 40,000 4 33,800 1,700 118% 113%
N ORANGE AVE MAGNOLIA AVE PRINCETON ST Collector 14,700 2 15,600 800 94% 88%
N SEMORAN BLVD CR526/LAKE UNDERHILL E COLONIAL DR Arterial 59,500 6 59,900 3,020 99% 94%
NARCOOSSEE RD LEE VISTA BLVD GOLDENROD RD Arterial 22,000 2 17,700 880 124% 120%
RADEBAUGH WAY VINELAND RD MILLENIA BLVD Collector 20,000 2 15,600 800 128% 120%
S GOLDENROD RD PERSHING AVE CURRY FORD RD Arterial 44,500 4 39,800 2,000 112% 107%
S JOHN YOUNG PKWY SR 482/SAND LAKE RD LB MCLEOD RD Arterial 58,000 6 59,900 3,020 97% 92%
S KIRKMAN RD METRO WEST BLVD CR526/OLD WINT GD RD Arterial 57,500 6 59,900 3,020 96% 91%
S KIRKMAN RD I-4 W METRO WEST BLVD Arterial 59,500 6 59,900 3,020 99% 94%
S ORANGE AVE MICHIGAN ST GORE STREET Arterial 34,500 4 33,800 1,700 102% 97%
S ORANGE BLOSSOM TRL KALEY AVE GORE ST Arterial 32,000 4 33,800 1,700 95% 90%
S ORANGE BLOSSOM TRL GORE ST ROBINSON ST Arterial 37,000 4 33,800 1,700 109% 101%
S ORANGE BLOSSOM TRL CR-506 / OAKRIDGE RD I-4 Arterial 59,000 6 59,900 3,020 98% 94%
S SEMORAN BLVD SR 552/CURRY FORD RD CR526/LAKE UNDERHILL Arterial 55,000 6 59,900 3,020 92% 87%
S SEMORAN BLVD SR 528 / BR 750317 SR 552/CURRY FORD RD Arterial 65,000 6 59,900 3,020 109% 103%
SILVER STAR RD SR 438 /PRINCETON ST SR423/JOHN YOUNG PKY Arterial 16,100 2 17,700 880 91% 88%
W COLONIAL DR US17/92/441SR500/600 ORANGE AVE Arterial 38,000 4 33,800 1,700 112% 107%
W SAND LAKE RD INTERNATIONAL DR GREENBRIAR PKWY Arterial 45,000 4 39,800 2,000 113% 108%
W SAND LAKE RD GREENBRIAR PKWY JOHN YOUNG PKWY Arterial 55,000 4 39,800 2,000 138% 132%
Provided by the City of Orlando - 2017
(based on FDOT Traffic Counts - 2016)

Exhibit #3 - Transportation CIP Summary
Requested Requested Requested Requested Requested
Transportation Capital Improvement Program (CIP) Summary FY 17/18 FY 18/19 FY 19/20 FY 20/21 FY 21/22
ROAD Areawide Signal System Fiber Gas Tax 100,000$ 100,000$ 100,000$ 100,000$ 100,000$ ROAD Boggy Creek: Jetport Dr to Greenway (SR 417) Impact Fees -$ 300,000$ 300,000$ 300,000$ 300,000$ ROAD Brick Street Restoration Gas Tax 100,000$ 100,000$ 100,000$ 100,000$ -$ ROAD Developer Signals Matching Funds Gas Tax -$ 150,000$ 150,000$ 150,000$ 150,000$ ROAD Econlockhatchee Trail 4 Lane: Lee Vista Impact Fees 1,000,000$ 1,000,000$ 1,000,000$ 1,000,000$ 1,000,000$ ROAD Grand National Dr: Oakridge Rd to Sand Lake Rd Impact Fees -$ -$ 100,000$ 100,000$ -$ ROAD Intersection Safety Improvements Gas Tax 350,000$ 200,000$ 200,000$ 200,000$ 200,000$ ROAD Millenia & Oak Ridge Dual Left SB Impact Fees 160,000$ 150,000$ -$ -$ -$ ROAD Narcoossee Widening: SR 528 - SR 417 Impact Fees 1,000,000$ 1,000,000$ -$ -$ -$ ROAD New Traffic Signals - Gas Tax Gas Tax 370,000$ 370,000$ 370,000$ 370,000$ 370,000$ ROAD New Traffic Signals - Impact Fees Impact Fees 1,100,000$ 600,000$ 600,000$ 600,000$ 600,000$ ROAD Pavement Marking Maintenance Gas Tax 350,000$ 350,000$ 350,000$ 350,000$ 350,000$ ROAD Pavement Rehab - CIP CIP 1,000,000$ 2,000,000$ 2,000,000$ 2,000,000$ 2,000,000$ ROAD Pavement Rehab - Gas Tax Gas Tax 3,050,000$ 2,000,000$ 2,000,000$ 2,000,000$ 2,000,000$ ROAD Radebaugh Way Road Widening Impact Fees 200,000$ 200,000$ -$ -$ ROAD Railroad Grade Crossing Rehab Gas Tax 100,000$ 100,000$ 100,000$ 100,000$ -$ ROAD Sligh Blvd & Columbia Street Impact Fees 2,000,000$ -$ -$ -$ -$ ROAD Terry Ave South Extension Impact Fees 652,000$ 332,000$ 332,000$ 332,000$ 332,000$ ROAD Traffic Counts & Time Studies Gas Tax 100,000$ 100,000$ 100,000$ 100,000$ 100,000$ ROAD Traffic Signal Refurbishment Gas Tax 200,000$ 200,000$ 200,000$ 200,000$ 200,000$ ROAD USTA Entry Road Gas Tax 800,000$ 800,000$ 800,000$ -$ -$
12,632,000$ 10,052,000$ 8,802,000$ 8,002,000$ 7,702,000$
Total Roadways & Related Facilities: 47,190,000$
TRAN LYNX Operations Gas Tax 3,873,000$ 3,950,460$ 4,029,469$ 4,110,059$ 4,192,260$ TRAN Semoran SA Impact Fees -$ 200,000$ -$ -$ -$ TRAN Sunrail Corridor Quiet Zone Gas Tax 400,000$ 400,000$ 400,000$ 400,000$ 400,000$ TRAN Sunrail Phase 3 OIA Impact Fees 500,000$ 500,000$ 500,000$ 500,000$ 500,000$ TRAN Transportation Studies/Professional Service Impact Fees -$ -$ 150,000$ -$ -$
4,773,000$ 5,050,460$ 5,079,469$ 5,010,059$ 5,092,260$
Total Transit Services: 25,005,248$
BKPD ADA Transition Plan Gas Tax 250,000$ 250,000$ 250,000$ 250,000$ -$ BKPD Bicycle Plan Implementation Gas Tax 200,000$ 150,000$ 150,000$ 150,000$ 150,000$ BKPD Colonial Overpass Impact Fees 100,000$ 100,000$ 100,000$ -$ -$ BKPD Curb Ramp Construction/Repair Gas Tax 150,000$ 150,000$ 200,000$ 200,000$ 200,000$ BKPD Downtown Connector Trail - Lk Underhill/Orange Impact Fees 545,000$ 250,000$ 250,000$ -$ -$ BKPD Misc. Sidewalk Repair - CIP CIP 300,000$ 300,000$ 300,000$ 300,000$ 300,000$ BKPD Misc. Sidewalk Repair - Gas Tax Gas Tax 200,000$ 200,000$ 200,000$ 200,000$ -$ BKPD Orlando Urban Trail B/T Overpass Magnolia Impact Fees 400,000$ 250,000$ 250,000$ -$ -$ BKPD School Safety Sidewalks - CIP CIP 400,000$ 400,000$ 400,000$ 400,000$ 400,000$ BKPD School Safety Sidewalks - Gas Tax Gas Tax 100,000$ 100,000$ 100,000$ 100,000$ -$ BKPD Shingle Creek Trail Support Impact Fees 500,000$ -$ -$ -$ -$
3,145,000$ 2,150,000$ 2,200,000$ 1,600,000$ 1,050,000$
Total Bicycle & Pedestrian Facilities: 10,145,000$
20,550,000$ 17,252,460$ 16,081,469$ 14,612,059$ 13,844,260$
Roadways & Related Facilities
Transit Services
Bicycle & Pedestrian Facilities
GRAND TOTAL:
Prepared by the City of Orlando, July 2017
Capacity Availability Report August 1, 2017
Page 21
APPENDIX B: POTABLE WATER


Capacity Availability Report August 1, 2017
Page 22
APPENDIX C: WASTEWATER


Capacity Availability Report August 1, 2017
Page 23
APPENDIX D: SOLID WASTE

July 20, 2017
MEMORANDUM TO: Colandra Jones, Planner II City Planning Division From: Charles F. Wade, Assistant Division Manager Solid Waste Management Division Subject: Capacity Availability Report – July 1, 2016 to June 30, 2017 As you requested in your July 9, 2017 memo, the following information is submitted for the Solid Waste Management Division. It covers the period between July 1, 2016 to June 30, 2017. 1.) Eleven commercial routes, twenty-two residential routes, four yard waste
routes, one food waste route and four recycling routes. 2.) Total tonnage collected was 100,782 commercial, 51,249 residential garbage,
8,478 recycling, and 13,219 recycled yard waste. 3.) Collection fleet consists of 17 front-end loaders, 31 automated side-loaders, 6
claw bulk collection vehicles, 11 rear-end loaders, and 4 roll-off collection vehicles.
The level of service and capacity availability for all public facilities was adequate as of July 1, 2017. If you have any questions, please call me at 246-3693. cc: Michael. W. Carroll, Bureau Chief 99cap-1cw.doc

Capacity Availability Report August 1, 2017
Page 24
APPENDIX E: PARKS

Page 1 Annual Capacity Availability Report – Parks Analysis – June 30, 2017
MEMORANDUM August 1, 2017 TO: Dean J. Grandin, Jr., AICP, Concurrency Management Official FROM: Paul S. Lewis, FAICP, Chief Planning Manager Denise J. Riccio, RLA, FPR Planner and Grants Manager SUBJECT: Parks Level of Service ‐ Status as of June 30, 2017
INTRODUCTION The purpose of this memorandum is to update the City’s Level of Service (LOS) status for parks as of June 30, 2017. This analysis is meant to satisfy the requirements set forth in the Growth Management Plan (GMP) Recreation Element and the Land Development Code (LDC) ‐ Chapter 59 Concurrency Management, and more specifically LDC Sections 59.306 and 59.702. ANALYSIS OF PARK LOS CONDITIONS Adopted Level of Service Standards and Amenity Guidelines Consistent with GMP Policy 1.1.1, Orlando utilizes a City‐wide LOS standard of 3.25 acres per 1,000 population of Community and Neighborhood park land combined. In addition to the City‐wide standard, LOS is measured for individual Community and Neighborhood park service areas. The Community Park Sector LOS standard is 1.3 acres per 1,000 population, while the Neighborhood Park LOS standard is 0.75 acres per 1,000 population. Individual Community and Neighborhood park service areas are depicted on the attached Future Parks Conditions map. Recreation Policy 1.1.1 provides specific criteria for determining the timing of park acquisition and development for Community and Neighborhood parks:
“…For planning purposes, the prototypical size for a community park shall be 15 acres, and the prototypical size for a neighborhood park shall be 5 acres. The following thresholds shall be used to schedule the funding and construction of new community and neighborhood parks: a. A park project shall be added to the Capital Improvement Program and Capital
Improvement Element when the level of service deficiency reaches 50% of the prototypical size for that specific park type (i.e., 7.5 acre deficiency in a community park sector or a 2.5 acre deficiency in a neighborhood park service area).
Page 2 Annual Capacity Availability Report – Parks Analysis – June 30, 2017
b. A park project shall be scheduled for funding in the first year of the Capital Improvement Program when the level of service deficiency reaches 75% of the prototypical size for that specific park type (i.e., an 11.25 acre deficiency in a community park sector or a 3.75 acre deficiency in a neighborhood park service area).
c. A park project shall be constructed when the level of service deficiency for a specific park type reaches 90% of the prototypical park size (i.e., a 13.5 acre deficiency in a community park sector or a 4.5 acre deficiency in a neighborhood park service area)…”.
In addition to the adopted acreage standards, the following general guidelines for activity based amenities have been developed. While not used for concurrency management purposes, these guidelines are used to guide park acquisition and development. Little League Baseball Field 1 per 10,000 population Softball Field 1 per 5,000 population Soccer/Multi‐Purpose Field 1 per 10,000 population Swimming Pool 1 per 20,000 population Basketball Court 1 per 10,000 population Tennis Court 1 per 10,000 population Please refer to the attached Future Parks Conditions Map and Park LOS Summary Table for the remainder of this analysis. City‐Wide LOS As of June 30, 2017, the City of Orlando had an estimated 278,669 residents and 1,919.43 acres of combined Community and Neighborhood level park land. The City’s population grew by 10,827 since June 30, 2016, or approximately 4% (from 267,842 to 278,669). The amount of Community and Neighborhood level park land also grew from 1,892.94 to 1,919.43 acres, or 26.49 acres, during that same one year period. Most of the growth in park acreage can be accounted for in the Randal Park, Storey Park, and Lake Nona – Laureate Park neighborhoods in southeast Orlando where a number of new bike trails and small neighborhood parks and greens have been developed. Using the City‐wide LOS standard of 3.25 acres per 1,000 population, Orlando is currently registering a City‐wide surplus of 1,013.76 acres of combined Community and Neighborhood level park land. If no new parks were built (the worst case scenario), the City‐wide surplus would decrease to 952.14 acres in 2020, 804.53 acres in 2030, and 679.32 acres in 2045. However, with additional park projects programmed for completion in the GMP Capital Improvements Element (CIE) and Capital Improvement Program (CIP), and other publicly and privately funded park facilities in the southeast area, it is anticipated that a substantial City‐wide surplus will be maintained through the planning period. Community Park LOS

Page 3 Annual Capacity Availability Report – Parks Analysis – June 30, 2017
The LOS status for Community Park Sectors 1 through 5 remains excellent, with surpluses ranging from 49.10 acres in Southeast Sector 5 to 237.93 acres in Southwest Sector 3. While these areas of the City appear to be well served from an acreage standpoint, the level of service in each should be enhanced with additional activity‐based facilities including little league baseball fields, softball fields, and soccer/multi‐purpose fields as resources allow. In particular, Community Park Sector 5 is the area of the City which will experience by far the most population growth during the next +/‐30 years. Not only does this area include Lake Nona, it also includes the Poitras Planned Development and the recently annexed Storey Park and Starwood Planned Developments. It is projected that the population in this area will increase from 23,115 people today, to 30,294 people in 2020, 43,902 in 2025, 53,861 in 2030, and to 75,458 people by the year 2045. Taking population growth into consideration, and assuming the worst case scenario of no new Community Park land being developed in this area, the LOS acreage surplus would decline from 49.10 acres today, to 22.08 acres in 2025, and 9.13 acres in 2030, with deficiencies appearing in later years. Using the timing thresholds specified in Recreation Policy 1.1.1, from a technical acreage standpoint, a new Community Park would not be required to be incorporated into the GMP Capital Improvements Element and CIP until after 2035. However, and this is a critically important “however”, park acreage does not tell the entire story. For community parks, one must also look at the activity‐based amenities available to area residents. While there are limited facilities at NorthLake Park Community School, as well as ample bike/pedestrian trails, there will be a significant need for activity‐based amenities, most notably ballfields (soccer, little league baseball, and softball), in the future. Residents in Community Park Sector 5 will ultimately need an additional 6 to 7 little league ballfields, 15 softball fields, and 6 to 7 soccer/multi‐purpose fields. Southeast Community Park Sector 6 (the Vista East area) is currently not meeting adopted LOS standards, experiencing a deficiency of 4.98 acres. Taking population growth into consideration, and assuming the worst case scenario of no new Community Park land being developed in this area, the LOS acreage deficiency could grow to 5.07 acres in 2020, 11.36 acres in 2030, and 19.43 acres by 2045. Using the timing thresholds specified in Recreation Policy 1.1.1, a funded park project would need to be added to the CIP and CIE to address this current and projected deficiency sometime between 2021 and 2025. However, as with the Southeast Orlando Sector Plan area (Sector 5), the acreage deficiency tells only part of the story. Residents in Community Park Sector 6 will ultimately need an additional 2 little league ballfields, 4 softball fields, and 2 soccer/multi‐purpose fields. In order to address Community Park needs in the southeast portion of the City, it is recommended that six to seven new community level parks be developed. Please note that the proposed amenities described below for each park are conceptual only and would necessarily be refined in the park master planning, budgeting, and public input process. Following is a summary of the proposed/potential parks, in anticipated chronological order of completion.

Page 4 Annual Capacity Availability Report – Parks Analysis – June 30, 2017
Community Park #1 – Lake George Property. The +/‐25.57 acre Lake George property, located west of Dixie Bell Drive and north of Gatlin Avenue (in Community Park Sector 4), should be developed within the next 2 to 3 years. Located adjacent to Orange County’s Barber Park, the City and County have reached an agreement that calls for the County to design, permit and construct the park in coordination with the City’s FPR Department, while simultaneously modifying the existing Barber Park so that the two parks can operate as efficiently as possible. The preliminary plan for the Lake George property calls for the development of 2 to 3 soccer/multi‐purpose sports fields and other park amenities. Environmental remediation (for a past agricultural/cow dipping use) has been completed, although monitoring will be required for several more years.
Community Park #2 – OIA East Airfield Property. Located north of Dowden Road and west of Narcoossee Road (in Community Park Sector 5), the City of Orlando, Greater Orlando Aviation Authority, and Tavistock/Lake Nona are partnering to create a +/‐25 acre community park that will not only provide much needed recreational amenities, but also essential land use buffering between aircraft operations associated with the Orlando International Airport and the NorthLake Park residential neighborhood. The park land will be acquired by Lake Nona from GOAA, and then designed, permitted and constructed by Lake Nona. Following completion, the park will be conveyed to the City of Orlando. Planned amenities include 1 adult and 2 Little League baseball fields, 1 softball/coach pitch Little League field, a community garden, and a playground. It is anticipated that this park will be built within the next year.
Community Park #3 – Laureate Park Property (Lake Nona South). Located south of Laureate Boulevard and west of Kellogg Avenue in Lake Nona’s Laureate Park neighborhood (in Community Park Sector 5), this +/‐20.20 acre community park will provide much needed recreational amenities for residents in this rapidly developing neighborhood. Similar to the OIA East Airfield property, the City and Tavistock/Lake Nona are partnering to create this activity‐based community park. The park will be designed, permitted and constructed by Lake Nona. Following completion, the park will be conveyed to the City of Orlando. Planned amenities include 4 multi‐purpose fields, and it is anticipated that the park will be built within the next year. The proposed park is located adjacent to a planned elementary school and so there is a possibility of a joint use agreement between Orange County Public Schools (OCPS) and the City.
Community Park #4 – Southport Property. Located south of Barnstable Place and west of Daetwyler Drive (in Community Park Sector 4), the +/‐50.46 acre Southport Community Park currently features six baseball fields, tennis courts, a basketball court, and other amenities. The FPR Department has identified the possibility of creating a premier baseball facility by adding to the 6 baseball fields existing on site. At least 15 additional acres of parkland would be required if property is available directly adjacent to the existing Southport Community Park (approximately 23 acres would be needed if not adjacent to the existing park). Anticipated amenities include 4 additional baseball fields, a playground and other park amenities, as well as a potential community center. The timing for development of

Page 5 Annual Capacity Availability Report – Parks Analysis – June 30, 2017
this potential park is unknown as it is associated with the redevelopment of the Southport/former Orlando Naval Training Center Annex property.
Community Park #5 – Wewahootee PD (aka Storey Park). Located north of Moss Park Road and east of the Central Florida Greenway/SR 417 (in Community Park Sector 5), the Storey Park project consists of 2,752 residential units. The project is required to provide a minimum of 7.2 acres of community‐level park land and 4.1 acres of neighborhood‐level park land, with specific acreage amounts timed with residential unit counts and individual phases. For instance, a minimum of 4 acres of community park land must be constructed prior to the issuance of the Certificate of Occupancy for the 1,538th residential unit. The remaining 3 acres must be constructed prior to issuance of the Certificate of Occupancy for the 2,692nd residential unit. All community and neighborhood parks within Storey Park will be developed and owned by the developer (i.e., privately owned and maintained) but open to the general public. Residential construction has already begun within the project. It is anticipated that the first community park acreage will be developed sometime in the next 4 to 5 years based on residential absorption.
Community Park #6 – Vista Park PD Property. Located north of the Beachline Expressway/ SR 528 and east of Narcoossee Road (in Community Park Sector 6), the Vista Park PD consists of 3,800 single family and 500 multifamily units. The developer is required to provide 30 acres of community‐level park land and 10 acres of neighborhood‐level park land. However, the PD language states that the 30 acres of community park land may be transferred to the Starwood PD located south of the Beachline Expressway subject to approval of an agreement between the developer and the City. The reason for this provision is to provide the City with flexibility in determining if a larger 60 acre regional park on the Starwood property would be preferable in terms of operations and efficient service provision. The timing for acquisition and development of this park is unknown at this time, being dependent on the remediation and clean‐up of the subject property which is part of the former Pinecastle Jeep Range (a Formerly Use Defense Site). If developed on the Vista Park site (rather than the Starwood site), FPR staff have determined that the park should include at least 2 basketball courts, 2 tennis courts, a soccer/multi‐purpose field, and a 4‐field softball complex, along with a playground and other park amenities including the possibility of a community center.
Community Park #7 – Starwood PD Property. Located south of the Beachline Expressway/ SR 528 and east of Storey Park (in Community Park Sector 5), the Starwood PD consists of 4,400 single family and 2,000 multifamily residential units. The project is required to provide a minimum of 47.36 acres of community and neighborhood‐level park land, with at least a 30 acre community park site being provided. The community park acreage associated with the Vista Park PD may be combined with the Starwood PD community park acreage to create a 60 acre regional community park, with the specific location, type of facilities, timing and construction responsibilities being executed through an agreement with the City. The PD notes that the community park must be constructed concurrent with the construction of 33% of the residential units (or by the Certificate of Occupancy for the

Page 6 Annual Capacity Availability Report – Parks Analysis – June 30, 2017
2,112th residential unit). Staff estimates that the timing of construction for the community park will occur sometime between 2020 and 2030. As the project proceeds, staff will continue to analyze the project and market conditions to provide a more accurate estimation.
Neighborhood Park LOS The LOS status of the City’s Neighborhood Park Service Areas (NPSA’s) varies to some degree. NPSA’s 1 through 17, and 19 through 26 are all currently registering surpluses. However, NPSA 18 has an existing deficiency, and future deficiencies are anticipated in other NPSA’s. NPSA #18 (South Semoran East Area): NPSA #18 is bounded by Pershing Avenue to the north, the BeachLine Expressway to the south, Goldenrod Road and Narcoossee Road to the east, and Semoran Boulevard to the west. This area includes a small number of single family homes, the Countryside neighborhood made up of for‐sale duplexes, as well as a number of multifamily developments which have private recreational amenities. Two multifamily projects in particular have constructed neighborhood‐level park amenities in the past several years, including the gated Carter Glen condominium project and the Grandville at Jubilee Park apartment project. However, there are no City neighborhood park facilities in this area. Unfortunately, this service area is experiencing a fairly significant neighborhood park LOS deficiency of 4.55 acres. In the past, the City was able to utilize the recreational amenities associated with McCoy Elementary School through a Joint Use Agreement (JUA). However, because of the rebuilding of the school and the subsequent reconfiguration of the recreational amenities including lack of physical accessibility, FPR has found that operating recreational programs at this location is problematic. Because the previous JUA is no longer in place, the City can no longer count the school’s recreational amenities in our neighborhood park LOS calculations. NPSA #18 currently has approximately 9,830 residents generating a neighborhood park need for 7.37 acres. While the 2.82 acres of privately owned park land associated with the Carter Glen and Grandville at Jubilee Park projects can be counted in the LOS analysis, a deficiency of 4.55 acres remains. That deficiency is expected to grow to 5.41 acres by 2020 and 6.37 acres by 2030. Recreation Policy 1.1.1 states that a park project shall be scheduled for funding in the first year of the Capital Improvement Program when the level of service deficiency reaches 75% of the prototypical size for that specific park type, which in this case is 3.75 acres. Policy 1.1.1 goes on to state that a park project shall be constructed when the LOS deficiency reaches 90% of the prototypical size for a neighborhood park, or 4.5 acres. It is estimated that the 4.5 acre threshold was exceeded this year. Therefore, the City will need to address this deficiency in one or a combination of the following ways:
1) Renew the City/OCPS Joint Use Agreement at McCoy Elementary. This option could include a re‐design of the existing substandard little league ballfield into a multipurpose field that would better serve the needs of the school and the City.

Page 7 Annual Capacity Availability Report – Parks Analysis – June 30, 2017
2) Add a neighborhood park project to the City’s Capital Improvement Program budget and build a new 5‐6 acre neighborhood park (or two smaller parks). This option would require park land acquisition and development at significant cost to the City. Finding a suitable park location would be difficult because of the way residential units in this area are distributed (i.e., multifamily developments strung out in a linear pattern along the Semoran Boulevard corridor between Pershing Avenue and LeeVista Boulevard), and high land values associated with commercial properties in the LeeVista and Orlando Corporate Center projects which are the only places where substantial, park‐suitable vacant land exists in the City portion of this NPSA. It should be noted that the City does own a small 2.89 acre piece of property at the southeast corner of Turnbull Drive and Commander Drive; however, that property has some environmental constraints and has been identified as a potential City Housing Department project site.
3) Utilize Recreation Policy 1.1.3, which states that “If no developable land is available for parks in a neighborhood park service area exhibiting measurable unmet demand, suitable alternate sites in adjacent service areas shall be identified and developed as appropriate. Such sites may be used to satisfy the minimum acreage requirements for that service area for the purpose of concurrency.” This NPSA is located adjacent to NPSA #17 (across Semoran Boulevard) which has a significant neighborhood park acreage surplus of 33.84 acres (NPSA #17 includes Airport Lakes Park). If the population of NPSA #18 was added to NPSA #17, a +29 to +26‐acre surplus for the combined area would exist and such a surplus would continue through the 2045 projection period. While this option solves the technical LOS concurrency issue, it does not necessarily solve the real issue of lack of recreational amenities in NPSA #18. It should be noted that parents would be unlikely to allow their children to travel from the subject area across Semoran Boulevard to Airport Lakes Park other than by car. Such a trip is certainly not safely walkable for children.
4) Initiate an amendment to GMP Recreation Policy 1.1.15 to state that, because of the unique physical characteristics of the service area and presence of private recreational amenities associated with multifamily projects, the recreation needs within NPSA 18 shall be met through utilization of the City‐wide combined level of service standard for community and neighborhood parks.
Option #3 has been utilized for the past three years. NPSA’s 19‐24 and 26 (Vista East, Southeast Orlando Sector Plan, and Storey Park Areas): To date, the developers of the residential projects in NPSA’s 19‐24 have provided neighborhood‐level park land consistent with the City’s Growth Management Plan. The developers of properties within the Southeast Orlando Sector Plan area (NPSA’s 21‐24) are required to provide neighborhood parks to serve their projected population according to the LOS standards specified in the Growth Management Plan. Similar requirements were incorporated into the Vista Park PD in NPSA 20, as well as the Storey Park and Starwood PD’s in NPSA 26. In fact, these are currently the only areas of the City where some form of mandatory park land dedication is required. As residential Specific Parcel Master Plans are brought forward, staff will work with the developers to appropriately locate those neighborhood park facilities. As an

Page 8 Annual Capacity Availability Report – Parks Analysis – June 30, 2017
example, construction of Lake Nona’s Laureate Park residential project is in full swing. As part of this residential project, Lake Nona will be developing over 20 acres of publicly accessible neighborhood‐level park land, which will be maintained by the applicable homeowner’s association. Because of this and other similar privately funded park development activity, no additional action in terms of providing neighborhood‐level park land is required by the City for these areas at this time. Neighborhood Park Special Study Areas A‐G: Several policies under Objective 1.1 of the Recreation Element state that deficiencies in Neighborhood Park Special Study Areas A through G will be addressed through the City‐wide LOS standard for combined community and neighborhood parks, and that because of special conditions, no funds will be expended in these areas for new neighborhood park land. PARK IMPACT FEE UPDATE On September 15, 2016, the Orlando City Council approved an ordinance creating a park impact fee to provide a much‐needed funding source to assist in increasing the capacity of Orlando’s park system to meet residents’ recreation needs as the population increases. The impact fee went into effect on March 1, 2017. The demand for new and enhanced parks increases as our residential population increases. As such, the fee is assessed on new residential development at a rate of $966 for each newly constructed single family home and $825 for each newly constructed multi‐family unit. Credits may be given for demolished residential units at the time of permitting for new ones or for certified affordable housing units. Although the fee per unit is significant, it is but a fraction of what it costs when building new amenities. The City purposefully kept the fees lower than those of surrounding jurisdictions to prevent it from being a hardship on developers and residents. Supplemental funding from traditional sources such as the City’s Capital Improvement Program funds or grants will still be needed on many projects, but the impact will help tremendously.
The impact fee ordinance organizes the City into three sections with everything above SR 408 composing the North Benefit Area. Orange Avenue and State Road 528 mark the line between the Southeast and Southwest Benefit Areas. Park impact fee revenues for each area must be spent on increasing park capacity within the area in which it is collected, with the exception of regional parks, where funds from any area can be used since regional parks serve a citywide need. The park impact fee has collected approximately $362,000 in total by June 30, 2017, almost all from the southeast area of Orlando. Funds will be used on projects that increase the capacity of the City park system as identified in the City of Orlando Families, Parks and Recreation Vision Plan. For example, adding appropriate sport lighting to existing multi‐purpose fields allows nearly triple the usage during fall and winter months when the sun sets early in the evening.

Page 9 Annual Capacity Availability Report – Parks Analysis – June 30, 2017
Team practices and games can be held during evening hours, where they cannot on unlighted fields, thus increasing the capacity of the park to accommodate team sports. I hope that this information is helpful. If you have any questions, please let me know. Thank you for your time and consideration.
xc: Lisa Early; John Perrone; Rick Howard; Laurie Botts; Keith Grayson; Elisabeth Dang; Colandra Jones.

Page 10 Annual Capacity Availability Report – Parks Analysis – June 30, 2017

Page 11 Annual Capacity Availability Report – Parks Analysis – June 30, 2017