cannabis and hallucinogens - wdr.unodc.org · 2 world drug report 2019 cannabis and hallucinogens...
TRANSCRIPT

5CANNABIS ANDHALLUCINOGENS
2019
5CANNABIS ANDHALLUCINOGENS
2019

© United Nations, June 2019. All rights reserved worldwide.ISBN: 978-92-1-148314-7eISBN: 978-92-1-004174-4United Nations publication, Sales No. E.19.XI.8
This publication may be reproduced in whole or in part and in any formfor educational or non-profit purposes without special permission fromthe copyright holder, provided acknowledgement of the source is made.The United Nations Office on Drugs and Crime (UNODC) would appreciatereceiving a copy of any publication that uses this publication as a source.
Suggested citation:World Drug Report 2019 (United Nations publication, Sales No. E.19.XI.8).
No use of this publication may be made for resale or any other commercialpurpose whatsoever without prior permission in writing from UNODC.Applications for such permission, with a statement of purpose and intent of the reproduction, should be addressed to the Research and Trend Analysis Branch of UNODC.
DISCLAIMER
The content of this publication does not necessarily reflect the views orpolicies of UNODC or contributory organizations, nor does it imply any endorsement.
Comments on the report are welcome and can be sent to:
Division for Policy Analysis and Public AffairsUnited Nations Office on Drugs and CrimePO Box 5001400 Vienna AustriaTel: (+43) 1 26060 0Fax: (+43) 1 26060 5827
E-mail: [email protected]: www.unodc.org/wdr2019

1
PREFACE
The findings of this year’s World Drug Report fill in and further complicate the global picture of drug challenges, underscoring the need for broader inter-national cooperation to advance balanced and integrated health and criminal justice responses to drug supply and demand.
With improved research and more precise data from India and Nigeria – both among the 10 most-pop-ulous countries in the world – we see that there are many more opioid users and people with drug use disorders than previously estimated. Globally, some 35 million people, up from an earlier estimate of 30.5 million, suffer from drug use disorders and require treatment services. The death toll is also higher: 585,000 people died as a result of drug use in 2017.
Prevention and treatment continue to fall far short of needs in many parts of the world. This is particu-larly true in prisons, where those incarcerated are especially vulnerable to drug use and face higher risks of HIV and hepatitis C transmission. This gap represents a major impediment to achieving the Sus-tainable Development Goals and fulfilling the international community’s pledge to leave no one behind.
Synthetic opioids continue to pose a serious threat to health, with overdose deaths rising in North America and trafficking in fentanyl and its analogues expanding in Europe and elsewhere. The opioid crisis that has featured in far fewer headlines but that requires equally urgent international attention is the non-medical use of the painkiller tramadol, particularly in Africa. The amount of tramadol seized globally reached a record 125 tons in 2017; the limited data available indicate that the tramadol being used for non-medical purposes in Africa is being illicitly manufactured in South Asia and traf-ficked to the region, as well as to parts of the Middle East.
The response to the misuse of tramadol illustrates the difficulties faced by countries in balancing nec-essary access for medical purposes while curbing abuse – with limited resources and health-care sys-tems that are already struggling to cope – and at the
same time clamping down on organized crime and trafficking. Opium production and cocaine manufacture remain at record levels. The amounts intercepted are also higher than ever, with the amount of cocaine seized up 74 per cent over the past decade, compared with a 50 per cent rise in manufacture during the same period. This suggests that law enforcement efforts have become more effective and that strengthened international cooperation may be helping to increase interception rates.The World Drug Report 2019 also registers a decline in opiate trafficking from Afghanistan along the “northern” route through Central Asia to the Rus-sian Federation. In 2008, some 10 per cent of the morphine and heroin intercepted globally was seized in countries along the northern route; by 2017 it had fallen to 1 per cent. This may be due in part to a shift in demand to synthetics in destination mar-kets. The increased effectiveness of regional responses may also play a role. Countries in central Asia, with the support of the United Nations Office on Drugs and Crime (UNODC), have committed considerable resources to strengthening regional cooperation through integrated UNODC country, regional and global programmes, as well as through platforms such as the Central Asian Regional Information and Coordination Centre, the Afghanistan–Kyrgyzstan–Tajikistan Initiative and the Triangular Initiative and its Joint Planning Cell. More research is needed, including to identify lessons learned and best practices that could inform further action. International cooperation has also succeeded in checking the growth in new psychoactive substances. The Vienna-based Commission on Narcotic Drugs has acted swiftly in recent years to schedule the most harmful new psychoactive substances, and the UNODC early warning advisory has helped to keep the international community abreast of developments. Political will and adequate funding remain prereq-uisites for success. Efforts by Colombia to reduce cocaine production following the 2016 peace deal

2
WO
RLD
DRU
G R
EPO
RT 2
019 CANNABIS AND HALLUCINOGENS
with the Revolutionary Armed Forces of Colombia (FARC) are a case in point. Alternative development initiatives have enabled farmers in central areas of the country previously under FARC control to aban-don coca bush cultivation and join the licit economy. The result has been a drastic reduction in cocaine production. However, in other areas previously con-trolled by FARC, criminal groups have moved in to fill the vacuum and expand cultivation. Alternative development can succeed, but not without sustained attention and integration into broader development goals.
The successes identified amid the many, formidable problems that countries continue to face in grap-pling with drug supply and demand highlight that international cooperation works. The challenge before us is to make this cooperation work for more people.
International cooperation is based on agreed frame-works. Nearly every country in the world has reaffirmed its commitment to balanced, rights-based action based on the international drug control con-ventions. The most recent reaffirmation of that commitment is the Ministerial Declaration on Strengthening Our Actions at the National, Regional and International Levels to Accelerate the Imple-mentation of Our Joint Commitments to Address and Counter the World Drug Problem, adopted at the ministerial segment of the sixty-second session of the Commission on Narcotic Drugs.
UNODC supports countries in putting their com-mitments into action through the application of international standards on the prevention and treat-ment of drug use disorders and HIV, as well as standards and norms on the administration of justice and the treatment of prisoners. We provide tailored technical assistance through our field offices and global programmes, and through toolkits and research.
I hope the World Drug Report 2019 will shed further light on the world drug problem and inform inter-national community responses. By working together and focusing attention and resources, we can help people get the services they need without discrimi-nation, promote security and bring criminals to justice, safeguard health and achieve the Sustainable Development Goals.
Yury FedotovExecutive Director
United Nations Office on Drugs and Crime

3
CONTENTS
PREFACE ..................................................................................................................... 1CONTENTS .................................................................................................................. 3EXPLANATORY NOTES .............................................................................................. 5SCOPE OF THE BOOKLET .......................................................................................... 7
CANNABIS ............................................................................................................... 9Introduction ...................................................................................................................................... 9Supply of cannabis ......................................................................................................................... 10Demand for cannabis ..................................................................................................................... 17Developments in measures regulating the non-medical use of cannabis ................................. 25
HALLUCINOGENS .................................................................................................. 51Introduction .................................................................................................................................... 51Supply of hallucinogens ................................................................................................................ 54Demand for hallucinogens ............................................................................................................ 58
ANNEX ...................................................................................................................... 63GLOSSARY ................................................................................................................ 71REGIONAL GROUPINGS ........................................................................................... 73
BOOKLET 1 EXECUTIVE SUMMARY, CONCLUSIONS AND POLICY IMPLICATIONS
BOOKLET 2 GLOBAL OVERVIEW OF DRUG DEMAND AND SUPPLY
BOOKLET 3 DEPRESSANTS
BOOKLET 4 STIMULANTS
BOOKLET 5 CANNABIS AND HALLUCINOGENS

Acknowledgements
The World Drug Report 2019 was prepared by the Research and Trend Analysis Branch, Division for Policy Analysis and Public Affairs, United Nations Office on Drugs and Crime (UNODC), under the supervision of Jean-Luc Lemahieu, Director of the Division, and Angela Me, Chief of the Research and Trend Analysis Branch.
General coordination and content overviewChloé Carpentier Angela Me
Analysis and draftingKamran Niaz Thomas Pietschmann
Data management and estimate production Enrico BisognoConor Crean Hernan EpsteinSabrina LevissianosAndrea OterováUmidjon RakhmonberdievAli Saadeddin Tun Nay SoeIrina TsoyFatma UshevaLorenzo Vita
EditingJoseph Boyle Jonathan Gibbons
Graphic design and productionAnja KorenblikSuzanne KunnenKristina KuttnigFabian Rettenbacher
Coordination Francesca Massanello
Administrative supportIulia Lazar
Review and commentsThe World Drug Report 2019 benefited from the expertise of and invaluable contributions from UNODC colleagues in all divisions. The Research and Trend Analysis Branch acknowledges the important contribution to Booklet 5 from its colleagues in the Laboratory and Scientific Section.
The Research and Trend Analysis Branch acknowledges the invaluable contributions and advice provided by the World Drug Report Scientific Advisory Committee:Jonathan CaulkinsPaul GriffithsMarya HynesVicknasingam B. KasinatherCharles Parry
Afarin Rahimi-MovagharPeter ReuterAlison RitterFrancisco Thoumi

5
EXPLANATORY NOTES
The boundaries and names shown and the designa-tions used on maps do not imply official endorsement or acceptance by the United Nations. A dotted line represents approximately the line of control in Jammu and Kashmir agreed upon by India and Paki-stan. The final status of Jammu and Kashmir has not yet been agreed upon by the parties. Disputed boundaries (China/India) are represented by cross-hatch owing to the difficulty of showing sufficient detail.
The designations employed and the presentation of the material in the World Drug Report do not imply the expression of any opinion whatsoever on the part of the Secretariat of the United Nations con-cerning the legal status of any country, territory, city or area, or of its authorities or concerning the delimi-tation of its frontiers or boundaries.
Countries and areas are referred to by the names that were in official use at the time the relevant data were collected.
All references to Kosovo in the World Drug Report, if any, should be understood to be in compliance with Security Council resolution 1244 (1999).
Since there is some scientific and legal ambiguity about the distinctions between “drug use”, “drug misuse” and “drug abuse”, the neutral term “drug use” is used in the World Drug Report. The term “misuse” is used only to denote the non-medical use of prescription drugs.
All uses of the word “drug” and the term “drug use” in the World Drug Report refer to substances con-trolled under the international drug control conventions, and their non-medical use.
All analysis contained in the World Drug Report is based on the official data submitted by Member States to the UNODC through the annual report questionnaire unless indicated otherwise.
The data on population used in the World Drug Report are taken from: World Population Prospects: The 2017 Revision (United Nations, Department of Economic and Social Affairs, Population Division).
References to dollars ($) are to United States dollars, unless otherwise stated.
References to tons are to metric tons, unless other-wise stated.
The following abbreviations have been used in the present booklet:
ATS amphetamine-type stimulants
CBD cannabidiol
CBN cannabinol
DMT dimethyltryptamine
EMCDDA European Monitoring Centre for Drugs and Drug Addiction
ha hectares
LSD lysergic acid diethylamide
MDMA 3,4-methylenedioxymethamphetamine, commonly known as “ecstasy”
NPS new psychoactive substances
PCP phencyclidine
THC (Δ-9 – tetrahydrocannabinol)
UNODC United Nations Office on Drugs and Crime
WHO World Health Organization


7
SCOPE OF THE BOOKLET
Constituting the fifth chapter of the World Drug Report 2019, the present booklet contains an analysis of the global market for cannabis that looks at supply in terms of cultivation and production of and trafficking in cannabis herb and cannabis resin, as well as consumption in terms of trends in the prevalence of use of cannabis. The booklet also gives an overview of developments in measures regulating the non-medical use of cannabis in Canada, the United States of America and Uruguay and contains an analysis of the global market for different hallucinogens that examines recent developments in seizures and trends in the prevalence of their use.
Global number of cannabis users 2017
188 million
Global seizures
ketamine
Change from previous year
-34%ketaminehallucinogens
(excluding ketamine)
7xcannabisresin
31%7%cannabisherb
hallucinogens(excluding ketamine)
3,5tons
5,109tons
cannabis resincannabis herb
9tons
1,161tons
2017


9
Cannabis 5
Convention on Narcotic Drugs of 1961 as amended by the 1972 Protocol (Schedules I and IV).
In the past two decades, there have been rapid advances in cannabis plant cultivation techniques. This has led to the spread of domestic (indoor) cul-tivation, thereby reducing reliance on imported cannabis products. Based on the cultivation of unpollinated female cannabis plants (sinsemilla), indoor cannabis plant production involves the use of controlled growing conditions and genetically selected strains, which has led to an increase in the number of harvests, as well as in yield and potency. Mainly focused on achieving high THC content, selective breeding has also resulted in the selection of varieties containing lower levels of CBD.4
In addition to the major transformation of cannabis cultivation in recent years, the cannabis market has diversified to the extent that it now comprises a broad range of products with varying means of ingestion, potency and effects.
4 EMCDDA, Cannabis Production and Markets in Europe, EMCDDA Insights Series No. 12 (Luxembourg, Publica-tions Office of the European Union, 2012).
IntroductionAlthough there is an ongoing debate as to whether the genus cannabis comprises one or more species, the drug is currently considered to be monospecific (Cannabis sativa L) by the scientific community.1, 2 There are two subspecies of the plant (Sativa and Indica) and four varieties. Cannabis plants contain 70 unique compounds, collectively known as phytocannabinoids,3 the main psychoactive sub-stance being THC, which provides the psychoactive effects of cannabis.
Produced in almost every country, cannabis herb consists of the dried and crumbled leaves and flow-ering tops of the cannabis plant, which are generally smoked. By contrast, cannabis resin, which is the concentrated extract of cannabis flower and plant, is mainly produced in a few countries in North Africa, the Middle East and South-West Asia. Hash oil is a cannabis product that can be extracted from any part of the plant, with minimal or no residual solvent. Cannabis is controlled under the Single
1 WHO Expert Committee on Drug Dependence, Pre-review, “Cannabis plant and cannabis resin: section 1 – Chemistry” (Geneva, 2018).
2 The letter “L” denotes Carl Linnaeus, who, in 1753, gave the botanical name to the plant.
3 Jerrold S. Meyer and Linda F. Quenzer, eds., Psychopharmacology: Drugs, the Brain, and Behaviour, 3rd ed. (Oxford, Oxford University Press, 2019).
Quantity of cannabis seized by region2017
cannabis herb(5,109 tons)
South America, Central Americaand the CaribbeanNorth AmericaAfricaAsiaEuropeOceania
cannabis resin (1,161 tons)
Western and Central EuropeNear and MiddleEast/South-West AsiaNorth AfricaOther
CANNABIS

10
WO
RLD
DRU
G R
EPO
RT 2
019 CANNABIS AND HALLUCINOGENS
Africa • Morocco, Nigeria, Eswatini, the Sudan,
South Africa, Malawi, the Democratic Republic of Congo and Ghana
Europe• Western and Central Europe: the Netherlands,
Italy, the United Kingdom of Great Britain and Northern Ireland, Spain and Belgium
• South-Eastern Europe: Albania • Eastern Europe: the Russian Federation and
Ukraine Asia• Near and Middle East: Afghanistan, Pakistan
and Lebanon • Central Asia: Kyrgyzstan and Tajikistan • South Asia: India and Nepal • East and South-East Asia: Indonesia and the
Philippines Oceania • Australia and New Zealand
Trends in indirect indicators of cannabis cultivation have been fluctuating over the years. Significant seizures of cannabis plants were made in 1998 as a result of large seizures reported by Turkey, Egypt, Nigeria and Paraguay (in descending order), while the number of hectares under cannabis cultivation eradicated reached a peak in 2004, mainly owing to large eradications reported by the Russian Fed-eration; large eradications were reported by Albania in 2008. In 2017, the largest numbers of cannabis sites eradicated and the largest areas under cannabis cultivation eradicated were reported by Mexico, while the largest numbers of cannabis plants eradi-cated were reported by Paraguay, followed by India, and the largest quantity of cannabis plants seized was reported by Guatemala.
Despite those fluctuations, based on qualitative information provided by 105 countries (an average of 35 countries per year), in six out of seven years, more countries reported an increase in cannabis cul-tivation than a decline. Based on those perceptions, overall cannabis cultivation is thought to have increased over the period 2010–2017, with most of the increase reported to have occurred over the period 2014–2017.
Supply of cannabisCannabis cultivation and production affect all regions
In contrast to the production of other plant-based drugs, which is concentrated in a limited number of countries, cannabis is produced in almost all countries across the world. Cannabis plant cultiva-tion was reported to UNODC through either direct indicators (cultivation or eradication of cannabis plants and eradication of cannabis-producing sites) or indirect indicators (seizure of cannabis plants, origin of cannabis seizures reported by other Member States) by 159 countries, covering 97 per cent of the world’s total population, over the period 2010–2017.
Most countries do not have systems in place to sys-tematically monitor the area under cannabis cultivation. Thus, in general, estimates of the area under cannabis cultivation made available to UNODC may not meet strict scientific standards and must be interpreted with caution. For the time being, no single indicator is available for reliably estimating the area under cannabis cultivation at the global level.
However, a number of indicators (such as hectares of cannabis eradicated, number of cannabis plants eradicated, number of cannabis sites eradicated, number of cannabis plants seized and origin of can-nabis seized) may be used to identify where cannabis cultivation and production are likely to occur. Anal-ysis of the various indicators over the period 2010–2017 has shown that cannabis cultivation and production occur to a large extent in the following countries (in descending order of estimated poten-tial magnitude of cultivation and production):
Americas• North America: Mexico, the United States of
America and Canada
• South America: Paraguay, Brazil, Colombia, Peru and Chile
• Central America: Guatemala and Costa Rica; • Caribbean: Jamaica

11
Supply of cannabis 5
Outdoor cultivation of cannabis is more widespread than indoor culti vation, but the increase in indoor cultivation of cannabis is larger
Available data suggest that outdoor cannabis culti-vation continues to be more widespread at the global level than indoor cannabis cultivation. Over the period 2013–2017, 80 countries reported outdoor cannabis cultivation and/or law enforcement activi-ties linked to outdoor cannabis cultivation (eradication, seizures of cannabis plants, dismantling of cannabis-producing sites) to UNODC and 55 countries reported indoor cannabis cultivation. While outdoor cannabis cultivation is found around the globe, most of the countries reporting indoor cultivation are located in Europe, followed by North America (Canada and the United States), Central America (Costa Rica, El Salvador, Honduras and Panama) and South America (Chile, Colombia, Ecuador and Uruguay). Beyond those regions, indoor cannabis cultivation still seems to be limited and has been reported by only two countries in Oce-ania (Australia and New Zealand) and a few countries in Asia (Armenia, Georgia and Israel, as well as Hong Kong, China).
Trend data (based on qualitative information reported by Member States) suggest that both out-door and indoor cannabis cultivation increased at the global level over the period 2013–2017, although the increase in indoor cultivation appears to have
Fig. 1 Global quantity of cannabis plants seized and eradication of cannabis plants, 1998–2017
Source: UNODC, responses to the annual report questionnaire.
Fig. 2 Qualitative information on trends in cannabis cultivation (index: 2010=100), 2010–2017
Source: UNODC, responses to the annual report questionnaire.
* Number of countries reporting increases less number of countries reporting decreases (2 points for "strong increase", 1 point for
"some increase", 0 points for stable, -1 point for "some decline", -2 points for "strong decline"), 2010=100.
been larger than that in outdoor cultivation. The increasing importance of indoor cannabis cultiva-tion is closely associated with an overall increase in the THC content of cannabis on the main markets over the past two decades.5, 6
5 EMCDDA, “Price, purity and potency”, Statistical Bulletin 2018 (and previous years).
6 Mahmoud A. ElSohly and others, “Changes in cannabis potency over the last 2 decades (1995-2014): analysis of current data in the United States, Biological Psychiatry (Amsterdam, Elsevier, 2016), pp. 1–7.
80
100
120
140
160
18020
10
2011
2012
2013
2014
2015
2016
2017
Inde
x (2
010=
100)
Number of countries reporting "some increase"Number of countries reporting "no change"Number of countries reporting "some decrease"Number of countries reporting "strong decrease"Index*
80
100
120
140
160
18020
10
2011
2012
2013
2014
2015
2016
2017
Inde
x (2
010=
100)
Number of countries reporting "some increase"Number of countries reporting "no change"Number of countries reporting "some decrease"Number of countries reporting "strong decrease"Index*
020,00040,00060,00080,000100,000120,000140,000160,000
0
5,000,000
10,000,000
15,000,000
20,000,000
1998
1999
2000
2001
2002
2003
2004
2005
2006
2007
2008
2009
2010
2011
2012
2013
2014
2015
2016
2017
Hect
ares
era
dica
ted/
nu
mbe
r of s
ites
erad
icat
ed
Kilo
gram
equ
ival
ents
Cannabis plants eradicated (in kg equivalents)Cannabis plants seized (in kg equivalents)Number of sites under cannabis cultivation eradicatedHectares under cannabis cultivation eradicated

12
WO
RLD
DRU
G R
EPO
RT 2
019 CANNABIS AND HALLUCINOGENS
in 2016 and 2017 may have been the result of less reporting in some countries, coupled with possible shifts in the priorities of law enforcement authori-ties, notably in the Americas, where the largest quantities seized had previously been reported. In terms of weight, 49 per cent of all cannabis herb and resin seized in 2017 were in the Americas, fol-lowed by 18 per cent in Asia, 17 per cent in Africa, 15 per cent in Europe and less than 1 per cent in Oceania.
While the decline in the quantities of cannabis seized in 2016 was linked to smaller quantities reported in Africa (partly linked to reporting issues) and North America (possibly a consequence of shifts in the priorities of law enforcement authorities owing to the liberalization of cannabis markets in several parts of the continent),7 data for 2017 show an ongoing decline in cannabis seizures in North Amer-ica, Asia and Africa (mostly resulting from fewer seizures in North Africa and fewer African countries reporting to UNODC) and increases (in descend-ing order) in South America, Oceania, Europe and the Caribbean.
In terms of products, herbal cannabis continued to account for for the majority of cannabis seized in 2017 (81 per cent) at the global level. Data show
7 United States, Government Accountability Office, State Marijuana Legalization: DOJ Should Document Its Approach to Monitoring the Effects of Legalization, GAO report GAO-16-1 (Washington D.C., December 2015).
Global cannabis seizures remained stable in 2017
Over the period 2010–2017, 166 countries reported to UNODC that they had seized cannabis herb or resin (113–140 countries per year). In terms of weight, the amounts of cannabis herb and resin seized remained largely unchanged in 2017 (at some 6,300 tons), compared with the previous year, and were in line with trend data on the number of sei-zure cases. Seizures were markedly larger than in 1998 (3,900 tons) but were smaller than in most years since 2000, with peaks of 8,200 tons in 2004 and more than 7,500 tons in 2010 and 2015. The smaller quantities of cannabis seized and reported
Fig. 3 Countries reporting outdoor and indoor cannabis cultivation, 2013–2017
Source: UNODC, responses to the annual report questionnaire.
Fig. 4 Reported trends in outdoor and indoor cannabis cultivation, 2013–2017
Source: UNODC, responses to the annual report questionnaire.
Note: Numbers in the figure have been rounded.
Fig. 5 Global quantities of main cannabis products seized, 1998–2017
Source: UNODC, responses to the annual report questionnaire.
80
595539
020406080
100
Reported cannabiscultivation and
related lawenforcement
activities
Reported cannabiscultivation trends
Num
ber o
f cou
ntrie
s
OutdoorIndoor
Reported cannabis cultivation and
related law enforcement
activities
Reported cannabis cultivation trends
80
595539
020406080
100
Reported cannabiscultivation and
related lawenforcement
activities
Reported cannabiscultivation trends
Num
ber o
f cou
ntrie
s
OutdoorIndoor
43
22
34
9
46
34
20 27
0
10
20
30
40
50
Increase Stable Decrease "Netgrowth"(increase
lessdecrease)
Perc
enta
ge
Outdoor (based on information from 59 countries)Indoor (based on information from 39 countries)
Increase Stable Decrease "Net growth" (increase
less decrease)
Outdoor (based on information from 59 countries)Indoor (based on information from 39 countries)
01,000,0002,000,0003,000,0004,000,0005,000,0006,000,0007,000,0008,000,0009,000,000
1998
2000
2002
2004
2006
2008
2010
2012
2014
2016
Kilo
gram
s
Cannabis resin Cannabis herb
01,000,0002,000,0003,000,0004,000,0005,000,0006,000,0007,000,0008,000,0009,000,000
1998
2000
2002
2004
2006
2008
2010
2012
2014
2016
Kilo
gram
s
Cannabis resin Cannabis herb
1998
19
99
2000
20
01
2002
20
03
2004
20
05
2006
20
07
2008
20
09
2010
20
11
2012
20
13
2014
20
15
2016
20
17
01,000,0002,000,0003,000,0004,000,0005,000,0006,000,0007,000,0008,000,0009,000,000
1998
2000
2002
2004
2006
2008
2010
2012
2014
2016
Seizu
res
in k
ilogr
ams
Cannabis resin Cannabis herb

13
Supply of cannabis 5Fig. 6 Global quantities of cannabis herb
seized, 2007‒2017
Source: UNODC, responses to the annual report questionnaire.
consumed by daily or near-daily users.10, 11 It can thus be excluded that the decline in seizures of can-nabis herb in North America was merely a consequence of a shrinking cannabis market in the subregion.
Conversely, the quantity of cannabis herb seized in regions other than North America doubled over the period 2007–2017. Qualitative information reported by Member States to UNODC suggests a
importance of estimating drug consumption and expendi-tures”, Addiction, vol. 110, No. 5 (Society for the Study of Addiction, 2015).
9 Adam Orens and others, “Market size and demand for marijuana in Colorado: 2017 market update”, prepared for the Colorado Department of Revenue (Denver, Marijuana Policy Group, August 2018).
10 United States, Substance Abuse and Mental Health Services Administration, Center for Behavioral Health Statistics and Quality, Key Substance Use and Mental Health Indicators in the United States: Results from the 2017 National Survey on Drug Use and Health, HHS Pub-lication No. SMA 18-5068, NSDUH Series H-53 (Rock-ville, Maryland, 2018). United States, Substance Abuse and Mental Health Services Administration, Center for Behavioral Health Statistics and Quality, Results from the 2017 National Survey on Drug Use and Health: Detailed Tables (Rockville, Maryland, September 2018).
11 United States, Substance Abuse and Mental Health Services Administration, Center for Behavioral Health Statistics and Quality, Results from the 2017 National Survey on Drug Use and Health: Detailed Tables (Rockville, Maryland, September 2018).
decreases in the quantity of cannabis resin seized in 2017 (by 31 per cent, from very high levels reported the previous year), while the quantity of cannabis herb seized increased slightly (7 per cent), reflecting increases in the quantities intercepted in South America (79 per cent), Oceania (69 per cent), Europe (37 per cent), Asia (16 per cent) and the Caribbean (15 per cent), which more than offset the continuing decline in the quantity of cannabis herb seized in North America (41 per cent less than in 2016).
Quantities of cannabis herb seized continue to decline markedly in North America following major transforma-tion of the cannabis market
In 2017, as in previous years, the Americas contin-ued to account for the largest share of the global quantity of cannabis herb seized (60 per cent of the global total). South America alone accounted for 38 per cent of the global total and North America for 21 per cent. This was in contrast to most of the previous years, when the largest amount of cannabis herb seized had been reported in North America. The next-largest amounts seized were reported in Africa (17 per cent of the total), Asia (15 per cent), Europe (8 per cent) and Oceania (0.4 per cent).
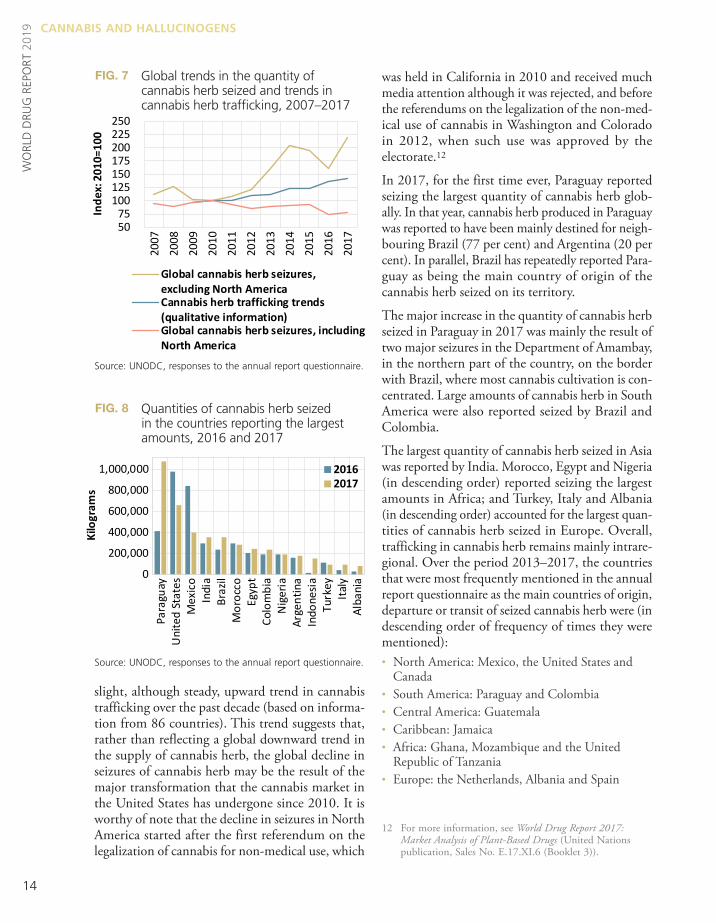
Despite a slight increase to 5,100 tons, the global quantity of cannabis herb seized in 2017 was still one of the smallest reported since 2000. The decline in the quantity of cannabis herb seized (over 20 per cent) since 2010 was driven by decreases reported in North America (77 per cent), with marked declines reported in Mexico (83 per cent), the United States (71 per cent) and Canada (67 per cent).
The decline in the amounts of cannabis herb reported seized in North America has gone hand in hand with significant increases in the use of can-nabis herb in the subregion over the past decade. Detailed data from the United States show a sharp increase in the number of annual users of cannabis over the period 2007–2017 (63 per cent), which was exceeded by an increase in daily or near-daily users of cannabis of some 130 per cent over the same period;8, 9 this is of importance as most cannabis is
8 Jonathan P. Caulkins and others, “Beyond prevalence:
0
2,500,000
5,000,000
7,500,000
10,000,000
2007
2008
2009
2010
2011
2012
2013
2014
2015
2016
2017
Kilo
gram
s
AfricaOceaniaAsiaEuropeSouth and Central America and CaribbeanNorth America (including Mexico)
14
WO
RLD
DRU
G R
EPO
RT 2
019 CANNABIS AND HALLUCINOGENS
was held in California in 2010 and received much media attention although it was rejected, and before the referendums on the legalization of the non-med-ical use of cannabis in Washington and Colorado in 2012, when such use was approved by the electorate.12
In 2017, for the first time ever, Paraguay reported seizing the largest quantity of cannabis herb glob-ally. In that year, cannabis herb produced in Paraguay was reported to have been mainly destined for neigh-bouring Brazil (77 per cent) and Argentina (20 per cent). In parallel, Brazil has repeatedly reported Para-guay as being the main country of origin of the cannabis herb seized on its territory.
The major increase in the quantity of cannabis herb seized in Paraguay in 2017 was mainly the result of two major seizures in the Department of Amambay, in the northern part of the country, on the border with Brazil, where most cannabis cultivation is con-centrated. Large amounts of cannabis herb in South America were also reported seized by Brazil and Colombia.
The largest quantity of cannabis herb seized in Asia was reported by India. Morocco, Egypt and Nigeria (in descending order) reported seizing the largest amounts in Africa; and Turkey, Italy and Albania (in descending order) accounted for the largest quan-tities of cannabis herb seized in Europe. Overall, trafficking in cannabis herb remains mainly intrare-gional. Over the period 2013–2017, the countries that were most frequently mentioned in the annual report questionnaire as the main countries of origin, departure or transit of seized cannabis herb were (in descending order of frequency of times they were mentioned):• North America: Mexico, the United States and
Canada• South America: Paraguay and Colombia• Central America: Guatemala• Caribbean: Jamaica • Africa: Ghana, Mozambique and the United
Republic of Tanzania • Europe: the Netherlands, Albania and Spain
12 For more information, see World Drug Report 2017: Market Analysis of Plant-Based Drugs (United Nations publication, Sales No. E.17.XI.6 (Booklet 3)).
slight, although steady, upward trend in cannabis trafficking over the past decade (based on informa-tion from 86 countries). This trend suggests that, rather than reflecting a global downward trend in the supply of cannabis herb, the global decline in seizures of cannabis herb may be the result of the major transformation that the cannabis market in the United States has undergone since 2010. It is worthy of note that the decline in seizures in North America started after the first referendum on the legalization of cannabis for non-medical use, which
Fig. 7 Global trends in the quantity of cannabis herb seized and trends in cannabis herb trafficking, 2007–2017
Source: UNODC, responses to the annual report questionnaire.
Fig. 8 Quantities of cannabis herb seized in the countries reporting the largest amounts, 2016 and 2017
Source: UNODC, responses to the annual report questionnaire.
50 75
100 125 150 175 200 225 250
2007
2008
2009
2010
2011
2012
2013
2014
2015
2016
2017
Inde
x: 2
010=
100
Global cannabis herb seizures,excluding North AmericaCannabis herb trafficking trends(qualitative information)Global cannabis herb seizures, includingNorth America
-
200,000
400,000
600,000
800,000
1,000,000
Para
guay
Uni
ted
Stat
esM
exic
oIn
dia
Braz
ilM
oroc
coEg
ypt
Colo
mbi
aN
iger
iaAr
gent
ina
Indo
nesi
aTu
rkey
Italy
Alba
nia
Seizu
res
(kg)
20162017
0
200,000
400,000
600,000
800,000
1,000,000
Para
guay
Uni
ted
Stat
esM
exic
oIn
dia
Braz
ilM
oroc
coEg
ypt
Colo
mbi
aN
iger
iaAr
gent
ina
Indo
nesi
aTu
rkey
Italy
Alba
nia
Kilo
gram
s
20162017

15
Supply of cannabis 5
the amount of cannabis resin seized increased in 21 out of 29 countries in Western and Central Europe in 2017.
One of the main exceptions was Italy, which reported a sharp decrease in the quantity of cannabis resin seized (22 per cent less in 2017 compared with the previous year and 84 per cent less compared with 2014). This mainly reflects changes in cannabis traf-ficking routes, as the most direct route for trafficking cannabis resin of Moroccan origin via Libya to Italy, which accounted for 66 per cent of all identified cannabis resin shipments in 2013, decreased in importance to the extent that most Moroccan can-nabis resin was shipped via Spain and France to Italy in 2017. Trafficking in cannabis resin from Morocco via Algeria to Libya also decreased, with the quantity of cannabis resin seized in Algeria in 2017 decreas-ing by more than 50 per cent compared with the previous year and by 75 per cent compared with 2013.
The patterns are less clear for South-West Asia. Afghanistan reported a decrease of 90 per cent in the quantity of cannabis seized in 2017 compared with 2016, although the quantity reported in 2017 was still at a similar level to those reported in 2013 and 2014 and was still larger than that reported in 2010. Decreases were also reported by Pakistan (22 per cent), the Islamic Republic of Iran (6 per cent)
• Asia: India, Myanmar, Afghanistan, Malaysia and Kyrgyzstan
Oceania is the only region where the most frequently mentioned countries (United States and Canada) are located outside the region.
Intraregional trafficking, which is the predominant form of cannabis herb trafficking, is mainly carried out by road, rather than by sea or air. There have been only a few exceptions where cannabis herb appears to have been trafficked more by sea; such trafficking was reported by two countries in 2017 (Indonesia and Italy), two countries in 2016 (Costa Rica and Italy) and two countries in 2015 (Italy and Panama).
Global upward trend in cannabis resin seizures came to a halt in 2017, mainly as a result of a decline in seizures in production regions
The upward trend in the global quantity of cannabis resin seized over the period 2011–2016 came to a halt in 2017, when it declined by some 30 per cent worldwide, to its lowest level since 2011. That decline was a result of a halving of the quantities seized in the world’s main cannabis resin-producing subregions, North Africa, the Near and Middle East/South-West Asia. By contrast, the quantity of can-nabis resin seized in Western and Central Europe increased by roughly 10 per cent in 2017.
Qualitative information on trends in trafficking in cannabis resin (based on data from 68 countries reporting over the period 2007–2017) points to an increase since 2012, including in 2017, irrespective of the global decline in the amount of cannabis resin seized in that year. However, the overall reported increase in cannabis resin trafficking in 2017 was less pronounced than in previous years.
The overall upward trend in cannabis resin traffick-ing in 2017 masks different patterns across regions. Seizure data and qualitative information on trends suggest that there was a decline in cannabis resin trafficking in Morocco in 2017, although that has not yet had an impact on subsequent trafficking within the cannabis resin consumer markets. Spain reported a stable trend, while France and a number of other European countries reported an increase in cannabis resin trafficking activities in 2017. In fact,
Fig. 9 Global quantities of cannabis resin seized, 2007–2017
Source: UNODC, responses to the annual report questionnaire.
0
500,000
1,000,000
1,500,000
2,000,000
2007
2008
2009
2010
2011
2012
2013
2014
2015
2016
2017
Kilo
gram
s
OtherNear and Middle East/South-West AsiaNorth AfricaEast and South-Eastern EuropeWestern and Central Europe
the cannabis resin intercepted is sourced from domestic production and the remainder originates in neighbouring Nepal.
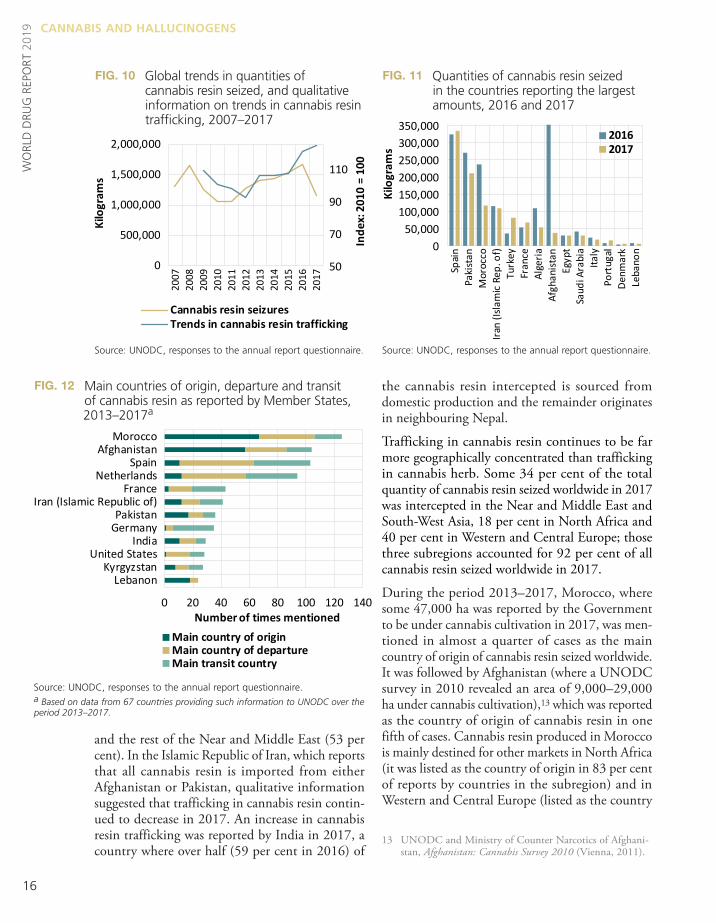
Trafficking in cannabis resin continues to be far more geographically concentrated than trafficking in cannabis herb. Some 34 per cent of the total quantity of cannabis resin seized worldwide in 2017 was intercepted in the Near and Middle East and South-West Asia, 18 per cent in North Africa and 40 per cent in Western and Central Europe; those three subregions accounted for 92 per cent of all cannabis resin seized worldwide in 2017.
During the period 2013–2017, Morocco, where some 47,000 ha was reported by the Government to be under cannabis cultivation in 2017, was men-tioned in almost a quarter of cases as the main country of origin of cannabis resin seized worldwide. It was followed by Afghanistan (where a UNODC survey in 2010 revealed an area of 9,000–29,000 ha under cannabis cultivation),13 which was reported as the country of origin of cannabis resin in one fifth of cases. Cannabis resin produced in Morocco is mainly destined for other markets in North Africa (it was listed as the country of origin in 83 per cent of reports by countries in the subregion) and in Western and Central Europe (listed as the country
13 UNODC and Ministry of Counter Narcotics of Afghani-stan, Afghanistan: Cannabis Survey 2010 (Vienna, 2011).
and the rest of the Near and Middle East (53 per cent). In the Islamic Republic of Iran, which reports that all cannabis resin is imported from either Afghanistan or Pakistan, qualitative information suggested that trafficking in cannabis resin contin-ued to decrease in 2017. An increase in cannabis resin trafficking was reported by India in 2017, a country where over half (59 per cent in 2016) of
Fig. 10 Global trends in quantities of cannabis resin seized, and qualitative information on trends in cannabis resin trafficking, 2007–2017
Source: UNODC, responses to the annual report questionnaire.
Fig. 12 Main countries of origin, departure and transit of cannabis resin as reported by Member States, 2013–2017a
Source: UNODC, responses to the annual report questionnaire.a Based on data from 67 countries providing such information to UNODC over the period 2013–2017.
16
Fig. 11 Quantities of cannabis resin seized in the countries reporting the largest amounts, 2016 and 2017
Source: UNODC, responses to the annual report questionnaire.
0 20 40 60 80 100 120 140
LebanonKyrgyzstan
United StatesIndia
GermanyPakistan
Iran (Islamic Republic of)France
NetherlandsSpain
AfghanistanMorocco
Number of times mentionedMain country of originMain country of departureMain transit country
CANNABIS AND HALLUCINOGENSW
ORL
D D
RUG
REP
ORT
201
9
50
70
90
110
0
500,000
1,000,000
1,500,000
2,000,000
2007
2008
2009
2010
2011
2012
2013
2014
2015
2016
2017
Inde
x: 2
010
= 10
0
Seizu
res
of ca
nnab
is re
sin (k
g)
Cannabis resin seizuresTrends in cannabis resin trafficking
50
70
90
110
0
500,000
1,000,000
1,500,000
2,000,000
2007
2008
2009
2010
2011
2012
2013
2014
2015
2016
2017
Inde
x: 2
010
= 10
0
Kilo
gram
s
Cannabis resin seizuresTrends in cannabis resin trafficking
50
70
90
110
-
500,000
1,000,000
1,500,000
2,000,000
2007
2008
2009
2010
2011
2012
2013
2014
2015
2016
2017
Inde
x: 2
010
= 10
0
Seizu
res o
f can
nabi
s res
in (k
g)
Cannabis resin seizuresIndex: trends in cananbis resin trafficking
50
70
90
110
0
500,000
1,000,000
1,500,000
2,000,000
2007
2008
2009
2010
2011
2012
2013
2014
2015
2016
2017
Inde
x: 2
010
= 10
0
Seizu
res
of ca
nnab
is re
sin (k
g)
Cannabis resin seizuresTrends in cannabis resin trafficking
- 50,000
100,000 150,000 200,000 250,000 300,000 350,000
Spai
nPa
kist
anM
oroc
coIra
n (Is
lam
ic Re
p. o
f)Tu
rkey
Fran
ceAl
geria
Afgh
anist
anEg
ypt
Saud
i Ara
bia
Italy
Port
ugal
Denm
ark
Leba
non
Seizu
res
(kg)
20162017
050,000
100,000150,000200,000250,000300,000350,000
Spai
nPa
kist
anM
oroc
coIra
n (Is
lam
ic Re
p. o
f)Tu
rkey
Fran
ceAl
geria
Afgh
anist
anEg
ypt
Saud
i Ara
bia
Italy
Port
ugal
Denm
ark
Leba
non
Kilo
gram
s
20162017

17
Demand for cannabis 5Countries of origin/departure/transit and final destination of drugsSubmitted to Member States by UNODC each year, the annual report questionnaire contains a set of questions on drug supply designed to improve the understanding of how international trafficking in specific drugs is organized.
Based on drugs seized, Member States are asked to provide the three main producing/manufacturing countries (“coun-tries of origin”) of each drug, its three main “departure countries”, i.e. the countries from where the drug was actually shipped, the three main “transit countries” from where the drug entered the respective country, and its three main “final destination countries”. This information is subsequently analysed to identify the major drug trafficking patterns of different drugs.
One drawback is that not all countries are in a position to differentiate accurately between “countries of origin”, “countries of departure” and “transit countries”. In this context, some of the analysis in the World Drug Report is based on aggregated information provided on “countries of origin”, “departure countries” and “transit countries” so as to reduce the bias resulting from potentially incorrect reporting.
Moreover, as not all countries provide such information on a regular basis, to avoid any subsequent biases that are simply the result of the reporting or non-reporting of countries in individual years, data are often presented over a five-year period (for example, 2013–2017).
per cent of cannabis resin entered the Islamic Repub-lic of Iran via Pakistan and only 10 per cent came directly from Afghanistan. Most (60 per cent) of the cannabis resin was trafficked by land and 39 per cent was shipped by sea, mainly on boats that had begun their journey in Pakistan. In 2017, some 55 per cent of the cannabis resin smuggled out of the Islamic Republic of Iran was destined for countries on the Arabian Peninsula, 25 per cent was destined for Turkey and the Caucasus and 20 per cent was for domestic consumption. Cannabis resin from Lebanon is mainly found in the Near and Middle East and, to a lesser extent, in Western and Central Europe.
Demand for cannabisGlobal prevalence of cannabis use has remained stable in recent years, despite an increase in the number of cannabis users
Cannabis continues to be the most widely used drug worldwide. UNODC estimates that roughly 3.8 per cent (range: 3.3–4.4 per cent) of the global popula-tion aged 15–64 years used cannabis at least once in 2017, the equivalent of some 188 million people (range: 164–219 million). The average global preva-lence of cannabis use increased over the period
of origin in 43 per cent of all reports by countries in the subregion); 14 per cent of the cannabis resin reported seized by countries in Western and Central Europe originated in Afghanistan. Some cannabis resin of Moroccan origin is also trafficked to Eastern Europe and South-Eastern Europe. Most of the can-nabis resin produced in Morocco that is destined for Europe is shipped to Spain, from where it is smuggled to other markets in the region. For years, including over the period 2013–2017, Spain has been identified by other European countries as the principal departure and transit country for cannabis resin, followed by the Netherlands. Afghanistan appears to be the second most impor-tant source country of cannabis resin worldwide, with 20 per cent of all cannabis resin seized world-wide reported in the annual report questionnaire over the period 2013–2017 as originating there, followed by Lebanon (6 per cent) and Pakistan (6 per cent). The cannabis resin from those countries is principally used to supply markets in the Near and Middle East and South-West Asia, although cannabis resin originating in Afghanistan has also been identified in Central Asia, Eastern Europe and Western and Central Europe. The Islamic Republic of Iran also reported Afghanistan as the primary source of the cannabis resin on its market. Accord-ing to the country’s authorities, in 2017, about 90
5 Demand for cannabis

18
WO
RLD
DRU
G R
EPO
RT 2
019 CANNABIS AND HALLUCINOGENS
Central Africa has the highest prevalence of use, at nearly 10 per cent, or an estimated 27 million past-year users. Recent estimates of cannabis use are only available from two countries in Africa, however. In Kenya, the annual prevalence of cannabis use is esti-mated at 1.2 per cent (2016) of the adult population, whereas in Nigeria it is estimated at 10.8 per cent, corresponding to 10.6 million past-year cannabis users. Cannabis use in Nigeria is more prevalent among men (annual prevalence of 18.8 per cent) than women (2.6 per cent) and among adults aged 29–34 years.14
The estimate for cannabis use in Asia is much lower than in other regions, nearly at 2 per cent annual prevalence, yet, owing to the size of the population, nearly one third of estimated global cannabis users (54 million) reside in the region. In Pakistan, for example, the past-year prevalence of cannabis use was estimated at around 3.6 per cent of the adult population, or nearly 4 million past-year users.15 In India, more than 3 per cent of the population aged 18 and older, and less than 1 per cent of adolescents aged 10-17, had used any cannabis product in the past year in 2018. This included the use of “bhang”,16 the most commonly used variant of cannabis in India, as well as cannabis herb and resin. Overall, the past-year use of cannabis was higher among men (5 per cent) than women (0.6 per cent) and in the states of Uttar Pradesh, Punjab, Sikkim, Chhattisgarh and Delhi than in other states. Nearly 0.7 per cent of the total population (aged 10–75) was considered to be suffering from cannabis use disorders.17
In the absence of survey data that would allow for a robust analysis of trends, it can be surmised, on the basis of the cannabis use perception index, that cannabis use increased in Africa and Asia over the period 2010–2017. In addition, an increase in can-nabis use was reported, on the basis of qualitative
14 UNODC, Drug Use in Nigeria 2018 (Vienna, 2019).15 Ministry of the Interior and Narcotics Control of Pakistan
and UNODC, Drug Use in Pakistan 2013 (Islamabad, 2014).
16 Bhang is an edible preparation of cannabis used in food and drink and traditionally distributed during the festival of Holi. Bhang is legal in many states in India.
17 Atul Ambekar and others, “Magnitude of Substance Use in India”, (New Delhi, Ministry of Social Justice and Empowerment, 2019).
1998–2007, from 3.4 to 3.9 per cent, before remain-ing basically stable during the subsequent decade.
The overall number of annual cannabis users is esti-mated to have increased by roughly 30 per cent during the period 1998–2017. Since 2009, the past-year prevalence of cannabis use has increased by some 4 per cent, while the number of cannabis users has increased by around 19 per cent, reflecting in part an increase in the global population, which had increased by 10 per cent over the same period. This increase should be interpreted with caution, how-ever, because of the wide margins of error around the estimation of prevalence and of the number of cannabis users. Nevertheless, qualitative informa-tion on changes in cannabis use, as reported by an average of 74 Member States per year, confirms the increase in cannabis use over the period 2007–2017.
Cannabis use in Africa and Asia
In Africa, the annual prevalence of cannabis use in 2017 is estimated at 6.4 per cent of the population aged 15–64, corresponding to 44.9 million past-year users. Within the region, the subregion West and
Fig. 13 Global trends in number of cannabis users and qualitative information on trends in cannabis use,a 1998–2017
Source: UNODC, responses to the annual report questionnaire.a The index is based on information of, on average, 83 countries per year over the period 1998‒2017. Two points were given for “large increase”, 1 point for “some increase”, 0 for “stable”, -1 for “some decrease” and -2 for “large decrease”. For reference, if all countries had reported each year
“some increase” in cannabis use over the period 1998‒2017, the cannabis use perception index would have reached 1,584 points in 2017. For details on the perception index calculations, refer to the methodological annex, available in the online version of the present report.
-1,250-1,000-750-500-25002505007501,0001,250
0
50
100
150
200
250
1998
1999
2000
2001
2002
2003
2004
2005
2006
2007
2008
2009
2010
2011
2012
2013
2014
2015
2016
2017
Tren
ds in
dex
(199
8 =
0)
Mill
ions
Users Cannabis use trends
WDR19_Booklet 5_CANNABIS_&_HALLUCINOGENS.indd 18 20/06/2019 14:52:25

19
Demand for cannabis 5
10 million people, were daily or near-daily22 users of cannabis. Consumption data from states such as Colorado, where the non-medical use of cannabis has been legalized, indicate, daily or near-daily users of cannabis accounted for 80 per cent of the quan-tity of cannabis consumed in 2017.23 As noted in earlier editions of the World Drug Report, the expan-sion in the use of cannabis in the United States has occurred in a context of ongoing policy debates over legalizing the non-medical use of cannabis; drastic policy changes; media coverage of the legalization debate, in which the medical benefits of cannabis have been frequently highlighted;24 and a decrease in the number of people perceiving cannabis use as a risk to health.
In the United States, 3 million people aged 12 years or older initiated cannabis use in 2017, which is significantly more than in 2016 and in 2002. The
22 Daily or near-daily use is defined as use of a substance for 20 days or more in month.
23 Adam Orens and others, “Market size and demand for marijuana in Colorado: 2017 market update”, prepared for the Colorado Department of Revenue (Denver, Colorado, Marijuana Policy Group, August 2018).
24 See, for example, Hwalbin Kim, “Framing marijuana: a study of how us newspapers frame marijuana legalization stories and framing effects of marijuana stories”, Doctoral dissertation, University of South Carolina, 2017.
information, by almost all the countries in Africa that returned the annual reports questionnaire in 2016 and 2017. Similarly, qualitative information reported by many countries in nearly all of the sub-regions of Asia suggested an increase in cannabis use in 2016 and 2017.
Cannabis use is still on the increase in North America
Past-year cannabis use increased in the Americas from 42 million people in 2007, or 7.0 per cent of the population aged 15–64,18 to 57 million people in 2017, or 8.4 per cent of the population aged 15-64. The increase was most pronounced in the United States where, after some minor decreases at the beginning of the 2000s, annual cannabis use increased from 9.9 per cent in 2007 to 15.3 per cent in 2017.19 High levels of cannabis use have also been reported in Canada, where past-year cannabis use was reported by 14.7 per cent20 of the population aged 15 and older in 2015, up from 10.7 per cent in 201319 and 9.1 per cent in 2011.20 Cannabis use continues to increase in the United States
Change in the cannabis market in the United States has occurred in terms of the number of users, but more dramatically in the frequency of use and quan-tities of cannabis consumed. While the lifetime prevalence of cannabis use among the adult popula-tion (aged 18 and older) in the United States increased by 10 per cent over the period 2002–2017, the past-year and past-month use of cannabis increased by 50 per cent and 65 per cent, respec-tively.21 However, the most pronounced increase in cannabis use is among those who are daily or near-daily users of cannabis – a proportion that has doubled. In 2017, over 24 million people aged 18 or over were estimated to be past-month users of cannabis; of them, more than 40 per cent, or over
18 World Drug Report 2009 (United Nations publication, Sales No. E.09.XI.12).
19 Results from the National Survey on Drug Use and Health 2017.
20 UNODC, annual report questionnaire data based on the Canadian Tobacco, Alcohol and Drugs Survey 2015.
21 Key Substance Use and Mental Health Indicators in the United States: Results from the 2017 National Survey on Drug Use and Health.
Fig. 14 Trends in cannabis use among the adult population (aged 18 and older) in the United States of America, 2002–2017
Source: United States, Substance Abuse and Mental Health Services Administration, Center for Behavioral Health Statistics and Quality, Results from the 2017 National Survey on Drug Use and Health: Detailed Tables (Rockville, Maryland, 2018).
50
150
250
2002
2003
2004
2005
2006
2007
2008
2009
2010
2011
2012
2013
2014
2015
2016
2017
Inde
x: 2
002
= 10
0
LifetimePast yearPast monthDaily or nearly-daily use

20
WO
RLD
DRU
G R
EPO
RT 2
019 CANNABIS AND HALLUCINOGENS
and near-daily use of cannabis also showed signs of an increase among 10th grade students from 2016 to 2017. The National Survey on Drug Use and Health reported a stable trend over the period 2016–2017 in past-year and past-month cannabis use among those aged 12–17.
Young people who do not attend college seem to be more vulnerable to frequent cannabis use than high-school graduates who attend college. In 2017, cannabis use was much higher among high school graduates aged 19–22 who attend college than among those who do not attend college, 27 and the proportional difference between the college students and their peers increased by measures of more fre-quent use: annual prevalence of cannabis use among the college students was 38 per cent, compared with 41 per cent among those who were not in college. Similarly, past-month cannabis use was 21 per cent among the college students, compared with 28 per cent among those who were not in college. The rate of daily cannabis use was three times higher for the group of young people not in college (13.2 per cent), compared with the group of college students (4.4 per cent).
27 John E Schulenberg and others, Monitoring the Future National Survey Results on Drug Use, 1975–2017: Volume II, College Students and Adults Ages 19–55 (Institute for Social Research, The University of Michigan, 2018).
most significant increase in the number of cannabis initiates was among those aged 18 and older.25
While cannabis use disorders have remained fairly stable among the population aged 12 and older since 2002 and have been declining among those aged 12–17, there was a statistically significant increase in cannabis use disorders in 2017 among those aged 18–25 years.
The annual prevalence of cannabis use among high-school students increased significantly in 2017 compared with the previous year: from an annual prevalence of 9.4 per cent among 8th grade students in 2016 to 10.1 per cent in 2017; from 23.9 per cent among 10th grade students in 2016 to 25.5 per cent in 2017; and from 35.6 per cent among 12th grade students in 2016 to 37.1 per cent in 2017. However, these values are lower than the annual prevalence in 2002 for 8th and 10th grade students.26 By contrast, the past-month and daily
25 Key Substance Use and Mental Health Indicators in the United States: Results from the 2017 National Survey on Drug Use and Health.
26 United States, National Institute on Drug Abuse, “Trends in Prevalence of Various Drugs”, Monitoring the Future Study (revised December 2018). Available at www.drugabuse.gov/trends-statistics/monitoring-future/monitoring-future-study-trends-in-prevalence-various-drugs.
Fig. 15 Past-year cannabis use initiation among the population aged 12 and older in the United States, 2002–2017
Source: United States, Substance Abuse and Mental Health Services Administration, Key Substance Use and Mental Health Indicators in the United States: Results from the 2017 National Survey on Drug Use and Health, HHS Publication No. SMA 18-5068, NSDUH Series H-53, (Rockville, Maryland 2018).
Fig. 16 Cannabis use disorders in the United States, 2002–2017
Source: United States, Substance Abuse and Mental Health Services Administration, Center for Behavioral Health Statistics and Quality, Results from the 2017 National Survey on Drug Use and Health: Detailed Tables (Rockville, Maryland, 2018).
0
0.5
1
1.5
2
2.5
3
3.5
2002
2003
2004
2005
2006
2007
2008
2009
2010
2011
2012
2013
2014
2015
2016
2017N
umbe
r of n
ew u
sers
(mill
ions
)
12 or older 12 to 1718 to 25 26 or older
0
20
40
60
80
100
120
2002
2003
2004
2006
2007
2008
2009
2010
2011
2012
2013
2014
2015
2016
2017
Inde
x: 2
002
= 10
0
12 or older 12 to 1718 to 25 26 or older
21
Demand for cannabis 5
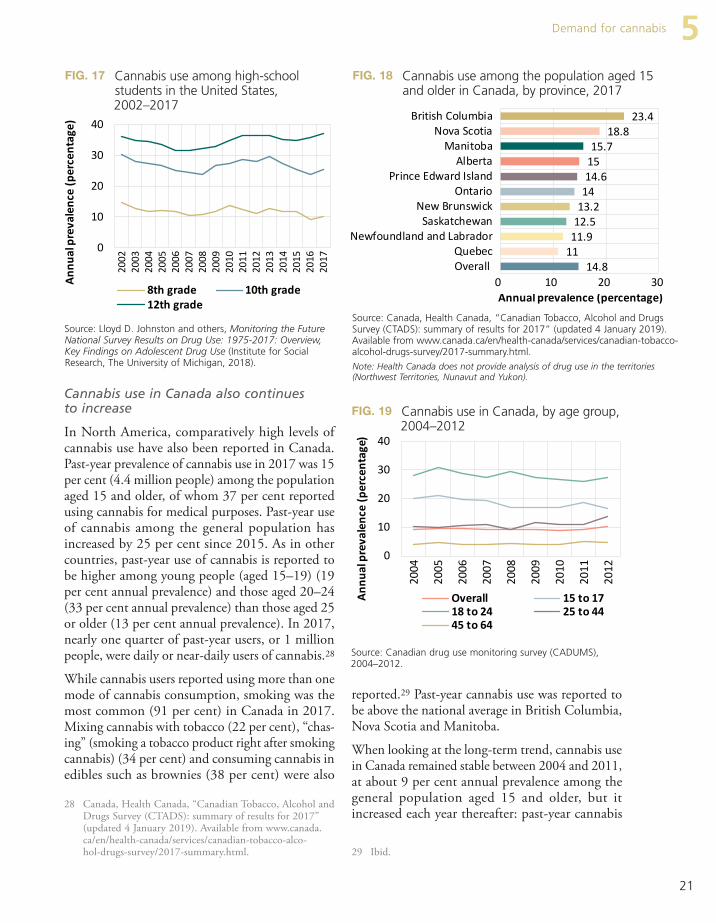
reported.29 Past-year cannabis use was reported to be above the national average in British Columbia, Nova Scotia and Manitoba.
When looking at the long-term trend, cannabis use in Canada remained stable between 2004 and 2011, at about 9 per cent annual prevalence among the general population aged 15 and older, but it increased each year thereafter: past-year cannabis
29 Ibid.
Cannabis use in Canada also continues to increase
In North America, comparatively high levels of cannabis use have also been reported in Canada. Past-year prevalence of cannabis use in 2017 was 15 per cent (4.4 million people) among the population aged 15 and older, of whom 37 per cent reported using cannabis for medical purposes. Past-year use of cannabis among the general population has increased by 25 per cent since 2015. As in other countries, past-year use of cannabis is reported to be higher among young people (aged 15–19) (19 per cent annual prevalence) and those aged 20–24 (33 per cent annual prevalence) than those aged 25 or older (13 per cent annual prevalence). In 2017, nearly one quarter of past-year users, or 1 million people, were daily or near-daily users of cannabis.28
While cannabis users reported using more than one mode of cannabis consumption, smoking was the most common (91 per cent) in Canada in 2017. Mixing cannabis with tobacco (22 per cent), “chas-ing” (smoking a tobacco product right after smoking cannabis) (34 per cent) and consuming cannabis in edibles such as brownies (38 per cent) were also
28 Canada, Health Canada, “Canadian Tobacco, Alcohol and Drugs Survey (CTADS): summary of results for 2017” (updated 4 January 2019). Available from www.canada.ca/en/health-canada/services/canadian-tobacco-alco-hol-drugs-survey/2017-summary.html.
Fig. 17 Cannabis use among high-school students in the United States, 2002–2017
Source: Lloyd D. Johnston and others, Monitoring the Future National Survey Results on Drug Use: 1975-2017: Overview, Key Findings on Adolescent Drug Use (Institute for Social Research, The University of Michigan, 2018).
0
10
20
30
4020
0220
0320
0420
0520
0620
0720
0820
0920
1020
1120
1220
1320
1420
1520
1620
17
Annu
al p
reva
lenc
e (p
erce
ntag
e)
8th grade 10th grade12th grade
Fig. 18 Cannabis use among the population aged 15 and older in Canada, by province, 2017
Source: Canada, Health Canada, “Canadian Tobacco, Alcohol and Drugs Survey (CTADS): summary of results for 2017” (updated 4 January 2019). Available from www.canada.ca/en/health-canada/services/canadian-tobacco-alcohol-drugs-survey/2017-summary.html.
Note: Health Canada does not provide analysis of drug use in the territories (Northwest Territories, Nunavut and Yukon).
14.81111.912.513.21414.61515.7
18.823.4
0 10 20 30
OverallQuebec
New Foundland and LabradorSaskatchewan
New BrunswickOntario
Prince Edward IslandAlberta
ManitobaNova Scotia
British Colombia
Annual prevalence (percentage)
Fig. 19 Cannabis use in Canada, by age group, 2004–2012
Source: Canadian drug use monitoring survey (CADUMS), 2004–2012.
0
10
20
30
40
2004
2005
2006
2007
2008
2009
2010
2011
2012
Annu
al p
reva
lenc
e (p
erce
ntag
e)
Overall 15 to 1718 to 24 25 to 4445 to 64
14.81111.912.513.21414.61515.7
18.823.4
0 10 20 30
OverallQuebec
Newfoundland and LabradorSaskatchewan
New BrunswickOntario
Prince Edward IslandAlberta
ManitobaNova Scotia
British Columbia
Annual prevalence (percentage)
14.81111.912.513.21414.61515.7
18.823.4
0 10 20 30
OverallQuebec
Newfoundland and LabradorSaskatchewan
New BrunswickOntario
Prince Edward IslandAlberta
ManitobaNova Scotia
British Columbia
Annual prevalence (percentage)

THC and CBD: the importance of considering both The principal cannabinoids in the cannabis plant are THC, CBD and CBN. As they occur in the plant, all three are also known as phytocannabinoids, as opposed to endocannabinoids (anandamide and 2-AG), which occur naturally in the body. Among them, THC is considered to be the primary sub-stance that causes the psychoactive effects sought by cannabis users. THC and its synthetic preparation dronabinol are used medically for the management of conditions such as anorexia associated with weight loss in patients with acquired immune deficiency syndrome (AIDS), nausea and vomiting asso-ciated with chemotherapy for cancer, and for chronic pain related to conditions such as multiple scle-rosis and for neuropathic pain. Used non-medically, in a healthy person, THC can induce psychotic symptoms and anxiety and can impair memory and psychomotor control,a whereas in patients with schizophrenia, THC may exacerbate existing psychotic symptoms, anxiety and memory impairments. THC is therefore considered as the main cannabinoid responsible for the development of mental health disorders in long-term, heavy users of cannabis. One plausible reason for an increased risk of developing mental health disorders, including schizophrenia,b among long-term cannabis users is that cannabinoids such as THC may interfere with the neurodevelopmental roles of endocannabinoids.c The effects of CBD, on the other hand, are considered to be the opposite of those of THC; CBD has anxiolytic and anti-psychotic properties.d
Over the past decade, an increasing number of cannabis products that are considered to have high levels of potency have been introduced onto the cannabis market. These products tend to be high in THC and low in CBD. In Europe, for example, the mean THC content of cannabis resin doubled from about 8 per cent in 2006 to 17 per cent in 2016, and the THC content of cannabis herb increased from 5 per cent to 10 per cent over the same period.e In the State of Colorado, in the United States, cannabis flower is reported as having a THC content of 20 per cent and cannabis concentrates of 69 per cent.f As the scientific literature suggests, such potent cannabis may predispose cannabis users, in particular those who are long-term, high-frequency users, to cannabis use disorders and associated psychiatric co-morbidity.g Moreover, it is considered that, when CBD and THC are co-administered in balanced proportions, CBD may be able to reduce some of the effects of THC, such as anxiety and paranoia.h
a Deepak Cyril D’Souza and others, “Delta-9-tetrahydrocannabinol effects in schizophrenia: implications for cognition, psychosis, and addiction”, Biological Psychiatry, vol. 57, No. 6 (March 2005), pp. 594–608.
b Marta Di Forti and others, “The contribution of cannabis use to variation in the incidence of psychotic disorder across Europe (EU-GEI): a multicentre case-control study”, The Lancet Psychiatry, 19 March 2019.
c Hui-Chen Lu and Ken Mackie, “An introduction to the endogenous cannabinoid system”, Biological Psychiatry, vol. 79, No. 7 (April 2016), pp. 516–525.
d Franjo Grotenhermen, Ethan Russo and Antonio Waldo Zuardi, “Even high doses of oral cannabidiol do not cause THC-like effects in humans: comment on Merrick et al. Cannabis and Cannabinoid Research 2016”, Cannabis and Cannabinoid Research, vol. 2, No. 1 (2017).
e Tom P. Freeman and others, “Increasing potency and price of cannabis in Europe, 2006–16” Addiction, 29 December 2018.
f For trends in the potency of cannabis products, see the section on development of cannabis markets in different states in the United States in the present booklet.
g Darby J. E. Lowe and others, “Cannabis and mental illness: a review”, European Archives of Psychiatry and Clinical Neuroscience, vol. 269, No. 1 (2019), pp. 107–120.
h Sagnik Bhattacharya and others, “Opposite effects of Δ-9-tetrahydrocannabinol and cannabidiol on human brain function and psychopathology”, Neuropsychopharmacology, vol. 35, No. 3 (February 2010), pp. 764–774.
CANNABIS AND HALLUCINOGENSW
ORL
D D
RUG
REP
ORT
201
9
22

23
Demand for cannabis 5Cannabis use in countries in Western and Central Europe has fluctuated over the past decade, with 6–7 per cent of the population aged 15–64 having used cannabis in the past year. The highest annual prevalence of cannabis use in Western and Central Europe in recent years has been reported by France (11.1 per cent in 2016), Italy (10.2 per cent in 2017), Spain (9.5 per cent in 2015), Czechia (9.5 per cent in 2016), Netherlands (9.2 per cent in 2017) and Switzerland (9.1 per cent in 2016). Among the six countries that provided data on can-nabis use in 2017, five reported an increase since the last survey. Past-month use of cannabis in West-ern and Central Europe (primarily European Union member States) is estimated at around 3.1 per cent of the population aged 15–64 in 2017; on average less than 1 per cent of the population aged 15-64 are estimated to be daily or near-daily users of can-nabis. The prevalence of cannabis use remains high among young adults (aged 15–34), with an average past-month prevalence of 5.4 per cent; 1.2 per cent of young adults were daily or near-daily users of cannabis in 2017.32
32 EMCDDA, “Prevalence of drug use”, Statistical Bulletin 2018.
use increased by 40 per cent between 2013 and 2017. This is largely a result of a decrease in the perception of risk around cannabis use and of the national debate about legalizing non-medical use of cannabis.30, 31 The increase in cannabis use in Canada since 2013 has been more pronounced among adults (aged 20 or older) while it has declined among young people (aged 19 or younger).
Cannabis use remains relatively stable in Oceania and Europe
While Canada and the United States have experi-enced significant increases in cannabis use in the past decade, the trend in Oceania has been different. Annual prevalence of cannabis use in Oceania, most notably in Australia, was substantially higher than in the United States in the 1990s, but it decreased dramatically, from almost 18 per cent of the popu-lation aged 14 and older in 1998 to roughly 10 per cent a decade later. It has remained at that level throughout the past decade, at almost 4 percentage points below the level reported in the United States.
30 Anna McKiernan and Katie Fleming, Canadian Youth Perceptions on Cannabis (Ottawa, Canadian Centre on Substance Abuse, 2017).
31 Eldon Spackman and others, “Marijuana use and per-ceptions of risk and harm: a survey among Canadians in 2016”, Healthcare Policy, vol. 13, No. 1 (August 2017).
Fig. 20 Cannabis use in Canada, by sex and age group, 2013–2017
Source: Canada, Health Canada, “Canadian Tobacco, Alcohol and Drugs Survey (CTADS): summary of results for 2017” (updated 4 January 2019).
Note: The Canadian Tobacco, Alcohol and Drugs Survey was initi-ated as a biennial survey on tobacco, alcohol and drugs in 2013 and replaced the earlier CADUMS (Canadian drug use monitoring survey); therefore, the results of the two are not entirely compara-ble, in particular, across age groups.
Fig. 21 Cannabis use in Australia, the United States of America, the European Union and globally, 1994–2017
Sources: UNODC, responses to the annual report question-naire; EMCDDA; Substance Abuse and Mental Health Services Administration (United States), EMCDDA; and Australian Insti-tute of Health and Welfare.
05
101520253035
Overall Male Female 15 to19
20 to24
25+
Annu
al P
reva
lenc
e (p
erce
ntag
e)
2013 2015 2017
United States: prevalence among the popula�on aged 12 and olderEuropean Union: prevalence among the popula�on aged 15–64Australia: prevalence among the popula�on aged 14 and olderGlobal: prevalence among the popula�on aged 15–64
0,0
5,0
10,0
15,0
1994
1995
1996
1997
1998
1999
2000
2001
2002
2003
2004
2005
2006
2007
2008
2009
2010
2011
2012
2013
Annu
al p
reva
lenc
e (p
erce
ntag
e)

CANNABIS AND HALLUCINOGENS
Synthetic cannabinoid receptor agonists and their trendsSynthetic cannabinoid receptor agonists, also known as synthetic cannabinoids, are substances designed to mimic the desired effects of cannabis and act on CB1 and CB2 receptors;a these substances can include wide-ranging and chemically diverse substances. Many of them were used widely in pharmaceutical research for several decades and were not considered suitable for human consumption. Outside of pharmaceutical research, synthetic cannabinoids were present in the market until 2004, when they began appearing in advertisements for herbal preparations in, for example, Europe and North America.b Synthetic cannabinoids are typically soaked into or sprayed onto plant material, which itself did not contain substances with psychoactive effects. Many synthetic cannabinoids were sold as smokable “herbal blends” and “legal highs” under a variety of brand names, such as “Spice”, “K2” and “Kronic”, and labelled “not for human consumption”.c Since UNODC began monitoring NPS in 2009, synthetic cannabinoids have been one of the main cate-gories of substances reported as NPS identified in national markets. It remains challenging to determine the prevalence of use of any particular cannabinoid receptor agonists, since in most instances users are unaware of the kind of synthetic cannabinoid they are using. Moreover, the use of synthetic cannabinoids, in many instances after these substances have been put under national control, remains more common and problematic among marginalized groups, especially among people who are homeless or in prison.d Many synthetic cannabinoid receptor agonists have been associated with acute cases of intoxication and even death in some instances.e Overall, the acute psychological effects of synthetic cannabinoids may resemble those reported during acute intoxication with cannabis (THC), which can range from euphoria to distress and anxiety. Along with distorted perceptions of time, hallucinations and paranoia, psychiatric disorders may also occur.f For example, case studies of acute administration of and intoxication with ADB-FUBINACA suggest that the substance may have contributed to severe adverse reactions such as agitation, confusion, hypertension, tachycardia and even death.g, h
Another case study looked at the rapid death of an individual who had used ADB-FUBINACA. The autopsy showed the cause of death to be coronary arterial thrombosis in combination with the use of ADB-FUBINACA.i In 2015, Poland registered an outbreak of intoxications with a substance called “mocarz”, which contained fre-quently changing synthetic cannabinoids. Many of the “mocarz” samples contained a variety of synthetic cannabi-noids, including UR-144, XLR-11, BB-22, 5F-PB-22 and MDMB-CHMICA. One of the victims reported to have died from multiple organ failure and was found to have MDMB-CHMICA in the body.j
While the non-medical use of natural cannabis and its products is common, and natural cannabis remains the principal type of cannabis consumed, synthetic cannabinoid receptor agonists continue to proliferate in many subregions, as reported through the UNODC early warning advisory. Owing to the unknown chemical structure of many synthetic cannabinoid receptor agonists and therefore their potential harm, their use always carries the risk of acute intoxication and other adverse public health effects.
a Nicola J Kalk and others, “Spice and all things nasty: the challenge of synthetic cannabinoids” BMJ, vol. 355, No. 8079 (October 2016).
b EMCDDA, “Synthetic cannabinoids in Europe”, Perspectives on Drugs series (Lisbon, 6 June 2017).c World Drug Report 2017, Booklet 4: Market Analysis of Synthetic Drugs.d Ibid.e “Synthetic cannabinoids in Europe”.f Francois R. Lamy and others, “Increases in synthetic cannabinoids-related harms: results from a longitudinal web-based content
analysis”, International Journal of Drug Policy, vol. 44 (June 2017), pp. 121–129.g Nicklaus Brandehoff and others, “Synthetic cannabinoid ‘Black Mamba’ infidelity in patients presenting for emergency stabilization
in Colorado: a P SCAN cohort”, Clinical Toxicology, vol. 56, No. 3 (2018), pp. 193–198.h Rex Pui Kin Lam and others, “Supraventricular tachycardia and acute confusion following ingestion of e-cigarette fluid containing
AB-FUBINACA and ADB-FUBINACA: a case report with quantitative analysis of serum drug concentrations”, Clinical Toxicology, vol. 55, No. 7 (April 2017), pp. 662–667.
i Kevin G. Shanks, William Clark and George Behonik, “Death associated with the use of the synthetic cannabinoid ADB-FUBIN-ACA”, Journal of Analytical Toxicology, vol. 40, No. 3 (April 2016), pp. 236–239.
j UNODC, Laboratory and Scientific Section Portals, “Poland: “Mocarz” intoxications now linked to synthetic cannabinoid MDMB-CHMICA” (March 2016).
Most persistent cannabinoid receptor agonists that were reported to UNODC over the period 2012–2018
and have remained on the market
5F-APINACA; AB-FUBINACA; AB-PINACA;
ADB-FUBINACA; AM-2201; APINACA; JWH-018;
JWH-081; JWH-122; JWH-203; JWH-210; JWH-250;
MAM-2201; PB-22; QUCHIC; RCS-4; UR-144; XLR-11.
CANNABIS AND HALLUCINOGENSW
ORL
D D
RUG
REP
ORT
201
9
24

25
Developments in measures regulating the non-medical use of cannabis 5
in 2018 that legalized the non-medical use of can-nabis, as well as the division of responsibilities at the federal and state levels in regulating the non-medical use of cannabis in Canada.33
Cannabis regulations and their implementation in the United States
By the end of 2018, a total of 33 states, as well as the District of Columbia, Guam and Puerto Rico, had approved or had in place a comprehensive public medical cannabis programme. As of 2019, 10 state-level jurisdictions in the United States,34 plus the District of Columbia, allow the non-medical use of cannabis.35, 36 In 2018, Michigan and Vermont were the two states in which legislation allowing the non-medical use of cannabis had been approved. While the non-medical use of cannabis was legalized through voters’ initiatives in the other jurisdictions, Vermont is the only state that legalized it through state legislature. It is worthy of note that all the states that have legalized the non-medical use of cannabis had prior measures permitting the medical use of
33 For details of different measures in each of the jurisdiction, see table 2 on pages 36–43 of the present booklet.
34 In the United States, cannabis is federally prohibited as a substance in schedule I of the Controlled Substances Act.
35 Home cultivation is not allowed in the State of Washington. The number of plants allowed in each state varies.
36 National Conference of State Legislatures, “Marijuana overview”, 14 December 2018.
Developments in measures regulating the non-medical use of cannabis As of March 2019, legal provisions allowing the non-medical use of cannabis have been approved in Canada and Uruguay as well as in 10 jurisdictions in the United States. The common feature of the legislation is that it generally allows for the produc-tion and sale of cannabis products for non-medical use in the relevant jurisdictions. However, there are differences in the level of regulation and control of the non-medical use of cannabis and the different regulations that are being implemented in different local contexts and dynamics are likely to have a dif-ferent impact within each jurisdiction on the development of cannabis markets, the extent of non-medical use of cannabis and other public health, safety and criminal justice outcomes.
This section contains a description of the different features and status of legislation and regulations on the non-medical use of cannabis in Canada, Uru-guay and jurisdictions in the United States. For the United States, the section covers the main features of cannabis regulations and some state-level differ-ences in the regulation of cannabis markets. It also covers the development of a cannabis market in some of the states where information was available. The section also presents the main features of the federal law passed by the Government of Canada
Fig. 22 Cannabis use in selected countries in Western Europe
Source: UNODC, responses to the annual report questionnaire.
02468
10121416
201
1/12
2012
/13
2013
/14
2014
/15
2015
/16
2016
/17
2017
/18
2007
2011
2012
2017
2005
2008
2012
2013
2017
2005
2009
2014
2015
2016
2017
2004
2009
2013
2014
2015
2016
2017
2007
2012
2017
England and Wales Iceland Italy Netherlands Norway Portugal
Annu
al p
reva
lenc
e (p
erce
ntag
e)

26
WO
RLD
DRU
G R
EPO
RT 2
019 CANNABIS AND HALLUCINOGENS
non-medical use and 16 have banned it. In Califor-nia, the largest state to legalize the non-medical use of cannabis, less than 20 per cent of cities, i.e., 89 out of 482 cities, allow retail shops to sell cannabis for non-medical use.37 Moreover, fewer than one in five cities in California allow the sale of cannabis for medical purposes, which has been legal in the state for almost 22 years. In Michigan, the munici-palities can place harsher restrictions on cannabis businesses than the state legislation. Such restrictions may include capping the number of licences or ban-ning the commercial production and sale of cannabis for non-medical use altogether. Residents can also petition their town for such ordinances. Regulation of the cannabis market is simi-lar to the regulation of the alcohol market
All the states that have measures allowing the non-medical use of cannabis regulate the cannabis market in a manner similar to that of the alcohol market; for instance, by prohibiting the sale of cannabis to people under 21 years of age or by licensing
37 Patrick McGreevy (Tribune News Service), “Legal pot sales fall short of expectations in California”, Governing: the States and Localities, 3 January 2019.
cannabis. In fact, in states such as Colorado, the initial applications for recreational cannabis licences were restricted to businesses that were already licensed to sell cannabis for medical purposes.
Cannabis regulations in the United States are not implemented uniformly in each state
The level of implementation of the legislation per-mitting the non-medical use of cannabis varies across state jurisdictions and may even include different approaches within the same jurisdiction. For exam-ple, some states that have legalized the non-medical use of cannabis allow city administrations to for-mulate their own cannabis regulations and give options to cities and neighbourhoods within those cities to opt out and not permit the sale of cannabis. In Colorado, 25 of the state’s 64 counties allow some form of business activity related to the non-medical use of cannabis, which may include only allowing cannabis dispensaries to operate, allowing cannabis production, setting a limit on licensing new busi-nesses, or a combination of those. The remaining counties in Colorado have either a complete ban or a moratorium in place. In Oregon, of the state’s 36 counties, 20 allow the sale of cannabis for
Map 1 Jurisdictions in the United States that allow non-medical use of cannabis, medical use of cannabis and those that do not allow access to cannabis, December 2018
Source: National Conference of State Legislatures, “Marijuana overview”, 14 December 2018.
The boundaries and names shown and the designations used on this map do not imply official endorsement or acceptance by the United Nations.
TX
CA
MT
AZ
ID
NV
NM
COIL
OR
UTKS
WY IA
NE
SDMN
ND
OK
FL
WI
MO
WA
AL GAAR
LA
MI
INPA
NY
NC
MS
TN
VAKY
OH
SC
ME
WV
VTNH
MD
NJ
MA
CT
DE
RI
HI
AK
Adult non medical use and medical use regulated lawsComprehensive medical marijuana lawCBD/Low THC product lawNo marijuana access law
Source: National Conference of State Legislatures, “Marijuana overview”, 14 December 2018
The boundaries and names shown and the designations used on this map do not imply official endorsement or acceptance by the United Nations.

27
Developments in measures regulating the non-medical use of cannabis 5cannabis sales. Part of that revenue is utilized for implementing the regulatory framework and invest-ing in public health initiatives to address the harm caused by the non-medical use of cannabis. Another consideration is that the price of cannabis products (including taxes) needs to be low enough to displace the illegal cannabis market, but not so low that it encourages more and more frequent use of cannabis. On the basis of these considerations, all states have put together an elaborate structure of taxation and revenue collection from the cultivation, production and sale of cannabis. Current tax rates range from about 10 to 37 per cent across states, although sev-eral states have recently changed their tax rates and/or structures.39 Currently, at 37 per cent, Washing-ton State levies the highest sales tax. Colorado imposes a 15 per cent excise tax on cultivation and used to impose a 10 per cent cannabis retail sales tax until it was lowered to 8 per cent in July 2017. It also imposes an additional 2.9 per cent state sales tax and up to 3.5 per cent local sales tax. City-level jurisdictions can also impose their own local taxes on the sale of cannabis. Advertising cannabis products
All of the states in which the use of cannabis is legal-ized have some degree of restriction on the advertising of cannabis products. For example, in California, advertising can only be directed at people aged 21 or older, there are restrictions on false claims that can be made relating to health benefits, and product labels cannot be appealing to children. In Colorado, advertising is restricted to media with audiences that comprise no more than 30 per cent of people under the age of 21. In some states, such as Washington, advertisements cannot depict car-toon characters and pictures that could be appealing to children. Product proliferation
With regard to cannabis products and pricing in the states that have implemented measures for the non-medical use of cannabis, there has been a proliferation of products that include flowers, pre-rolled joints, vaporizers (vaping cannabis), concentrates and edi-bles such as cakes and soda drinks. The potency of those products can vary across states and, while
39 For details of taxation in each state, see table 3 on pages 44–49 of the present booklet.
commercial enterprises to produce, market and sell a wide range of cannabis products. Some states, such as Alaska, Oregon and Washington, have added can-nabis market regulation to the existing alcohol or liquor boards. In California, Colorado and Massa-chusetts, cannabis regulatory bodies have been established and in Nevada and Michigan, the can-nabis market is regulated by the departments of revenue or taxation. Maine is the only state where cannabis regulation is overseen by the Department of Agriculture, Conservation and Forestry. At the time of writing, the regulatory system for the pro-duction or sale of cannabis for non-medical use in Vermont had not been set up. Different limits for possession and home cultivation of cannabis
With the exception of the District of Columbia and Maine, which permit the possession of larger quan-tities, most of the states allow for the possession of up to 28.5 g of cannabis. In addition, all states permit the home cultivation of around six plants, with a varying number of plants that can be flowering; Michigan, which allows for the home cultivation of up to 12 plants, is an exception. The conditions allowing home cultivation of cannabis vary but may include measures such as plants having to be grown out of public view or cultivation being subject to the permission of the house owners or other tenants in the building or to neighbourhood zoning laws. Taxes levied on cannabis differ considerably
In general, the pricing of and taxes levied on can-nabis products are based on different considerations and essentially adhere to Laffer curve criteria.38 When states make decisions on how to tax cannabis, one consideration is to maintain a price that is more attractive than that on the “black market” in order to prevent organized crime groups from generating profits from the illicit trade in cannabis and for the State authorities themselves to generate revenue from
38 The Laffer curve, defined as the relationship between the tax rate and total revenue raised, is usually considered in macro-economics to describe the relationship between income taxes and labour supply. A similar relationship has been applied to commodity taxes, as the tax pushes the price upwards, ultimately reducing demand. Arthur B. Laffer described this relationship (1985), although the concept is originally cred-ited to Dupuit (1844).

28
WO
RLD
DRU
G R
EPO
RT 2
019 CANNABIS AND HALLUCINOGENS
per cent, from $41.43 per gram to $21.57. The price of infused edible products has hovered around $18 per 100 mg package but has not exhibited a consist-ent trend over time. In the State of Washington, the price per gram of flower (pre-tax) decreased by 77 per cent, from $17.23 per gram in 2014 to $5.18 in October 2017. The decrease in retail prices is considered to reflect a competitive market in which both cultivators and retailers are constantly vying for business, although the decrease has also led to an increase in demand, sales and tax revenue. Thus, one concern in the State of Washington has been an oversupply of cannabis in the market because of overproduction: the area available for cannabis pro-duction was initially capped at 2 million square feet and later raised to 8 million square feet, and the number of licences for retail outlets, which was ini-tially capped at 334, increased to 556 by January 2016.43 During the period January to November 2018, total sales of different cannabis products were estimated at $1.4 billion in Colorado. The average retail price of inhalable products, which accounted for 80 per cent of total sales, decreased by 10 per cent; the average retail price of ingestibles (edibles) increased by 9 per cent; and the price of topical can-nabis products by 10 per cent.44
Overall, according to a study of the market size and demand for cannabis in Colorado, while the price for marijuana is falling gradually, the price of a “standard serving” of THC has declined more rap-idly. It is unclear whether this is a long-term trend that will lead to a “high THC/low price” paradigm, or whether the market price will stabilize to suggest an equilibrium.45
In the states of California, Colorado and Oregon, where price and sales monitoring data were available, combined sales reached $4.2 billion during the period January to November 2018. While prices mostly decreased in Colorado and Oregon, the trend was different in California (see the next subsection).
In 2017, based on sales data in Colorado, the prin-cipal demand for cannabis products for non-medical
43 Brett Hollenbeck and Kosuke Uetake, “Taxation and market power in the legal marijuana industry”, Munich Personal RePEc Archive Paper No. 90085, 12 November 2018.
44 BDS Analytics Inc., data.45 Orens and others, “Market size and demand for marijuana
in Colorado”.
many states have facilities for monitoring potency, the increasing potency of cannabis products, in par-ticular, products other than those made from cannabis flower, may be a public health concern as there are generally no restrictions on the potency of cannabis products. Development of cannabis markets in different states in the United States
Prices of cannabis products in different states have also been fluctuating, which is a reflection of the competitiveness of the markets where the demand for cannabis products and the cultivation and pro-duction of cannabis are on the increase. It has been argued that there is still a residual illicit cannabis market in Washington and Colorado.40, 41 The market for the non-medical use of cannabis has evolved in terms of the pricing and sale of cannabis products, changes in the potency of products and patterns of consumption of non-medical use. Since Colorado has a longer-standing cannabis market than other states, for both the medical and non-medical use of cannabis, with more long-term trend data, the examples in the present section are primar-ily taken from Colorado.
Decreasing prices in some jurisdictions have led to an increase in the demand for and sale of cannabis and related revenue
Colorado and Washington were the first states to legalize the non-medical use of cannabis. In both states, cannabis prices have decreased considerably since the inception of the drug’s legal sale. In Colo-rado, the prices of cannabis for non-medical use are declining in general. From 2014 to 2017, the aver-age annual price of cannabis flower decreased by 62 per cent, from $14.05 per gram (weighted average) in 2014 to $5.34 in 2017.42 Over the same period, the price of cannabis concentrates decreased by 47.9
40 Nicholas P Lovrich and other, “Learning from the legaliza-tion of recreational marijuana: a preliminary assessment of Washington State’s experience”, presented at Annual Meet-ing of the Academy of Criminal Justice Scienes, 2019 in Baltimore, USA
41 Jonathan P. Caulkins and others, “Triangulating web and gerneral population surveys: how well do results match legal cannabis market sales?”, presented at annual conference of the International Society for the Study of Drug Policy, held in Vancouver, Canada, from 16 to 18 May 2018.
42 Orens and others, “Market size and demand for marijuana in Colorado”.

29
Developments in measures regulating the non-medical use of cannabis 5use was for cannabis flower, followed by cannabis concentrates. The cannabis market appears to be moving away from flower (primarily for smoking), the price of which has been decreasing since 2014. On the other hand, an increase has been observed in the demand for products such as concentrates and edibles. In 2017, more than one third of total sales were for non-flower products, compared with one quarter in 2014. The most popular products, after cannabis flower, are oil-filled vaporizer car-tridges, wax/shatter concentrates and infused edibles.
The sale of cannabis for non-medical use commenced operations in California in January 2018, albeit with some challenges
In California, the sale of cannabis for non-medical purposes officially began in January 2018, when stores were licensed. This occurred after 22 years of tolerating a largely unregulated medical cannabis market. The roll-out of sales of cannabis for non-medical purposes following the new legislation in California experienced some bottlenecks. Firstly, many cities did not allow the sale of cannabis for non-medical purposes, while many municipalities that did allow such sale were slow to issue licences to cultivators, dispensaries and manufacturers. In addition, stricter testing requirements went into effect in July 2018, before many manufacturers were ready and before adequate testing facilities were available to handle the added workload. Thus, the first year of sales was affected by supply shortages that led to high prices, a dynamic that was com-pounded by some of the highest tax rates on cannabis among the states that have regulations allowing its use for non-medical purposes. Cannabis prices on the regulated market in California thus remain higher than on the illicit cannabis market, in par-ticular in the case of cannabis flower. This probably indicates that consumers of cannabis flower either remained with, or even moved to, the illicit cannabis market in 2018. As a result, the state failed to meet revenue projections in the first year. In the last months of 2018, some of the bottlenecks eased slightly and, as greater competition took hold, prices began declining slowly. However,46 with a larger share of cannabis sales coming from categories such
46 Analysis of market prices and sales provided by BDS Analyt-ics Inc. to UNODC on request.
Fig. 23 Total sales and average retail price of cannabis in Colorado, by type of product, January to November 2018
Source: BDS Analytics Inc., Cannabis industry market trends and consumer insights, 2019.
10
15
20
25
1,000,000
1,500,000
2,000,000
2,500,000
3,000,000
Janu
ary
Febr
uary
Mar
chAp
rilM
ayJu
ne July
Augu
stSe
ptem
ber
Oct
ober
Nove
mbe
r Aver
age
reta
il pr
ice
(dol
lars
)
Tota
l sal
es (d
olla
rs)
Topicals
Total sales Average retail price
16.0
16.5
17.0
17.5
18.0
18.5
15,000,000
17,000,000
19,000,000
21,000,000
23,000,000
25,000,000
Janu
ary
Febr
uary
Mar
chAp
rilM
ayJu
ne July
Augu
stSe
ptem
ber
Oct
ober
Nove
mbe
r Aver
age
reta
il pr
ice
(dol
lars
)
Tota
l sal
es (d
olla
rs)
Ingestibles
Total sales Average retail price
6.00
6.25
6.50
6.75
7.00
7.25
7.50
90,000,000
95,000,000
100,000,000
105,000,000
110,000,000
115,000,000
Janu
ary
Febr
uary
Mar
chAp
rilM
ayJu
ne July
Augu
stSe
ptem
ber
Oct
ober
Nove
mbe
r Aver
age
reta
il pr
ice
(dol
lars
)
Tota
l sal
es (d
olla
rs)
Inhalables
Total sales Average retail price
10
15
20
25
1,000,000
1,500,000
2,000,000
2,500,000
3,000,000
Janu
ary
Febr
uary
Mar
chAp
rilM
ay Jue
July
Augu
stSe
ptem
ber
Oct
ober
Nove
mbe
r Aver
age
reta
il pr
ice
(dol
alrs
)
Tota
l sal
es (d
olla
rs)
Topicals
Total sales Average retail price

30
WO
RLD
DRU
G R
EPO
RT 2
019 CANNABIS AND HALLUCINOGENS
the proportion of tested cannabis concentrates that contain over 75 per cent THC has increased fivefold in recent years (from 5 per cent in 2015 to 25 per cent in 2017). As mentioned earlier, the rate of the decrease in price per serving has outpaced the price-per-gram decrease, owing to a combination of falling cannabis flower prices and a slight increase in potency from 2014 to 2017.47
Per-capita non-medical consumption of cannabis
Understanding how cannabis use has changed in Colorado requires analysis that goes beyond the trend in the number of users. The biggest change in the cannabis market in Colorado actually seems to have occurred in terms of heavier and more fre-quent use of more potent cannabis products than
47 Orens and others, “Market size and demand for marijuana in Colorado”.
as concentrates, edibles and topicals, with compara-tively higher average retail prices, the overall average retail price of cannabis was pushed up even further.
Trend in increasing potency of cannabis products
The monitoring of the potency of cannabis products was initiated in Colorado in 2014. According to testing data, while the potency (THC levels) of can-nabis flower has remained lower (19.6 per cent in 2017) than that of cannabis concentrates (68.6 per cent in 2017), the potency of both product types increased by about 20 per cent over the period 2014–2017.
The market for cannabis concentrates has evolved rapidly, with a wide range of products, such as wax, shatter, oil and vaporizer cartridges, now available, each with varying average levels of THC, although
Fig. 24 Trends in cannabis prices and sales in California, Colorado and Oregon, January to November 2018
Source: BDS Analytics Inc., Cannabis industry market trends and consumer insights, 2019.
Fig. 25 Share of cannabis products in Colorado, 2014 and 2017
Source: Adam Orens and others, “Market size and demand for marijuana in Colorado: 2017 market update”, prepared for the Colorado Department of Revenue (Denver, Colorado, Mar-ijuana Policy Group, August 2018).
10
50,000,010
100,000,010
150,000,010
200,000,010
250,000,010
Jan
Feb
Mar Ap
rM
ay Jun Jul
Aug
Sep
Oct
Nov
Pric
e pe
r gra
m (d
olla
rs)
CaliforniaColoradoOregon
1012141618202224
Jan
Feb
Mar Ap
r
May Jun Jul
Aug
Sep
Oct
Nov
Pric
e pe
r gra
m (d
olla
rs)
California Colorado Oregon2017
Flower
ConcentrateEdiblesNon-ediblesShake/trim
Other
2014
66%15%12%
4%4%0,1%
54%23%13%
7%1,6%0,3%
Prices
Sales
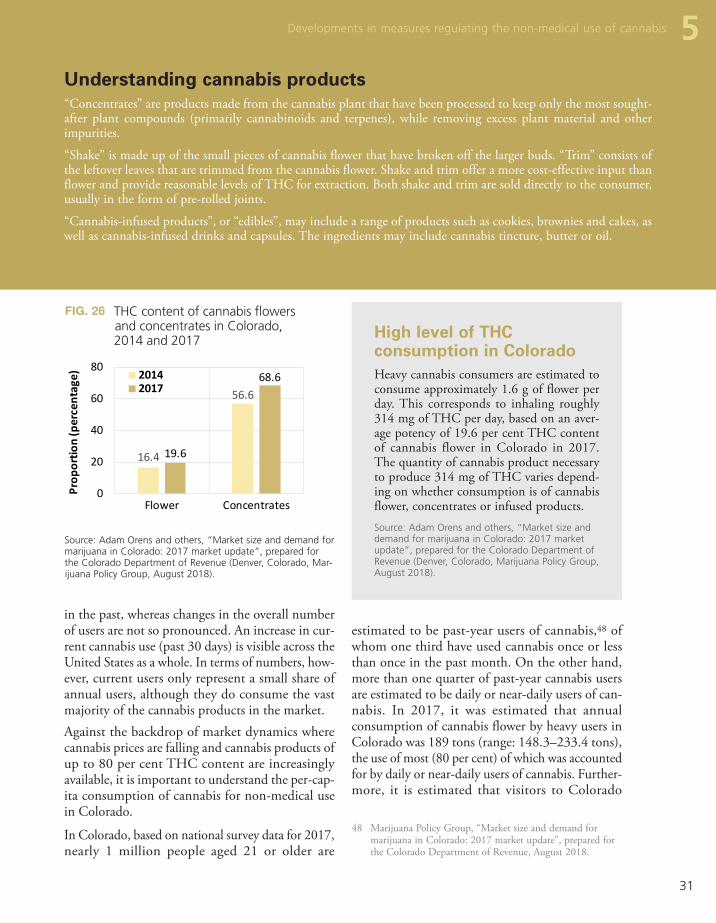
31
estimated to be past-year users of cannabis,48 of whom one third have used cannabis once or less than once in the past month. On the other hand, more than one quarter of past-year cannabis users are estimated to be daily or near-daily users of can-nabis. In 2017, it was estimated that annual consumption of cannabis flower by heavy users in Colorado was 189 tons (range: 148.3–233.4 tons), the use of most (80 per cent) of which was accounted for by daily or near-daily users of cannabis. Further-more, it is estimated that visitors to Colorado
48 Marijuana Policy Group, “Market size and demand for marijuana in Colorado: 2017 market update”, prepared for the Colorado Department of Revenue, August 2018.
in the past, whereas changes in the overall number of users are not so pronounced. An increase in cur-rent cannabis use (past 30 days) is visible across the United States as a whole. In terms of numbers, how-ever, current users only represent a small share of annual users, although they do consume the vast majority of the cannabis products in the market. Against the backdrop of market dynamics where cannabis prices are falling and cannabis products of up to 80 per cent THC content are increasingly available, it is important to understand the per-cap-ita consumption of cannabis for non-medical use in Colorado.
In Colorado, based on national survey data for 2017, nearly 1 million people aged 21 or older are
Understanding cannabis products“Concentrates” are products made from the cannabis plant that have been processed to keep only the most sought-after plant compounds (primarily cannabinoids and terpenes), while removing excess plant material and other impurities.
“Shake” is made up of the small pieces of cannabis flower that have broken off the larger buds. “Trim” consists of the leftover leaves that are trimmed from the cannabis flower. Shake and trim offer a more cost-effective input than flower and provide reasonable levels of THC for extraction. Both shake and trim are sold directly to the consumer, usually in the form of pre-rolled joints.
“Cannabis-infused products”, or “edibles”, may include a range of products such as cookies, brownies and cakes, as well as cannabis-infused drinks and capsules. The ingredients may include cannabis tincture, butter or oil.
5 Developments in measures regulating the non-medical use of cannabis
Fig. 26 THC content of cannabis flowers and concentrates in Colorado, 2014 and 2017
Source: Adam Orens and others, “Market size and demand for marijuana in Colorado: 2017 market update”, prepared for the Colorado Department of Revenue (Denver, Colorado, Mar-ijuana Policy Group, August 2018).
16.4
56.6
19.6
68.6
0
20
40
60
80
Flower Concentrates
Prop
ortio
n (p
erce
ntag
e) 20142017
High level of THC consumption in Colorado Heavy cannabis consumers are estimated to consume approximately 1.6 g of flower per day. This corresponds to inhaling roughly 314 mg of THC per day, based on an aver-age potency of 19.6 per cent THC content of cannabis flower in Colorado in 2017. The quantity of cannabis product necessary to produce 314 mg of THC varies depend-ing on whether consumption is of cannabis flower, concentrates or infused products. Source: Adam Orens and others, “Market size and demand for marijuana in Colorado: 2017 market update”, prepared for the Colorado Department of Revenue (Denver, Colorado, Marijuana Policy Group, August 2018).

32
WO
RLD
DRU
G R
EPO
RT 2
019 CANNABIS AND HALLUCINOGENS
consume an additional 19 tons of cannabis flower per year.49
In terms of trends, the quantity of cannabis used by annual users saw a sharp increase over the period 2014–2017; 56 per cent in four years. While there was also an increase in the number of annual users, this was driven more by an increase in the number of past-month users and in large part by more fre-quent or regular users of cannabis. An increase in the state population also played a marginal role.50 Heavy and regular use of high-potency cannabis products remains within a population subgroup that earlier studies have suggested is more socially dis-advantaged than occasional cannabis users. Moreover, as the literature suggests, those cannabis users who progress to daily use have a higher prob-ability of developing cannabis use disorders. Furthermore, high THC content in cannabis has been identified as a risk factor for acute and chronic adverse health outcomes, including mental health problems and cannabis use disorders.51, 52
49 Ibid.50 Ibid.51 Wilson M. Compton and others, “Marijuana use and
use disorders in adults in the USA, 2002–14: analysis of annual cross-sectional surveys”, Lancet Psychiatry, vol. 3, No. 10 (October 2016), pp. 954–964.
52 Steven S. Davenport and Jonathan P. Caulkins, “Evolution of the United States marijuana market in the decade of
Table 1 Frequency of cannabis use in a month and annual consumption of cannabis flower among annual users of cannabis aged 21 or older in Colorado, 2017
Source: Adam Orens and others, “Market size and demand for marijuana in Colorado: 2017 market update”, prepared for the Colorado Department of Revenue (Denver, Colorado, Marijuana Policy Group, August 2018).
Number of days used per month
Estimated past-year
users
Proportion of users among
past-year users (%)
Average consumption of cannabis flower per year (tons)
Quantity used out of total quantity (%)
Less than once 297,592 30.2 0.7 0.3
1–5 days 216,387 22 6.4 3.4
6–10 days 68,694 7 5.4 2.8
11–15 days 58,390 5.9 7.5 3.9
16–20 days 78,998 8 14 7.4
21–25 days 42,590 4.3 20.9 11
26–31 days 221,882 22.5 134.9 71.1
Total 984,534 100 189.6 100
Fig. 27 Trends in the number of users aged 18 and older and estimated quantity (tons) of cannabis flower consumed in Colorado, 2014–2017
Sources: Adam Orens and others, “Market size and demand for marijuana in Colorado: 2017 market update”, prepared for the Colorado Department of Revenue (Denver, Colorado, Mar-ijuana Policy Group, August 2018).; and United States, Sub-stance Abuse and Mental Health Services Administration, Center for Behavioral Health Statistics and Quality, National survey on drug use and health – state level estimates of can-nabis users.
Note: The United States Substance Abuse and Mental Health Ser-vices Administration reports prevalence among those aged 12 or older or 18 years or older; in this case the latter age category has been used a proxy of number of cannabis users 21 years and older.
824
957
988
1,083
603
695
689
725
121.4
134.7
190.2
189.6
0 500 1,000 1,500
2014
2015
2016
2017
Quantities of cannabis consumed per year (tons)Number of past-month cannabis users (thousands)Number of past-year cannabis users (thousands)

33
Developments in measures regulating the non-medical use of cannabis 5
writing, all the provinces and territories, other than Quebec and Alberta had set the minimum age for the non-medical use of cannabis at 19. The prov-inces and territories can also lower the personal possession limits, which are set at 30 g of legal can-nabis, dried or equivalent, and can create additional rules for the cultivation of cannabis in the home, including the number of plants per residence. At the time of writing, most provinces allow cultiva-tion of up to four cannabis plants either per household or, in some instances, per person. How-ever, Manitoba and Quebec do not permit home cultivation, and the Government of Nunavut has not yet regulated the home cultivation of cannabis plants. All the provinces and territories have restric-tions on the consumption of cannabis products in public places. In addition, each province and terri-tory has its own excise stamp for cannabis products, without which their sale would not be legal.
With regard to the use of cannabis for medical pur-poses in Canada, access was first provided in 1999, under exemptions within the Controlled Drugs and Substance Act. In June 2013, the Government of Canada implemented the Marijuana for Medical Purposes Regulations, which set the rules and regu-lations of a commercial industry for the production and distribution of cannabis for medical use. Under the Regulations, individuals with a medical need could access quality-controlled dried marijuana pro-duced under secure and sanitary conditions. In June 2015, the Government issued further exemptions to permit licensed producers to produce and sell cannabis oil, fresh cannabis buds and leaves, in addi-tion to dried cannabis, and to allow authorized users
Legalization of the non-medical use of cannabis in Canada
In 2018, the Government of Canada passed legis-lation permitting the production and sale of cannabis for non-medical use among people aged 18 or older. The legislation and its supporting regulations came into effect on 17 October 2018. The objectives of the legislation are to keep cannabis away from young people (under 18 years of age) while preventing criminals profiting from the distribution and sale of cannabis and safeguarding public health and safety by allowing adults (aged 18 or older) legal access to cannabis.53 Based on the constitutional division of powers in Canada, the federal Govern-ment and provincial governments have different responsibilities.54
The federal Government is responsible for setting the requirements for those who grow and produce cannabis, including the types of cannabis products available for sale. Building on the framework, the production and sale of edible cannabis, cannabis extracts and topicals will be permitted for sale no later than 17 October 2019. The federal Govern-ment is also responsible for restricting promotional activity, as well as for setting standards in packaging and labelling, so that products are not appealing to young people and important product information is presented correctly. Selling cannabis through self-service displays or vending machines is also not permitted under the regulations.55
The provincial and territorial governments are responsible for developing, implementing, main-taining and enforcing systems to oversee the distribution and sale of cannabis. In most of them, the retail licensing regime is similar to that regulat-ing the sale of liquor and the sale of cannabis takes place through licensed retailers, provincial retail stores and online. Provinces and territories can also add their own safety measures by adding restrictions, for example, by increasing the minimum age, set at 18 by the federal Government. At the time of
liberalization before full legalization”, Journal of Drug Issues, vol. 46, No. 4 (August 2016).
53 Canada, Ministry of Justice, “Cannabis legalization and reg-ulation”. Available at www.justice.gc.ca/eng/cj-jp/cannabis.
54 See table 2 on page 36 of the present booklet.55 Canada, Ministry of Justice, “Cannabis regulations”,
SOR/2018-144, December 2018.
Permitted quantities of cannabis products for personal possession in Canada • 30 g of dried cannabis or equivalent• 150 g of fresh cannabis• 450 g of edible product• 2100 g of liquid product• 7.50 g of concentrates (solid or liquid)• 30 cannabis plant seeds

34
WO
RLD
DRU
G R
EPO
RT 2
019 CANNABIS AND HALLUCINOGENS
measures. Differences in the implementation of the federal legislation in the provinces may also vary in impact and thus require contextual analysis at the provincial and territorial levels. The Government of Canada has invested in a formal monitoring system and, among other measures, established a baseline in 2018 through a national cannabis survey for evaluating the impact of the new legislation and to support the development of policy and pro-gramme initiatives. The annual cannabis survey is aimed at providing an understanding of the fre-quency of cannabis use and to monitor changes in behaviour as a result of the legalization and regula-tion of the use of cannabis for non-medical purposes. The survey is also intended to be used in conjunc-tion with other data sources to improve understanding of how the legalization and regulation of the use of cannabis could impact health and social services and the Canadian economy. The Govern-ment of Canada will also use the data to understand the patterns of use of cannabis for medical purposes and its impact on individuals. Furthermore, the Government of Canada has invested in research on cannabis and also monitors the scientific literature on the potential therapeutic uses of cannabis and its adverse effects and will continue to conduct research on cannabis and cannabinoids, including research on the use of cannabis for medical purposes.57
Developments in the regulation of cannabis in Uruguay
In 2013, the Government of Uruguay approved legislation (Law No. 19.172) regulating the cultiva-tion, production, dispensing and use of cannabis for non-medical purposes. In accordance with the legislation, cannabis can be obtained by individuals aged 18 or older for non-medical purposes through registration with the national Institute for the Regu-lation and Control of Cannabis and by choosing one of three options: (a) purchase in authorized pharmacies; (a) membership of a club; or (c) domes-tic cultivation.58 The quantity of cannabis permitted
57 Canada, “Cannabis for medical purposes under the Cannabis Act: information and improvements”, October 2018.
58 See also World Drug Report 2018: Analysis of Drug Mar-kets – Opiates, Cocaine, Cannabis, Synthetic Drugs (United Nations publication, Sales No. E.18.XI.9 (Booklet 3)).
to possess the different forms of cannabis for medi-cal purposes. In August 2016, the Government of Canada introduced the Access to Cannabis for Med-ical Purposes Regulations, which replaced the earlier regulations. Health Canada is the regulatory body for cannabis for medical purposes and is responsible for licensing and overseeing the commercial medi-cal cannabis industry and registering individuals to allow them to produce a limited amount of cannabis for their own medical purposes (or for another indi-vidual to produce it for them).
Under the new cannabis act, which came into force in October 2018, new regulations for the medical use of cannabis have replaced the Access to Canna-bis for Medical Purposes Regulations.
Among other conditions, people authorized by their health-care provider are still able to access cannabis for medical purposes by buying directly from a fed-erally licensed seller, registering with Health Canada for producing a limited amount of cannabis for their own medical purposes or designating someone to produce it for them. An authorized health-care pro-vider can permit the use of cannabis for medical purposes for a period of up to one year and sets the daily quantity of dried cannabis expressed in grams. Furthermore, subject to age limits, in the provinces, people can also purchase cannabis (for medical use) through provincial or territorial authorized retail outlets or through authorized online sales platforms. Irrespective of how individuals obtain cannabis to be used for medical purposes, the possession limit is the lesser of a 30-day supply or 150 g of dried cannabis, or the equivalent amount if in another form. The number of people registered for the use of cannabis for medical purposes at the end of December 2018 was 359,292, which was an increase over the 23,930 people registered during the period April–June 2015.56
The implementation of laws permitting the non-medical use of cannabis in Canada is nascent and may take several years of monitoring to clarify how the cannabis market has evolved and to identify its dynamics and the impact of legalization on public health and public safety, among other outcome
56 Statista, “Quarterly number of medical marijuana clients registered in Canada between April 2015 and June 2018”, 2019.

35
Developments in measures regulating the non-medical use of cannabis 5per person, obtained through any of the three mech-anisms, cannot exceed 480 g per year. Initially, the Government of Uruguay set THC content at 2 per cent and CBD content at 6–7 per cent. In 2017, the Government introduced two new varieties, with THC content of 9 per cent and CBD content of almost 3 per cent.59 Overall, the implementation of the regulation has been slow and gradual; for exam-ple, by February 2018 there were 16 pharmacies dispensing cannabis for non-medical use in the country, with 34,696 people registered to acquire cannabis from them. By February 2019, 115 can-nabis clubs had been registered, with a total membership of 3,406, and 6,965 persons had been registered for personal or domestic cultivation of cannabis. This makes a total of approximately 45,000 people with access to the regulated cannabis market in Uruguay,60 which remains a small share of the entire population of cannabis users in the country.
A survey on drug use was implemented by the Uru-guayan Drug Observatory in 2014. The results of that survey showed an estimated annual prevalence of cannabis use of 9.3 per cent (12.5 per cent among men and 6.4 per cent among women), or about 162,000 past-year cannabis users. The past-month prevalence of cannabis use in 2014 was 6.5 per cent (9.4 per cent among men and 3.8 per cent among women), or about 112,000 past-month cannabis users.61 In 2017, the project Monitor Cannabis Uru-guay implemented another drug use survey, which showed that annual prevalence of cannabis use was 15 per cent among the adult population aged 15–64.62 While past-year cannabis use increased over the period 2014–2017, among both men and women, the main increase was observed among young people (aged 19–24) and, to a lesser extent, among young adults (25–34 years).
59 John Hudak, Geoff Ramsey and John Walsh, “Uruguay’s cannabis law: pioneering a new paradigm”, (Washington D.C., Centre for Effective Public Management, Brookings Institution, March 2018).
60 Uruguay, IRCCA, 4 March 2019.61 Uruguay, Sixth national household survey on drug use
(National Drug Observatory and National Drug Council, 2016).
62 Clara Musto and Gustavo Robaina, “Evolución del consumo de cannabis en Uruguay y mercados regulados”, Monitor Cannabis Uruguay, 2018.
Fig. 28 Cannabis use in Uruguay, by sex and age group, 2014 and 2017
Source: Monitor Cannabis Uruguay, 2018.
05
10152025303540
15–6
4
Mal
e
Fem
ale
15–1
8
19–2
4
25–3
4
35–4
4
45–5
4
55–6
4
Overall Sex Age group
Annu
al p
reva
lenc
e (p
erce
ntag
e)
20142017

36
WO
RLD
DRU
G R
EPO
RT 2
019 CANNABIS AND HALLUCINOGENS
Ta
ble
2
Regu
latio
ns f
or t
he le
galiz
atio
n of
the
non
-med
ical
use
of
cann
abis
in C
anad
a
Fed
eral
law
Alb
erta
Bri
tish
Co
lum
bia
Man
ito
ba
Leg
al p
roce
ssG
over
nmen
t le
galis
latio
n
Titl
eC
anna
bis
Act
G
amin
g, L
iquo
r an
d C
anna
bis
Act
and
G
amin
g, L
iquo
r an
d C
anna
bis
re
gula
tion
Can
nabi
s co
ntro
l and
lice
nsin
g A
ct
(CC
LA)
Can
nabi
s di
strib
utio
n A
ct (
CD
A)
Safe
and
Res
pons
ible
Ret
ailin
g
of C
anna
bis
Act
Dat
e im
ple
men
ted
Oct
ober
17,
201
8
Reg
ula
tory
au
tho
rity
Alb
erta
l Gam
ing
Liqu
or a
nd C
anna
bis
(AG
LC)
Liqu
or a
nd c
anna
bis
regu
latio
n br
anch
Liqu
or,
Gam
ing
and
Can
nabi
s A
utho
rity
of M
anito
ba (
LGC
A)
Man
itoba
Liq
uor
and
Lott
erie
s (M
BLL)
Min
imu
m a
ge
1819
1919
Pers
on
al
po
sses
sio
n
qu
anti
ty
30 g
drie
d or
equ
ival
ent
i.e.,
15
0 g
of f
resh
can
nabi
s 45
0 g
of e
dibl
e pr
oduc
t 21
00 g
of
liqui
d pr
oduc
t 7.
5 g
of c
once
ntra
tes
(s
olid
or
liqui
d)
30 c
anna
bis
plan
t se
eds
30 g
or
equi
vale
nt30
g o
r eq
uiva
lent
30 g
or
equi
vale
nt
Ho
me
cu
ltiv
atio
n
Gro
w f
rom
lice
nsed
see
ds f
our
ca
nnab
is p
lant
s pe
r re
side
nce
for
pers
onsa
l use
C
anna
bis
prod
ucts
suc
h as
foo
d
and
drin
k at
hom
e if
orga
nic
so
lven
ts a
re n
ot u
sed
Yes
Adu
lts c
an g
row
up
to f
our
cann
abis
pl
ants
per
hou
seho
ld,
but
the
plan
ts
mus
t no
t be
vis
ible
fro
m p
ublic
spa
ces.
Hom
e gr
owin
g is
not
per
mitt
ed
Inte
rper
son
al s
har
ing
30 g
or
equi
vale
nt o
f le
gal
cann
aibs
pro
duct
Ret
ail
tran
sact
ion
lim
it30
g o
r eq
uiva
lent
Ave
rag
e re
tail
pri
ce
per
gra
m a
fter
tax
$9.2
4 pe
r gr
amD
ried
cann
abis
flo
wer
s at
$6.
99 t
o $1
6.28
per
gra
m.
$12
per
gram

37
Cannabis - Regulations for legalization 5Fe
der
al l
awA
lber
taB
riti
sh C
olu
mb
iaM
anit
ob
a
Max
imu
m
THC
co
nte
nt
Drie
d ca
nnab
is t
o be
con
sum
ed
by
inha
latio
ns m
ust
not
exce
ed
1 g
in e
ach
disc
rete
uni
t of
ca
nnab
is p
rodu
ct
Prod
ucts
inte
nded
to
be “
adm
inis
tere
d or
ally
, re
ctal
ly,
vagi
nally
or
to
pica
lly”
mus
t no
t ex
ceed
a m
axim
um
yiel
d qu
antit
y of
10
mg
of T
HC
. C
anna
bis
oil m
ust
not
exce
ed a
m
axim
um y
ield
of
30 m
g of
TH
C p
er m
l of
the
oil
Co
mm
erci
al
pro
du
ctio
n
Lice
nsed
pro
duce
rs.
Each
pro
vinc
e ha
s an
Ex
cise
sta
mp
that
nee
ds t
o be
fix
ed o
n th
e ca
nnab
is p
rodu
cts
Co
mm
erci
al
dis
trib
uti
on
Lice
nsed
ret
aile
rs
Priv
ate
reta
il st
ores
, pr
ovin
cial
onl
ine
sale
s
Priv
ate
and
prov
inci
al r
etai
l sto
res,
on
line
sale
s Re
tail
licen
sing
reg
ime
sim
ilar
as
for
liqu
or
Priv
ate
reta
il st
ores
and
onl
ine
sale
s
Res
tric
tio
ns
o
n e
dib
les
Can
nabi
s ed
ible
pro
duct
s an
d
conc
entr
ates
will
be
lega
l for
sal
e on
e ye
ar a
fter
, i.e
., O
ctob
er 2
019
Edic
les
as y
et n
ot a
llow
edEd
ible
s to
be
allo
wed
with
in a
yea
rN
ot a
llow
ed u
ntil
Fede
ral
Gov
ernm
ent
allo
ws
Ad
vert
isin
g
No
prom
otio
n, p
acka
ging
or
la
belli
ng t
hat
coul
d be
con
side
red
appe
alin
g to
you
ng p
eopl
e, a
nd e
nsur
ing
that
impo
rtan
t pr
oduc
t in
form
atio
n is
pr
esen
ted
clea
rly.
No
prom
otio
n, p
acka
ging
or
la
belli
ng t
hat
coul
d be
con
side
red
appe
alin
g to
you
ng p
eopl
e, a
nd e
nsur
-in
g th
at im
port
ant
prod
uct
info
rmat
ion
is p
rese
nted
cle
arly
A
dver
tisin
g al
low
ed in
side
ca
nnab
is s
tore
s
Sam
e as
Fed
eral
Law
Taxa
tio
n
Can
nab
is e
xcis
e d
uty
ra
tes
in p
rovi
nce
s an
d t
erri
tori
es
(Dep
artm
ent
of
Fin
ance
, C
anad
a)
Flow
er $
0.25
/g
Trim
$0.
75/g
Se
ed $
0.25
/see
d Se
edlin
g $0
.25/
seed
ling
Fe
dera
l Ad
Valo
rem
Rat
e 2.
5% o
f
dutib
al a
mou
nt o
f ca
nnab
is p
rodu
ct
whe
n de
liver
ed t
o pu
rcha
ser
Flow
er:
$ 0.
75/g
plu
s 16
.8%
of
bas
e am
ount
Tr
im:
$0.2
25/g
plu
s 17
.8%
of
bas
e am
ount
Se
ed:
$0.7
5/se
ed p
lus
16.8
%
of b
ase
amou
nt
Ad
Valo
rem
Add
ition
al R
ate
7.5%
plu
s 16
.8%
of
dedu
ctib
le a
mou
nt w
hen
deliv
ered
(to
tal a
pplic
able
rat
e 24
.3%
)
Flow
er $
0.75
/g
Trim
$0.
22/g
Se
ed a
nd s
eedl
ing
: $0
.75/
seed
or
seed
-lin
g 7.
5% p
rovi
ncia
l sal
e ta
x in
add
ition
to
Fede
ral t
axes
Who
lesa
le m
ark-
up o
n
non-
med
ical
can
nabi
s, a
$0.
75 p
er
gram
mar
k-up
plu
s 9%
per
cen
t
mar
k-up
app
lied
on t
op o
f th
e $0
.75
per
gram
Res
tric
tio
ns
o
n u
seIn
car
s, a
reas
fre
quen
ted
by
child
ren,
or
toba
cco-
rest
ricte
d ar
eas
In c
ars,
are
ase
freq
uent
ed b
y
child
ren,
or
toba
cco
rest
ricte
d ar
eas
Smok
ing
and
vapi
ng c
anna
bis
is il
lega
l in
pub
lic p
lace
s (in
clud
ing
encl
osed
pu
blic
pla
ces)

38
WO
RLD
DRU
G R
EPO
RT 2
019 CANNABIS AND HALLUCINOGENS
Fed
eral
law
New
Bru
nsw
ick
New
Fo
un
dla
nd
an
d L
abra
do
rN
ort
hw
est
Terr
ito
ries
Leg
al p
roce
ssG
over
nmen
t le
galis
latio
n
Titl
eC
anna
bis
Act
C
anna
bis
Con
trol
Act
C
anna
bis
Man
agem
ent
Cor
pora
tion
Act
New
foun
dlan
d an
d La
brad
or
Can
nabi
s Re
gula
tions
C
ontr
ol a
nd S
ale
of C
anna
bis
Act
Can
nabi
s Le
galiz
atio
n an
d
Regu
latio
n Im
plem
enta
tion
Act
Dat
e im
ple
men
ted
Oct
ober
17,
201
8
Reg
ula
tory
au
tho
rity
Can
nabi
s M
anag
emen
t
Cor
pora
tion
New
foun
dlan
d an
d La
brad
or L
iquo
r C
orpo
ratio
n (N
LC)
Nor
th W
est
Terr
itorie
s Li
quor
& C
anna
-bi
s C
omm
issi
on (
NTL
CC
)
Min
imu
m a
ge
1819
1919
Pers
on
al p
oss
essi
on
q
uan
tity
30 g
drie
d or
equ
ival
ent
i.e.,
15
0 g
of f
resh
can
nabi
s 45
0 g
of e
dibl
e pr
oduc
t 21
00 g
of
liqui
d pr
oduc
t 7.
5 g
of c
once
ntra
tes
(sol
id o
r liq
uid)
30
can
nabi
s pl
ant
seed
s
30 g
or
equi
vale
nt30
g o
r eq
uiva
lent
30 g
or
equi
vale
nt
Ho
me
cult
ivat
ion
Gro
w f
rom
lice
nsed
see
ds f
our
ca
nnab
is p
lant
s pe
r re
side
nce
fo
r pe
rson
sal u
se
Can
nabi
s pr
oduc
ts s
uch
as f
ood
and
drin
k at
hom
e if
orga
nic
so
lven
ts a
re n
ot u
sed
Can
gro
w u
p to
fou
r pl
ants
at
pr
imar
y re
side
nce.
Pla
nts
mus
t be
kep
t in
a s
epar
ate
lock
ed s
pace
O
utdo
or p
lant
s m
ust
be lo
cate
d be
hind
a
lock
ed e
nclo
sure
at
leas
t 1.
52 m
etre
s hi
gh
A p
rivat
e dw
ellin
g ca
n co
ntai
n
up t
o fo
ur c
anna
bis
plan
tsG
row
up
to f
our
cann
abis
pla
nts
per
hous
ehol
d
Inte
rper
son
al s
har
ing
30 g
or
equi
vale
nt o
f le
gal c
anna
ibs
prod
uct
Ret
ail
tran
sact
ion
lim
it
Ave
rag
e re
tail
pri
ce
per
gra
m a
fter
tax
$8.5
0 to
15.
50Ra
nge
$16-
13 p
er g
ram
Gov
ernm
ent
onlin
e st
ore
$13.
13 t
o $1
7.50
per
gra
m

39
Cannabis - Regulations for legalization 5Fe
der
al l
awN
ew B
run
swic
kN
ew F
ou
nd
lan
d
and
Lab
rad
or
No
rth
wes
t Te
rrit
ori
es
Max
imu
m
THC
co
nte
nt
Drie
d ca
nnab
is t
o be
con
sum
ed
by in
hala
tions
mus
t no
t ex
ceed
1 g
in
each
dis
cret
e un
it of
can
nabi
s pr
oduc
t Pr
oduc
ts in
tend
ed t
o be
“
adm
inis
tere
d or
ally
, re
ctal
ly,
vagi
nally
or
topi
cally
” m
ust
not
exce
ed a
max
imum
yi
eld
quan
tity
of 1
0 m
g of
TH
C.
Can
nabi
s oi
l mus
t no
t ex
ceed
a m
axi-
mum
yie
ld o
f 30
mg
of T
HC
per
ml o
f th
e oi
l
Co
mm
erci
al
pro
du
ctio
n
Lice
nsed
pro
duce
rs.
Each
pro
vinc
e ha
s an
Ex
cise
sta
mp
that
nee
ds t
o be
fix
ed o
n th
e ca
nnab
is p
rodu
cts
Co
mm
erci
al
dis
trib
uti
on
Can
nabi
s N
B re
tail
stor
es
and
onlin
e sa
les
Priv
ate
reta
il st
ores
,
prov
inci
al o
nlin
e sa
les
NW
T Li
quor
Sto
res,
pr
ovin
cial
onl
ine
sale
s
Res
tric
tio
ns
o
n e
dib
les
Can
nabi
s ed
ible
pro
duct
s an
d
conc
entr
ates
will
be
lega
l for
sal
e on
e ye
ar a
fter
, i.e
., O
ctob
er 2
019
Ad
vert
isin
g
No
prom
otio
n, p
acka
ging
or
la
belli
ng t
hat
coul
d be
con
side
red
appe
alin
g to
you
ng p
eopl
e, a
nd e
nsur
ing
that
impo
rtan
t pr
oduc
t in
form
atio
n is
pr
esen
ted
clea
rly.
Taxa
tio
n
Can
nab
is e
xcis
e d
uty
ra
tes
in p
rovi
nce
s an
d t
erri
tori
es
(Dep
artm
ent
of
Fin
ance
, C
anad
a)
Flow
er $
0.25
/g
Trim
$0.
75/g
Se
ed $
0.25
/see
d Se
edlin
g $0
.25/
seed
ling
Fe
dera
l Ad
Valo
rem
Rat
e 2.
5% o
f du
tibal
am
ount
of
cann
abis
pro
duct
whe
n de
liv-
ered
to
purc
hase
r
Flow
er:
$0.7
5/g
Trim
:$0.
225/
g Se
ed/s
eedl
ings
$0.
75
7.5%
of
the
dutia
ble
amou
nt w
hen
deliv
ered
to
purs
hase
r
Flow
er:
$0.7
5 /g
m
Trim
:$0.
225
/gm
Se
ed/s
eedl
ings
$0.
75
7.5%
of
the
dutia
ble
amou
nt w
hen
deliv
ered
to
purs
hase
r
Flow
er:
$0.7
5/g
Trim
:$0.
225/
g Se
ed/s
eedl
ings
$0.
75
7.5%
of
the
dutia
ble
amou
nt w
hen
deliv
ered
to
purs
hase
r
Res
tric
tio
ns
on
u
seIll
egal
to
smok
e ev
eryw
here
exc
ept
pr
ivat
e pr
oper
ty o
r re
side
nce
Illeg
al t
o sm
oke
ever
ywhe
re e
xcep
t
priv
ate
prop
erty
or
resi
denc
eIll
egal
to
smok
e ev
eryw
here
exc
ept
pr
ivat
e pr
oper
ty o
r re
side
ndce

40
WO
RLD
DRU
G R
EPO
RT 2
019 CANNABIS AND HALLUCINOGENS
Fed
eral
law
No
va S
coti
aN
un
avu
tO
nta
rio
Leg
al p
roce
ssG
over
nmen
t le
galis
latio
n
Titl
eC
anna
bis
Act
C
anna
bis
Con
trol
Act
Can
nabi
s A
ct
Can
nabi
s St
atut
es A
men
dmen
ts A
ct
Can
nabi
s, S
mok
e-Fr
ee O
ntar
io,
and
Road
Saf
ety
Stat
ute
Law
Am
endm
ent
Act
, 20
17
Can
nabi
s St
atut
e La
w A
men
dmen
t A
ct,
2018
Dat
e im
ple
men
ted
Oct
ober
17,
201
8
Reg
ula
tory
au
tho
rity
Nov
a Sc
otia
Liq
uor
Cor
pora
tion
Nun
avut
Liq
uor
and
Can
nabi
s
Com
mis
sion
Alc
ohol
and
Gam
ing
Com
mis
sion
of
Ont
ario
Min
imu
m a
ge
1819
1919
Pers
on
al p
oss
essi
on
q
uan
tity
30 g
drie
d or
equ
ival
ent
i.e.,
15
0 g
of f
resh
can
nabi
s 45
0 g
of e
dibl
e pr
oduc
t 21
00 g
ram
s of
liqu
id p
rodu
ct
7.5
gram
s of
con
cent
rate
s
(sol
id o
r liq
uid)
30
can
nabi
s pl
ant
seed
s
30 g
or
equi
vale
nt
No
limit
on h
ome
stor
age
for
pers
onal
us
e30
g o
r eq
uiva
lent
30 g
or
equi
vale
nt
Ho
me
cult
ivat
ion
Gro
w f
rom
lice
nsed
see
ds f
our
cann
abis
pl
ants
per
res
iden
ce f
or p
erso
nsal
use
C
anna
bis
prod
ucts
suc
h as
foo
d an
d dr
ink
at h
ome
if or
gani
c so
lven
ts a
re
not
used
Adu
lts c
an g
row
up
to f
our
cann
abis
pl
ants
per
hou
seho
ldTe
rrito
rial g
over
nmen
t ca
n re
gula
te
whe
ther
pla
nts
can
be g
row
n at
hom
eA
dults
can
gro
w u
p to
fou
r pl
ants
per
re
side
nce
Inte
rper
son
al s
har
ing
30 g
or
equi
vale
nt o
f le
gal c
anna
ibs
prod
uct
Ret
ail
tran
sact
ion
lim
it
Ave
rag
e re
tail
pri
ce
per
gra
m a
fter
tax
$6.3
3 to
$10
.99
for
“val
ue c
anna
bis,
” $9
.00
to $
10.9
8 fo
r “c
ore
cann
abis
,”
and
$10.
99 a
nd a
bove
for
“pr
emiu
m
cann
abis
.”
$13.
71 p
er g
ram
$7.9
5 to
$13
.25
per
gram

41
Cannabis - Regulations for legalization 5Fe
der
al l
awN
ova
Sco
tia
Nu
nav
ut
On
tari
o
Max
imu
m
THC
co
nte
nt
Drie
d ca
nnab
is t
o be
con
sum
ed b
y
inha
latio
ns m
ust
not
exce
ed 1
g in
eac
h di
scre
te u
nit
of c
anna
bis
prod
uct
Prod
ucts
inte
nded
to
be “
adm
inis
tere
d or
ally
, re
ctal
ly,
vagi
nally
or
to
pica
lly”
mus
t no
t ex
ceed
a m
axim
um
yiel
d qu
antit
y of
10
mill
igra
ms
of T
HC
. C
anna
bis
oil m
ust
not
exce
ed a
m
axim
um y
ield
of
30 m
g of
TH
C
per
ml o
f th
e oi
l
Co
mm
erci
al
pro
du
ctio
n
Lice
nsed
pro
duce
rs.
Each
pro
vinc
e ha
s an
Ex
cise
sta
mp
that
nee
ds t
o be
fix
ed o
n th
e ca
nnab
is p
rodu
cts
Co
mm
erci
al
dis
trib
uti
on
Des
igna
ted
NSL
C s
tore
s or
onl
ine
Cur
rent
ly t
hrou
gh g
over
nmen
t-op
erat
ed
onlin
e st
ore
or b
y ph
one
Gov
ernm
ent
reta
il st
ores
and
on
line
sale
s
Res
tric
tio
ns
o
n e
dib
les
Can
nabi
s ed
ible
pro
duct
s an
d
conc
entr
ates
will
be
lega
l for
sal
e on
e ye
ar a
fter
, i.e
., O
ctob
er 2
019
Sale
of
edib
les
illeg
al u
nder
Fed
eral
law
Ed
ible
s ca
n be
pro
duce
d at
hom
e fo
r pe
rson
al u
se
Ad
vert
isin
g
No
prom
otio
n, p
acka
ging
or
labe
lling
th
at c
ould
be
cons
ider
ed a
ppea
ling
to
youn
g pe
ople
, an
d en
surin
g th
at
impo
rtan
t pr
oduc
t in
form
atio
n is
pr
esen
ted
clea
rly
Taxa
tio
n
Can
nab
is e
xcis
e d
urt
y ra
tes
in
pro
vin
ces
and
te
rrit
ori
es
(Dep
artm
ent
of
Fin
ance
, C
anad
a)
Flow
er $
0.25
/g
Trim
$0.
75/g
Se
ed $
0.25
/see
d Se
edlin
g $0
.25/
seed
ling
Fe
dera
l Ad
Valo
rem
Rat
e 2.
5% o
f
dutib
al a
mou
nt o
f ca
nnab
is p
rodu
ct
whe
n de
liver
ed t
o pu
rcha
se
Flow
er:
$0.7
5/m
Tr
im:
$0.2
25/m
Se
ed/s
eedl
ings
$0.
75
7.5
% o
f th
e du
tiabl
e am
ount
whe
n de
liver
ed t
o pu
rsha
ser
Flow
er:
$0.7
5/g
plus
19.
3% o
f
base
am
ount
Tr
im:
$0.2
25/g
plu
s 19
.3%
of
ba
se a
mou
nt
Seed
/see
dlin
g: $
0.75
see
d pl
us 1
9.3%
of
bas
e am
ount
7.
5% p
lus
plus
19.
3% o
f th
e du
tiabl
e am
ount
of
a ca
nnab
is p
rodu
ct w
hen
deliv
ered
to
a pu
rcha
ser
(tot
al a
pplic
a-bl
e ra
te o
f 26
.8%
)
Flow
er:
$0.7
5/g
plus
3.9
% o
f
base
am
ount
Tr
im:
$0.2
25/g
plu
s 19
.3%
of
ba
se a
mou
nt
Seed
/see
dlin
g: $
0.75
see
d pl
us 1
9.3%
of
bas
e am
ount
7.
5% p
lus
plus
19.
3 %
of
the
dutia
ble
amou
nt o
f a
cann
abis
pro
duct
whe
n de
liver
ed t
o a
purc
hase
r (t
otal
ap
plic
able
rat
e of
26.
8 %
)
Res
tric
tio
ns
on
use
Illeg
al e
very
whe
re e
xcep
t fo
r ar
eas
whe
re t
obac
co m
ay b
e sm
oked
Illeg
al e
very
whe
re e
xcep
t fo
r ar
eas
whe
re t
obac
co m
ay b
e sm
oked
Illeg
al t
o sm
oke
ever
ywhe
re e
xcep
t
priv
ate
prop
erty

42
WO
RLD
DRU
G R
EPO
RT 2
019 CANNABIS AND HALLUCINOGENS
Fed
eral
law
Prin
ce E
dw
ard
Isl
and
Qu
ebec
Sask
atch
ewan
Yu
kon
Leg
al p
roce
ssG
over
nmen
t le
galis
latio
n
Titl
eC
anna
bis
Act
C
anna
bis
Con
trol
Act
C
anna
bis
Man
agem
ent
Cor
po-
ratio
n A
ct
Can
nabi
s Re
gula
tion
Act
A
ct t
o co
nstit
ute
the
Soci
été
québ
écoi
se d
u ca
nnab
is
The
cann
abis
con
trol
(S
aska
tche
wan
) A
ct
The
cann
abis
con
trol
(S
aska
tche
wan
) re
gula
tions
Can
nabi
s co
ntro
l and
re
gula
tion
act
Dat
e im
ple
men
ted
Oct
ober
17,
201
8
Reg
ula
tory
au
tho
rity
Prov
inci
al c
anna
bis
com
mitt
ee
Can
nabi
s m
anag
emen
t
corp
orat
ion
Soci
été
québ
écoi
se d
u ca
nnab
is
Can
nabi
s A
utho
rity
un
der
the
Sask
atch
ewan
Liq
uor
and
Gam
ing
Aut
horit
y
Yuko
n Li
quor
Cor
port
atio
n
Can
nabi
s Li
cens
ing
Boar
d (2
019)
Min
imu
m a
ge
1819
1819
19
Pers
on
al p
oss
essi
on
q
uan
tity
30 g
drie
d or
equ
ival
ent
i.e.,
15
0 g
of f
resh
can
nabi
s 45
0 g
of e
dibl
e pr
oduc
t 21
00 g
ram
s of
liqu
id p
rodu
ct
7.5
gram
s of
con
cent
rate
s
(sol
id o
r liq
uid)
30
can
nabi
s pl
ant
seed
s
30 g
or
equi
vale
nt30
g in
a p
ublic
pla
ce
150
g in
a p
rivat
e re
side
nce
30 g
of
drie
d ca
nnab
is o
r eq
uiva
lent
30 g
of
drie
d ca
nnab
is o
r eq
uiva
lent
Ho
me
cult
ivat
ion
Gro
w f
rom
lice
nsed
see
ds f
our
cann
abis
pla
nts
per
resi
denc
e fo
r pe
rson
sal u
se
Can
nabi
s pr
oduc
ts s
uch
as f
ood
and
drin
k at
hom
e if
orga
nic
solv
ents
are
not
use
d
A h
ouse
hold
is p
erm
itted
to
have
fou
r ca
nnab
is p
lant
s.Pr
ohib
ited
to c
ultiv
ate
cann
abis
fo
r pe
rson
al u
seLi
mit
of f
our
cann
abis
pla
nts
grow
n pe
r ho
useh
old
Four
pla
nts
per
hous
ehol
d
Inte
rper
son
al s
har
ing
30 g
or
equi
vale
nt o
f le
gal
cann
aibs
pro
duct
Ret
ail
tran
sact
ion
lim
it30
g p
er v
isit
at S
ocié
té
québ
écoi
se d
u ca
nnab
is
30 g
per
pur
chas
e
Ave
rag
e re
tail
pri
ce
per
gra
m a
fter
tax
$5.6
5 pr
e-ro
lled
half
gram
$7
.83
per
gram
$8.5
per
gra
m$1
3 to
$16
per
gra
m$1
0.09
per
gra
m
THC
oil
$68.
28 p
er b
ottle
Max
imu
m
THC
co
nte
nt
Drie
d ca
nnab
is t
o be
con
sum
ed
by in
hala
tions
mus
t no
t ex
ceed
1
g in
eac
h di
scre
te u
nit
of c
an-
nabi
s pr
oduc
t Pr
oduc
ts in
tend
ed t
o be
“ad
min
-is
tere
d or
ally
, re
ctal
ly,
vagi
nally
or
top
ical
ly”
mus
t no
t ex
ceed
a
max
imum
yie
ld q
uant
ity o
f 10
m
illig
ram
s of
TH
C.
Can
nabi
s oi
l mus
t no
t ex
ceed
a
max
imum
yie
ld o
f 30
mg
of T
HC
pe
r m
l of
the
oil

43
Cannabis - Regulations for legalization 5Fe
der
al l
awPr
ince
Ed
war
d I
slan
dQ
ueb
ecSa
skat
chew
anY
uko
n
Co
mm
erci
al
pro
du
ctio
n
Lice
nsed
pro
duce
rs.
Each
pr
ovin
ce h
as a
n Ex
cise
sta
mp
that
nee
ds t
o be
fix
ed o
n th
e ca
nnab
is p
rodu
cts
Lice
nsed
pro
duce
rs
Co
mm
erci
al
dis
trib
uti
on
Four
ded
icat
ed
gove
rnm
ent-
owne
d re
tail
stor
es
and
onlin
e sa
les
Gov
ernm
ent
reta
il st
ores
and
on
line
sale
sPr
ivat
e re
tail
stor
es,
prov
inci
al
onlin
e sa
les
Gov
ernm
ent
reta
il st
ores
and
on
line
sale
s C
anna
bis
Yuko
n re
tail
stor
e
Res
tric
tio
ns
on
ed
ible
s
Can
nabi
s ed
ible
pro
duct
s an
d co
ncen
trat
es w
ill b
e le
gal f
or
sale
one
yea
r af
ter,
i.e.,
Oct
ober
20
19
Ad
vert
isin
g
No
prom
otio
n, p
acka
ging
or
labe
lling
tha
t co
uld
be c
onsi
d-er
ed a
ppea
ling
to y
oung
peo
ple,
an
d en
surin
g th
at im
port
ant
prod
uct
info
rmat
ion
is p
rese
nted
cl
early
Taxa
tio
n
Can
nab
is e
xcis
e d
urt
y ra
tes
in p
rov-
ince
s an
d t
erri
tori
es
(Dep
artm
ent
of
Fin
ance
, C
anad
a)
Flow
er $
0.25
/g
Trim
$0.
75/g
Se
ed $
0.25
/see
d Se
edlin
g $0
.25/
seed
ling
Fe
dera
l Ad
Valo
rem
Rat
e 2.
5%
of d
utib
al a
mou
nt o
f ca
nnab
is
prod
uct
whe
n de
liver
ed t
o
purc
hase
Flow
er:
$0.7
5/g
Trim
:$0.
225/
g Se
ed/s
eedl
ings
$0.
75
7.5
% o
f th
e du
tiabl
e am
ount
w
hen
deliv
ered
to
purs
hase
r
Flow
er:
$0.7
5/g
Trim
:$0.
225/
g Se
ed/s
eedl
ings
$0.
75
7.5
% o
f th
e du
tiabl
e am
ount
w
hen
deliv
ered
to
purs
hase
r
Flow
er:
$0.7
5/g
plus
6.4
5% o
f ba
se a
mou
nt
Trim
: $0
.225
/g p
lus
6.45
% o
f ba
se a
mou
nt
Seed
/see
dlin
g: $
0.75
se
ed p
lus
6.45
% o
f ba
se a
mou
nt
7.5%
plu
s pl
us 6
.45
per
cent
of
the
dut
iabl
e am
ount
of
a ca
nnab
is p
rodu
ct w
hen
de
liver
ed t
o a
purc
hase
r (t
otal
ap
plic
able
rat
e of
13.
95%
)
Flow
er:
$0.7
5/g
Trim
: $0
.225
/g
Seed
/see
dlin
gs $
0.75
7.
5% o
f th
e du
tiabl
e am
ount
w
hen
deliv
ered
to
purs
hase
r
Res
tric
tio
ns
on
use
Illeg
al t
o sm
oke
ever
ywhe
re
exce
pt p
rivat
e pr
oper
ty,
som
e ex
cept
ions
for
cer
tain
pub
lic
spac
es
Illeg
al t
o sm
oke
ever
ywhe
re
exce
pt f
or a
reas
whe
re t
obac
co
may
be
smok
ed,
excl
udin
g un
i-ve
rsity
and
CEG
EP c
ampu
ses
Illeg
al t
o sm
oke
ever
ywhe
re
exce
pt p
rivat
e pr
oper
ty o
r
resi
dend
ce
Illeg
al t
o sm
oke
ever
ywhe
re
exce
pt p
rivat
e pr
oper
ty o
r
resi
dend
ce

44
WO
RLD
DRU
G R
EPO
RT 2
019 CANNABIS AND HALLUCINOGENS
Ta
ble
3
Regu
latio
ns f
or t
he le
galiz
atio
n of
the
non
-med
ical
use
of
cann
abis
in ju
risdi
ctio
ns in
the
Uni
ted
Stat
es
Ala
ska
Cal
ifo
rnia
Co
lora
do
Dis
tric
t o
f C
olu
mb
iaM
ain
e
Leg
al p
roce
ssVo
ter
initi
ativ
e, s
tate
sta
tute
Vote
r in
itiat
ive
Vote
r in
itiat
ive,
am
endm
ent
to
stat
e co
nstit
utio
nVo
ter
initi
ativ
eVo
ter
initi
ativ
e
Titl
eBa
llot
Mea
sure
2Pr
opos
ition
64
Am
endm
ent
64In
itiat
ive
71Q
uest
ion
1
Dat
e p
asse
dN
ov-1
4N
ov-1
6N
ov-1
2N
ov-1
4N
ov-1
6
Dat
e im
ple
-m
ente
d/r
equ
ired
d
ate
of
rule
ad
op
tio
n
Febr
uary
201
5: P
erso
nal
poss
essi
on,
cons
umpt
ion,
cu
ltiva
tion
Oct
ober
201
6: R
etai
l sal
es
Lice
nces
to
be is
sued
by
11
Jan
uary
201
8
Dec
embe
r 20
12:
Pers
onal
po
sses
sion
, co
nsum
ptio
n,
culti
vatio
n
Janu
ary
2014
: Re
tail
sale
s
Febr
uary
201
5: P
erso
nal
poss
essi
on,
cons
umpt
ion,
cu
ltiva
tion
Take
eff
ect
on 7
Jan
uary
201
7;
regu
latio
n fo
r bu
sine
ss t
o be
in
plac
e A
ugus
t 20
17
Reg
ula
tory
au
tho
rity
Alc
ohol
and
Mar
ijuan
a
Con
trol
Off
ice
Bure
au o
f M
ariju
ana
Con
trol
Mar
ijuan
a En
forc
emen
t D
ivis
ion
(Dep
artm
ent
of R
even
ue)
Not
app
licab
le;
cons
ider
ing
se
para
te le
gisl
atio
n to
reg
ulat
e co
mm
erci
al p
rodu
ctio
n an
d sa
le
to a
dults
Dep
artm
ent
of A
gric
ultu
re,
C
onse
rvat
ion
and
Fore
stry
Min
imu
m a
ge
2121
2121
21
Res
iden
cy
req
uir
emen
tN
one
Not
spe
cifie
dN
one
Non
eN
ot s
peci
fied
Pers
on
al
po
sses
sio
n
qu
anti
ty28
.5 g
1 oz
flo
wer
28
.5 g
2 oz
(57
g)
2.5
oz (
70.8
g)
5g
con
cent
rate
8 g
conc
entr
ate
Ho
me
cu
ltiv
atio
n
Six
plan
ts,
thre
e of
whi
ch c
an b
e flo
wer
ing;
not
sub
ject
to
publ
ic
view
s; w
ithin
pro
pert
y w
ith
law
ful p
osse
ssio
n or
with
co
nsen
t of
the
per
son
in la
wfu
l po
sses
sion
Six
plan
ts,
away
fro
m v
iew
Six
plan
ts,
thre
e of
whi
ch
can
be f
low
erin
g
Six
plan
ts p
er p
erso
n;
Twel
ve p
lant
s pe
r ho
useh
old,
si
x of
whi
ch c
an b
e flo
wer
ing
Six
mat
ure
plan
ts,
twel
ve
imm
atur
e pl
ants
, un
limite
d am
ount
of
seed
lings
aw
ay f
rom
vi
ew a
nd t
agge
d w
ith p
erso
nal
iden
tific
atio
n nu
mbe
r. Pr
oper
ty
owne
rs c
an p
rohi
bit
hom
e
culti
vatio
n. C
ultiv
atio
n fo
r
med
ical
pur
pose
s no
t su
bjec
t to
sa
me
rest
rictio
ns
Inte
rper
son
al
shar
ing
28.5
gYe
s28
.5 g
28.5
gm
or
less
Yes
for
hom
e gr
ow.
Not
pe
rmitt
ed f
or r
etai
l mar
ijuan
a
Ret
ail
tran
sact
ion
lim
it28
.5 g
Pres
umab
ly s
ame
limits
for
pe
rson
al p
osse
ssio
nRe
side
nts:
28.
5 g
Non
-res
iden
ts:
7 g
Not
app
licab
le2.
5 oz
. of
mar
ijuan
a
Tw
elve
see
dlin
gs
Ret
ail
pri
cin
g
stru
ctu
reM
arke
tM
arke
t/co
mm
erci
alM
arke
tM
arke
tM
arke
t/co
mm
erci
al
Ave
rag
e re
tail
pri
ce p
er g
ram
af
ter
tax
Med
ium
$20
.00
$21.
20
$14.
60N
ot a
pplic
able
Med
ium
qua
lity
$14.
00
Max
imu
m T
HC
co
nte
nt
Not
set
initi
ally
Not
set
initi
ally
Not
set
initi
ally
Not
set
initi
ally
Not
set
initi
ally
Reg
istr
atio
n
req
uir
emen
tsN
one
Not
spe
cifie
dN
one
Non
eN
ot s
peci
fied

45
Cannabis - Regulations for legalization 5A
lask
aC
alif
orn
iaC
olo
rad
oD
istr
ict
of
Co
lum
bia
Mai
ne
Co
mm
erci
al
pro
du
ctio
nLi
cens
ed c
anna
bis
prod
ucer
sLi
cens
ed c
ultiv
ator
s an
d
man
ufac
ture
rs,
vary
ing
type
sLi
cens
ed c
anna
bis
culti
vatio
n fa
cilit
ies
Non
eLi
cens
ed c
ultiv
ator
s; t
wo
type
s ba
sed
on s
ize
Co
mm
erci
al
dis
trib
uti
on
Lice
nsed
ret
ail c
anna
bis
stor
esLi
mits
on
mar
ket
conc
entr
atio
nLi
cens
ed r
etai
l can
nabi
s st
ores
Non
e
Stat
e au
thor
ity m
ay n
ot li
mit
tota
l nu
mbe
r of
sto
res;
loca
litie
s m
ay
regu
late
num
ber
and
loca
tion
of
esta
blis
hmen
ts
Res
tric
tio
ns
on
ed
ible
s
5 m
g of
TH
C f
or s
ingl
e se
rvin
g,
no m
ore
than
50
mg
of
hom
ogen
ous
THC
allo
wed
per
pa
ckag
e. C
hild
-res
ista
nt
pack
agin
g re
quire
d. S
epar
ate
war
ning
s on
ris
ks,
not
appe
alin
g to
chi
ldre
n
10 m
g TH
C p
er s
ervi
ng.
W
arni
ng a
nd p
oten
cy la
bels
.
List
of
ingr
edie
nts
and
ca
nnab
inoi
d co
nten
t
Max
imum
of
10 m
g of
TH
C in
ea
ch in
divi
dual
ly p
acke
d se
rvin
g;
war
ning
labe
ls "
keep
out
of
reac
h of
chi
ldre
n";
THC
sym
bol
on la
bels
and
not
att
ract
ive
to
child
ren
Cur
rent
ly n
ot a
llow
ed
Serv
ing
size
and
pot
ency
lim
its t
o be
dev
elop
ed in
reg
ulat
ions
. Li
st
of in
gred
ient
s pa
ckin
g an
d la
bels
; pr
oduc
ts a
nd e
dibl
es m
ay n
ot
cont
ain
addi
tives
des
igne
d to
m
ake
prod
uct
mor
e ap
peal
ing
to
child
ren
Ad
vert
isin
g
Logo
or
adve
rtis
emen
t fo
r lic
ense
d m
ariju
ana
may
not
pr
omot
e ex
cess
ive
cons
umpt
ion,
de
pict
ion
appe
alin
g to
a p
erso
n un
der
21 y
ears
.
Rest
rictio
ns o
n ad
vert
isem
ents
in
scho
ol a
reas
, pu
blic
tra
nspo
rt,
and
cont
rain
pre
srib
ed w
arni
ng
Rest
ricte
d to
tho
se o
ver
21.
Rest
rictio
ns o
n fa
lse
ad
vert
isem
ent
or c
laim
s of
unt
rue
heal
th b
enef
its.
Prod
ucts
can
not
appe
al t
o ch
ildre
n
Rest
ricte
d to
med
ia w
ith n
o m
ore
than
30%
of
the
audi
ence
und
er
the
age
of 2
1
Not
app
licab
le,
no
com
mer
cial
mar
ket
Rest
ricte
d to
tho
se o
ver
21
. Re
stric
tions
on
fals
e
adve
rtis
emen
t or
cla
ims
of u
ntru
e he
alth
ben
efits
. Pr
oduc
ts c
anno
t ap
peal
to
child
ren
Taxa
tio
n
$50
exci
se t
ax p
er o
unce
on
sa
les
or t
rans
fers
fro
m c
ultiv
atio
n fa
cilit
y to
ret
ail s
tore
or
prod
uct
man
ufac
ture
r; o
ther
par
ts o
f pl
ant,
e.g
., st
ems
and
leav
es a
re
taxe
d at
$15
per
oun
ce
15%
exc
ise
on r
etai
l, $9
.25
per
dry
wei
ght
ounc
e on
flo
wer
aft
er
harv
est.
$2.
75 p
er d
rug
wei
ght
ounc
es o
n le
aves
15%
exc
ise
tax
on
culti
vatio
n;
10%
ret
ail m
ariju
ana
sale
s ta
x to
be
dec
reas
ed t
o 8%
in J
uly
2017
2
.9%
sta
te s
ales
tax
Up
to 3
.5%
loca
l sal
es t
axes
Not
app
licab
le,
no c
omm
erci
al
mar
ket
10%
exc
ise
on r
etai
l
Can
nab
is c
lub
s
Not
exp
licitl
y al
low
ed o
r
proh
ibite
d
Ea
rlier
ban
on
in-s
tore
con
sum
p-tio
n re
peal
ed in
Nov
embe
r 20
15
Not
spe
cifie
d al
thou
gh t
hey
m
ay e
xist
s in
the
for
m o
f
mic
robu
sine
ss t
hat
allo
w o
n-si
te
cons
umpt
ion
Not
allo
wed
Not
allo
wed
; cu
rren
tly u
nder
in
vest
igat
ion
by c
ity t
ask
forc
e.St
ate-
licen
sed
club
s
Res
tric
tio
ns
o
n u
seC
anna
bis
use
in p
ublic
is
unl
awfu
l
Proh
ibit
cann
abis
use
in a
pub
lic
plac
e un
licen
sed
for
such
use
, in
clud
ing
near
sch
ools
and
oth
er
area
s w
here
chi
ldre
n ar
e pr
esen
t.
Not
per
mitt
ed in
pub
lic p
lace
sN
ot p
erm
itted
in p
ublic
pla
ces
(use
on
priv
ate
prop
erty
)
Not
per
mitt
ed in
pub
lic p
lace
s (a
llow
ed u
se in
priv
ate
prop
erty
or
sm
okin
g in
a s
tate
-lice
nsed
m
ariju
ana
soci
al c
lub)
Med
ical
can
nab
is
1998
: Pa
tient
reg
istr
y, n
o
disp
ensa
ries
regi
stra
tion;
out
-of-
stat
e pa
tient
s re
cogn
ized
for
ap
prov
ed c
ondi
tions
but
not
for
di
spen
sary
pur
chas
es;
poss
essi
on,
hom
e cu
ltiva
tion
1996
and
200
3; P
atie
nt r
egis
try
- vo
lunt
ary
regi
stra
tion;
co
oper
ativ
es a
nd c
olle
ctiv
es;
Stat
e-w
ide
licen
sing
of
di
spen
sarie
s w
ill b
egin
201
8
2000
: Pa
tient
reg
istr
y,
disp
ensa
ries
alre
ady
exis
ted;
out
-of
-sta
te p
atie
nts
not
reco
gniz
ed;
poss
essi
on,
cons
umpt
ion;
201
0:
com
mer
cial
pro
duct
ion
and
sale
s
1998
/201
0: P
atie
nt r
egis
try;
di
spen
sarie
s al
low
ed
1999
: Pa
tient
reg
istr
y or
id
entif
icat
ion
card
; di
spen
sarie
s,
reco
gniz
es p
atie
nts
from
oth
er
stat
es b
ut n
ot f
or d
ispe
nsar
y
purc
hase
s

46
WO
RLD
DRU
G R
EPO
RT 2
019 CANNABIS AND HALLUCINOGENS
Ta
ble
4
Regu
latio
ns f
or t
he le
galiz
atio
n of
the
non
-med
ical
use
of
cann
abis
in ju
risdi
ctio
ns in
the
Uni
ted
Stat
es a
nd U
rugu
ay
Mic
hig
anM
assa
chu
sett
sN
evad
aO
reg
on
Ver
mo
nt
Was
hin
gto
nU
rug
uay
Leg
al p
roce
ssVo
ter
initi
ativ
eVo
ter
initi
ativ
eVo
ter
initi
ativ
eVo
ter
initi
ativ
e,
stat
e st
atut
eLe
gisl
ativ
e pr
oces
sVo
ter
initi
ativ
e,
stat
e st
atut
eG
over
nmen
t in
itiat
ive,
na
tiona
l law
Titl
ePr
opos
al 1
8-1
Que
stio
n 4
Que
stio
n 2
Mea
sure
91
No.
86
Initi
ativ
e 50
2La
w N
o. 1
9.17
2
Dat
e p
asse
d6
Dec
embe
r 20
18N
ov-1
6N
ov-1
6N
ov-1
4N
ov-1
2D
ec-1
3
Dat
e
imp
lem
ente
d/
req
uir
ed d
ate
o
f ru
le
ado
pti
on
Com
mer
cial
lice
nces
ap
plic
atio
n be
gin
by
6 D
ecem
ber,
2019
15 S
epte
mbe
r 20
17.
Lice
nces
issu
ed s
tart
ing
1 O
ctob
er 2
017
Take
s ef
fect
on
1
Janu
ary
2017
and
re
gula
tions
to
in p
lace
by
1 J
anua
ry 2
018
July
201
5: P
erso
nal
poss
essi
on,
cons
ump-
tion,
cul
tivat
ion
O
ctob
er 2
015
up t
o D
ecem
ber
2016
: Re
tail
sale
s th
roug
h m
edic
al
disp
ensa
ries
J
anua
ry 2
017:
ret
ail
sale
s th
roug
h lic
ense
d re
taile
rs
01 J
uly
2018
Dec
embe
r 20
12:
Pe
rson
al p
osse
ssio
n,
cons
umpt
ion
Ju
ly 2
014:
Ret
ail s
ales
Aug
ust
2014
:
Pers
onal
cul
tivat
ion
Oct
ober
201
4:
Gro
wer
clu
bs
Mid
-201
7:
phar
mac
y sa
les
Reg
ula
tory
au
tho
rity
Dep
artm
ent
of
Lice
nsin
g an
d Re
gula
tory
Aff
airs
1) C
anna
bis
Con
trol
C
omm
issi
on,
and
2)
Can
nabi
s A
dvis
ory
Boar
d
Dep
artm
ent
of
Tax
atio
nO
rego
n Li
quor
C
ontr
ol C
omm
issi
on
Liqu
or a
nd C
anna
bis
Boar
d (f
orm
erly
the
Li
quor
Con
trol
Boa
rd)
Inst
itute
for
the
Re
gula
tion
and
Con
trol
of
Can
nabi
s (IR
CC
A)
Min
imu
m a
ge
2121
2121
2121
18
Res
iden
cy
req
uir
emen
tN
ot s
peci
fied
Not
spe
cifie
dN
one
Non
e
Uru
guay
an c
itize
nshi
p or
per
man
ent
U
rugu
ayan
res
iden
cy
requ
ired
Pers
on
al
po
sses
sio
n
qu
anti
ty
2.5
oz (
70.8
g)
on
pers
on a
nd 1
0 oz
(28
3 g)
at h
ome
1 oz
flo
wer
(28
.5 g
)1
oz f
low
erIn
pub
lic:
28.5
g
1
oz o
r 5
g of
ha
shis
h28
.5 g
40 g
per
mon
th
5g c
once
ntra
te3.
5g c
once
ntra
teA
t ho
me:
228
g
Ho
me
cu
ltiv
atio
nU
p to
12
plan
ts p
er
hous
ehol
d
6 pl
ants
, 12
in a
sin
gle
resi
denc
e aw
ay f
rom
vi
ew;
10 o
z. o
f dr
ied
mar
ijuan
a pe
rmitt
ed a
t ho
me
Six
plan
ts,
no m
ore
than
tw
elve
on
prop
erty
in
indo
or o
r in
enc
lose
d w
ith p
erm
issi
on o
f
land
lord
and
mus
t be
2
5 m
iles
away
fro
m
reta
il ca
nnab
is s
tore
Four
pla
nts
in f
low
er2
mat
ure
plan
ts o
r 4
imm
atur
e pl
ants
Not
allo
wed
Six
plan
ts in
flo
wer

47
Cannabis - Regulations for legalization 5
Ta
ble
4
Regu
latio
ns f
or t
he le
galiz
atio
n of
the
non
-med
ical
use
of
cann
abis
in ju
risdi
ctio
ns in
the
Uni
ted
Stat
es a
nd U
rugu
ay
Mic
hig
anM
assa
chu
sett
sN
evad
aO
reg
on
Ver
mo
nt
Was
hin
gto
nU
rug
uay
Inte
rper
son
al
shar
ing
Yes
(2.5
oz
with
a
max
of
15 m
g of
co
ncen
trat
e)Ye
sYe
s28
.5 g
Sam
e as
per
sona
l po
sses
sion
lim
itsN
ot a
llow
edA
llow
ed w
ithin
th
e ho
me
Ret
ail
tr
ansa
ctio
n
limit
Not
spe
cifie
d,
pres
umab
ly s
ame
lim
its a
s fo
r pe
rson
al
poss
essi
on
Not
spe
cifie
d,
pres
umab
ly s
ame
lim
its a
s fo
r pe
rson
al
poss
essi
on
1 oz
drie
d flo
wer
16
oz
edbi
le f
orm
72
oz
cann
abis
in li
quid
fo
rm 1
0 ca
nnab
is s
eeds
4
imm
atur
e ca
nnab
is
plan
ts
28.5
g
40 g
per
mon
th,
10 g
pe
r w
eek
(sal
e th
roug
h ph
arm
acie
s to
re
gist
ered
use
rs)
Ret
ail
pri
cin
g
stru
ctu
reM
arke
t/co
mm
erci
alM
arke
t/co
mm
erci
alM
arke
t/co
mm
erci
alM
arke
tN
o pr
ovis
ion
for
sett
ing
up a
tax
ed-a
nd-r
egu-
late
d re
tail
mar
ketp
lace
Mar
ket
Gov
ernm
ent
pric
e
cont
rol
Ave
rag
e re
tail
pri
ce p
er g
ram
af
ter
tax
Med
ium
qua
lity
$12.
9M
ediu
m q
ualit
y $1
0.05
$17.
26M
ediu
m q
ualit
y $1
1.15
200
peso
s pe
r 5
gram
s (a
pprx
US
$1.4
per
gr
am)
Max
imu
m T
HC
co
nte
nt
Not
set
initi
ally
Not
set
initi
ally
Not
set
initi
ally
Not
set
Not
set
initi
ally
All
prod
ucts
are
re
quire
d to
indi
cate
th
at
CBD
is e
qual
to
or
mor
e th
an 3
per
cen
t an
d TH
C is
equ
al t
o or
le
ss t
han
9%.
Reg
istr
atio
n
req
uir
emen
tsPe
rson
al d
ata
co
llect
ion
not
requ
ired
Pers
onal
dat
a
colle
ctio
n no
t re
quire
dN
one
Non
eYe
s, w
ith IR
CC
A f
or
any
of t
he t
hree
m
odes
of
acce
ss
Co
mm
erci
al
pro
du
ctio
nLi
cens
ed
esta
blis
hmen
tsLi
cens
ed
esta
blis
hmen
tsLi
cens
ed
esta
blis
hmen
tLi
cens
ed c
anna
bis
pr
oduc
ers
Not
cla
rifie
d in
law
Lice
nsed
can
nabi
s pr
o-du
cers
Lice
nsed
mar
ijuan
a
prod
ucer
s
Co
mm
erci
al
dis
trib
uti
on
A m
unic
ipal
ity m
ay
com
plet
ely
proh
ibit
or
limit
the
num
ber
of
esta
blis
hmen
ts
oper
atin
g
Lice
nsed
es
tabl
ishm
ents
;
loca
litie
s ca
n re
gula
te,
limit
or p
rohi
bit
the
oper
atio
n of
bus
ines
ses
Lim
its o
n m
arke
t
conc
entr
atio
n by
po
pula
tion
Lice
nsed
ret
ail
cann
abis
sto
res
Not
cla
rifie
d in
law
Mar
ijuan
a ca
n on
ly b
e so
ld a
nd p
urch
ased
at
stat
e-lic
ense
d re
tail
stor
esLi
cens
ed p
harm
acie
s

48
WO
RLD
DRU
G R
EPO
RT 2
019 CANNABIS AND HALLUCINOGENS
Mic
hig
anM
assa
chu
sett
sN
evad
aO
reg
on
Ver
mo
nt
Was
hin
gto
nU
rug
uay
Res
tric
tio
ns
o
n e
dib
les
Serv
ing
size
and
po
tenc
y lim
its t
o be
de
velo
ped
in
regu
latio
ns.
Li
st o
f in
gred
ient
s
Not
spe
cifie
d
Max
imum
of
10 m
g of
TH
C in
eac
h in
divi
dual
ly
pack
ed s
ervi
ng;
edib
le
prod
ucts
to
unde
rgo
a pr
eapp
rova
l pro
cess
; n
ot a
ppea
ling
to
child
ren
10 m
g of
TH
C in
eac
h in
divi
dual
ly p
acka
ged
serv
ing;
chi
ld-p
roof
pa
ckag
ing;
TH
C
labe
lling
; m
ariju
ana-
infu
sed
prod
ucts
,
pack
ages
and
labe
ls t
o be
app
rove
d by
the
Sta
te
Liqu
or C
ontr
ol B
oard
be
fore
sal
e
Ad
vert
isin
g
Rest
rictio
ns o
n
publ
ic s
igns
rel
ated
to
can
nabi
s
esta
blis
hmen
ts
Rest
rictio
ns o
n
mar
ketin
g to
chi
ldre
n to
be
deve
lope
d in
re
gula
tions
A li
cens
ed m
ariju
ana
esta
blis
hmen
t ca
nnot
en
gage
in a
dver
tisin
g th
at c
onta
ins
any
fa
lse
or m
isle
adin
g
stat
emen
ts,
prom
otes
ov
erco
nsum
ptio
n,
depi
cts
actu
al
cons
umpt
ion,
or
ap
peal
s to
min
ors.
Als
o ap
plie
s 70
/30
rule
fro
m
Col
orad
o
Entr
y si
gn r
equi
red
on
exte
rior
of d
ispe
nsar
ies;
O
rego
n Li
quor
Con
trol
C
omm
issi
on h
as a
utho
r-ity
to
furt
her
regu
late
or
proh
ibit
adve
rtis
ing
Can
nabi
s bu
sine
ss
licen
sees
are
lim
ited
to
two
perm
anen
t si
gns
on
thei
r lic
ense
d pr
emis
es,
and
all o
ther
for
ms
of
outd
oor
ads
on t
he
prem
ises
are
ban
ned.
N
ew r
ules
man
date
d
that
bill
boar
ds a
nd s
igns
ca
n no
long
er c
onta
in
imag
es o
f th
e ca
nnab
is
plan
t or
can
nabi
s
prod
ucts
. C
anno
t co
ntai
n de
pict
ions
of
cart
oon
char
acte
rs o
r an
y
depi
ctio
ns t
hat
may
be
appe
alin
g to
chi
ldre
n
Proh
ibite
d
Taxa
tio
n10
% e
xcis
e ta
x3.
75%
exci
se o
n re
tail
15%
exc
ise
on w
hole
-sa
le s
ale
10%
exc
ise
tax
on
ret
ail s
ale
No
tax
on r
etai
l sal
es
from
Oct
ober
201
5 to
D
ecem
ber
2015
25
% s
ales
tax
aft
er 5
Ja
nuar
y 20
16
1
7%
sale
s ta
x in
201
7 w
ith
optio
ns f
or lo
cal c
om-
mun
ities
to
esta
blis
h lo
cal t
ax u
p to
3%
July
201
4 to
Jun
e 20
14:
25%
at
each
sta
ge (
pro-
duct
ion,
pr
oces
sing
, re
tail)
Ju
ly 2
015:
37%
sal
es t
ax
No
tax,
alth
ough
IR
CC
A c
an im
pose
tax
in
the
fut
ure.

49
Cannabis - Regulations for legalization 5M
ich
igan
Mas
sach
use
tts
Nev
ada
Ore
go
nV
erm
on
tW
ash
ing
ton
Uru
gu
ay
Can
nab
is
clu
bs
Not
allo
wed
, al
thou
gh
they
may
exi
st in
es
tabl
ishm
ents
th
at a
llow
on-
site
- co
nsum
ptio
n
Not
spe
cifie
dN
ot a
llow
edN
ot a
llow
ed
Clu
bs w
ith 1
5-45
m
embe
rs a
llow
ed t
o cu
ltiva
te u
p to
99
plan
ts,
max
imum
480
g
of d
ried
prod
uct
per
mem
ber
per
year
Res
tric
tio
ns
o
n u
se
Not
per
mitt
ed in
p
lace
s pl
ace
or w
here
pr
ohib
ited
by o
wne
r
or d
esig
natt
ed p
ublic
pl
aces
not
acc
essi
ble
to
pers
ons
unde
r
21 y
ears
of
age
Can
not
use
ca
nnab
is in
a p
lace
w
here
sm
okin
g
toba
cco
is p
rohi
bite
d
Can
nabi
s co
nsum
ptio
n is
fo
r pr
ivat
e us
e on
ly.
It is
ill
egal
to
smok
e in
pu
blic
, on
fed
eral
land
or
in a
veh
icle
with
out
riski
ng a
fin
e.
Smok
ing
mar
ijuan
a in
pu
blic
is il
lega
l,
Use
is li
mite
d to
indi
-vi
dual
dw
ellin
gs.
Pro-
hibi
ted
in s
tree
t, a
lley,
pa
rk o
r si
dew
alk
in
addi
tion
to u
sual
sm
oke
free
pla
ces
It is
ille
gal t
o co
nsum
e m
ariju
ana
in v
iew
of
th
e pu
blic
Med
ical
ca
nn
abis
2008
: pa
tient
reg
istr
y,
disp
ensa
ries
can
be
esta
blis
hed
with
lo
cal o
rdin
ance
s;
disp
ensa
tion
for
sp
ecifi
c co
nditi
ons,
re
cogn
ize
out
of s
tate
pa
tinet
s on
ly f
or
lega
l pro
tect
ion
of
poss
essi
on b
ut n
ot f
or
disp
ensa
ry p
urch
ases
2012
/201
3; p
atie
nt
regi
stry
or
iden
tific
atio
n ca
rds;
dis
pens
arie
s,
out-
of-s
tate
pat
ient
s no
t re
cogn
ized
2000
: Pa
tient
reg
istr
y
or id
entif
icat
ion
card
,
No
disp
ensa
ries;
re
cogn
ize
out
of s
tate
pa
tient
s if
othe
r st
ate'
s pr
ogra
mm
es a
re
subs
tant
ially
sim
ilar;
pa
tient
s m
ust
fill o
ut
Nev
ada
pape
r w
ork
1998
: Pa
tient
reg
istr
y,
disp
ensa
ries
alre
ady
exis
ted
but
not
clea
rly
auth
oriz
ed b
y la
w o
r re
gula
ted;
pos
sess
ion,
ho
me
culti
vatio
n
1999
/201
0/20
11;
no
reg
istr
atio
n or
id
entif
icat
ion
card
; di
spen
sarie
s ap
prov
ed
as o
f N
ovem
ber
2012
,
first
sto
res
open
ed in
Ju
ly 2
014:
19
99 p
osse
ssio
n
2012
: H
ome
culti
vatio
n
2014
: Pa
ssed
,
but
not
yet
effe
ctiv
e


51
Hallucinogens 5
mushroom Psilocybe mexicana, from which it is extracted, is not. Nevertheless, under the national legislation of many countries, both the psychoactive substance and the plant material from which the substances are extracted are controlled.
Many NPS with hallucinogenic effects are reported to UNODC and remain in circulation in different markets. As is the case with all NPS, many sub-stances with a hallucinogenic, dissociative or anaesthetic effect are transient and thus may appear and disappear quickly from the market. Among them, substances belonging to the NBOMe series, which are either sold or referred to as LSD, “syn-thetic LSD” or “ecstasy” have been reported by many countries, in particular, in South America.65
On the basis of their mechanism of action in the human central nervous system, hallucinogens in general can be divided into two main groups: classic hallucinogens and dissociative or anaesthetic
65 World Drug Report 2017.
IntroductionHallucinogens are a diverse group of naturally occur-ring and synthetic drugs that induce distorted states of consciousness, perception, thinking and feeling, accompanied by different degrees of auditory or visual hallucinations.63 The status of control for dif-ferent hallucinogens varies: most of the common hallucinogens are controlled under the Convention on Psychotropic Substances of 1971, although some synthetic hallucinogens are not currently under international control and are labelled as NPS. Ket-amine is an example of non-controlled substance that is included in the WHO list of essential med-icines.64 For the hallucinogens that are under international control, the 1971 Convention does not cover the plants or plant material from which these substances can be extracted. As an example, psilocybin is under international control but the
63 Terminology and Information on Drugs, 3rd ed. (United Nations publication, E.16.XI.8).
64 Although ketamine is not a new substance, in some instances it is included under the category of NPS in order to differentiate it from controlled substances.
Quantity of hallucinogens seized by region2017LSD (24 kg)
NorthAmericaEurope
Africa
Oceania
Asia
other hallucinogens(3.5 tons)
NorthAmericaEurope
Other
ketamine(12 tons)
Asia
Americas
Africa
Europe
Oceania
HALLUCINOGENS

52
WO
RLD
DRU
G R
EPO
RT 2
019 CANNABIS AND HALLUCINOGENS
with serotonin receptors in the body. The effects of mescaline can last up to 10–12 hours. Psilocybin is another naturally occurring hallucinogen found in numerous species of mushroom that are often referred to as “magic mushrooms”; the duration of action of psilocybin is typically 4–6 hours.68 Salvia divinorum is another plant-based hallucinogen with the principal psychoactive substance salvinorin A. The substance may produce out-of-body experiences and other feelings resembling, but not necessarily identical to, those produced by other hallucinogens.69
LSD is a semi-synthetic drug that is derived from lysergic acid – an alkaloid found in a fungus. LSD is one of the most potent hallucinogenic substances scheduled under the drug conventions. As with other hallucinogens, the effects of LSD vary and depend
68 Ibid.69 Meyer and Quenzer, Psychopharmacology: Drugs, the Brain,
and Behaviour.
hallucinogens.66 Classic hallucinogens fall into sev-eral chemically related groups, such as LSD, mescaline, psilocybin, bufotenine, DMT and 5-MeO-DMT (5-methoxy-dimethyltrptamine) and salvinorin. Classic hallucinogens, such as LSD, psi-locybin or DMT, are also referred to as “psychedelics”. By acting as serotonin receptor agonists, those sub-stances ultimately produce synaesthesia and altered perceptions of reality. Synaesthesia is an extraordi-nary condition in which senses that are usually experienced separately are combined, so that a person hearing a sound may see a colour as a result (a phenomenon referred to as “hearing colours”).67
Mescaline is a hallucinogen found in several species of cactus, such as the peyote. The mechanism of action of mescaline is similar to other hallucinogens and its effects are mediated through its interaction
66 Ibid.67 Terminology and Information on Drugs.
Table 5 International control status of some common hallucinogens
Source: 1971 Convention on Psychotropic Substances.
Controlled hallucinogens Schedule of the Convention on Psychotropic Substances of 1971
PCP II
LSD I
Psilocybin I
Mescaline I
TryptaminesDiethyltryptamine (DET)Dimethyltryptamine (DMT)Etryptamine
I
Mescaline I
25B-NBOMe 25C-NBOMe 25I-NBOMe
II
4-Bromo-2,5-dimethoxyphenethylamine (2C-B) II
Brolamfetamine (DOB) I
2,5-Dimethoxy-4-methylamphetamine (STP/DOM) I
3,4,5-Trimethoxyamphetamine (TMA) I
Non-controlled hallucinogens
Ketamine WHO list of essential medicines
Plants, such as Salvia divinorum, containing Salvinorin A
Peyote cactus (mescaline)
Numerous species of mushrooms from the genera Conocybe, Copelandi, Panaeoulus, Psilocybe and Strophia, which are also commonly called “magic mushrooms” and produce the main ingredient psilocybin and related compounds
53
Hallucinogens 5PCP and some of its analogues, including eticycli-dine (PCE), rolicyclidine (PHP, PCPY) and tenocyclidine (TCP), are controlled substances under the 1971 Convention, but derivatives such as 3-MeO-PCE and 4-MeO-PCP are not under international control.76 Since 2010, a number of phencyclidine-type substances have also appeared and been reported, in Europe in particular; of them, 4-MeO-PCP is the most common PCP-type sub-stance reported.
The other main substance in this group is ketamine,77 which is widely used in human and veterinary medicine. Listed on the WHO List of Essential Medicines, ketamine is safer to administer than other types of anaesthetic agents, as well as for pain relief, as it does not depress breathing or lower blood pressure and does not require expensive patient-monitoring equipment.78 Ketamine is therefore the main anaesthetic used in war zones and countries with poor resources, and is also widely used as a general sedative in veterinary medicine. Ketamine is marketed commercially as an injectable liquid. Supply of ketamine for non-medical use may originate in clandestine laboratories or be diverted from licit channels.79, 80 Street sellers evaporate the liquid to yield a powder that is either snorted or compressed into a pill and sold under names such as “K”, “special K” and “cat Valium”.81 In countries such as Indonesia and Thailand, ketamine may also be sold to unwitting users as “ecstasy” or methamphetamine tablets.82 Among the effects of its long-term use reported in the literature are dependence, lower urinary tract dysfunction, such as ulcerative cystitis, and increased sexual impulses or violent behaviour.
76 UNODC, Early warning advisory on new psychoactive substances, “Phencyclidine-type substances” Available at www.unodc.org.
77 EMCDDA and European Union Agency for Law Enforce-ment Cooperation (Europol), “EMCDDA–Europol 2010 annual report on the implementation of Council Decision 2005/387/JHA” (Lisbon, 2011), annex 2.
78 WHO, “Fact file on ketamine” (March 2016). 79 Ibid.80 World Drug Report 2017, Booklet 4: Market Analysis of
Synthetic Drugs.81 WHO, “Fact file on ketamine”.82 World Drug Report 2017, Booklet 4: Market Analysis of
Synthetic Drugs.
on the mental state of the user and the setting. For some individuals, the same dose may produce good and bad experiences (“trips”), depending on the cir-cumstances of use. Long-term effects of LSD use can include frightening flashbacks, also called Hal-lucinogen Persisting Perception Disorder, ongoing visual disturbances, disorganized thinking, paranoia and mood swings.70
Tryptamines (e.g., DMT) are a group of substances that are related to LSD and psilocybin in their struc-ture and action. In addition, several tryptamines also occur naturally in a variety of plants, fungi and animals. Some tryptamines can also be manufactured through chemical synthesis, and many of the DMT analogues, such as alpha-methyltryptamine (AMT) and 5-methoxy-diisopropyltryptamine, have become popular in recent times. Currently, no tryptamines are approved for medical use. When DMT is smoked or snorted it can produce a brief – lasting up to 30 minutes – but intense hallucinatory experience.71, 72
The NBOMe series are another group of synthetic hallucinogens that are derivatives of the “2C series” of substances and are often sold as LSD. These sub-stances vary in potency, pharmacological effect and toxicity; errors in dosage may therefore have fatal consequence. As with LSD, NBOMe substances are commonly sold on blotter paper.73
Dissociative anaesthetics are a group of substances with hallucinogenic and stimulant properties; they inhibit the reuptake of dopamine, norepinephrine and serotonin, thus intensifying the effect of those three neurotransmitters, and modulate effects at the N-methyl-D-aspartate (NMDA) receptor in the brain and produce feelings of detachment and dis-sociation from the self and the environment.74 The most prominent example of this group on illicit drug markets is PCP, which was introduced in the 1950s as an anaesthetic but, owing to its adverse effects, its clinical use was terminated in 1967.75
70 United States, National Institute on Drug Abuse, “What are hallucinogens?” DrugFacts, January 2016.
71 Terminology and Information on Drugs.72 Meyer and Quenzer, Psychopharmacology: Drugs, the Brain,
and Behaviour.73 Terminology and Information on Drugs.74 Ibid.75 Meyer and Quenzer, Psychopharmacology: Drugs, the Brain,
and Behaviour.

54
WO
RLD
DRU
G R
EPO
RT 2
019 CANNABIS AND HALLUCINOGENS
for 18 per cent. In 2017, five new hallucinogens and two dissociative-anaesthetics were reported.
Supply of hallucinogensSupply of hallucinogens has been on the increase for the past two decades
Overall quantities of substances with hallucinogenic properties seized have shown an upward trend over the past two decades. Ketamine has been dominat-ing seizures of substances with hallucinogenic properties (expressed in kilogram equivalents) for the last 15 years and accounted for 87 per cent of the quantity of such substances seized in the last five years. This is potentially misleading, however, as a typical dose of ketamine is far larger (roughly 0.1 g)87 than a typical dose of LSD (about 0.00005 g), for example.88 Tentative calculations of the amounts seized expressed in typical doses suggest that, despite its dominance in terms of weight, ketamine accounted for just 24 per cent of all substances with hallucinogenic properties seized, expressed in doses, over the period 2013–2017, while LSD accounted for two thirds and other hallucinogens accounted for 10 per cent of the total. Ketamine dominated seizures of substances with hallucinogenic proper-ties, expressed in doses, over the period 2006–2010,
87 Depending on the study, individual doses of ketamine vary between 10 to over 250 mg. See the methodological annex to the present publication (available in the online version) for more details.
88 This conversion ratio has been used by UNODC for the last 20 years. It dates back to an internal review of such conver-sion ratios used by law enforcement agencies around the globe.
Classic hallucinogens such as psilocybin-containing mushrooms were used for centuries by the Aztecs, Maya, Mazatec and other tribes in Mexico and coun-tries in Central America, who developed religious rituals around their consumption.83 In the twentieth century, the use of hallucinogens was associated with the “psychedelic culture” among young people in the 1960s and 1970s.84 In later decades, the increased popularity of other substances resulted in a decline in the use of hallucinogens.
In recent times, people report using hallucinogens more for social or recreational purposes, including to have fun, help them deal with stress or enable them to enter into what they perceive as a more enlightened sense of thinking or being.85 Currently, among the countries reporting data on the use of hallucinogens, most report the use of LSD and non-medical use of ketamine – the latter being reported more in the context of club drugs and drug use in recreational settings.86
Since the monitoring of NPS through the UNODC early warning advisory began in 2009, an increasing number of NPS are being classified as hallucinogens and dissociative-anaesthetics. In 2017, out of the 492 NPS reported, hallucinogen NPS accounted
83 United States, National Institute on Drug Abuse, “Hallucinogens and dissociative drugs”, revised, NIDA Research Report Series, NIH Publication No. 15-4209 (Washington D.C., 2015).
84 Meyer and Quenzer, Psychopharmacology: Drugs, the Brain, and Behaviour.
85 “Hallucinogens and dissociative drugs”.86 Jih-Heng Li and others, “To use or not to use: an update on
licit and illicit ketamine use”, Substance Abuse and Rehabili-tation, vol. 2, No. 1 (March 2011), pp. 11–20.
Table 6 NPS with hallucinogenic, dissociative or anaesthetic effects reported for the first time in 2017
Source: UNODC early warning advisory.
Substance Effect groupEticyclidone Dissociative-anaesthetic
3-Hydroxyeticyclidine Dissociative-anaesthetic
1-Methyl-LSD Hallucinogen
25H-NBOH Hallucinogen
4-Hydroxy-N-methyl-N-cyclopropyltryptamine Hallucinogen
5-Methoxy-N,N-tetramethylenetryptamine Hallucinogen
6-Methoxy-N,N-diisopropyltryptamine Hallucinogen

55
Supply of hallucinogens 5
but LSD dominated such seizures over the period 1998–2005 and over the period 2011–2017. When considering the period 1998–2017 as a whole, LSD accounted for 95 per cent of the total amounts of substances with hallucinogenic properties seized expressed in doses, ketamine for 4 per cent and all other hallucinogens for 1 per cent.
Supply of hallucinogens other than ketamine also on the increase
The quantities of substances with hallucinogenic properties (other than ketamine) seized globally have been fluctuating over time, but have shown an upward trend in recent years, in line with reported qualitative information on increasing use of such substances in recent years.
Overall, 94 countries reported seizures of halluci-nogens over the period 1998–2017 (but not every year). Although significant, this is still smaller than the number of countries that reported seizures of cannabis (201), cocaine (186), opioids (183) or ATS (162), indicating that trafficking in hallucinogens is more clustered compared with trafficking in other drug types. Seizures suggest that trafficking in hal-lucinogens (other than ketamine) has been concentrated in the Americas (most notably the United States), where 88 per cent of the total amount (expressed in kilogram equivalents) was seized over the period 2015–2017, and also in Europe (where 10 per cent was seized).
The hallucinogenic substance (other than ketamine) most seized at the global level in terms of weight
Fig. 29 Global quantities of substances with hallucinogenic properties seized, expressed in kilogram equivalents, 1998–2017
Source: UNODC, responses to the annual report questionnaire.
Fig. 30 Trend in global quantities of substances with hallucinogenic properties seized, expressed in doses, 1998–2017
Source: UNODC, responses to the annual report questionnaire.
Distribution of quantities seized in doses
0
5,000
10,000
15,000
20,000
25,000
30,000
1998
1999
2000
2001
2002
2003
2004
2005
2006
2007
2008
2009
2010
2011
2012
2013
2014
2015
2016
2017
Kilo
gram
equ
ival
ents
HallucinogensKetamine
Trend
10
100
1,000
10,000
100,000
1,000,000
1998
1999
2000
2001
2002
2003
2004
2005
2006
2007
2008
2009
2010
2011
2012
2013
2014
2015
2016
2017
Inde
x: 1
998=
100
Index (1998=100) Trend
Seizures in doses (logarithmic scale)
0
20
40
60
80
100
1998
1999
2000
2001
2002
2003
2004
2005
2006
2007
2008
2009
2010
2011
2012
2013
2014
2015
2016
2017
Perc
enta
ge
LSD Other hallucinogens Ketamine

56
WO
RLD
DRU
G R
EPO
RT 2
019 CANNABIS AND HALLUCINOGENS
In terms of average doses, the total amount of hal-lucinogens seized would still have been dominated by LSD: it accounted for more than 99 per cent of all hallucinogens (excluding ketamine) seized over the period 1998–2017. Although the “typical dose” to be applied to each hallucinogenic substance is the subject of debate, as doses vary among individual users, as do the typical doses found in the literature, there can be no doubt that seizures of hallucinogens, when converted into doses, continue to be domi-nated by LSD.
The quantities of LSD seized, however, have been extremely erratic, with peaks typically reflecting the dismantling of LSD production laboratories.
In terms of trafficking, data reported by Member States suggest that the most frequently mentioned countries of origin, departure or transit of LSD over the period 2013–2017 were: for the Americas, the United States, followed by Argentina and China; for Europe, the Netherlands, followed by the United Kingdom, Belgium, Spain and Germany; for Asia, India, followed by the Netherlands, the United Kingdom and Canada; for Oceania, the Nether-lands, followed by Canada and the United Kingdom; and for Africa, South Africa.
over the period 2011–2017 was phencyclidine (PCP), also known by its street name “angel dust”89 (accounting for 44 per cent of the total quantity of hallucinogens seized), followed by dimethyl-tryptamine (DMT), also known in the 1971 Convention as 3-[2-(dimethylamino)ethyl]indole (20 per cent), LSD (20 per cent), psilocybin (8 per cent), mescaline, also known as 3,4,5-trimethoxy-phenethylamine (0.2 per cent), and the three NBOMe compounds (0.03 per cent).
However, seizure patterns have been changing in recent years. Only available since 2011, a detailed breakdown of the hallucinogens (other than keta-mine) seized indicates that LSD and, later, PCP were the hallucinogenic substances mostly seized in the early 2010s, and that DMT started to dominate global seizures after that. The large share of PCP was exclusively the result of large amounts of the substance seized in the Americas (notably in North America). DMT, by contrast, was not only the most commonly seized hallucinogenic substance in the Americas, in terms of weight, in 2016, but also in Europe and in Oceania in the same year. It was the most commonly seized hallucinogenic substance (again in terms of weight) in the Americas, Europe and in Asia in 2017.
89 “Hallucinogens and dissociative drugs”.
Fig. 31 Average annual quantities of hallucinogens (other than ketamine) seized, by region, in kilogram equivalents, 1980–2017
Source: UNODC, responses to the annual report questionnaire.
-
500
1,000
1,500
2,000
2,500
3,00019
80-
1984
1985
-19
8919
90-
1994
1995
-19
9920
00-
2004
2005
-20
0920
10-
2014
2015
-20
17
Aver
age
annu
al se
izure
s (k
g eq
uivl
aent
s)
Americas Europe OceaniaAsia Africa
-
500
1,000
1,500
2,000
2,500
3,00019
80-
1984
1985
-19
8919
90-
1994
1995
-19
9920
00-
2004
2005
-20
0920
10-
2014
2015
-20
17
Kilo
gram
equ
ivla
ents
Americas Europe OceaniaAsia Africa
Fig. 32 Global quantities of hallucinogens (other than ketamine) seized, by substance, in kilogram equivalents, 2011–2017
Source: UNODC, responses to the annual report questionnaire.
0
2,000
4,000
6,000
2011
2012
2013
2014
2015
2016
2017
Kilo
gram
equ
ival
ents
Non-specific and otherNBOMesMescalinePsilocybinLSDDMTPCP

57
Supply of hallucinogens 5Fig. 33 Global quantities of LSD seized,
in kilogram equivalents, 1980–2017
Source: UNODC, responses to the annual report questionnaire.
Fig. 34 Global quantities of ketamine seized, by region, 2001–2017
Source: UNODC, responses to the annual report questionnaire.
The most frequently mentioned point of origin, departure or transit for ketamine at the global level over the period 2013–2017 was India, followed by China, Malaysia, Taiwan Province of China and Hong Kong, China. Most shipments of ketamine originating in Asia remain in the region.
In Europe, most ketamine seems to transit or origi-nate in India and Belgium, followed by the Netherlands and Czechia; in the Americas, the United States, followed by China and Hong Kong, China; and in Oceania, the United Kingdom, India and Hong Kong, China.
Even though the non-medical use of ketamine con-tinues to be of concern primarily in countries and territories in Asia, the total number of countries reporting ketamine seizures to UNODC rose from just 2 in 2001 to 17 in 2005, before more than doubling, to 36, in 2017, indicating that ketamine trafficking is no longer exclusively a phenomenon found in Asia, even though ketamine markets out-side the region are still quite small. Overall, 47 countries and territories reported ketamine seizures to UNODC over the period 2001–2017, of which 21 are in Europe, 16 are in Asia (mostly East and South-East Asia and, to a lesser extent, South Asia), 6 in the Americas, 2 in Africa (East and North-Africa) and 2 in Oceania.
A substance of concern mainly in East and South-East Asia, ketamine is spreading to other regions
Although ketamine has important medical uses, its use as a recreational drug may also explain the large amounts of it seized at the global level, which easily exceed, in terms of quantity, the amount of hallu-cinogens under international control seized globally. The main ketamine markets continue to be in Asia but, based on seizures and qualitative information reported by Member States, ketamine trafficking appears to be spreading to other regions.
The quantities of ketamine seized showed a marked upward trend until 2015, when they peaked at 23 tons, before falling to 12 tons in 2017.
In contrast to hallucinogens in general, and to PCP (another dissociative anaesthetic that is mainly encountered in the Americas) in particular, ketamine is most widespread in Asia. Over the period 2013–2017, 89 per cent of all ketamine seized worldwide was seized by authorities in Asia. Most of the keta-mine seized was reported (in descending order of the amount seized) by China, followed by Taiwan Province of China, Hong Kong, China, Malaysia, Myanmar, Thailand, the United Kingdom, India and the Netherlands. The amount of ketamine reported seized outside Asia, while still small, tripled over the period 2015–2017, the increase being most notable in Africa, the Americas and Oceania.
1.60.9
44
357
0.1
1.0
10.0
100.0
1,000.0
10,000.019
9819
9920
0020
0120
0220
0320
0420
0520
0620
0720
0820
0920
1020
1120
1220
1320
1420
1520
1620
17Av
erag
e 19
80-8
9Av
erag
e 19
90-9
9Av
erag
e 20
00-0
9Av
erag
e 20
10-1
7
Amou
nts s
eize
d (k
ilogr
am e
quiv
alen
ts)
(logr
amith
mic
scal
e)
1.60.9
44
357
0.1
1.0
10.0
100.0
1,000.0
10,000.0
1998
1999
2000
2001
2002
2003
2004
2005
2006
2007
2008
2009
2010
2011
2012
2013
2014
2015
2016
2017
Aver
age
1980
-89
Aver
age
1990
-99
Aver
age
2000
-09
Aver
age
2010
-17
Kilo
gram
equ
ival
ents
(lo
gram
ithm
ic sc
ale)
0
5,000
10,000
15,000
20,000
2001
2002
2003
2004
2005
2006
2007
2008
2009
2010
2011
2012
2013
2014
2015
2016
2017
Kilo
gram
equ
ival
ents
Asia Americas EuropeAfrica Oceania
0
5,000
10,000
15,000
20,000
2001
2002
2003
2004
2005
2006
2007
2008
2009
2010
2011
2012
2013
2014
2015
2016
2017
Kilo
gram
equ
ival
ents
Asia Americas EuropeAfrica Oceania

58
WO
RLD
DRU
G R
EPO
RT 2
019 CANNABIS AND HALLUCINOGENS
where quantitative measures are available, “magic mushrooms” are the main hallucinogens reported, with a low prevalence (0.01 per cent) in comparison with the use of other drugs. Ketamine use in South-East Asia is also quite common, with eight countries and territories reporting the use of ketamine in recent years. Qualitative information on trends in the use of ketamine shows that there has been an increase in the use of ketamine in Cambodia, Indo-nesia and Thailand, while use of the drug has declined in China, including in Hong Kong, China, and Macao, China, and Myanmar. In South-East Asia, the use of ketamine has been primarily associ-ated with recreational and club settings, within a polydrug use scenario (with “ecstasy” and cannabis) and, in many countries, has even surpassed the use of other club drugs.92
In Australia, the prevalence of the use of hallucino-gens and dissociatives remains lower than that of other drugs, with the annual reported prevalence of LSD being 1 per cent and the annual reported preva-lence of ketamine being 0.4 per cent in 2016. Over the years, the use of LSD has declined in Australia, in particular, over the period 2013–2016, while the non-medical use of ketamine increased over the same period, following a period of relative stability.93
92 Li and others, “To use or not to use”.93 Australian Institute of Health and Welfare, National Drug
Demand for hallucinogens Use of hallucinogens appears to be on the increase again
While there are no global estimates on the use of hallucinogens, many countries report their use to UNODC; however, in many instances, they do so without specifying the type of hallucinogen. The ranking of drugs by Member States suggests that the use of hallucinogens at the global level (with a ranking of, on average, 5.3 over the 2013–2017 period) is less of a concern than the use of cannabis, ATS, sedatives and tranquillizers, opioids and cocaine.90
For every year during the period 2001–2017 for which qualitative information on trends in the use of different substances is available, the majority of countries reported no significant change in the use of hallucinogens. Nonetheless, there are signs of a perceived increase in the overall use of hallucinogens in recent years, particularly over the period 2012–2016, with the number of countries reporting increases in the use of hallucinogens greater than the number of countries reporting decreases. How-ever, recent or current use of hallucinogens in general is quite low in most countries and there is limited recent scientific literature on the epidemiology and patterns of such use. The use of hallucinogens and dissociative or anaesthetic substances is quite varied; for example, the use of LSD and substances with similar effects is more common in South and North America, Western and Central Europe and Oceania (Australia) than in other regions. The use of LSD, although not at the same level as other drugs, seems to be on the increase in both North and South America. The use of ketamine, on the other hand, is mainly reported in South-East Asia, with mixed trends in its use being reported in the subregion.
In 2017, a number of countries in Asia reported the use of LSD,91 although prevalence data are not avail-able for most of them. In the case of Indonesia,
90 This is based on data on drug rankings provided to UNODC by 123 countries, including 78 countries providing such information on hallucinogens, over the period 2013–2017.
91 Those countries include Iran (Islamic Republic of ), Japan, Kazakhstan, Lebanon, Oman, the Republic of Korea, Singa-pore, Sri Lanka and the United Arab Emirates.
Fig. 35 Qualitative information on trends in the use of hallucinogens, 2000–2017
Source: UNODC, responses to the annual report questionnaire.
60
80
100
120
140
2000
2001
2002
2003
2004
2005
2006
2007
2008
2009
2010
2011
2012
2013
2014
2015
2016
2017
Inde
x: 2
000
= 10
0
Countries reporting increasesCountries reporting stable trendsCountries reporting decreasesTrend index

59
Demand for hallucinogens 5
In the countries in South America that report it, the annual prevalence of use of hallucinogens ranges from 0.1 per cent in the Bolivarian Republic of Venezuela to about 0.6 per cent of the population aged 15–64 in Argentina and Chile. In Argentina, according to a 2017 survey, 0.6 per cent of the popu-lation aged 12–65 had used hallucinogens (including LSD, peyote, PCP and mescaline)94 in the past year. The use of hallucinogens is reported to be higher among men (1.0 per cent) than women (0.2 per cent). Past-year use was highest among those aged 18–24 (1.9 per cent) and 25–34 (1.0 per cent). Chile is one country in the subregion that reports a considerable increase in past-year use of LSD. The past-year prevalence of LSD increased sixfold, from
Strategy Household Survey 2016: Detailed Findings, Drug Statistics Series No. 31 (Canberra, September 2017).
94 Argentina, Secretariat for Comprehensive Drug Policies (Sedronar), Estudio Nacional en Población de 12 a 65 años, sobre Consumo de Sustancias Psicoactivas: Argentina 2017–Informe de Resultados No.1: Magnitud del Consumo de Sustancias a Nivel Nacional (Buenos Aires, 2017).
0.1 per cent of the population aged 12–64 in 2002 to 0.6 per cent of the same population group in 2016,95 a trend also seen, for example, in a survey of university students (aged 18–25 years) in the Andean countries. The past-year prevalence of LSD among the four countries ranged from 0.2 per cent in Peru to 1 per cent in Ecuador and 4.2 per cent in Colombia. Overall, past-year use of LSD increased considerably among university students in those four countries, from an estimated 0.2 per cent in 2009 to 1.6 per cent in 2016.96 The increase observed in LSD use among university students was driven primarily by an increase in LSD use among students in Colombia, where it increased fourfold
95 Chile, Ministry of the Interior and Public Security, National Drug and Alcohol Prevention and Rehabilitation Service (SENDA), Décimo Segundo Estudio Nacional De Drogas en Población General de Chile, 2016 (Santiago, Chilean Drug Observatory, 2017).
96 UNODC, III Estudio Epidemiológico Andino sobre Consumo de Drogas en la Población Universitaria: Informe Regional 2016 (Lima, 2017).
Fig. 36 Use of hallucinogens in Central and South America
Source: UNODC, responses to the annual report questionnaire.
0.0
Hallu
cino
gens
Hallu
cino
gens
Keta
min
e an
dph
ency
clid
ine-
type
su
bsta
nces
Hallu
cino
gens
Hallu
cino
gens LSD
Keta
min
e an
d ph
ency
clid
ine-
type
subs
tanc
es
LSD
Oth
er h
allu
cino
gens
Keta
min
e an
d ph
ency
clid
ine-
type
subs
tanc
es
Hallu
cino
gens LSD
Oth
er h
allu
cino
gens
Arge
n�na
(201
7)
Boliv
ia
(Plu
rina�
onal
Stat
e of
)20
16
Braz
il (2
015)
Chile (2017) Costa Rica (2017) Ecua
dor (
2011
)
Annu
al p
reva
lenc
e (p
erce
ntag
e)
Vene
zuel
a(B
oliv
aria
nRe
publ
ic o
f)(2
011)
0.1
0.2
0.3
0.4
0.5
0.6
0.7
0.8

60
WO
RLD
DRU
G R
EPO
RT 2
019 CANNABIS AND HALLUCINOGENS
LSD among young adults (aged 15–34) is much higher than among all adults (aged 15–64), ranging from 1.4 per cent in Czechia and 1.3 per cent in Finland to 0.1 per cent in Portugal. The countries that have reported the use of Salvia divinorum in Europe are Italy and Spain, while the use of ket-amine has only been reported in Czechia, England
over the period 2009–2016. The appearance of hal-lucinogenic NPS such as NBOMe, which in many countries are reportedly sold as LSD, is also note-worthy in South America. NBOMes have emerged onto the existing and possibly growing market for hallucinogens in the subregion in recent years.97
In the United States, the annual prevalence of LSD use is reported as 0.9 per cent of the population aged 12 and older and the use of PCP is negligible, while Canada has reported the annual prevalence of hallucinogen use as 1.4 per cent of the adult pop-ulation. The use of Salvia divinorum is also quite prevalent in Canada: among the general population, a lifetime prevalence of 2.7 per cent was reported in 2015 and the past-year prevalence of Salvia divi-norum use among 15–16 year olds was 1.5 per cent in the period 2015–2016.
The long-term trend in the use of hallucinogens in the United States, which also reports seizing the largest amount of hallucinogens (excluding ket-amine) worldwide, shows that, following a strong downward trend in the 1980s, the use of hallucino-gens started increasing in the 1990s. Subsequent data for the use of LSD, the drug most associated with the use of hallucinogens, showed quite a stable trend during the 2000s and a sharp increase since 2010.
The use of hallucinogens among students in twelfth grade in the United States is relatively common, although it is not at the same level as the use of can-nabis and opioids. In recent years, the use of LSD was reported to be increasing, the use of PCP has remained at similar levels to those of the 1990s, while the use of Salvia divinorum and ketamine has declined considerably, in particular among students in the twelfth grade.
In Europe, the overall prevalence of LSD and hal-lucinogenic mushroom use has been generally low and stable for a number of years. The unweighted average annual prevalence of LSD in the States members of the European Union and Norway, based on the latest available data, is estimated at 0.2 per cent of the population aged 15–64, ranging from 0.7 per cent in Czechia and 0.5 per cent in Finland to 0.1 per cent in Slovakia and Slovenia. The use of
97 World Drug Report 2017, Booklet 4: Market Analysis of Synthetic Drugs.
Fig. 37 Use of hallucinogens in the United States of America, 1979–2017
Source: United States, Substance Abuse and Mental Health Services Administration, Center for Behavioral Health Statistics and Quality, Results from the 2017 National Survey on Drug Use and Health: Detailed Tables (Rockville, Maryland, 2018).
Note: From 1979 to 1998, the category “hallucinogens” included the use of LSD and PCP; from 2002 onwards, MDMA was included in the drug category
“hallucinogens” and, as the use of PCP is negligible, the table above shows the prevalence of LSD use only from 2002 onwards.
0.0
0.2
0.4
0.6
0.8
1.0
0.0
0.5
1.0
1.5
2.0
2.5
3.0
1979
1985
1991
1993
1995
1997
2003
2005
2007
2009
2011
2013
2015
2017
LSD
(per
cent
age)
Hallu
cino
gens
(per
cent
age)
Hallucinogens LSD
0.0
0.2
0.4
0.6
0.8
1.0
0.0
0.5
1.0
1.5
2.0
2.5
3.0
1979
1985
1991
1993
1995
1997
2003
2005
2007
2009
2011
2013
2015
2017
LSD
(per
cent
age)
Hallu
cino
gens
(per
cent
age)
Hallucinogens LSD
0.0
0.2
0.4
0.6
0.8
1.0
0.0
0.5
1.0
1.5
2.0
2.5
3.0
1979
1985
1991
1993
1995
1997
2003
2005
2007
2009
2011
2013
2015
2017
LSD
(per
cent
age)
Hallu
cino
gens
(per
cent
age)
Hallucinogens LSD
Fig. 38 Use of hallucinogens among twelfth grade students in the United States of America, 1991–2018
Source: United States, National Institute on Drug Abuse, “Trends in Prevalence of Various Drugs”, Monitoring the Future Study (revised December 2018). Available at www.drugabuse.gov/trends-statistics/monitoring-future/monitoring-future-study-trends-in-prevalence-various-drugs.
0123456789
10
1991
1993
1995
1997
1999
2001
2003
2005
2007
2009
2011
2013
2015
2017
Annu
al p
reva
lenc
e (p
erce
ntag
e)
LSD PCPSalvia divinorum Ketamine

61
Demand for hallucinogens 5
Europe.99 In 2018, half of the respondents were younger than 25 and about 19 per cent were 35 years or older. The 2018 results, based on responses from 130,000 respondents, showed that, among the 10 substances that had been most commonly used in the past12 months, 4 were hallucinogens and dissociative or anaesthetic substances; 11 per cent of the respondents reported past-year use of LSD, 9.2 per cent use of hallucinogenic mushrooms, 6.5 per cent misuse of ketamine and 1 per cent use of Salvia divinorum. Among the hallucinogens and dissociative or anaesthetic substances, ketamine, LSD and hallucinogenic mushrooms also featured in the list of 13 substances for which young people had sought medical treatment as a result of acute drug intoxications.
99 Adam R. Winstock and others, Global Drug Survey (GDS) 2018: Key Findings Report 2018 (London, 2018).
Fig. 40 Use of hallucinogens in England and Wales, 1996–2017/18
Source: United Kingdom of Great Britain and Northern Ireland, Home Office, “Drug misuse: findings from the 2017/18 crime survey for England and Wales”, Statistical Bulletin 14/18 (London, 2018), Appendix tables.
and Wales, and Spain. In England and Wales, there has been a significant increase in the past-year use of hallucinogens. In the United Kingdom, ketamine was rescheduled from a class C to class B substance in 2014, but its use over the 12-month periods 2016/17 and 2017/18 increased considerably, driven by an increase from 1.2 per cent to 3.1 per cent among 16–24-year olds. This is the highest estimate of ketamine use since measurement of use of the drug began in that country, in 2006–2007.98
Another measure of the extent of use of hallucino-gens and dissociative-anaesthetics is the Global Drug Survey. However, the respondents cannot be said to be a representative sample of the global population as respondents are primarily young people with access to the Internet, most of whom live in
98 United Kingdom of Great Britain and Northern Ireland, Home Office, “Drug misuse: findings from the 2017/18 crime survey for England and Wales”, Statistical Bulletin 14/18 (London, 2018).
Fig. 39 LSD use among young adults (aged 15–34) and adults (aged 15–64) in Europe
Source: EMCDDA, “Prevalence of drug use”, Statistical Bulletin 2018.
0 0.5 1 1.5
AustriaBulgariaCroatiaCyprus
CzechiaDenmark
EstoniaFinlandFrance
GermanyHungary
IrelandItaly
LithuaniaLuxembourgNetherlands
NorwayPoland
PortugalRomaniaSlovakiaSlovenia
Annual prevalence (percentage)
Young adultsAdults
0.0
0.2
0.4
0.6
0.8
1.0
1.2
1996
1998
2000
2001
/02
2002
/03
2003
/04
2004
/05
2005
/06
2006
/07
2007
/08
2008
/09
2009
/10
2010
/11
2011
/12
2012
/13
2013
/14
2014
/15
2015
/16
2016
/17
2017
/18
Annu
al p
reva
lenc
e (p
erce
ntag
e)
LSDHallucinogenic mushroomsKetamine


63
ANNEX N
um
ber
of
u
sers
an
nu
ally
(b
est
esti
mat
e)
Esti
mat
ed
nu
mb
er o
fuse
rs
ann
ual
ly (
low
er)
Esti
mat
ed
nu
mb
er o
f u
sers
an
nu
ally
(u
pp
er)
Per
cen
t o
f
po
pu
lati
on
ag
ed
15−
64 y
ears
(b
est
esti
mat
e)
Per
cen
t o
f p
op
ula
tio
n a
ged
15
−64
yea
rs
(lo
wer
)
Per
cen
t o
f
po
pu
lati
on
ag
ed
15−
64 y
ears
(u
pp
er)
Afr
ica
44,
900,
000
35,
350,
000
62,
690,
000
6.4
5.1
9.0
East
ern
Afr
ica
-
-
-
--
-
Nor
ther
n A
fric
a -
-
-
-
--
Sout
hern
and
Sou
th-E
aste
rn A
fric
a -
-
-
-
--
Wes
t an
d C
entr
al A
fric
a 2
6,76
0,00
0 2
5,70
0,00
0 2
9,42
0,00
0 10
.09.
611
.0
Am
eric
as 5
6,59
0,00
0 5
5,60
0,00
0 5
8,33
0,00
0 8.
48.
38.
7
Car
ibbe
an 1
,040
,000
5
80,0
00
2,0
90,0
00
3.6
2.0
7.2
Cen
tral
Am
eric
a (e
xclu
ding
Mex
ico)
880
,000
8
20,0
00
990
,000
2.
92.
73.
3
Nor
ther
n A
mer
ica
(incl
udin
g M
exic
o) 4
4,63
0,00
0 4
4,46
0,00
0 4
4,81
0,00
0 13
.813
.713
.8
Sout
h A
mer
ica
10,
040,
000
9,7
40,0
00
10,
440,
000
3.5
3.4
3.6
Asi
a 5
4,21
0,00
0 4
1,14
0,00
0 6
4,84
0,00
0 1.
81.
42.
2
Cen
tral
Asi
a an
d Tr
ansc
auca
sia
1,6
70,0
00
640
,000
2
,410
,000
2.
91.
14.
2
East
and
Sou
th-E
ast
Asi
a 1
3,57
0,00
0 4
,160
,000
2
1,74
0,00
0 0.
80.
31.
4
Nea
r an
d M
iddl
e Ea
st/S
outh
-Wes
t A
sia
9,5
00,0
00
6,8
90,0
00
11,
180,
000
3.1
2.3
3.7
Sout
hern
Asi
a 2
9,47
0,00
0 2
9,43
0,00
0 2
9,52
0,00
0 2.
92.
92.
9
Euro
pe
29,
490,
000
28,
810,
000
30,
210,
000
5.4
5.3
5.6
East
ern
and
Sout
h-Ea
ster
n Eu
rope
(in
clud
ing
Turk
ey)
5,8
80,0
00
5,5
30,0
00
6,2
20,0
00
2.6
2.5
2.8
Wes
tern
and
Cen
tral
Eur
ope
23,
610,
000
23,
270,
000
23,
990,
000
7.4
7.3
7.5
Oce
ania
2,8
40,0
00
2,7
90,0
00
2,9
50,0
00
10.9
10.7
11.3
Aus
tral
ia a
nd N
ew Z
eala
nd 2
,090
,000
2
,090
,000
2
,090
,000
11
.011
.011
.0
Mel
anes
ia -
-
-
-
--
Mic
rone
sia
60,
000
40,
000
80,
000
17.2
11.3
23.1
Poly
nesi
a -
-
-
-
--
Glo
bal
188
,040
,000
1
63,6
80,0
00
219
,020
,000
3.
83.
34.
4
Ta
ble
7
Ann
ual p
reva
lenc
e of
the
use
of
cann
abis
, by
regi
on a
nd g
loba
lly, 2
017
Sour
ce:
UN
OD
C e
stim
ates
bas
ed o
n an
nual
rep
ort
ques
tionn
aire
dat
a an
d ot
her
offic
ial s
ourc
es.
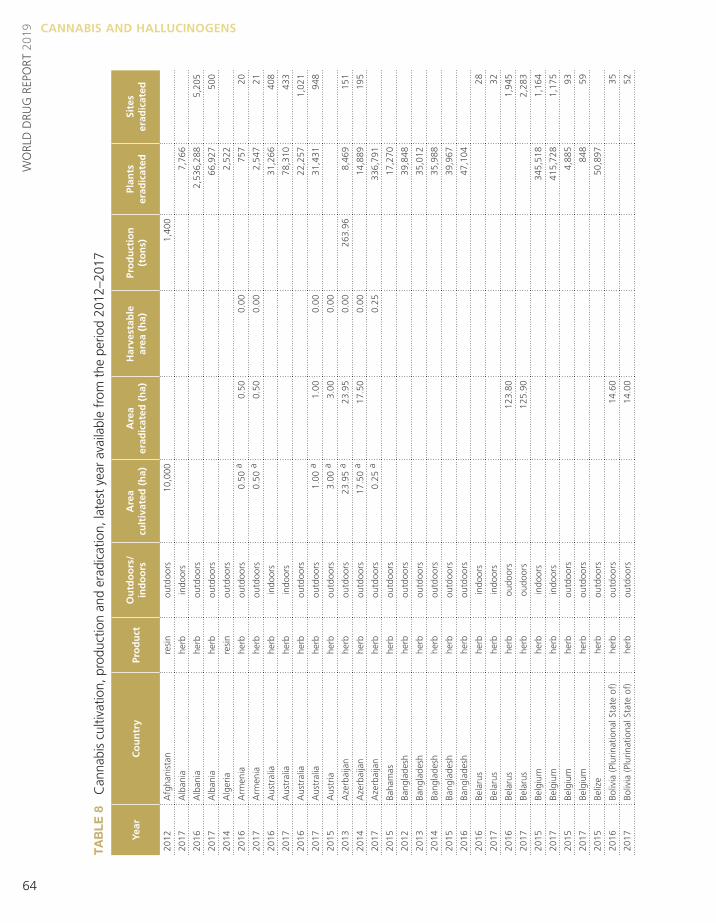
64
WO
RLD
DRU
G R
EPO
RT 2
019 CANNABIS AND HALLUCINOGENS
Year
Co
un
try
Pro
du
ctO
utd
oo
rs/
in
do
ors
Are
a
cult
ivat
ed (
ha)
Are
a
erad
icat
ed (
ha)
Har
vest
able
ar
ea (
ha)
Pro
du
ctio
n
(to
ns)
Plan
ts
erad
icat
edSi
tes
er
adic
ated
2012
Afg
hani
stan
resi
nou
tdoo
rs 1
0,00
0 1
,400
2017
Alb
ania
herb
indo
ors
7,7
66
2016
Alb
ania
herb
outd
oors
2,5
36,2
88
5,2
05
2017
Alb
ania
herb
outd
oors
66,
927
500
2014
Alg
eria
resi
nou
tdoo
rs 2
,522
2016
Arm
enia
herb
outd
oors
0.50
a0.
500.
0075
720
2017
Arm
enia
herb
outd
oors
0.50
a0.
500.
002,
547
21
2016
Aus
tral
iahe
rbin
door
s31
,266
408
2017
Aus
tral
iahe
rbin
door
s78
,310
433
2016
Aus
tral
iahe
rbou
tdoo
rs22
,257
1,02
1
2017
Aus
tral
iahe
rbou
tdoo
rs1.
00 a
1.00
0.00
31,4
3194
8
2015
Aus
tria
herb
outd
oors
3.00
a3.
000.
00
2013
Aze
rbai
jan
herb
outd
oors
23.9
5 a
23.9
50.
0026
3.96
8,46
915
1
2014
Aze
rbai
jan
herb
outd
oors
17.5
0 a
17.5
00.
0014
,889
195
2017
Aze
rbai
jan
herb
outd
oors
0.25
a0.
2533
6,79
1
2015
Baha
mas
herb
outd
oors
17,2
70
2012
Bang
lade
shhe
rbou
tdoo
rs39
,848
2013
Bang
lade
shhe
rbou
tdoo
rs35
,012
2014
Bang
lade
shhe
rbou
tdoo
rs35
,988
2015
Bang
lade
shhe
rbou
tdoo
rs39
,967
2016
Bang
lade
shhe
rbou
tdoo
rs47
,104
2016
Bela
rus
herb
indo
ors
28
2017
Bela
rus
herb
indo
ors
32
2016
Bela
rus
herb
oudo
ors
123.
801,
945
2017
Bela
rus
herb
oudo
ors
125.
902,
283
2015
Belg
ium
herb
indo
ors
345,
518
1,16
4
2017
Belg
ium
herb
indo
ors
415,
728
1,17
5
2015
Belg
ium
herb
outd
oors
4,88
593
2017
Belg
ium
herb
outd
oors
848
59
2015
Beliz
ehe
rbou
tdoo
rs50
,897
2016
Boliv
ia (
Plur
inat
iona
l Sta
te o
f)he
rbou
tdoo
rs14
.60
35
2017
Boliv
ia (
Plur
inat
iona
l Sta
te o
f)he
rbou
tdoo
rs14
.00
52
Ta
ble
8
Can
nabi
s cu
ltiva
tion,
pro
duct
ion
and
erad
icat
ion,
late
st y
ear
avai
labl
e fr
om t
he p
erio
d 20
12–2
017

65
Annex 5
Year
Co
un
try
Pro
du
ctO
utd
oo
rs/
in
do
ors
Are
a
cult
ivat
ed (
ha)
Are
a
erad
icat
ed (
ha)
Har
vest
able
ar
ea (
ha)
Pro
du
ctio
n
(to
ns)
Plan
ts
erad
icat
edSi
tes
er
adic
ated
2016
Bosn
ia a
nd H
erze
govi
nahe
rbin
door
s39
.00
2017
Bosn
ia a
nd H
erze
govi
nahe
rbin
door
s1
1
2016
Bosn
ia a
nd H
erze
govi
nahe
rbou
tdoo
rs1,
680.
00
2017
Bosn
ia a
nd H
erze
govi
nahe
rbou
tdoo
rs0.
02 a
0.02
0.00
539
53
2014
Braz
ilhe
rbou
tdoo
rs44
.01
1,3
64,3
16
2017
Braz
ilhe
rbou
tdoo
rs11
7.51
1,9
10,4
51
604
2015
Bulg
aria
herb
indo
ors
323
2015
Bulg
aria
herb
outd
oors
37.7
79,
488
2017
Cen
tral
Afr
ican
Rep
ublic
herb
outd
oors
130.
0060
.00
5510
.00
250
,000
22
2016
Chi
lehe
rbin
door
s26
,988
2,74
0
2017
Chi
lehe
rbin
door
s50
,414
2,40
8
2016
Chi
lehe
rbou
tdoo
rs58
,950
264
2017
Chi
lehe
rbou
tdoo
rs19
4,69
420
2
2016
Chi
nahe
rbou
tdoo
rs9.
801,
390,
000
2016
Col
ombi
ahe
rbou
tdoo
rs13
5.00
2017
Col
ombi
ahe
rbou
tdoo
rs17
3.71
2016
Cos
ta R
ica
herb
indo
ors
678
5
2017
Cos
ta R
ica
herb
indo
ors
2
2016
Cos
ta R
ica
herb
outd
oors
17.5
92,
122,
244
201
2017
Cos
ta R
ica
herb
outd
oors
215
2016
Côt
e d’
Ivoi
rehe
rbou
tdoo
rs5
2017
Côt
e d’
Ivoi
rehe
rbou
tdoo
rs0.
251
2016
Cze
chia
herb
indo
ors
53,5
4922
9
2017
Cze
chia
herb
indo
ors
50,9
2530
5
2016
Cze
chia
herb
outd
oors
4,11
1
2017
Cze
chia
herb
outd
oors
3,46
7
2015
Den
mar
khe
rbin
door
s/ou
t-do
ors
14,5
6097
2016
Den
mar
khe
rbin
door
s/ou
t-do
ors
13,2
1710
5
2017
Den
mar
khe
rbin
door
s/ou
t-do
ors
34,8
0165
2014
Dom
inic
an R
epub
liche
rbou
tdoo
rs6.
00 a
6.00
0.00
0.21
111
8
2016
Ecua
dor
herb
outd
oors
224
34

66
WO
RLD
DRU
G R
EPO
RT 2
019 CANNABIS AND HALLUCINOGENS
Year
Co
un
try
Pro
du
ctO
utd
oo
rs/
in
do
ors
Are
a
cult
ivat
ed (
ha)
Are
a
erad
icat
ed (
ha)
Har
vest
able
ar
ea (
ha)
Pro
du
ctio
n
(to
ns)
Plan
ts
erad
icat
edSi
tes
er
adic
ated
2017
Ecua
dor
herb
outd
oors
397
10
2015
Egyp
the
rb/r
esin
outd
oors
140.
00
2017
Egyp
the
rb/r
esin
outd
oors
126.
00
2014
Esw
atin
ihe
rbou
tdoo
rs1,
500.
001,
069.
5043
0.50
3,00
0,00
021
0
2017
Geo
rgia
herb
indo
ors
0.01
186
91
2017
Geo
rgia
herb
outd
oors
0.02
a0.
020.
0093
19
2016
El S
alva
dor
herb
outd
oors
1.00
227
25
2014
Fran
cehe
rbou
tdoo
rs15
8,59
283
7
2015
Ger
man
yhe
rbin
door
s13
5,92
578
6
2017
Ger
man
yhe
rbin
door
s85
,226
573
2015
Ger
man
yhe
rbou
tdoo
rs 9
,136
12
7
2017
Ger
man
yhe
rbou
tdoo
rs95
2016
Gre
ece
herb
indo
ors
16,
554
2017
Gre
ece
herb
indo
ors
19,
498
2016
Gre
ece
herb
oudo
ors
39,
151
2017
Gre
ece
herb
oudo
ors
27,
409
2016
Gua
tem
ala
herb
outd
oors
9.00
3,1
38,2
98
427
2017
Gua
tem
ala
herb
outd
oors
3.50
a3.
811.
61 6
,033
,345
15
0
2015
Guy
ana
herb
outd
oors
20.0
0 9.
4010
.60
1,00
0.00
419
,700
19
2016
Hon
dura
she
rbin
door
s 7
2
2016
Hon
dura
she
rbou
tdoo
rs 2
4,25
3 19
2017
Hon
dura
she
rbou
tdoo
rs59
.58
a59
.59
0.00
2016
Chi
na,
Hon
g K
ong
SAR
herb
indo
ors
329
1
2016
Hun
gary
herb
indo
ors
5,00
03
2016
Hun
gary
herb
outd
oors
2,00
020
2013
Icel
and
herb
indo
ors
6,65
232
3
2016
Indi
ahe
rbou
tdoo
rs3,
414.
74
2017
Indi
ahe
rbou
tdoo
rs3,
445.
906,
687,
376
2016
Indo
nesi
ahe
rbou
tdoo
rs48
2.00
a48
2.00
0.00
2017
Indo
nesi
ahe
rbou
tdoo
rs89
.00
a89
.00
0.00
738,
020
14
2016
Irela
ndhe
rbin
door
s7,
273
2017
Irela
ndhe
rbin
door
s9,
046
50
2017
Italy
herb
indo
ors
56,1
251,
161
2017
Italy
herb
outd
oors
209,
510
401

67
Annex 5
Year
Co
un
try
Pro
du
ctO
utd
oo
rs/
in
do
ors
Are
a
cult
ivat
ed (
ha)
Are
a
erad
icat
ed (
ha)
Har
vest
able
ar
ea (
ha)
Pro
du
ctio
n
(to
ns)
Plan
ts
erad
icat
edSi
tes
er
adic
ated
2014
Italy
herb
indo
ors
51,5
3463
9
2014
Italy
herb
outd
oors
70,1
251,
134
2012
Jam
aica
herb
outd
oors
456
382
2016
Kaz
akhs
tan
herb
outd
oors
18.0
0 a
18.0
00.
0017
0,00
020
2
2017
Kaz
akhs
tan
herb
outd
oors
12.3
0 a
12.3
00.
0093
0,77
491
2016
Ken
yahe
rbou
tdoo
rs12
.00
8,74
746
2017
Ken
yahe
rbou
tdoo
rs0.
104,
662
2015
Kyr
gyzs
tan
herb
outd
oors
5,01
4.00
5,01
4.00
2016
Latv
iahe
rbin
door
s55
735
2017
Latv
iahe
rbin
door
s79
834
2016
Latv
iahe
rbou
tdoo
rs78
6
2017
Latv
iahe
rbou
tdoo
rs66
15
2015
Leba
non
herb
outd
oors
3,50
0.00
3,50
0.00
2017
Leba
non
herb
outd
oors
40,7
72.0
0
2016
Lith
uani
ahe
rbin
door
s4
2017
Lith
uani
ahe
rbin
door
s8
2017
Lith
uani
ahe
rbou
tdoo
rs7
2015
Mad
agas
car
herb
outd
oors
11.0
021
,325
2017
Mad
agas
car
herb
outd
oors
9.00
57,7
08
2013
Mal
tahe
rbin
door
s27
2016
Mex
ico
herb
outd
oors
5,47
8.42
6,57
4.1
38,4
32
2017
Mex
ico
herb
outd
oors
4,19
3.34
5,03
2.0
34,5
23
2013
Mon
golia
herb
outd
oors
15,0
00.0
04,
000.
0011
,000
.00
4,00
04,
000
2016
Mor
occo
plan
tou
tdoo
rs47
,000
.00
395.
0046
,605
.00
2017
Mor
occo
plan
tou
tdoo
rs47
,500
.00
523.
0046
,977
.00
2016
Mor
occo
herb
outd
oors
35,6
52.8
3
2017
Mor
occo
herb
outd
oors
35,7
02.9
0
2016
Mor
occo
resi
nou
tdoo
rs71
3.00
2017
Mor
occo
resi
nou
tdoo
rs71
4.06
2014
Mya
nmar
herb
outd
oors
15.0
010
.00
5.00
3
2016
Net
herla
nds
herb
indo
ors
994,
068
5,85
6
2017
Net
herla
nds
herb
indo
ors
883,
163
5,53
8
2016
New
Zea
land
herb
indo
ors
18,9
0360
7
2017
New
Zea
land
herb
indo
ors
19,9
92

68
WO
RLD
DRU
G R
EPO
RT 2
019 CANNABIS AND HALLUCINOGENS
Year
Co
un
try
Pro
du
ctO
utd
oo
rs/
in
do
ors
Are
a
cult
ivat
ed (
ha)
Are
a
erad
icat
ed (
ha)
Har
vest
able
ar
ea (
ha)
Pro
du
ctio
n
(to
ns)
Plan
ts
erad
icat
edSi
tes
er
adic
ated
2016
New
Zea
land
herb
outd
oors
104,
725
2017
New
Zea
land
herb
outd
oors
19,5
59
2014
Nic
arag
uahe
rbou
tdoo
rs0.
301,
507.
003,
014
30
2016
Nig
eria
herb
outd
oors
718.
7865
2017
Nig
eria
herb
outd
oors
317.
12
2015
Nor
way
herb
indo
ors
0.04
4,00
030
2013
Pana
ma
herb
indo
ors
0.50
a0.
500.
0037
2
2013
Pana
ma
herb
outd
oors
10.5
0 a
10.5
00.
0078
,633
2
2016
Para
guay
plan
tou
tdoo
rs1,
298.
50 a
1,29
8.50
0.00
5,65
6,26
64
2017
Para
guay
plan
tou
tdoo
rs1,
462.
0036
,550
,000
2016
Para
guay
herb
outd
oors
1,29
8.50
2016
Para
guay
resi
nou
tdoo
rs1.
15
2016
Peru
herb
outd
oors
87.8
31,
429,
749
2017
Peru
herb
outd
oors
61.3
04,
671,
387
47
2016
Phili
ppin
eshe
rbou
tdoo
rs8.
6724
,635
,153
337
2017
Phili
ppin
eshe
rbou
tdoo
rs4.
8222
1,03
527
2016
Pola
ndhe
rbin
door
s14
6,75
51,
403
2017
Pola
ndhe
rbin
door
s44
810
2016
Pola
ndhe
rbin
door
s/
outd
oors
4,58
521
9
2017
Pola
ndhe
rbin
door
s/
outd
oors
54
2017
Port
ugal
herb
indo
ors/
ou
tdoo
rs22
,910
158
2013
Repu
blic
of
Kor
eahe
rbou
tdoo
rs8,
072
2014
Repu
blic
of
Mol
dova
herb
outd
oors
100
.00
59.0
041
.00
10,0
00.0
020
0,54
8
2017
Repu
blic
of
Mol
dova
herb
outd
oors
0.1
5 2.
5725
7,23
6
2014
Repu
blic
of
Mol
dova
herb
indo
ors
41.0
0
2016
Rom
ania
herb
indo
ors
1,43
341
2017
Rom
ania
herb
indo
ors
1,87
546
2016
Rom
ania
herb
outd
oors
6.99
42
2017
Rom
ania
herb
outd
oors
1.90
4,90
532
2016
Russ
ian
Fede
ratio
nhe
rbin
door
s0.
6678
8
2017
Russ
ian
Fede
ratio
nhe
rbin
door
s0.
871,
990
2016
Russ
ian
Fede
ratio
nhe
rbou
tdoo
rs7.
61 a
7.61
0.00
68.6
41,
143

69
Annex 5
Year
Co
un
try
Pro
du
ctO
utd
oo
rs/
in
do
ors
Are
a
cult
ivat
ed (
ha)
Are
a
erad
icat
ed (
ha)
Har
vest
able
ar
ea (
ha)
Pro
du
ctio
n
(to
ns)
Plan
ts
erad
icat
edSi
tes
er
adic
ated
2017
Russ
ian
Fede
ratio
nhe
rbou
tdoo
rs15
9.00
a15
9.00
0.00
30.0
75,
379
2015
Serb
iahe
rbou
tdoo
rs0.
05
2013
Sier
ra L
eone
herb
outd
oors
190.
0019
0.00
190
3
2016
Slov
akia
herb
indo
ors
385
2017
Slov
akia
herb
outd
oors
2.00
a2.
000.
002,
299
31
2014
Slov
enia
herb
indo
ors
9,22
311
8
2017
Slov
enia
herb
indo
ors
10,2
5978
2014
Slov
enia
herb
outd
oors
1,84
4
2015
Spai
nhe
rbin
door
s24
4,77
210
8
2015
Spai
nhe
rbou
tdoo
rs13
5,07
444
2014
Suda
nhe
rbou
tdoo
rs8.
00 a
8.00
0.00
345.
00
2017
Suda
nhe
rbou
tdoo
rs1,
250.
00 a
1,25
0.00
0.00
205.
0010
0
2014
Swed
enhe
rbin
door
s10
,000
56
2015
Swed
enhe
rbou
tdoo
rs18
2.00
2017
Swed
enhe
rbou
tdoo
rs5,
100
44
2016
Switz
erla
ndhe
rbin
door
s11
,386
83
2017
Switz
erla
ndhe
rbin
door
s71
,750
2012
Tajik
ista
nhe
rbou
tdoo
rs2,
180,
121
2016
Thai
land
herb
outd
oors
1.00
a1.
000.
007.
501
2015
Trin
idad
and
Tob
ago
herb
outd
oors
0.31
375,
925
58
2012
Uga
nda
herb
outd
oors
150.
0088
.00
62.0
05
2016
Ukr
aine
herb
outd
oors
91.0
0 a
91.0
00.
00
2017
Ukr
aine
herb
outd
oors
166.
904,
600,
000
2016
Uni
ted
Stat
es o
f A
mer
ica
herb
indo
ors
406,
125
1,86
5
2017
Uni
ted
Stat
es o
f A
mer
ica
herb
indo
ors
303,
654
1,39
9
2016
Uni
ted
Stat
es o
f A
mer
ica
herb
outd
oors
4,94
0,59
65,
513
2017
Uni
ted
Stat
es o
f A
mer
ica
herb
outd
oors
3,07
8,41
84,
062
2016
Uru
guay
herb
indo
ors
661
2017
Uru
guay
herb
indo
ors
1,92
6
2016
Uzb
ekis
tan
herb
outd
oors
0.20
a0.
200.
0058
6
2017
Uzb
ekis
tan
herb
outd
oors
0.20
a0.
200.
0061
8
2015
Vie
t N
amhe
rbou
door
s1.
00
Sour
ce:
Uni
ted
Nat
ions
Off
ice
on D
rugs
and
Crim
e an
nual
rep
ort
ques
tionn
aire
, go
vern
men
t re
port
s an
d an
d in
tern
atio
nal n
arco
tics
cont
rol s
trat
egy
repo
rts
of t
he U
nite
d St
ates
of
Am
eric
a.a
Are
a id
entif
ied
by t
he a
utho
ritie
s fo
r er
adic
atio
n.


71
GLOSSARY
amphetamine-type stimulants — a group of substances composed of synthetic stimulants controlled under the Convention on Psychotropic Substances of 1971 and from the group of substances called ampheta-mines, which includes amphetamine, methamphetamine, methcathinone and the “ecstasy”-group substances (3,4-methylenedioxym-ethamphetamine (MDMA) and its analogues).
amphetamines — a group of amphetamine-type stimulants that includes amphetamine and methamphetamine.
annual prevalence — the total number of people of a given age range who have used a given drug at least once in the past year, divided by the number of people of the given age range, and expressed as a percentage.
coca paste (or coca base) — an extract of the leaves of the coca bush. Purification of coca paste yields cocaine (base and hydrochloride).
“crack” cocaine — cocaine base obtained from cocaine hydrochloride through conversion processes to make it suitable for smoking.
cocaine salt — cocaine hydrochloride.
drug use — use of controlled psychoactive substances for non-medical and non-scientific purposes, unless otherwise specified.
fentanyls — fentanyl and its analogues.
new psychoactive substances — substances of abuse, either in a pure form or a preparation, that are not controlled under the Single Convention on Narcotic Drugs of 1961 or the 1971 Convention, but that may pose a public health threat. In this context, the term “new” does not necessarily refer to new inven-tions but to substances that have recently become available.
opiates — a subset of opioids comprising the various products derived from the opium poppy plant, including opium, morphine and heroin.
opioids — a generic term that refers both to opiates and their synthetic analogues (mainly prescription or pharmaceutical opioids) and compounds synthe-sized in the body.
problem drug users — people who engage in the high-risk consumption of drugs. For example, people who inject drugs, people who use drugs on a daily basis and/or people diagnosed with drug use disorders (harmful use or drug dependence), based on clinical criteria as contained in the Diagnostic and Statistical Manual of Mental Disorders (fifth edition) of the American Psychiatric Association, or the Interna-tional Classification of Diseases and Related Health Problems (tenth revision) of WHO.
people who suffer from drug use disorders/people with drug use disorders — a subset of people who use drugs. Harmful use of substances and dependence are features of drug use disorders. People with drug use disorders need treatment, health and social care and rehabilitation.
harmful use of substances — defined in the Interna-tional Statistical Classification of Diseases and Related Health Problems (tenth revision) as a pattern of use that causes damage to physical or mental health.
dependence — defined in the International Statistical Classification of Diseases and Related Health Problems (tenth revision) as a cluster of physiological, behav-ioural and cognitive phenomena that develop after repeated substance use and that typically include a strong desire to take the drug, difficulties in control-ling its use, persisting in its use despite harmful consequences, a higher priority given to drug use than to other activities and obligations, increased tolerance, and sometimes a physical withdrawal state.
substance or drug use disorders — referred to in the Diagnostic and Statistical Manual of Mental Disorders (fifth edition) as patterns of symptoms resulting from the repeated use of a substance despite experiencing problems or impairment in daily life as a result of using substances. Depending on the number of symptoms identified, substance use disorder may be mild, moderate or severe.
prevention of drug use and treatment of drug use disorders — the aim of “prevention of drug use” is to prevent or delay the initiation of drug use, as well as the transition to drug use disorders. Once a person develops a drug use disorder, treatment, care and rehabilitation are needed.


73
REGIONAL GROUPINGS
• East and South-East Asia: Brunei Darussalam, Cambodia, China, Democratic People’s Republic of Korea, Indonesia, Japan, Lao People’s Democratic Republic, Malaysia, Mongolia, Myanmar, Philippines, Republic of Korea, Singapore, Thailand, Timor-Leste, Viet Nam, Hong Kong, China, Macao, China, and Taiwan Province of China
• South-West Asia: Afghanistan, Iran (Islamic Republic of ) and Pakistan
• Near and Middle East: Bahrain, Iraq, Israel, Jordan, Kuwait, Lebanon, Oman, Qatar, Saudi Arabia, State of Palestine, Syrian Arab Republic, United Arab Emirates and Yemen
• South Asia: Bangladesh, Bhutan, India, Maldives, Nepal and Sri Lanka
• Eastern Europe: Belarus, Republic of Moldova, Russian Federation and Ukraine
• South-Eastern Europe: Albania, Bosnia and Herzegovina, Bulgaria, Croatia, Montenegro, North Macedonia, Romania, Serbia, Turkey and Kosovo
• Western and Central Europe: Andorra, Austria, Belgium, Cyprus, Czechia, Denmark, Estonia, Finland, France, Germany, Greece, Hungary, Iceland, Ireland, Italy, Latvia, Liechtenstein, Lithuania, Luxembourg, Malta, Monaco, Netherlands, Norway, Poland, Portugal, San Marino, Slovakia, Slovenia, Spain, Sweden, Switzerland, United Kingdom of Great Britain and Northern Ireland, Faroe Islands, Gibraltar and Holy See
Oceania (comprising four subregions): • Australia and New Zealand: Australia and
New Zealand• Polynesia: Cook Islands, Niue, Samoa, Tonga,
Tuvalu, French Polynesia, Tokelau and Wallis and Futuna Islands
• Melanesia: Fiji, Papua New Guinea, Solomon Islands, Vanuatu and New Caledonia
• Micronesia: Kiribati, Marshall Islands, Micronesia (Federated States of ), Nauru, Palau, Guam and Northern Mariana Islands
The World Drug Report uses a number of regional and subregional designations. These are not official designations, and are defined as follows:• East Africa: Burundi, Comoros, Djibouti, Eritrea,
Ethiopia, Kenya, Madagascar, Mauritius, Rwanda, Seychelles, Somalia, South Sudan, Uganda, United Republic of Tanzania and Mayotte
• North Africa: Algeria, Egypt, Libya, Morocco, Sudan and Tunisia
• Southern Africa: Angola, Botswana, Eswatini, Lesotho, Malawi, Mozambique, Namibia, South Africa, Zambia, Zimbabwe and Reunion
• West and Central Africa: Benin, Burkina Faso, Cabo Verde, Cameroon, Central African Republic, Chad, Congo, Côte d’Ivoire, Democratic Republic of the Congo, Equatorial Guinea, Gabon, Gambia, Ghana, Guinea, Guinea-Bissau, Liberia, Mali, Mauritania, Niger, Nigeria, Sao Tome and Principe, Senegal, Sierra Leone, Togo and Saint Helena
• Caribbean: Antigua and Barbuda, Bahamas, Barbados, Cuba, Dominica, Dominican Republic, Grenada, Haiti, Jamaica, Saint Kitts and Nevis, Saint Lucia, Saint Vincent and the Grenadines, Trinidad and Tobago, Anguilla, Aruba, Bonaire, Netherlands, British Virgin Islands, Cayman Islands, Curaçao, Guadeloupe, Martinique, Montserrat, Puerto Rico, Saba, Netherlands, Sint Eustatius, Netherlands, Sint Maarten, Turks and Caicos Islands and United States Virgin Islands
• Central America: Belize, Costa Rica, El Salvador, Guatemala, Honduras, Nicaragua and Panama
• North America: Canada, Mexico, United States of America, Bermuda, Greenland and Saint-Pierre and Miquelon
• South America: Argentina, Bolivia (Plurinational State of ), Brazil, Chile, Colombia, Ecuador, Guyana, Paraguay, Peru, Suriname, Uruguay, Venezuela (Bolivarian Republic of ) and Falkland Islands (Malvinas)
• Central Asia and Transcaucasia: Armenia, Azerbaijan, Georgia, Kazakhstan, Kyrgyzstan, Tajikistan, Turkmenistan and Uzbekistan

The World Drug Report 2019 is again presented in five separate parts that divide the wealth of information and analysis contained in the report into individual reader-friendly booklets in which drugs are grouped by their psychopharmacological effect for the first time in the report’s history.
Booklet 1 provides a summary of the four subsequent booklets by reviewing their key findings and highlighting policy implications based on their conclusions. Booklet 2 contains a global overview of the latest estimates of and trends in the supply, use and health consequences of drugs. Booklet 3 looks at recent trends in the market for depressants (including opioids, sedatives, tranquillizers and hypnotics), while Booklet 4 deals with recent trends in the market for stimulants (including cocaine, amphetamine-type stimulants and new psychoactive substances). Booklet 5 contains a review of recent trends in the market for cannabis and for hallucinogens. The section on cannabis also includes a review of the latest developments in the jurisdictions that have adopted measures allowing the non-medical use of cannabis.
As in previous years, the World Drug Report 2019 is aimed at improving the understanding of the world drug problem and contributing towards fostering greater international cooperation for countering its impact on health, governance and security.
The statistical annex is published on the UNODC website: https://www.unodc.org/wdr2019
ISBN 978-92-1-148314-7
ResearchVienna International Centre, PO Box 500, 1400 Vienna, AustriaTel: +(43) (1) 26060-0, Fax: +(43) (1) 26060-5866, www.unodc.org
5CANNABIS ANDHALLUCINOGENS
2019