candle management workstation user's guide -...
TRANSCRIPT
User’s GuideCandle Management Workstation®
Version 350
GC32-9177-00
June 2000
Candle Corporation201 North Douglas Street
El Segundo, California 90245

2 Candle Management Workstation User’s Guide
Registered trademarks and service marks of Candle Corporation: AF/OPERATOR, AF/PERFORMER, AF/REMOTE, Availability Command Center, Candle Command Center, Candle Electronic Customer Support, Candle logo, Candle Management Server, Candle Management Workstation, Candle Technologies, CL/CONFERENCE, CL/SUPERSESSION, CT, CT/Data Server, CT/DS, DB Logo, DB/QUICKCHANGE, DELTAMON, ETEWatch, IntelliWatch, MQSecure, MQView, OMEGACENTER, OMEGAMON, OMEGAMON/e, OMEGAMON II, OMEGAMON Monitoring Agent, OMEGAVIEW, OMEGAVIEW II, Solutions for Networked Businesses, and Transplex.Trademarks and service marks of Candle Corporation: Alert Adapter, Alert Adapter Plus, Alert Emitter, AMS, Amsys, AUTOMATED FACILITIES, Availability Management Systems, Candle Business Partner Logo, Candle Direct Logo, CandleLight, Candle CommandPro, CCC, CECS, CICAT, CL/ENGINE, CL/GATEWAY, CL/TECHNOLOGY, CMS, CMW, Command & Control, CommandWatch, Connect-Two, CSA ANALYZER, CT/ALS, CT/Application Logic Services, CT/DCS, CT/Distributed Computing Services, CT/Engine, CT/Implementation Services, CT/IX, CT/Workbench, CT/Workstation Server, CT/WS, DB/DASD, DB/EXPLAIN, DB/MIGRATOR, DB/QUICKCOMPARE, DB/SMU, DB/Tools, DB/WORKBENCH, Design Network, DEXAN, eBA*ServiceMonitor, End-to-End, Enterprise Candle Command Center, Enterprise Candle Management Workstation, EPILOG, ERPNet, ESRA, ETEWatch, HostBridge, IntelliWatch Pinnacle, Lava Console, Messaging Mastered, MQADMIN, MQEdit, MQEXPERT, MQMON, NBX, OMA, OMC Gateway, OMC Status Manager, OMEGACENTER Bridge, OMEGACENTER Gateway, OMEGACENTER Status Manager, OMEGAMON Management Center, OSM, PC COMPANION, Performance Pac, PowerQ, PQConfiguration, PQEdit, PQScope, Response Time Network, Roma, Roma Application Manager, Roma Broker, Roma BSP, Roma Connector, Roma Developer, Roma FS/A, Roma FS/Access, Roma Network, Roma Systems Manager, Roma WF/Access, Roma Workflow Access, RTA, RTN, SentinelManager, Solutions for Networked Applications, Status Monitor, Tracer, Unified Directory Services, and Volcano.Trademarks and registered trademarks of other companies: AIX, DB2, and MQSeries are registered trademarks of International Business Machines Corporation. SAP is a registered trademark and R/3 is a trademark of SAP AG. UNIX is a registered trademark in the U.S. and other countries, licensed exclusively through X/Open Company Ltd. HP-UX is a trademark of Hewlett-Packard Company. SunOS is a trademark of Sun Microsystems, Inc. All other company and product names used herein are trademarks or registered trademarks of their respective companies.
Copyright © 2000, Candle Corporation, a California corporation. All rights reserved. International rights secured.
Threaded Environment for AS/400, Patent No. 5,504,898; Data Server with Data Probes Employing Predicate Tests in Rule Statements (Event Driven Sampling), Patent No. 5,615,359; MVS/ESA Message Transport System Using the XCF Coupling Facility, Patent No. 5,754,856; Intelligent Remote Agent for Computer Performance Monitoring, Patent No. 5,781,703; Data Server with Event Driven Sampling, Patent No. 5,809,238; Threaded Environment for Computer Systems Without Native Threading Support, Patent No. 5,835,763; Object Procedure Messaging Facility, Patent No. 5,848,234; End-to-End Response Time Measurement for Computer Programs, Patent No. 5,991,705; Communications on a Network, Patent Pending; Improved Message Queuing Based Network Computing Architecture, Patent Pending; User Interface for System Management Applications, Patent Pending.
NOTICE: This documentation is provided with RESTRICTED RIGHTS. Use, duplication, or disclosure by the Government is subject to restrictions set forth in the applicable license agreement and/or the applicable government rights clause.This documentation contains confidential, proprietary information of Candle Corporation that is licensed for your internal use only. Any unauthorized use, duplication, or disclosure is unlawful.

3
Preface . . . . . . . . . . . . . . . . . . . . . . . . . . . . . . . . . . . . . . . . . . . . . . . . . .9About This Guide . . . . . . . . . . . . . . . . . . . . . . . . . . . . . . . . . . . . . . . . 9Documentation Set . . . . . . . . . . . . . . . . . . . . . . . . . . . . . . . . . . . . . . 11Documentation Conventions. . . . . . . . . . . . . . . . . . . . . . . . . . . . . . . 12
Chapter 1. What’s New in CCC Version 350 . . . . . . . . . . . . . . . . . . . . . . . 15
Chapter 2. Introducing Candle Command Center and the Candle Management Workstation . . . . . . . . . . . . . . . . . . . . . . . . . . . . . 17What is CCC? . . . . . . . . . . . . . . . . . . . . . . . . . . . . . . . . . . . . . . . . . . 18Who Are the Users?. . . . . . . . . . . . . . . . . . . . . . . . . . . . . . . . . . . . . . 21Automation . . . . . . . . . . . . . . . . . . . . . . . . . . . . . . . . . . . . . . . . . . . . 24Releases . . . . . . . . . . . . . . . . . . . . . . . . . . . . . . . . . . . . . . . . . . . . . . 25
Chapter 3. Getting Started . . . . . . . . . . . . . . . . . . . . . . . . . . . . . . . . . . . . .27Logging On . . . . . . . . . . . . . . . . . . . . . . . . . . . . . . . . . . . . . . . . . . . . 28The Candle Management Workstation Main Window . . . . . . . . . . . . 29Printing From the CMW . . . . . . . . . . . . . . . . . . . . . . . . . . . . . . . . . . 32Selecting Objects When Using the CMW . . . . . . . . . . . . . . . . . . . . . . 34
Chapter 4. Monitoring Your System . . . . . . . . . . . . . . . . . . . . . . . . . . . . . . 35Why Do I Want to Monitor and How Do I Do It?. . . . . . . . . . . . . . . . 36Prerequisites to Monitoring Your System . . . . . . . . . . . . . . . . . . . . . . 38Monitoring Your System Graphically . . . . . . . . . . . . . . . . . . . . . . . . . 39Using the Events View to Investigate System Changes . . . . . . . . . . . . 42About the Enterprise - Events View Window . . . . . . . . . . . . . . . . . . . 44Reviewing Advice Provided with a Situation . . . . . . . . . . . . . . . . . . . 47Using the Attribute View to Obtain Additional Information About an Event . . . . . . . . . . . . . . . . . . . . . . . . . . . . . . . . . . . . . . . . . . . . . . . . 50Acknowledging an Event . . . . . . . . . . . . . . . . . . . . . . . . . . . . . . . . . . 53Resetting an Event . . . . . . . . . . . . . . . . . . . . . . . . . . . . . . . . . . . . . . 55Displaying the Universal Message Console . . . . . . . . . . . . . . . . . . . . 57
Contents

4 Candle Management Workstation User’s Guide
Chapter 5. Understanding and Using Reports . . . . . . . . . . . . . . . . . . . . . . 59Reports Overview . . . . . . . . . . . . . . . . . . . . . . . . . . . . . . . . . . . . . . . 60Viewing Reports . . . . . . . . . . . . . . . . . . . . . . . . . . . . . . . . . . . . . . . . 61Using the Report Settings Dialog . . . . . . . . . . . . . . . . . . . . . . . . . . . . 62Adjusting the Amount of Data Displayed in a Report. . . . . . . . . . . . . 63 Opening a Terminal Session from a Report . . . . . . . . . . . . . . . . . . . 64
Chapter 6. Reviewing History. . . . . . . . . . . . . . . . . . . . . . . . . . . . . . . . . . . 65Using History Bars to View Prior Conditions . . . . . . . . . . . . . . . . . . . 66Viewing a Summary of States in the Preceding Hour. . . . . . . . . . . . . 68Using CMW Logs to View Historical Data . . . . . . . . . . . . . . . . . . . . . 70
Chapter 7. Policies, Work Groups, Work Lists, and the User Choice Activity . . . . . . . . . . . . . . . . . . . . . . . . . . . . . . . . . 77Understanding Policies and Your Role in their Execution . . . . . . . . . . 78Understanding Work Groups and Work Items . . . . . . . . . . . . . . . . . . 80Acting on Work Items . . . . . . . . . . . . . . . . . . . . . . . . . . . . . . . . . . . . 81Reviewing the Results of Your Work . . . . . . . . . . . . . . . . . . . . . . . . . 85Other Actions You Can Take from the Work List Item Details View . . 88Using the Policy Microscope to Observe the Progress of a Policy . . . . 89
Chapter 8. Customizing Your Workstation . . . . . . . . . . . . . . . . . . . . . . . . .93Modifying Icon Size for a Situation . . . . . . . . . . . . . . . . . . . . . . . . . . 94Globally Modifying Icon Size . . . . . . . . . . . . . . . . . . . . . . . . . . . . . . . 95Customizing Reports . . . . . . . . . . . . . . . . . . . . . . . . . . . . . . . . . . . . . 97Additional Features You Can Customize . . . . . . . . . . . . . . . . . . . . . 102
Chapter 9. Monitoring Your System: Two Scenarios. . . . . . . . . . . . . . . . .103Case Study I: Status Change . . . . . . . . . . . . . . . . . . . . . . . . . . . . . . 104Case Study II: Using Advanced Automation to Resolve the Load_Critical Status Change . . . . . . . . . . . . . . . . . . . . . . . . . . . . . . 108
Appendix A. Customer Support . . . . . . . . . . . . . . . . . . . . . . . . . . . . . . . . .113Candle Customer Support. . . . . . . . . . . . . . . . . . . . . . . . . . . . . . . . 114
Glossary . . . . . . . . . . . . . . . . . . . . . . . . . . . . . . . . . . . . . . . . . . . . . . . .119
5
FIGURE 1. Candle Management Workstation Startup Window . . . . . . . . . . . . . . 28FIGURE 2. Candle Management Workstation Main Window . . . . . . . . . . . . . . . . 29FIGURE 3. Graphic View of Managed Object . . . . . . . . . . . . . . . . . . . . . . . . . . . 39FIGURE 4. Blue checkmarks denote acknowledged events . . . . . . . . . . . . . . . . . 41FIGURE 5. Enterprise - Events view . . . . . . . . . . . . . . . . . . . . . . . . . . . . . . . . . . 45FIGURE 6. Sample Current Attributes . . . . . . . . . . . . . . . . . . . . . . . . . . . . . . . . . 51FIGURE 7. Example Universal Message log. . . . . . . . . . . . . . . . . . . . . . . . . . . . . 58FIGURE 8. Historical View . . . . . . . . . . . . . . . . . . . . . . . . . . . . . . . . . . . . . . . . . 68FIGURE 9. Log - Icons window. . . . . . . . . . . . . . . . . . . . . . . . . . . . . . . . . . . . . . 70
FIGURE 10. EIB Changes Log . . . . . . . . . . . . . . . . . . . . . . . . . . . . . . . . . . . . . . . 71FIGURE 11. Status History Log. . . . . . . . . . . . . . . . . . . . . . . . . . . . . . . . . . . . . . . 72FIGURE 12. Operations Log . . . . . . . . . . . . . . . . . . . . . . . . . . . . . . . . . . . . . . . . . 74FIGURE 13. Managed system notification pop-up . . . . . . . . . . . . . . . . . . . . . . . . . 75FIGURE 14. Managed System Change Log. . . . . . . . . . . . . . . . . . . . . . . . . . . . . . 75FIGURE 15. Work list notification pop-up . . . . . . . . . . . . . . . . . . . . . . . . . . . . . . . 81FIGURE 16. Activity results - Details example . . . . . . . . . . . . . . . . . . . . . . . . . . . . 87FIGURE 17. Starting the microscope. . . . . . . . . . . . . . . . . . . . . . . . . . . . . . . . . . . 89FIGURE 18. Policy Microscope - Details window. . . . . . . . . . . . . . . . . . . . . . . . . . 91FIGURE 19. The Customize Tools dialog box . . . . . . . . . . . . . . . . . . . . . . . . . . . . 94FIGURE 20. Use the Properties settings page to globally modify icon size . . . . . . . 95FIGURE 21. Custom Report Editor . . . . . . . . . . . . . . . . . . . . . . . . . . . . . . . . . . . . 97FIGURE 22. Custom Report Editor with Conditions Selected . . . . . . . . . . . . . . . . 99FIGURE 23. Custom Report List . . . . . . . . . . . . . . . . . . . . . . . . . . . . . . . . . . . . . 100FIGURE 24. Custom Report Used to Filter the Selection . . . . . . . . . . . . . . . . . . . 100FIGURE 25. No Filter Used for Same Time Period . . . . . . . . . . . . . . . . . . . . . . . 101FIGURE 26. Load_Warning Condition . . . . . . . . . . . . . . . . . . . . . . . . . . . . . . . . 104FIGURE 27. Load_Critical Condition . . . . . . . . . . . . . . . . . . . . . . . . . . . . . . . . . 104FIGURE 28. Short-term History Bars of R&D_Node_A Managed Object. . . . . . . 105FIGURE 29. Defined Policy in Graphic View . . . . . . . . . . . . . . . . . . . . . . . . . . . . 109FIGURE 30. Work List Notification . . . . . . . . . . . . . . . . . . . . . . . . . . . . . . . . . . . 110FIGURE 31. Work List Showing Selection . . . . . . . . . . . . . . . . . . . . . . . . . . . . . . 110
List of Figures

6 Candle Management Workstation User’s Guide
FIGURE 32. Panel of Work Item Dialog Box Showing User Choices . . . . . . . . . . 111

7
Table 1. Chapters in this guide . . . . . . . . . . . . . . . . . . . . . . . . . . . . . . . . . . . . . 9Table 2. Symbols in Command Syntax . . . . . . . . . . . . . . . . . . . . . . . . . . . . . . 13Table 3. What’s New in Version 350 . . . . . . . . . . . . . . . . . . . . . . . . . . . . . . . . 15Table 4. Template Assignments for States . . . . . . . . . . . . . . . . . . . . . . . . . . . 105Table 5. Customer Support Phone Numbers. . . . . . . . . . . . . . . . . . . . . . . . . 116
List of Tables

8 Candle Management Workstation User’s Guide

9
Preface
About This GuideThis guide is intended to provide end users of Candle Command Center (CCC) products with a conceptual overview of the Candle Management Workstation to guide them in its use. See the Candle Management Workstation® Administrator’s Guide for details on setting up the CCC, authorizing users, and creating situations and policies. For details about a specific Candle Command Center product, see that product’s documentation
Chapters in this guideUse the table below to understand the organization and content of the chapters in this guide and to locate instructions and information on a particular topic.
Table 1. Chapters in this guide
Chapter name Content
“What’s New in CCC Version 350” on page 15
This chapter describes the new functions provided by this version of the Candle Command Center.
“Introducing Candle Command Center and the Candle Management Workstation” on page 17
This chapter provides an introduction to the Candle Command Center, detailing the relationship among the CCC components, the Candle Management Workstation, the supported platforms, on-line help, and user roles.
P
About This Guide
10 Candle Management Workstation User’s Guide
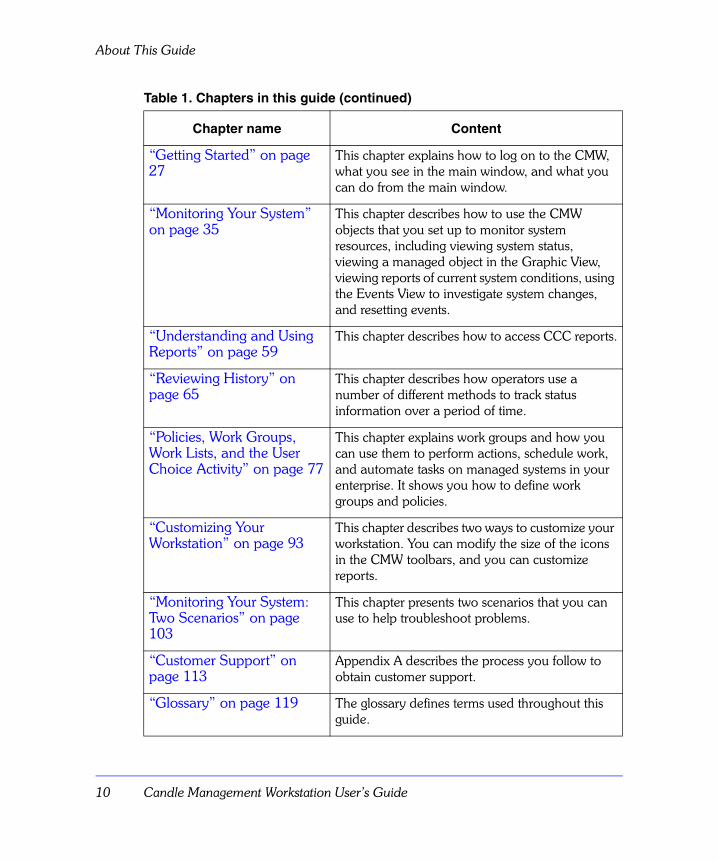
“Getting Started” on page 27
This chapter explains how to log on to the CMW, what you see in the main window, and what you can do from the main window.
“Monitoring Your System” on page 35
This chapter describes how to use the CMW objects that you set up to monitor system resources, including viewing system status, viewing a managed object in the Graphic View, viewing reports of current system conditions, using the Events View to investigate system changes, and resetting events.
“Understanding and Using Reports” on page 59
This chapter describes how to access CCC reports.
“Reviewing History” on page 65
This chapter describes how operators use a number of different methods to track status information over a period of time.
“Policies, Work Groups, Work Lists, and the User Choice Activity” on page 77
This chapter explains work groups and how you can use them to perform actions, schedule work, and automate tasks on managed systems in your enterprise. It shows you how to define work groups and policies.
“Customizing Your Workstation” on page 93
This chapter describes two ways to customize your workstation. You can modify the size of the icons in the CMW toolbars, and you can customize reports.
“Monitoring Your System: Two Scenarios” on page 103
This chapter presents two scenarios that you can use to help troubleshoot problems.
“Customer Support” on page 113
Appendix A describes the process you follow to obtain customer support.
“Glossary” on page 119 The glossary defines terms used throughout this guide.
Table 1. Chapters in this guide (continued)
Chapter name Content
11
Documentation Set
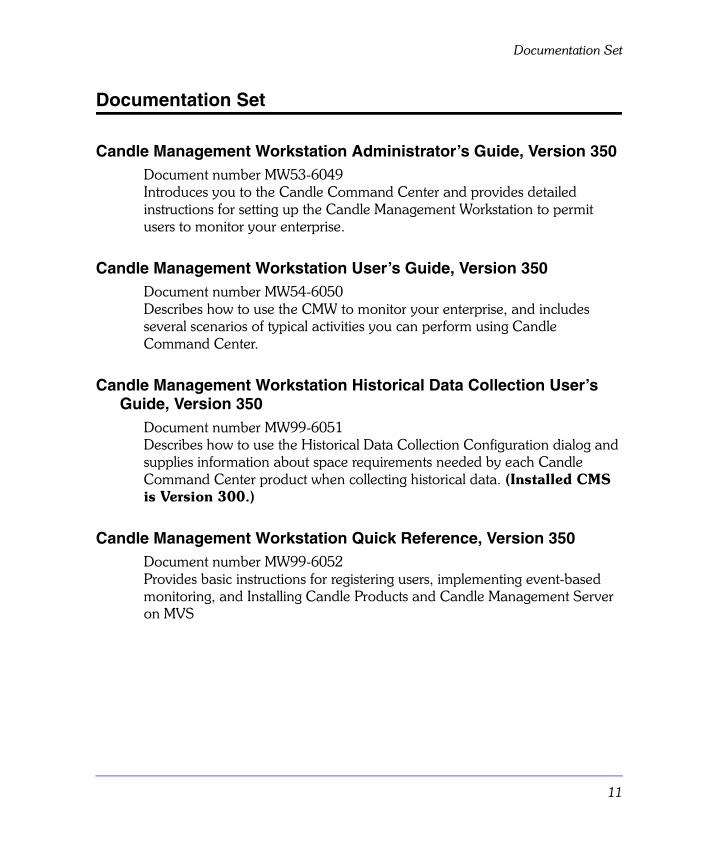
Documentation Set
Candle Management Workstation Administrator’s Guide, Version 350Document number MW53-6049 Introduces you to the Candle Command Center and provides detailed instructions for setting up the Candle Management Workstation to permit users to monitor your enterprise.
Candle Management Workstation User’s Guide, Version 350Document number MW54-6050Describes how to use the CMW to monitor your enterprise, and includes several scenarios of typical activities you can perform using Candle Command Center.
Candle Management Workstation Historical Data Collection User’s Guide, Version 350
Document number MW99-6051Describes how to use the Historical Data Collection Configuration dialog and supplies information about space requirements needed by each Candle Command Center product when collecting historical data. (Installed CMS is Version 300.)
Candle Management Workstation Quick Reference, Version 350Document number MW99-6052Provides basic instructions for registering users, implementing event-based monitoring, and Installing Candle Products and Candle Management Server on MVS
Documentation Conventions
12 Candle Management Workstation User’s Guide
Documentation Conventions
IntroductionCandle documentation adheres to accepted typographical conventions for command syntax. Conventions specific to Candle documentation are discussed in the following sections.
Panels and figuresThe panels and figures in this document are representations. Actual product panels may differ.
Revision barsRevision bars (|) may appear in the left margin to identify new or updated material.
Variables and literalsIn examples of command syntax, uppercase letters are actual values (literals) that the user should type; lowercase letters are used for variables that represent data supplied by the user. Default values are underscored.
LOGON APPLID (cccccccc)
In the above example, you type LOGON APPLID followed by an application identifier (represented by cccccccc) within parentheses.
Note: In ordinary text, variable names appear in italics.

13
Documentation Conventions
SymbolsThe following symbols may appear in command syntax:
Table 2. Symbols in Command Syntax
Symbol Usage
| The “or” symbol is used to denote a choice. Either the argument on the left or the argument on the right may be used. Example:
YES | NOIn this example, YES or NO may be specified.
[ ] Denotes optional arguments. Those arguments not enclosed in square brackets are required. Example:
APPLDEST DEST [ALTDEST]In this example, DEST is a required argument and ALTDEST is optional.
{ } Some documents use braces to denote required arguments, or to group arguments for clarity. Example:
COMPARE {workload} -REPORT={SUMMARY | HISTOGRAM}
The workload variable is required. The REPORT keyword must be specified with a value of SUMMARY or HISTOGRAM.
_ Default values are underscored. Example:
COPY infile outfile - [COMPRESS={YES | NO}]In this example, the COMPRESS keyword is optional. If specified, the only valid values are YES or NO. If omitted, the default is YES.

Documentation Conventions
14 Candle Management Workstation User’s Guide

What’s New in CCC Version 350 15
What’s New in CCC Version 350
Table 3. What’s New in Version 350
Feature Description
Security - Firewall Support You now have the extra protection of firewall support for your CCC products. In CCC version 350, support is provided for CMSs running behind a firewall. Under the CMW tab on the Logon panel, in the Partition-ID field, you can specify a location broker partition ID. The partition ID is specified only if the CMS is sitting behind a firewall that performs network address translation.
(Firewall support is not available for systems running the Tandem NonStop Kernel operating system.)
TCP/IP-based transport method added Support is provided for the TCP/IP- based transport method IP.pipe. On the CMS tab, when you click the Add TCP/IP... button, you can choose either IP or IP.pipe.
1

16 Candle Management Workstation User’s Guide

Introducing Candle Command Center and the Candle Management Workstation 17
Introducing Candle CommandCenter and the Candle
Management Workstation
IntroductionThis chapter gives you a brief overview of the Candle Command Center and the Candle Management Workstation..
Chapter ContentsWhat is CCC?. . . . . . . . . . . . . . . . . . . . . . . . . . . . . . . . . . . . . . . . . . . . . . 18Who Are the Users? . . . . . . . . . . . . . . . . . . . . . . . . . . . . . . . . . . . . . . . . . 21Automation . . . . . . . . . . . . . . . . . . . . . . . . . . . . . . . . . . . . . . . . . . . . . . . 24Releases . . . . . . . . . . . . . . . . . . . . . . . . . . . . . . . . . . . . . . . . . . . . . . . . . . 25
2
What is CCC?
18 Candle Management Workstation User’s Guide
What is CCC?Candle Command Center (CCC) is a suite of products. You can implement any number of these products to monitor your mainframe and distributed systems on a variety of platforms using a variety of workstations. You can add on CCC products as you require them.
CCC provides a way to monitor the availability and performance of all the systems in your enterprise from a designated workstation, the Candle Management Workstation. CCC allows you to monitor and manage diverse systems on diverse platforms throughout your network. You can use CCC to:
n establish your own performance thresholdsn create situations, which are conditions to monitorn create policies, which are situations resulting in automated actionsn monitor for alerts on the systems and platforms you are managingn trace the causes leading up to an alert
If you have a large enterprise, you may want to divide the monitoring to suit your organization. For example, you can divide your system administration or monitoring by any of the following:
n business applicationsn geographical locationsn types of systems, subsystems, or databases
Some CCC products provide services other than performance management. For example, you can use CCC for MQSeries Configuration to define and control your MQSeries systems.

Introducing Candle Command Center and the Candle Management Workstation 19
What is CCC?
What are the basic components of CCC?CCC consists of these basic components:
n Candle Management Workstation (CMW)
This component presents the information to your workstation and receives the options you select. It provides graphical and tabular views, settings sheets, menus, icons, and tree structures.
CMW, by default, presents date and time in the standard U.S. English format.
The CMW can run on a Windows 95, Windows 98, or Windows/NT workstation.
n Candle Management Server (CMS)
This component may consist of a hub server only or a hub and any number of remote servers. You decide whether you want to centralize server processing in a hub server, or decentralize server processing into remote servers that connect to a hub.
The hub server correlates the monitoring data collected by agents and remote servers and passes it to the CMW for presentation and your evaluation.
Servers can run on MVS, AS/400, Windows/NT, AIX, HP-UX, or Solaris.
n OMEGAMON® Monitoring Agents
A monitoring agent resides on the platform being monitored, collects the monitoring data, and passes it to the server to which it is connected.
Monitoring agents are available for systems such as ETEWatch, Lotus Notes, Windows NT, Oracle, Sybase, Informix, R/3, SQL Server, AIX, HP-UX, and Solaris.

What is CCC?
20 Candle Management Workstation User’s Guide
What systems are monitored?Some of the systems CCC can monitor are:
n middleware such as MQSeries and Tivolin operating systems such as OS400, Windows 95, Windows 98, or
Windows/NTn mainframe subsystems such as CICS and MVS Sysplexn database systems such as IMS, DB2, Oracle, Informix, Sybase, SQL
Servern end-to-end response time at each workstation in your enterprise, provided
by Candle’s ETEWatchn other systems such as Lotus Notes and R/3
This list is subject to change and expands with each CCC release.
Introducing Candle Command Center and the Candle Management Workstation 21
Who Are the Users?
Who Are the Users?In some enterprises, the system administrator and the general user are the same person. In larger enterprises, roles are often divided. For discussion, we will describe these roles separately, but they need not be performed that way. The workstation provides varying degrees of security or access to CCC features. You determine the level of access by various users according to the needs of your organization.
What does a system administrator do?A system administrator has the highest level of authority and can access all CCC features.
This list represents the types of tasks a system administrator might perform:
n grants access to other usersn creates workgroups and escalation workgroupsn sets thresholds for the attributes provided by a productn creates situations using the visual programming facilities of CCCn combines situations, which may be on diverse platforms, to create other
situationsn sets the severity of a situationn decides which situations apply to which managed systems, a process
called distributionn creates graphical views and places icons in them for monitoringn provides expert advice to display when certain situations evaluate truen creates policies, which are actions to take when situations evaluate true
For details about what a system administrator can do and how to do it, refer to the Candle Management Workstation Administrator’s Guide.

Who Are the Users?
22 Candle Management Workstation User’s Guide
What does a general user do?A general user observes the icons on the graphical view for changes in state. Typical alert colors are:
n Green for normal: no problemn Yellow for warning: there is potential for a critical problemn Red for critical: a critical status has been reachedn Blue for unknown: the status of the resource is unknown
Managed objects are systems or groups of systems (also known as aggregates) for which situations are being monitored. Icons are graphical representations of managed objects. Alert colors change within the icons to reflect status changes.
The logical tuning approach is to first investigate any critical problems and then look at warning states to prevent them from becoming critical.
When a warning or critical status is observed for a managed object, that is, the color has changed to yellow or red, you can do any of the following:
n display the events causing the alert n view the attribute values that caused each eventn look at the status of the managed object for the recent time periods
leading up to an event, as displayed by status history barsn look at logs for information about what may have caused the eventn notify a user at another workstation to investigate furthern depending on the type of alert, notify the person responsible for that
portion of the systemn acknowledge that a problem’s resolution is complete or in progress
For more information about what a general user can do, see the chapters “Monitoring Your System” on page 35 and “Reviewing History” on page 65.

Introducing Candle Command Center and the Candle Management Workstation 23
Who Are the Users?
How to get helpTo get help when using your workstation, you can
n use the various facilities available from the help pull-down. These include direct access to the CMW help contents or index, general help, or the CMW tutorial
n right-click any object or list item on your display and then select Open as Help from the context menu
n click the Help pushbutton, available on specific displays
To get acquainted with CCC, you can review the tutorial, which you can access by selecting Tutorial from the Help pull-down menu.
In addition to product help panels, you can refer to the product documentation set which is available in Acrobat-readable format on CD-ROM.
For your convenience, you can use the Candle Management Workstation Quick Reference which applies to the CMW and describes basic workstation facilities.
Automation
24 Candle Management Workstation User’s Guide
AutomationCCC allows you to automate many of the responses required to resolve system conditions it detects. Earlier releases of CCC provided “reflex automation.” Reflex automation allowed you to specify a system action to occur when a situation evaluated true. This CCC release provides “advanced automation.” Advanced automation lets you create policies. Policies specify a situation and what predefined set of commands to perform on what system, when the condition occurs.
You can also create a policy that gives an assigned user group a choice of predefined actions to take when the condition occurs.
You can also connect CCC to Candle automation components such as:
n Alert Adapters for Remedy and Peregrinen Alert Adapters and Alert Emitters for NetView, OpenView, Tivoli,
Unicentern AF/OPERATOR for MVSn OMEGACENTER Gateway for MVS

Introducing Candle Command Center and the Candle Management Workstation 25
Releases
ReleasesThe current CCC release is Version 350.
Is there compatibility between CCC releases?CCC products share the same workstation and server components of CCC. We recommend that when you install a new CCC product, you install the current release of the components that are shipped with the product.
You may already be running some CCC products with prior releases of CCC components. The newest release of the workstation and the server are compatible with the previous release of monitoring agents. Some of the new CCC features discussed later in this guide require only the new release of the server and workstation, while others also require the new release of monitoring agent.
We recognize that it may be not be practical for you to install all new monitoring agents at once. If that is the case, be aware that some new features require a new monitoring agent.
What’s new in this releaseCandle introduces new features in Candle Command Center Version 350. These features are available on all platforms unless otherwise noted. For details, see “What’s New in CCC Version 350” on page 15.

Releases
26 Candle Management Workstation User’s Guide

Getting Started 27
Getting Started
IntroductionThis chapter explains how to log on to the CMW, what you see in the main window, and what you can do from the main window.
Chapter contentsLogging On . . . . . . . . . . . . . . . . . . . . . . . . . . . . . . . . . . . . . . . . . . . . . . . 28The Candle Management Workstation Main Window . . . . . . . . . . . . . . . . 29Printing From the CMW . . . . . . . . . . . . . . . . . . . . . . . . . . . . . . . . . . . . . . 32Selecting Objects When Using the CMW. . . . . . . . . . . . . . . . . . . . . . . . . . 34
3

Logging On
28 Candle Command Center User’s Guide
Logging On
The CMW startup windowThe first time you start the CMW, the Candle Management Workstation Startup Window displays. Figure 1 shows the Candle Management Workstation Startup Window.
FIGURE 1. Candle Management Workstation Startup Window
Enter your logon ID and password. If you don’t know your logon ID or password, see your system administrator. You should also see your system administrator for assistance in filling out information required by the other tabs that comprise your logon script.

Getting Started 29
The Candle Management Workstation Main Window
The Candle Management Workstation Main WindowThe CMW main window is the first window that opens when you start a CMW session. This window is the entry point for defining objects and monitoring your system. By default, the content of the CMW main window displays as icons. Figure 2 shows the Candle Management Workstation main window with the Icons view. Depending on how the system administrator has set up your user privileges, you may not see the Administration icon.
FIGURE 2. Candle Management Workstation Main Window
The Icons view of the CMW main window shows these icons:n Enterprisen Administrationn Managed Systemsn Logn Status Overviewsn Universal Message Consolen Work Listn Reports: The Reports Icon displays in the CMW main window only if you
install one or more application packages. Each Candle product you install is represented with an icon in the CMW reports folder. To launch a report for any product, double-click its icon.

The Candle Management Workstation Main Window
30 Candle Command Center User’s Guide
n Configuration: This icon is present only if the Candle Command Center for MQSeries Configuration product has been installed.
The icons that appear in the CMW main window depend on the authority level and access privileges you have on the Candle Technologies-based products you have installed, and what filtering is set for the session. For example, if you do not have administration access privileges, you do not see the Administration icon.
Main window icon descriptions
Enterprise Icon
The Enterprise icon can display as shown in Figure 2. It may, however, be omitted from the Main window. Instead, you will be presented with a Status Overview icon. This icon represents the highest level managed object for which you have authorization. Double-click this top-level managed object to see all of the managed objects in the system that you are authorized to view.
Note: A managed object is an icon that represents one or more systems monitored by the Candle Command Center.
Administration Icon
Double-click this icon and the CMW administration window opens.
Managed Systems Icon
Double-click this icon and you can view all managed systems where CCC products are running.
Log Icon
Double-click this icon to view system-wide activity data in the Enterprise Information Base (EIB) Changes, Status History, and Operation logs.
Status Overviews Icon
A Status Overview icon is an representation of those objects in the enterprise you are authorized to view. Double-click this icon to view managed objects that represent aggregate (bundled) portions of the entire enterprise.

Getting Started 31
The Candle Management Workstation Main Window
Universal Message Console
Double-click this icon to activate the Universal Message Console. The Universal Message Console allows you to receive notification about monitoring and automation work flow in your own words and in your own language.
Work List Icon
Double-click this icon and the Work List Window Details view opens providing information on work items assigned to you.
Reports Icon
Double-click this icon to see current information on the status of managed systems where a Candle Technologies-based product is collecting data.
Configuration Icon
Double-click this icon to see current configuration information for your installed MQSeries product.

Printing From the CMW
32 Candle Command Center User’s Guide
Printing From the CMWYou can print the current screen image while in CMW by choosing the Print command from the upper left pulldown of any window. The title that appears on the top of each printed page comes from the title bar of the window where the print command was chosen. It can not be edited. When using the Print command, you can specify the following:
n The Properties button opens a dialog box which contains two tabs.
– On the Page Setup tab you can set the paper size, page orientation, double-sided printing if that is available on the printer you selected, and the number of copies to be printed.
– On the Advanced tab you can set the paper output, graphics resolutions, and paper size default setting.
n The Print what section allow you to choose between View and Report.
– The View radio button prints out a "snapshot" of the window the screen. If you adjust the frame of the window, the changes appear on the printed page.
– The Report radio button prints out a report in the standard report format. It is only available in the details or graphic views.
– The Font button allows you to pick different font types, font styles (such as bold), and font size. It only applies when printing reports. It will be grayed out when printing a view. The only type of fonts available are fixed point fonts. Other types of fonts loaded on your system will not appear in the font dialog. The default is Courier New, regular, 8 points.

Getting Started 33
Printing From the CMW
Choose the Page Setup command in the far left menu of any windowto set the following:
n Paper size
n Paper source
n Paper orientation
n Margins
The Font button allows you to pick different font types, font styles (such as bold), and font size. It only applies when printing reports. It will be grayed out when printing a view. The only type of fonts available are fixed point fonts. Other types of fonts loaded on your system will not appear in the font dialog. The default is Courier New, regular, 8 points.
The Printer button brings up a dialog that allows you to change printers.

Selecting Objects When Using the CMW
34 Candle Command Center User’s Guide
Selecting Objects When Using the CMWWhen selecting objects to work on when using the CMW, you use standard Windows techniques:
n To select a single object, click on it.
n To select multiple adjacent objects, click on the topmost object and then hold down the shift key while clicking on the object at the bottom of the list. The whole list will be selected.
n To select non-adjacent objects, click on the first object. Then hold down the control key and click on any other object you want to select. After you have selected the objects you want, right-click with the mouse and choose the appropriate command from the shortcut menu.
Monitoring Your System 35
Monitoring Your System
IntroductionThis chapter describes how to use the CMW objects that have been defined by a system administrator to monitor system resources.
Chapter contentsWhy Do I Want to Monitor and How Do I Do It? . . . . . . . . . . . . . . . . . . . 36Prerequisites to Monitoring Your System. . . . . . . . . . . . . . . . . . . . . . . . . . 38Monitoring Your System Graphically. . . . . . . . . . . . . . . . . . . . . . . . . . . . . 39Using the Events View to Investigate System Changes . . . . . . . . . . . . . . . 42About the Enterprise - Events View Window. . . . . . . . . . . . . . . . . . . . . . . 44Reviewing Advice Provided with a Situation . . . . . . . . . . . . . . . . . . . . . . . 47Using the Attribute View to Obtain Additional Information About an Event 50Acknowledging an Event . . . . . . . . . . . . . . . . . . . . . . . . . . . . . . . . . . . . . 53Resetting an Event . . . . . . . . . . . . . . . . . . . . . . . . . . . . . . . . . . . . . . . . . . 55Displaying the Universal Message Console . . . . . . . . . . . . . . . . . . . . . . . . 57
4
Why Do I Want to Monitor and How Do I Do It?
36 Candle Management Workstation User’s Guide
Why Do I Want to Monitor and How Do I Do It?
Why should I monitor resources?The reasons for monitoring system resources are:
n to understand current system conditions and resolve problems to which the CCC alerts you
n to review historical trends.
How do I monitor the current status of my enterprise?To monitor your enterprise and resolve problem conditions, you can:
n Monitor your enterprise graphically by following the lights. Starting from the Graphic view of the enterprise, you can visualize the status of the various managed systems in your enterprise by watching the managed object icons. When an event occurs that results in a critical or warning condition, the color of the managed object icon changes to red or yellow, respectively. In addition to the critical and warning states, managed object icons can also exhibit colors for status that is OK or unknown. See “Monitoring Your System Graphically” on page 39 for detailed information on using the Graphic view.
n See the big picture in a tabular view. The Events view provides a tabular representation of currently true situations that affect the status of a managed object. The Events view is a snapshot of system conditions at the time a situation assigned to that managed object evaluated to true. The Events view contains information only when an event has occurred that results in a status change. See “Using the Events View to Investigate System Changes” on page 42 for detailed information about using the Events view.
n Analyze information provided by CCC reports. Reports provide current statistics about the performance of all your distributed systems. You access reports from the Reports icon on the CMW main window. You can use the knowledge gained by reviewing reports to optimize system performance, pinpoint and avoid problem areas in your system, and determine what situations should be set up for monitoring. More information about reports is found in “Understanding and Using Reports” on page 59.
Monitoring Your System 37
Why Do I Want to Monitor and How Do I Do It?
How do I view historical data?The CMW provides several types of historical data about the managed objects you monitor.
n Historical view. The Historical view shows the state of a managed object for the preceding hour, either graphically or as tabular data.
n History bars. Real-time, short-term, and long-term history bars, show the states of managed objects over periods of time ranging from 15 minutes to 24 hours.
n Historical logs. The Enterprise Information Base (EIB) Changes log provides a record of changes to CMW objects. The Status History log is a record of changes in the status of managed objects. The Operations log provides information about CMS and situation monitor messages that occur on a specific managed system in your enterprise. The Managed System Status log displays up to the last 200 status changes to your managed systems.
n Short term history reports. You can find information on how to request short term history reports and how to specify the time interval for which you want short term history displayed in the section about reports in the individual CCC product manuals.
n Historical data collection in volume for later analysis. This function is described in detail in the Candle Management Workstation Historical Data Collection User’s Guide.
Chapter 4, “Reviewing History” on page 65, provides you with detailed information about using the Historical Reporting capability of the CMW.
Prerequisites to Monitoring Your System
38 Candle Management Workstation User’s Guide
Prerequisites to Monitoring Your System
Review the CMW On-line TutorialThe CMW on-line tutorial introduces you to many features of the CMW. Candle recommends that you become familiar with the terms discussed in the tutorial, and have a working knowledge of the CMW before you begin this chapter.

Monitoring Your System 39
Monitoring Your System Graphically
Monitoring Your System GraphicallyThe Graphic view is a graphic representation of your monitored distributed environment. It contains the managed objects whose appearance changes to reflect changes in the state of your managed systems.
When a change in status occurs, the light on the Enterprise icon changes color. Colors shipped with the CMW are Red (Critical), Yellow (Warning), and Green (OK). The system administrator can customize colors for your enterprise, if you wish. The most direct way to investigate a problem is to “follow the lights.” That is, when the color of a managed object icon changes, left-click the icon. Continue to left-click the icons in subsequent displays until you reach the source of the warning.
Using the Graphic viewOperators monitoring their portion of a distributed environment watch the Graphic view of their status overview for changes in the managed objects located there. The changes display in the icon itself or in history bars appearing to one side of the managed object. Operators use the CMW monitoring tools to determine specific information about the changes reflected in the managed objects. Figure 3 shows a Graphic view with a managed object called ATM_Canada.
FIGURE 3. Graphic View of Managed Object

Monitoring Your System Graphically
40 Candle Management Workstation User’s Guide
Procedure to view managed objects in the Graphic viewUse the following procedure to view managed objects in the Graphic view.
1. From the CMW main window, right-click the Enterprise icon to display a pop-up menu.
2. From the pop-up menu, click Open as Details. The Enterprise Details window displays.
3. Right-click on a managed object name, to select it and display a pop-up menu.
4. From the pop-up menu, select Open as Graphic.The Graphic view of the managed object displays.
Acknowledged events and the Graphic viewIn Figure 4 on page 41, some managed object icons are displaying blue checkmarks. This signifies that all of the events for those managed objects have been acknowledged. The checkmark indicates that while there may be important events active for a managed object, that is, there may still be problems to investigate or resolve, all of the events have been acknowledged by a user
(For information about creating and using acknowledgments, see “Acknowledging an Event” on page 53.)

Monitoring Your System 41
Monitoring Your System Graphically
FIGURE 4. Blue checkmarks denote acknowledged events

Using the Events View to Investigate System Changes
42 Candle Management Workstation User’s Guide
Using the Events View to Investigate System ChangesWhen an event occurs, managed objects in the Graphic view change their appearance to reflect changes in the system. You may also specify that, when an event occurs, the managed object associated with the event flashes, the CMW issues a beep, or a sound you assigned is played.
The CMW collects information about the system at the time an event occurs. To investigate why a managed object changed its appearance, use the Events view to obtain the details collected by the CMW. Unlike the Graphic view, in which you move to successively more granular levels of detail by “following the color” of managed object icons, the Events view provides all of the information with one mouse click. (The Events view is the default view that is displayed when you click on the Enterprise icon.)
Characteristics of an eventThere are four qualifiers that uniquely identify an event. Using these qualifiers ensures that you can more easily differentiate situations on the Events view at a glance. The qualifiers are:
n situation namen name of the managed system on which the event occurredn time at which the event occurredn Display Item. See “More about the use of the Display Item” on page 43.
Types of events
Sampled events n Sampled (using a situation) at regular monitoring intervals.
n Reflected in a managed object state.
n Automatically reset when the situation is no longer true.
n Automatically reset by using an Until within a situation.
For example, a situation triggers true when CPU utilization exceeds 90%. An event is triggered and will remain active until CPU utilization drops below 90%, at which time the event will automatically reset.

Monitoring Your System 43
Using the Events View to Investigate System Changes
Pure eventsn Unsampled, asynchronous notifications.
n Reflected in a managed object state.
n Not monitored at regular intervals.
n Reset manually.
For example, when an out-of-paper condition occurs on a printer, it triggers an event. The event cannot be automatically reset at the next monitoring interval, since the printer remains out-of-paper until an operator intervenes and adds paper. When the condition is remedied, the operator needs to manually reset the event at the CMW. See “Procedure to manually reset events” on page 56.
Note: You may not use Open as Current Attribute with a pure event.
More about the use of the Display ItemA Display Item is an attribute that the system administrator has designated to further qualify a situation. When a Display Item is defined, it results in more granularity when information is displayed on the Events view, as well as on the Situation Status – Details and Status History displays. Here is an example of how a Display Item qualifier is useful.
Let’s assume a disk full situation has been defined. To monitor 20 disks on the same managed system, you can see that, without the Display Item, each event would show identical situation names and managed system names. The system administrator could define 20 different situations, each having a situation name that includes the name of the disk being monitored. Instead, by using the Display Item, in this case the attribute disk_name, one situation can be defined to monitor for the disk full condition, and for each disk that becomes full, a separate event that includes the name of the full disk is raised.

About the Enterprise - Events View Window
44 Candle Management Workstation User’s Guide
About the Enterprise - Events View Window
When is data displayed in the Events viewIf no situations in your managed objects evaluate to true, the Events view remains empty. When a situation evaluates to true, the appearance of the Managed Object icon changes in the Graphic view to reflect the condition, and information about the event displays in the Events view for that managed object.
Using the Events view tree The Events view (Figure 5 on page 45) shows the hierarchy of managed objects as a tree diagram, with both sampled and pure events branching off managed objects. By default, the Events view opens with all branches of the tree fully expanded. A minus sign (–) next to each managed object icon indicates that the branch is expanded.
If you wish, you can collapse the tree at any branch by clicking the minus sign. A plus sign (+) next to an icon indicates that the branch is collapsed.

Monitoring Your System 45
About the Enterprise - Events View Window
FIGURE 5. Enterprise - Events view
Actions you can take to modify the Events viewThe information in the Events view is a snapshot of system conditions at a particular time. When you open the Events view for a managed object whose appearance has changed, you will see at least one line of information about the event. The toolbar at the top of the window permits you to:n print the view
n show or hide all events
n show or hide specific types of events: acknowledged, unknown, critical, warning, or user-defined
n pause automatic refresh of the window, or resume automatic refresh. You use the Pause button to freeze updates to the Events view while you are actively using the Events tree for navigation to investigate a problem.
About the Enterprise - Events View Window
46 Candle Management Workstation User’s Guide
n refresh the window now. This circular arrow turns blue when there is new data available for display.
The actions on the toolbar can also be accessed from the View pulldown menu.
Procedure to display information in the Events viewUse the procedure below to open the Events view of a managed object whose state has changed.
1. Select an object whose state has changed.
2. Right-click on the managed object.Result: A pop-up menu displays.
3. Select the situation that has changed.
4. From the pop-up menu, select Open as Events.Result: Information about the time and situation that triggered the event displays.
Note: If you have assigned a user-defined state to a managed object, be aware that user-defined states cannot be seen by the top-most level Enterprise managed object but only from the specific managed object created from the template. That is, the Enterprise Events view does not display user-defined events that are raised. The user-defined event is only displayed if the Events view of its managed object is opened.
What if a situation is stopped?If a situation is stopped, if that situation has caused an event to be raised, the state of the managed object for which an event has been raised continues unchanged. Thus, for example, if the history bar for an object is showing red to indicate a critical event, it will remain red after the situation is stopped.
When you review the cause of a raised event by reviewing the Events view, the Events view indicates that the situation is stopped. Further, for any situation that has been stopped, you will be unable to launch the attributes view for the event from the Events view.

Monitoring Your System 47
Reviewing Advice Provided with a Situation
Reviewing Advice Provided with a SituationWhen the CMW raises a situation, creating an Event in the Events view or a line in the Status History Log, you may need to act on that situation. For some situations, your System Administrator has provided advice that you can access. The advice can be a short sentence or two, or can be many pages of information. You use the Open as Advice option to review the advice. The Open as Advice option will not be selectable for any situation that does not have advice.
Use this procedure to view advice for a situation displayed in the Events view or in the Status History Log. (Lines in the Status History Log represent raised policies as well as raised situations. You can view advice for only those lines that represent raised situations.)
1. Right-click the situation.
2. Select Open as Advice. One of the following will occur:n The Advice pop-up dialog for the situation displays.
n The contents of a text file or URL displays in your default web browser.
n Both the Advice dialog and the contents of a text file or URL displays.
3. Review any advice that was created for the situation.
4. Select OK to continue and, if a text file or web page is open, close it.
What types of advice are provided?When you click Open as Advice for a given situation, you are presented with advice in one of several forms:
1. You may receive the Advice dialog that presents you with a sentence or two of advice, as shown in the next figure.

Reviewing Advice Provided with a Situation
48 Candle Management Workstation User’s Guide
2. If your System Administrator has provided the address of a file or web page when defining the advice, you will see the contents of that file or web page rather than the Advice dialog containing a few sentences of advice.

Monitoring Your System 49
Reviewing Advice Provided with a Situation
3. Your System Administrator can provide a combination of the above approaches. When you request advice:1. You receive the Advice dialog showing as its text the address of the URL
or text file containing extended advice text. When you press enter on the Advice dialog, you are shown a few sentences of advice in the dialog.
2. In addition, the expanded advice contained in a text file or web page is displayed in your default web browser.

Using the Attribute View to Obtain Additional Information About an Event
50 Candle Management Workstation User’s Guide
Using the Attribute View to Obtain Additional Information About an Event
You can view additional details about the situation that triggered the event by reviewing its Attribute view. To display the Attribute view, place the cursor over the name of the situation that triggered the event and right-click to select a type of Attribute view from the pop-up menu that is presented.
Note: If the situation that triggered the event is shown in the Events view as being stopped, you will be unable to launch the Attribute view.
Types of Attribute views in the Events viewTwo types of Attribute views are available in the Events view:
n Initial Attributes view (default view) – Opening the Initial Attributes view, provides details of the situation that triggered the true condition, including the attribute name, specifying the condition and the threshold value. To view an actual value that exceeded the threshold value, you need to open the Current Attributes view.
n Current Attributes view – Opening the Current Attributes view, provides the attribute name and the actual system value that exceeded the threshold value defined in the situation. Figure 6 shows a sample Current Attributes view.

Monitoring Your System 51
Using the Attribute View to Obtain Additional Information About an Event
FIGURE 6. Sample Current Attributes
If the situation returns a large amount of results data, which you choose to review using an Attributes view, it may appear that your CCC system has hung, when in reality it is reading the returned data. To alleviate this potential problem, and to limit the amount of data returned when the situation evaluates true, your system administrator can use a Display Item when defining the situation. You can read more about the Display Item in “More about the use of the Display Item” on page 43.
Viewing expanded attribute informationIf the attribute value is followed by . . ., the attribute value extends beyond the column width. To display the complete attribute value, right-click the attribute value, and select Show Expanded Value from the pop-up menu. A window with the complete attribute value displays.
Procedure to look at the Initial Attributes viewUse the following procedure to look at the Initial Attributes view.
1. From the Events view, place the cursor over the situation that triggered the event and right-click.Result: A pop-up menu displays.
2. From the pop-up menu, select Open as Initial Attributes.Result: The Initial Attributes view displays. This view contains information about the situation, its attributes, and threshold values that described a condition being monitored on a managed object.
3. Close the Initial Attributes view by double-clicking the icon in the upper-left corner of the view. The Events view displays.
Procedure to look at the Current Attributes viewUse the procedure below to look at the Current Attributes view of a situation that describes an event that occurred.
1. From the Events view, place the cursor over the situation that changed and right-click.

Using the Attribute View to Obtain Additional Information About an Event
52 Candle Management Workstation User’s Guide
Result: A pop-up menu displays.
2. From the pop-up menu, select Open as Current Attributes.Result: The Current Attributes view displays. You can view current information about the situation that caused the event to occur.
3. Close the Current Attributes view by double-clicking the icon in the upper-left corner of the view. Result: The Events view displays.

Monitoring Your System 53
Acknowledging an Event
Acknowledging an Event
About event acknowledgmentYou use the event acknowledgment feature to:
n indicate that you have taken ownership of and are working on a specific problem related to the event
n manually reduce the severity contributed by an event to the overall severity reflected for that event’s managed object. When all events for a managed object have been acknowledged, the managed object displays a blue checkmark.
What can you acknowledge?You can acknowledge:
n a newly raised event
n a previously acknowledged event
n a manually resurfaced event
n an automatically expired event
Creating an acknowledgmentTo acknowledge an event
1. From the Events view, right-click the event.
2. Select Create Acknowledgment from the pop-up menu.Result: CMW displays the Acknowledgment window.
3. Optionally, select Insert Time to enter the current hub time in the Notes box.
4. Enter some descriptive freeform text about the problem.
5. Adjust the expiration setting if necessary.
6. Select OK to create the acknowledgment.

Acknowledging an Event
54 Candle Management Workstation User’s Guide
CMW records your user ID and the time the acknowledgment was created. On the Events view, the event’s icon changes to indicate that the event has been acknowledged.
Changing the status of an acknowledgmentYou use the Open as Acknowledgment feature to:
n view an existing acknowledgment
n update the text for an acknowledgment
n discard or retract an acknowledgment
To do so, from the Events view:
1. Right-click an acknowledged event
2. Click Open as Acknowledgment from the pop-up menu.
3. To update the acknowledgment, add text to the Notes section or adjust the expiration setting. Then click OK.
4. To discard or retract the acknowledgment, select Remove. Then click OK.You can also view an acknowledgment, a resurfaced event, or an expired event from the Status History or Hot Console logs.

Monitoring Your System 55
Resetting an Event
Resetting an EventIf the situation is no longer true at the next monitor interval, the CMW automatically resets sampled events. If you have “Reset Event” user authority, you can reset an event yourself if you do not want to wait for the monitor interval to occur.
Note: The Reset Event pop-up menu only appears if you have “Reset Event” authority.
Pure events require manual resettingThe CMW does not automatically reset pure events, since the state associated with the situation remains the same until an operator intervenes. For example, when an out-of-paper condition occurs on a printer being monitored by that situation, it triggers an event. The event cannot be automatically reset at a monitor interval, since the printer remains out of paper until an operator intervenes and adds paper. When the condition is remedied, the operator needs to manually reset the event.
Methods to reset eventsYou can manually or automatically reset sampled events. You cannot automatically reset a pure event. Pure events must be reset manually. The following section provides directions for manually resetting events. The system administrator can cause an event to be reset automatically by adding an Until condition to an existing situation. You need system administrator authority to define an event to be reset automatically. The procedure for adding an Until condition to a situation is found in Candle Management Workstation Administrator’s Guide.

Resetting an Event
56 Candle Management Workstation User’s Guide
Procedure to manually reset eventsUse the procedure below to manually reset sampled and pure events.
1. Open the Events view for the managed object whose event you want to reset. Result: The Events view displays.
2. Right-click the event description you want to reset. Result: A pop-up menu displays.
3. From the pop-up menu, select Reset Event.Result: The event is reset.
For information on automatically resetting events, see the Candle Management Workstation Administrator’s Guide.

Monitoring Your System 57
Displaying the Universal Message Console
Displaying the Universal Message ConsoleThe Universal Message Console displays messages received as a result of the CMW’s generation of universal messages. You, together with the system administrator, can specify the generation of universal messages when the system administrator creates situations and policy actions. The following options can be specified:
n the category of messages you want to see (for example, critical, warning, information)
n the severity of the message
n the message text you want when the situation occurs.
Because you enter the text to be displayed, the Universal Message Console allows you to receive notification about monitoring and automation work flow in your own words and in your own language.
The Universal Message Console is a “hot” console. That is, it is automatically refreshed as new messages appear. Using the Universal Message Console, you can observe the status of your system or the execution of situations or policies on an ongoing basis.
Activating the Universal Message ConsoleTo activate the Universal Message Console, follow these steps:
1. From the CMW Main window, click on Universal Messages. CMW displays a window in which you select the managed system you want to monitor.
2. After you have selected the managed system to be monitored, click OK. The Universal Message Console is now active.

Displaying the Universal Message Console
58 Candle Management Workstation User’s Guide
An example Universal Message log is illustrated in Figure 7.
FIGURE 7. Example Universal Message log

Understanding and Using Reports 59
Understanding and UsingReports
IntroductionThis chapter explains how to
n view a report
n use the settings dialog for a report
n adjust the amount of data that displays in a report
n open a terminal session from a report
Chapter contentsReports Overview. . . . . . . . . . . . . . . . . . . . . . . . . . . . . . . . . . . . . . . . . . . 60Viewing Reports . . . . . . . . . . . . . . . . . . . . . . . . . . . . . . . . . . . . . . . . . . . . 61Using the Report Settings Dialog . . . . . . . . . . . . . . . . . . . . . . . . . . . . . . . 62Adjusting the Amount of Data Displayed in a Report . . . . . . . . . . . . . . . . 63Opening a Terminal Session from a Report. . . . . . . . . . . . . . . . . . . . . . . . 64
5
Reports Overview
60 Candle Management Workstation User’s Guide
Reports OverviewReports provide real-time and historical information about system performance. You can use information from reports to optimize system performance, pinpoint and avoid problem areas in your system, and decide which situations to monitor.
Using reports to view system informationReports provide real-time and historical information about general system performance, regardless of whether an event has occurred. Access reports from the Reports window. Depending on which Candle Command Center products you have installed, you may be able to access reports from managed objects. Your user access and authority settings control what reports of managed systems you are able to view.
What information does a report provide?Reports provide information such as:
n amount of available memory
n amount of disk space
n number of users logged on
n where users are logged on
n amount of CPU time applications are using
Use report information to recognize usage trends and decide what attributes to use in situations for monitoring.
The Export feature saves report data for use in other programsThe Export feature helps you save report information for historical purposes. It allows you to save report data to an ASCII file format used by database and spreadsheet programs.
Additional informationFor more information about reports and specific report features included with a specific product, see the CCC User’s Guide for that product.

Understanding and Using Reports 61
Viewing Reports
Viewing ReportsTo view a report you have to start the agents for the managed system you want to monitor. If there are no agents running, the reports window will be empty.
Report availability depends upon:
n the Candle products you have installed
n the managed system types you chose for this session
You can open a report from the reports window or directly from a managed system of your choice.
Viewing a Report from the Reports Window
1. Double click the Reports icon in the CMW main window.
2. Double click the Report icon of your choice.
3. Click the View menu to open other related reports or charts.
Viewing a Report from a Managed System
1. Double click the Managed Systems Icon in the CMW main window.
2. Right click the managed system of your choice.
3. Choose Open as Reports from the popup menu.
4. Click on a the report you want from the list of reports that appears.
Using the Report Settings Dialog
62 Candle Management Workstation User’s Guide
Using the Report Settings Dialog The Report Settings dialog allows you to customize your reports. You can:
n select the columns to appear on the report
n change the background
n select the rows of data to include
n sort by column
n for some CCC for MQSeries reports, adjust the amount of data that appears in a report
n cause a report to be refreshed at an interval you specify
The View menu in a report window allows you to toggle between the icon view of the report and the Reports Settings dialog.You can also open the Reports Settings dialog by right clicking the report, then choosing Open as Settings from the popup menu.
Understanding and Using Reports 63
Adjusting the Amount of Data Displayed in a Report
Adjusting the Amount of Data Displayed in a ReportSometimes a report is too big to display all at once. It either takes too long to open or it can’t open at all depending on your system resources. For some CCC for MQSeries reports, you can set the number of beginning or ending rows that will appear and CMW will omit the balance of the data.
The Sort and Include functions are not supported when using First N/Last N.
Setting the Report Output
1. Double click on the report icon of the qualifying MQSeries report for which you want to limit output.
2. From that report’s window, right click on the queue manager name displayed.
3. From the pop-up menu displayed, select Open as Settings. Then access the First N/Last N dialog through the Report Output tab.
4. Click the Show first radio button and use the up or down arrows to set the number of rows you want to see at the beginning of the report.or...
5. Click the Show last radio button and use the up or down arrows to set the number of rows you want to see at the end of the report.
6. Click OK.If you want to be prompted for the number of rows to be displayed every time you open the report, click on the Prompt every time check box.
The default value for First N/Last N is 200 rows. If you want to use the changes you’ve made as the default each time you open the report, click on the Use selected as default check box.

Opening a Terminal Session from a Report
64 Candle Management Workstation User’s Guide
Opening a Terminal Session from a ReportThe ability to open as terminal session is only available with certain types of reports, depending on the CCC products you have installed and your product configuration.
1. Right click a row of data in the report.
2. Choose either the Open as Terminal or Zoom to OMEGAMON in the popup menu. If the capability does not exist for the reasons cited above, the command will not appear in the popup menu when you right-click in the report.

Reviewing History 65
Reviewing History
IntroductionThis chapter describes how operators use three different methods to track status information over relatively short periods of time.
It does not address collection and analysis for short term history reports. You can find information on how to request short term history reports and how to specify the time interval for which you want short term history displayed in the individual CCC products’ manuals in the discussion of product reports.
In order to collect the data required for the generation of short term history reporting, you must start historical data collection as documented in the Candle Management Workstation Historical Data Collection User’s Guide in the chapter entitled “Invoking and Running the HDC Configuration Program.”
Initiating the collection of large amounts of long-term historical data and its warehousing to a relational database using Open Database Connectivity, or its conversion to delimited flat files using programs distributed with the Candle Command Center are addressed in the Candle Management Workstation Historical Data Collection User’s Guide.
Chapter contentsUsing History Bars to View Prior Conditions . . . . . . . . . . . . . . . . . . . . . . . 66Viewing a Summary of States in the Preceding Hour . . . . . . . . . . . . . . . . 68Using CMW Logs to View Historical Data . . . . . . . . . . . . . . . . . . . . . . . . . 70
6
Using History Bars to View Prior Conditions
66 Candle Management Workstation User’s Guide
Using History Bars to View Prior ConditionsYou can use history bars in the Graphic view to display the status of managed objects over varying lengths of time. You can monitor performance over time and identify trends or recurring problems.
The color of each cell of a status history bar represents the state that was dominant during that interval. If two states occur for the same amount of time, the CMW detects the more severe state as the dominant state. You can also choose to display the most severe state that occurred during that period. It displays as a triangle over each section.
Types of history barsThere are three types of history bars:
n real-time
n short-term
n long-term
Changing the settings for history barsYou can determine which managed objects have history bar displays and the types of bars to display. You can also customize the look of the history bars on your screen.
n From the View pull-down in the Enterprise Graphic view, check or uncheck history bars to enable or cancel display of history bars for that managed object.
n Use the History Bars page of the managed object’s Settings window to select which type of bars to display for each managed object, if any, and to select vertical or horizontal orientation.
n Use the History Bars page of the Settings window for the CMW main window to set the total duration for all types of history bars, the number of cells for short-term bars, and the number of blocks and cells per block for long-term bars.
n Use the State Warning page of the Settings window for the CMW main window to set the refresh interval for the history bars.

Reviewing History 67
Using History Bars to View Prior Conditions
Displaying status of up to 15 minutesReal-time history bars display current state changes. There are no cells. You can configure the total time duration for 5, 10, or 15 minutes. This same information displays in the Historical view.
Use real-time history bars for detailed monitoring of critical managed objects. Instead of showing the dominant state during a particular interval, real-time history bars show the actual state changes.
Displaying status of up to 60 minutesShort-term history bars display the status of managed objects for a total duration of 15, 30, 45, or 60 minutes. You can divide short-term bars into sections called cells. The number of cells may be 2, 3, 4, 5, 6, 8, 9, 10, or 12.
The amount of time each cell represents depends on how many cells you select and the total time represented by the bar. For example, if you set the total duration for 30 minutes and divide the bar into 6 cells, each cell represents status over a period of 5 minutes.
Displaying status of up to 24 hoursLong-term history bars consist of either 2 or 4 blocks comprising either 2, 4, or 8 cells each. The total bar represents a time interval of 1, 2, 4, 8, 12, or 24 hours. For example, if the total duration is 8 hours, and you have 4 blocks of 2 cells, each cell represents 1 hour.

Viewing a Summary of States in the Preceding Hour
68 Candle Management Workstation User’s Guide
Viewing a Summary of States in the Preceding HourThe Historical view shows the most severe states of monitored systems for the preceding hour. This view uses the combined image of a radar screen and a clock. The single pointer moves as the minute hand on a clock, leaving a color-coded trail of system conditions behind it.
Viewing changes in the preceding hourUse the Historical view to see how the status of a managed object changed on a minute-by-minute basis over the preceding hour. You can then use the History feature to collect multiple clock views to do trend analysis and determine when objects tend to be used most, or when most problems occur. This type of analysis can help you plan how to more tightly tune your network in the future.
Figure 8 shows an example of the Historical view.
FIGURE 8. Historical View

Reviewing History 69
Viewing a Summary of States in the Preceding Hour
Viewing the summary of states in the preceding hourUse the procedure below to view the summary of states in the preceding hour.
1. Right-click a managed object to display a pop-up menu.
2. From the pop-up menu, select Open as Historical.Result: The Historical view displays.

Using CMW Logs to View Historical Data
70 Candle Management Workstation User’s Guide
Using CMW Logs to View Historical DataThe CMW provides these logs of historical information:
n Enterprise Information Base (EIB) Changes log
n Status History log
n Operations log (if you are running any Version 200 or later Omegamon Monitoring Agents)
n Managed System Change log (if you are running CCC Version 300)
You can access the logs from the Log - Icons window, illustrated in Figure 9.
FIGURE 9. Log - Icons window
EIB Changes logThe EIB Changes log contains a record of changes made to CMW objects. An entry in the EIB Changes log lists the type of object changed, its name, what happened to it, and the user ID of the person who made the change.

Reviewing History 71
Using CMW Logs to View Historical Data
Figure 10 shows an example of the EIB Changes log.
FIGURE 10. EIB Changes Log
Searching for a column heading
To search for information by a column heading, select Find from the Edit pull-down.
Setting time spans
Use the following procedure to access the EIB Changes log and set time spans.
1. From the CMW main window, double-click the Log icon.Result: The Log Icons window displays.
2. Double-click the EIB Changes log. Result: The Time Span Selection window displays.
Note: The default time span setting is one hour.

Using CMW Logs to View Historical Data
72 Candle Management Workstation User’s Guide
3. Click on a radio button in the Pre-defined Time Spans box to select a time span limiting the contents of the EIB Changes log.
Note: Use the Custom Time Span window to further define the time span. Click on the Help button in the Custom Time Span window for procedures.
4. Click OK to search the log for entries in the time span you defined.Result: The log Details view displays log entries.
5. Close the Details view by double-clicking the EIB Changes log icon in the upper-left corner.Result: The Log Icons window displays.
Status History logThe Status History log provides a list of all status changes that occur in all situations defined to the CMW. Data includes the name of the managed system where the situation runs, the name of the situation, the situation status (raised or reset), and the time the change occurred. Figure 11 shows an example of the Status History log.
FIGURE 11. Status History Log
Setting time spans
Use the following procedure to access the Status History log and set time spans.
1. From the CMW main window, double-click the Log icon. Result: Icons representing each log display.

Reviewing History 73
Using CMW Logs to View Historical Data
2. Double-click the Status History log. Result: The Time Span Selection window displays.
Click on a radio button in the Pre-defined Time Spans box to select a time span limiting the contents of the Status History log.
Note: Use the Custom Time Span window to further define the time span. Click on the Help button in the Custom Time Span window for procedures.
3. Click OK to search the log for entries in the time span you defined.Result: The log Details view displays log entries.
4. Close the Details view by double-clicking the Status History log icon in the upper-left corner. Result: The Log Icons window displays.
Automatically refreshing Status History log information using Hot Console
When viewing the Status History Log display, you previously manually refreshed the window to see updated status.
When using Version 300, new events are added to the display as soon as they are written to the log. You no longer need to perform a manual refresh. You initiate the function by selecting Open as Hot Console from a pop-up or pull-down menu or from the Time Span dialog of the Status History Log. Hot Console is simply a different way of viewing the Status History Log. When using Hot Console for the display, you can specify:
n how often to refresh the display
n whether to display entries in ascending or descending order
n how many rows of information CMW should maintain

Using CMW Logs to View Historical Data
74 Candle Management Workstation User’s Guide
Operations logThe third type of CMW log, the Operations log for an agent, is used primarily to determine problems that may have occurred at the agent, rather than for historical purposes. Figure 12 shows the Operations log.
FIGURE 12. Operations Log
The Operations log lists situation monitor messages that occur on a specific managed system in your enterprise. This log provides a list of message-related information about specific managed systems, including:
n Local Timestampingn Message IDn Message Textn SeverityTo view the information in the Operations log:
1. Double-click the Operations icon. Result: The Select a Managed System window appears. (However, if there is only one managed system online, this window is not displayed. Rather, CMW opens that system’s operations log directly. Steps 2 and 3 are omitted.)
2. Select a managed system and click OK. Result: The Time Span Selection Window appears.
3. Select the time period for the log entries you want to view and click OK. Result: The log appears.

Reviewing History 75
Using CMW Logs to View Historical Data
Managed System Change logThe Managed System Change log is available from the Managed System pulldown in the Managed Systems - Details window or by right-clicking the Managed Systems icon from the CMW Main window. You can also display this window by pressing the Change Log pushbutton on the managed system notification pop-up. This notification pop-up (Figure 13) is displayed only when you have specified Notify for managed system changes on the CMW Properties settings page.
FIGURE 13. Managed system notification pop-up
The Managed System Change Log (Figure 14), an automatically-updated window, keeps track of up to the last 200 managed system status changes. For each change, the log contains the timestamp indicating when the change occurred, the managed system name, and the status of the managed system.
FIGURE 14. Managed System Change Log

Using CMW Logs to View Historical Data
76 Candle Management Workstation User’s Guide

Policies, Work Groups, Work Lists, and the User Choice Activity 77
Policies, Work Groups,Work Lists, and the
User Choice Activity
IntroductionThis chapter explains advanced automation using policies, work groups and work lists.
Chapter contentsUnderstanding Policies and Your Role in their Execution . . . . . . . . . . . . . 78Understanding Work Groups and Work Items. . . . . . . . . . . . . . . . . . . . . . 80Acting on Work Items . . . . . . . . . . . . . . . . . . . . . . . . . . . . . . . . . . . . . . . . 81Reviewing the Results of Your Work . . . . . . . . . . . . . . . . . . . . . . . . . . . . . 85Other Actions You Can Take from the Work List Item Details View . . . . . . 88Using the Policy Microscope to Observe the Progress of a Policy. . . . . . . . 89
7

Understanding Policies and Your Role in their Execution
78 Candle Management Workstation User’s Guide
Understanding Policies and Your Role in their Execution
What is a policy?When using CCC Version 200 or later, you have the option of using its advanced automation facilities. Advanced automation combines complex automated system processes, called policies, to resolve system problems. When it is required, a policy can wait for human intervention and decision-making before proceeding further.
A policy is a series of automated steps called activities. Policies are created by your system administrator and then distributed to various managed systems on which they run. A policy performs actions, schedules work to be performed by users, or automates manual tasks. For example, a policy can:
n monitor for an average system CPU usage of 95% and, when that event occurs, reduce the priority of each job found using more than 20% of the CPU. In this case, no human intervention is required.
n monitor excessive page-ins and page faults, and when either event occurs, write the process name and ID to a log where an application or a person can analyze the results at a later time.
Policies that require user intervention are defined by the administrator using the user choice activity. The user choice activity requests intervention and places the policy in a wait state. When the user choice activity portion of a policy starts, a work list item is generated and sent to the work group designated by the system administrator when the policy was created.
What is a work group?A work group is a way to organize users so that they can respond to a request from a policy for user intervention. The system administrator typically sets up work groups to respond to requests for user intervention. Policies that request user intervention send the request to a work group. The request is called a work item. When the system administrator sets up a policy that requires user intervention, the administrator specifies the ID of the work group that is to respond to the policy’s request for intervention.

Policies, Work Groups, Work Lists, and the User Choice Activity 79
Understanding Policies and Your Role in their Execution
The administrator can also specify an escalation group to receive the policy’s work request. If a work item is not responded to within a specified period of time, it is sent from the work group that received it originally to the escalation group.
Understanding Work Groups and Work Items
80 Candle Management Workstation User’s Guide
Understanding Work Groups and Work Items
Handling work itemsWork items appear on a work list. Every user has a work list. The list will be empty, however, unless the user belongs to one or more work groups and there are outstanding work items for any of those groups. Anyone in a work group can respond to a work item belonging to that work group. Your work list contains all of the work items for all of the work groups to which you belong.
For example, you may belong to a work group responding to work items that deal with jobs using excessive system resources. (It is possible that you are the only member of that work group, or there may be several members assigned.) When a policy detects that a job is using too much CPU, it sends a work item to your work group requesting that you hold or end the job. The work item is placed on your work list and on the work lists of other members of your work group. The work group member who has time responds to the work item.
Once a work group member responds to a work item, it is removed from every member’s work list. If another work group member was also viewing the same work item at the same time it was responded to, that work group member is notified that the work item is no longer active. No other members can then take action on the work item, nor can they transfer or escalate it.
What if no-one responds?If no one in the work group responds to the item within the time specified by the system administrator when the policy was created, the work item is automatically removed from your work group's work list and sent to the group specified as the escalation group, assuming one was specified.
Anyone in the work group can also manually transfer a work item to another work group.
Work items can only be escalated once but can be transferred an unlimited number of times.
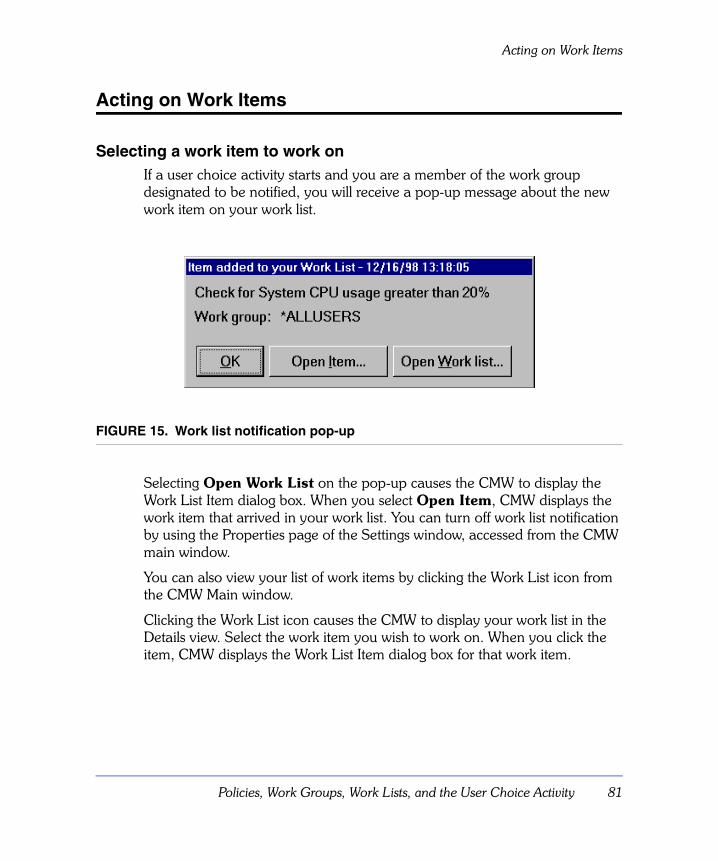
Policies, Work Groups, Work Lists, and the User Choice Activity 81
Acting on Work Items
Acting on Work Items
Selecting a work item to work onIf a user choice activity starts and you are a member of the work group designated to be notified, you will receive a pop-up message about the new work item on your work list.
FIGURE 15. Work list notification pop-up
Selecting Open Work List on the pop-up causes the CMW to display the Work List Item dialog box. When you select Open Item, CMW displays the work item that arrived in your work list. You can turn off work list notification by using the Properties page of the Settings window, accessed from the CMW main window.
You can also view your list of work items by clicking the Work List icon from the CMW Main window.
Clicking the Work List icon causes the CMW to display your work list in the Details view. Select the work item you wish to work on. When you click the item, CMW displays the Work List Item dialog box for that work item.

Acting on Work Items
82 Candle Management Workstation User’s Guide
Using the Work List windowWhen you click the Work List icon from the CMW Main window, CMW displays the Work List window. What you see in the Work List window depends on the view that you are using. You can open the Work List window in one of two views:
n Details view
n Settings view
Details view
The Details view provides the following information about each work item in the window:
n Work List Item – The content of the message that was entered when the user choice activity was created.
n Status – The status of the work item; for example, transferred, escalated, timed out, etc.
n Policy – The name of the policy that generated the work item.
n Activity – The specific activity in the policy that generated the work item.
n Managed system name – The name shown depends on the mode in which the policy is running, but may be the name of the CMS, the name of the host machine connected to the CMS, or the name of a managed system.
n Work Group – The name of the work group to which the work item was sent.
n Escalation Group – The name of the group to which the work item will be escalated, if that name is available.
n Arrival time – The local CMW time at which the work item was received.
n Due time – The time at which the work item will time out.
Policies, Work Groups, Work Lists, and the User Choice Activity 83
Acting on Work Items
Settings view
The Settings view permits you to define the way the Work List window looks. You can use the pages of the Settings window to:
n Define the sort sequence for items being displayed
n Change the background color or image of the window
n Set the default view for the window
n Change the icon associated with the window
Taking action on a work itemOn the work list item dialog box in the user choice area, you can choose to take action on the work item. To take action on a work item:
1. Click Take Action. Result: A list of available actions appears. Once you select an action from the list that is presented to you, the action you choose appears in the Action Information box.
2. Click OK to execute the selected action.
3. Close the Work List Item dialog box. The results of your taking action can produce a return code that a policy can use to determine its next activity.
When it’s time for you to take action on a work item, the CMW automatically verifies your user ID and password. If the system administrator has set a different user ID and password for certain actions, you will be prompted to enter the alternate user ID and password.

Acting on Work Items
84 Candle Management Workstation User’s Guide
Transferring a work itemYou can transfer work items to other work groups that may be better able to handle the items or have more time or resources, provided another user is not already working on the work item. To transfer the work item:
1. Open the Work List Item icon from the CMW main window. Result: Your work list opens in the Details view.
2. Select the entry you want to transfer. Result: The CMW displays the Work List Item dialog box.
3. On the Work List Item dialog box, click Transfer to work group.
4. Select a work group and click OK to execute the transfer.
5. Close the Work List Item dialog box.
NOTE:Work items can be transferred indefinitely. Review work items to ensure they are acted on in a reasonable time frame.
Escalating a work itemTo escalate a work item, follow the instructions above under "Transferring a Work Item." When the Work List item dialog box appears, click Escalate. The work item is escalated to the default escalation work group. A work item is escalated only if your system administrator has defined a default escalation group when the policy was created and the item has not already been escalated.
Policies, Work Groups, Work Lists, and the User Choice Activity 85
Reviewing the Results of Your Work
Reviewing the Results of Your Work
Reviewing reports from work listsYou can view reports from the Work List window, if a Reports window exists, by one of two methods:
n Right-click a work list item from the Details view and select Open as reports.
n Select a work list item from the Details view; then, from the Work List Item dialog box, select the Reports push-button.
Reviewing activity statusThe Activity Status Details view is available whenever a user choice activity is included in a policy, that activity generates a work item, and that work item is still outstanding. This view provides the following information:
n Timestamp – Date and time on which the message associated with the named activity was generated.
n Activity name – Name of the activity that generated the message.
n Status – The type of status entry this record is.
n Start/End code – The reason why the activity started or how it terminated.
n Reason – Additional information about the endcode appearing in the previous column.
Accessing the Activity Status Details viewTo access the Activity Status Details view:
1. Select a work item from the Details view. Result: The CMW displays the Work List Item dialog box.
2. From this dialog box, select the Activities push-button to display the Activity Status Details view. The status line of this display identifies the policy name and the managed system name on which the activities have occurred. The

Reviewing the Results of Your Work
86 Candle Management Workstation User’s Guide
managed system name may be the name of a CMS where the policy is running, the name of a host system attached to the CMS, or the name of a managed system. The Activity Status Details view is a snapshot of the status of the activities comprising a policy that preceded the user choice activity. That is, this facility permits you to see what has occurred during the running of a policy before the policy was suspended waiting for you or a member of your work group to manually intervene.
You can select any of the activities listed on the Activity Status Details view to obtain activity results. The next section tells you how.
Viewing activity resultsWhen the system administrator defined the policy you are interested in, a possible option for the policy was to save the results of the activities comprising the policy. The Activity Results window contains information only if the administrator checked the Save Activity Results checkbox on the Status settings page for policies. To access activity results, right-click a specific activity on the Activity Status Details view as described in the preceding section.
Activity results are only available for situation-related activities - that is, an embedded situation or evaluate situation activity. The activity results provided show the termination status of the activity. If there are activity results for the activity you selected, the pop-up menu displayed contains the menu item Open Results. This menu item will not be present if there is no saved activity result information for you to view.
Click Open Results to see the Activity Results view, which provides the following information:
n Managed system – The name of the managed system on which the policy is running.
n Attribute – A list of the attributes associated with the situation that is running.
n Value – The value for each attribute at the point in time at which the policy ran.
n Comparison – The triggering attribute(s) used for comparison purposes to determine when a situation will evaluate true.

Policies, Work Groups, Work Lists, and the User Choice Activity 87
Reviewing the Results of Your Work
Figure 16 illustrates the Activity Results window.
FIGURE 16. Activity results - Details example

Other Actions You Can Take from the Work List Item Details View
88 Candle Management Workstation User’s Guide
Other Actions You Can Take from the Work List Item Details View
In addition to the actions described above, you can right-click any work list item on the Details view and select:
n Open as Help – Permits you to view Help information for this panel.
n Open as Reports – Permits you to view reports only if the Reports window exists.
n LaunchPad – Permits you to select from a list of customized executables defined for you by your system administrator. The executable can be an operating system command or executable program available on the CMW. The selection is executed at the CMW at which you are working. For example, you can:
– Display a list of files in a particular directory by selecting the DIR operating system command
– View a personal document by selecting a call to a word processor
– Start a telnet session to a particular managed system in your enterprise
– Link to the Internet using your favorite browser
– Invoke your personal BAT file

Policies, Work Groups, Work Lists, and the User Choice Activity 89
Using the Policy Microscope to Observe the Progress of a Policy
Using the Policy Microscope to Observe the Progress of a Policy
The policy microscope provides in-depth information about how a policy is behaving. While the policy microscope is of use primarily to the system administrator, you can use the policy microscope to:
n Confirm that a policy is running
n Observe the real-time progress of the policy for each managed system
n View the attribute data returned by situations
The microscope permits your system administrator to:
n Test policies more thoroughly
n Diagnose problems with policies
You can start a microscope from either the Policies - Details window (Figure 17 ) or the Managed Systems: Manage Policy Status window. Either way, the same microscope window is created.
FIGURE 17. Starting the microscope
Using the Policy Microscope to Observe the Progress of a Policy
90 Candle Management Workstation User’s Guide
Using the policy microscope windowThe Policy Microscope window displays status information for all activities for all managed systems. You can filter the data based on the content of any of the report columns.
The Status Line (beneath the Menu bar) contains:
n The policy name and the name of the CMS on which the policy is being monitored.
n The number of status entries shown in the folder.
n The maximum number of status entries that the folder can contain
Columns in the folder show:
n The timestamp when the activity started
n The activity’s name
n The activity’s status
n The start/end code
n The reason
n Optionally, correlation mode. If the selected policy is one that runs in correlate mode, a column will be included whose heading reflects the correlation mode of the policy. If included, this column's heading can be one of the following:
– Managed System
– Host Name
– Host Address
– Business Application
Figure 18 on page 91 illustrates the Policy Microscope - Details window. In this figure, a column named Managed System is included, indicating that this policy was defined as Correlate by Managed System. To find out more about correlate mode, see the Candle Managment Workstation Administrator’s Guide chapter entitled “Setting Up Policies to Automate Your Environment.”

Policies, Work Groups, Work Lists, and the User Choice Activity 91
Using the Policy Microscope to Observe the Progress of a Policy
FIGURE 18. Policy Microscope - Details window
You can set the number of column entries and the order in which they are displayed in the Policy Microscope Settings window.
When you right-click on a row that contains results data, a pop-up menu appears that gives you the option to open the Activity Results window for that activity. To view an example Activity Results window, see Figure 16 on page 87.
Starting the policy microscopeIf you don’t have policy Start/Stop Authority, you can only start a policy microscope if the policy is already running. For more information, refer to the Candle Management Workstation Administrator’s Guide.
To start Policy Microscope from either the Administration: Policy: Details window or the Managed Systems: Manage Policy Status window:
1. Right click on a policy.Result: CMW displays a pop-up menu of available commands.
2. Choose the Start Policy Microscope command from the list.
Using the Policy Microscope to Observe the Progress of a Policy
92 Candle Management Workstation User’s Guide
Result: CMW displays a list of managed systems if the microscope has been started from the Policy: Details window. If started from the Managed System: Managed Policy Status window, the managed system is already known.
3. Click on the policy you want to view. Result: CMW displays the Start Policy Microscope dialogue.
4. Click on the Yes button if you want CMW to restart the policy when the Microscope starts running.Click on the No button if you don’t want the policy to be restarted. In this case, only subsequent trace entries created by the policy will appear in the microscope window.
5. CMW now displays the Policy Microscope window.If you try to start a microscope on a policy that is already running, you will receive subsequent activity status updates. If the Start Policy Microscope command doesn't appear in the pop-up menu when you right-click, it means that the Candle Management Server (CMS) does not support the policy microscope feature.
Running multiple microscopesYou can run multiple microscopes concurrently for different policies from the same CMW; you can also run multiple microscopes concurrently for a given policy if that policy is distributed to multiple servers. In addition, concurrent microscopes for the same policy running on the same server can be run from different CMWs.
Stopping the policy microscopeTo stop a Policy Microscope, close the microscope window associated with it.
A policy will continue running in microscope mode on the server until all CMW users examining that policy on that server close their microscope windows.
When the Candle Management Server deactivates microscope for a policy, the policy continues running; it is not restarted.

Customizing Your Workstation 93
Customizing Your Workstation
IntroductionThis chapter describes two features that allow you to customize your workstation. You can modify the size of the toolbar icon, and you can create custom reports.
Chapter contentsModifying Icon Size for a Situation . . . . . . . . . . . . . . . . . . . . . . . . . . . . . . 94Globally Modifying Icon Size . . . . . . . . . . . . . . . . . . . . . . . . . . . . . . . . . . 95Customizing Reports. . . . . . . . . . . . . . . . . . . . . . . . . . . . . . . . . . . . . . . . . 97Additional Features You Can Customize . . . . . . . . . . . . . . . . . . . . . . . . . 102
8
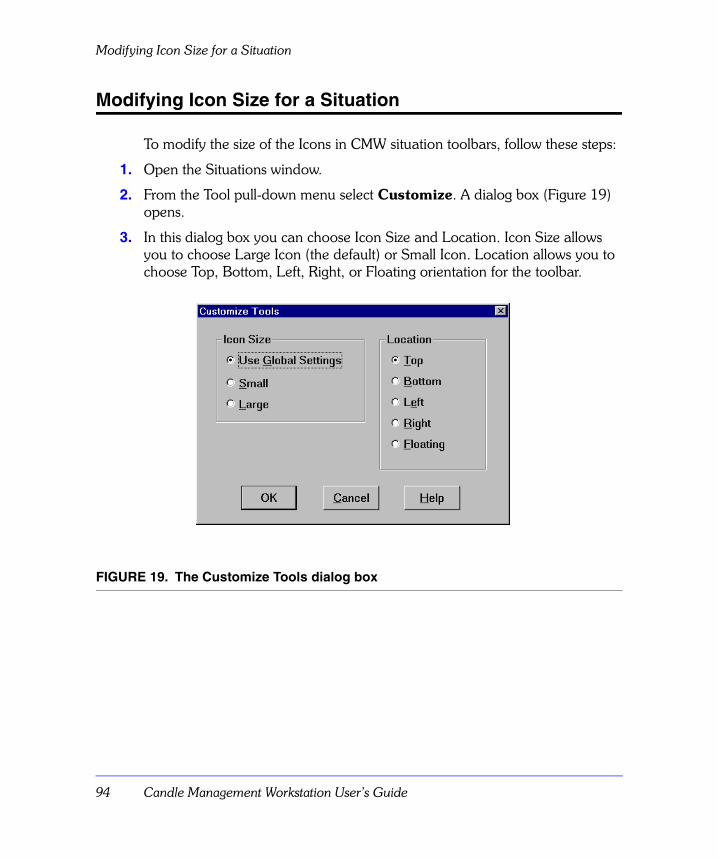
Modifying Icon Size for a Situation
94 Candle Management Workstation User’s Guide
Modifying Icon Size for a Situation
To modify the size of the Icons in CMW situation toolbars, follow these steps:
1. Open the Situations window.
2. From the Tool pull-down menu select Customize. A dialog box (Figure 19) opens.
3. In this dialog box you can choose Icon Size and Location. Icon Size allows you to choose Large Icon (the default) or Small Icon. Location allows you to choose Top, Bottom, Left, Right, or Floating orientation for the toolbar.
FIGURE 19. The Customize Tools dialog box
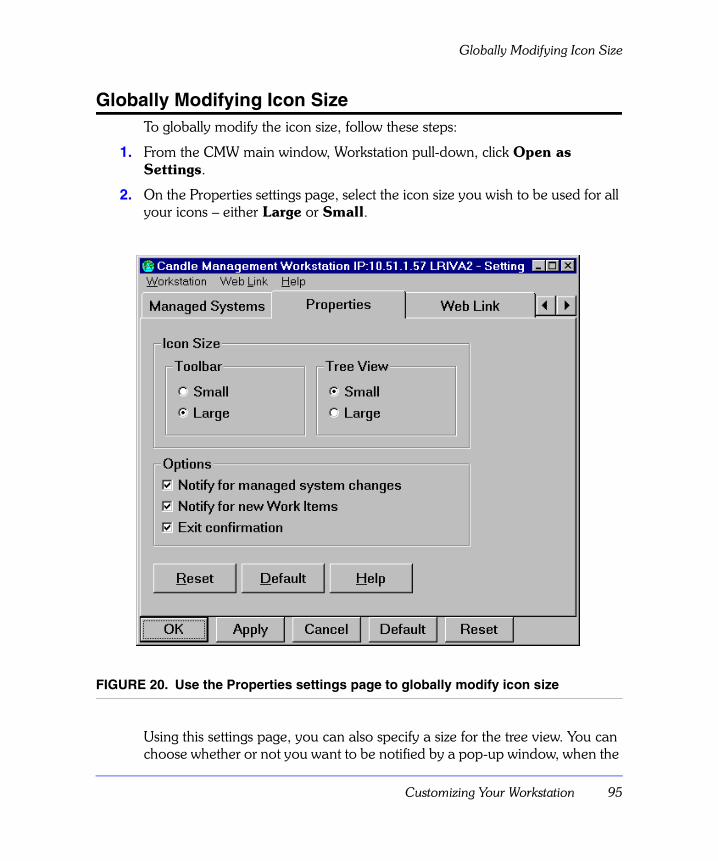
Customizing Your Workstation 95
Globally Modifying Icon Size
Globally Modifying Icon SizeTo globally modify the icon size, follow these steps:
1. From the CMW main window, Workstation pull-down, click Open as Settings.
2. On the Properties settings page, select the icon size you wish to be used for all your icons – either Large or Small.
FIGURE 20. Use the Properties settings page to globally modify icon size
Using this settings page, you can also specify a size for the tree view. You can choose whether or not you want to be notified by a pop-up window, when the

Globally Modifying Icon Size
96 Candle Management Workstation User’s Guide
status of a managed system changes or when a new work item is added to your work list.
You can also specify whether or not you want to be queried to confirm your exit from the CMW.

Customizing Your Workstation 97
Customizing Reports
Customizing Reports
Creating a custom reportTo create a customized version of any product-provided Details view, use the Custom Report Editor. The customized version of the view, report, or log, is referred to as a custom report. By specifying a logical condition, you can limit the range of data in one or more columns of a report. The custom report that you create contains only rows with values inside that range.
The following example shows one way to create a customized version of any report or log:
1. From the CMW main window, select the Log icon.
2. Right-click on the Status History icon.
3. Select Edit Custom Report. The Custom Report Editor appears, as shown in Figure 21.
Note: There are many ways to get to the Custom Report Editor. This is just one way.
FIGURE 21. Custom Report Editor

Customizing Reports
98 Candle Management Workstation User’s Guide
4. If any fields in the editor contain information, click Clear at the bottom of the Custom Report Editor to clear all fields.
5. In the View drop-down list, select the view for which you want to create the custom report.
Note: If you navigated to this window by clicking Create on the Select Custom Report window, you cannot change the view.
6. Type the name of the new report in the Custom Report drop-down list.
7. Now you must select the attributes that you want to qualify. You can qualify as many of the attributes as are required by your condition.
A. Click on the attribute you want to qualify with a value. The cell to the right of the attribute name splits into 2 sections, allowing you to create a logical condition for the attribute.
B. Expand the drop-down list in the first cell and select an arithmetic operator. In our example, we selected =
C. If the second cell has a drop-down list, select a value from the list. If there is no drop-down list, type a value. String values are case sensitive. In our example, we enteredpebble.candle.com:KUX
Note: In some instances, the horizontal width of the right section of the Condition column will be too small for you to view a second value entry field or determine that what appears to be an entry field is actually a drop-down list box. After splitting the Condition field, we recommend you enlarge the field by placing the mouse pointer over the right edge of the column and dragging the column edge to the right.
D. To add another condition for this attribute, click the ... box.Another condition cell appears to the right of the existing cell.
Note: The CMW combines multiple conditions for one attribute with the Boolean OR operator.
E. Repeat steps A through D until you have defined all the attributes you need for this custom report.

Customizing Your Workstation 99
Customizing Reports
Figure 22 shows the Custom Report Editor with our selections made.
FIGURE 22. Custom Report Editor with Conditions Selected
Note: The CMW combines multiple attributes with the Boolean AND operator.
In our example, we’ll add an operator and condition for the attribute situation_name.
8. If you want to review the arithmetic expression that defines the custom report, click Expression. The expression appears in Structured Query Language (SQL), which may use different symbols than those in the matrix.
9. If you navigated to this window by clicking Create on the Select Custom Report window, click OK to save and view the new custom report.
10. If you navigated to this window by clicking Edit Custom Report on the pop-up menu of an object:n Click Save to save the new custom report
OR
n Click OK to save the new custom report and exit the editor

Customizing Reports
100 Candle Management Workstation User’s Guide
Figure 23 shows the Custom Report List.
FIGURE 23. Custom Report List
Figure 24 shows the Status History – Details view when we use the custom report to filter the selection.
FIGURE 24. Custom Report Used to Filter the Selection

Customizing Your Workstation 101
Customizing Reports
Figure 25 shows the Status History – Details view when we don’t use the filter for the same time interval. You can see there are several more descriptions.
FIGURE 25. No Filter Used for Same Time Period
In addition to creating a new custom report with the Custom Report Editor, you can
n create a second custom report from an existing one
n create a temporary custom report to view now
n modify a custom report
n change the name of a custom report
n delete a custom report
n move or reposition columns to make them more or less visible or closer to the front of the report
n delete columns whose information you do not find useful
Using a custom report as your default viewTo have the new custom report be the default view when you click on the report or log icon, you must modify the Settings page for the report or log. You also can elect to use the custom report every time, or you can select to have a prompt displayed allowing you to choose which report you want to see.

Additional Features You Can Customize
102 Candle Management Workstation User’s Guide
Additional Features You Can CustomizeOther popular customizable options are described briefly below.
Reporting on HistoryYou can modify History Bar settings as described in “Changing the settings for history bars” on page 66. You can use the Time Span settings page to select a global default time span for all historical views (logs and reports).
n Select Prompt every time if you want CMW to prompt for a date and time range each time you open the details view of a log or report.
n Select Use selected if you want CMW to use a specific date and time range you have previously selected each time you open the details view of a log or report. You select the date and time range from a pulldown list provided on this settings page.
Audible and visual signalsUsing the State Warning settings page, available by selecting Open as Settings from the Workstation pulldown, you can:
n Cause an icon to flash when an event occurs
n Cause a beep to occur or a sound you assign to be played when an event occurs
n Set the interval at which the icon flashes or the sound lasts
n Set the severity level at which these warnings occur
Using the web linkOn the Web Link settings page, available from the Main window, you can specify the default path to your web browser. Then, whenever you choose to go to the web, this browser will be used. You can also choose to manually enter the path to the web browser you want to use. In this case, no default browser is invoked.
Monitoring Your System: Two Scenarios 103
Monitoring Your System:Two Scenarios
IntroductionThis chapter presents two scenarios that you can use to help troubleshoot problems.
Chapter contentsCase Study I: Status Change. . . . . . . . . . . . . . . . . . . . . . . . . . . . . . . . . . 104Case Study II: Using Advanced Automation to Resolve the Load_Critical Status Change . . . . . . . . . . . . . . . . . . . . . . . . . . . . . . . . . . . . . . . . . . . . 108
9
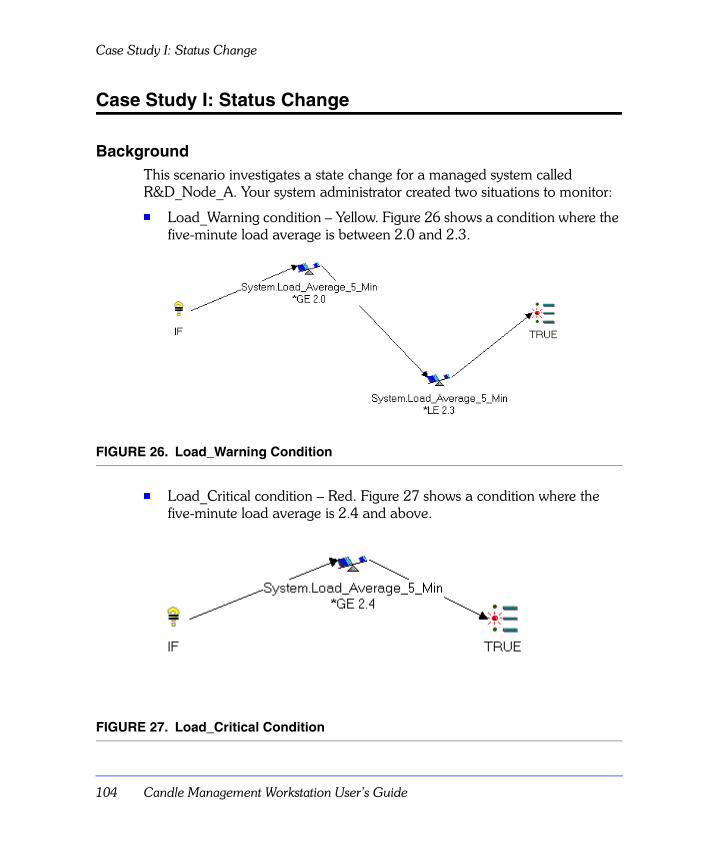
Case Study I: Status Change
104 Candle Management Workstation User’s Guide
Case Study I: Status Change
BackgroundThis scenario investigates a state change for a managed system called R&D_Node_A. Your system administrator created two situations to monitor:
n Load_Warning condition – Yellow. Figure 26 shows a condition where the five-minute load average is between 2.0 and 2.3.
FIGURE 26. Load_Warning Condition
n Load_Critical condition – Red. Figure 27 shows a condition where the five-minute load average is 2.4 and above.
FIGURE 27. Load_Critical Condition

Monitoring Your System: Two Scenarios 105
Case Study I: Status Change
In addition, your system administrator assigned both the Load_Warning and Load_Critical situations to the Node template with the state settings shown in Table 4.
The system administrator created an instance of the Node template called R&D_Node_A in your status overview managed object and distributed it to the managed system of the same name on the network you monitor.
Monitoring R&D_Node_AView the R&D_Node_A managed object in the Graphic view of your status overview object. You chose to display short-term history bars using the History Bars page of the R&D_Node_A settings window. The resulting display of the R&D_Node_A managed object in your status overview looks like that shown in Figure 28.
FIGURE 28. Short-term History Bars of R&D_Node_A Managed Object
Table 4. Template Assignments for States
State NameSituations Assigned Color
Severity Level
OK Not Applicable Green N/A
Warning Load_Warning Yellow 30
Critical Load_Critical Red 90
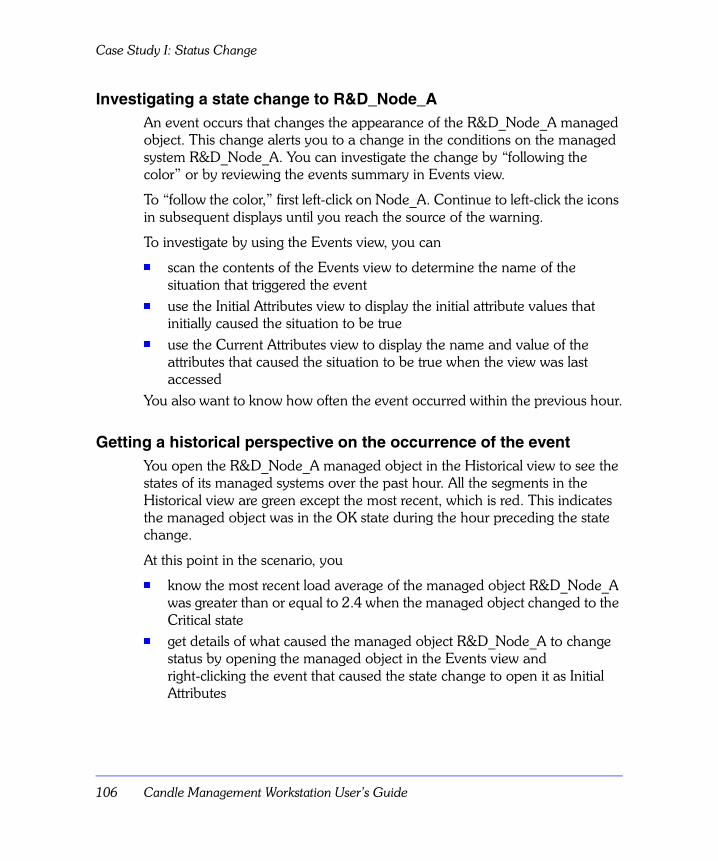
Case Study I: Status Change
106 Candle Management Workstation User’s Guide
Investigating a state change to R&D_Node_AAn event occurs that changes the appearance of the R&D_Node_A managed object. This change alerts you to a change in the conditions on the managed system R&D_Node_A. You can investigate the change by “following the color” or by reviewing the events summary in Events view.
To “follow the color,” first left-click on Node_A. Continue to left-click the icons in subsequent displays until you reach the source of the warning.
To investigate by using the Events view, you can
n scan the contents of the Events view to determine the name of the situation that triggered the event
n use the Initial Attributes view to display the initial attribute values that initially caused the situation to be true
n use the Current Attributes view to display the name and value of the attributes that caused the situation to be true when the view was last accessed
You also want to know how often the event occurred within the previous hour.
Getting a historical perspective on the occurrence of the eventYou open the R&D_Node_A managed object in the Historical view to see the states of its managed systems over the past hour. All the segments in the Historical view are green except the most recent, which is red. This indicates the managed object was in the OK state during the hour preceding the state change.
At this point in the scenario, you
n know the most recent load average of the managed object R&D_Node_A was greater than or equal to 2.4 when the managed object changed to the Critical state
n get details of what caused the managed object R&D_Node_A to change status by opening the managed object in the Events view and right-clicking the event that caused the state change to open it as Initial Attributes

Monitoring Your System: Two Scenarios 107
Case Study I: Status Change
Another resource to view is the Status History log. It contains a list of changes that occurred on R&D_Node_A for a day or more prior to this state change. When you examine the Status History log, you check for high load averages that were responsible for other Warning or Critical states that may have been triggered by Load_Warning or Load_Critical situations.
Results of the investigationThis information can help you confirm whether the most recent increase in load average resulted from an on-going workload problem or from a workload increase that occurred in the last few minutes. You can then manually rebalance the workload, if that solution is indicated by the results of your investigation, or you can use advanced automation to assist in rebalancing the workload automatically.

Case Study II: Using Advanced Automation to Resolve the Load_Critical Status Change
108 Candle Management Workstation User’s Guide
Case Study II: Using Advanced Automation to Resolve the Load_Critical Status Change
BackgroundIn the previous scenario, you saw the way in which you could identify a critical CPU load status change, investigate its cause, and determine whether there were any historical occurrences of the event. Using the information you obtained from CCC, you could then manually rebalance the workload. The scenario in this section takes the same situation and imbeds it in a policy that uses the facilities of CCC to present you with some options (user choices) predefined by the system administrator so that you can take appropriate action.
Figure 29 illustrates how the Graphic view of the CPU_Load_Critical_Reduce policy might appear on your workstation. In the policy, you set up an initial situation that will become true when CPU load exceeds 2.4 in a 5 minute interval. The policy waits until the initial situation becomes true. When this initial situation becomes true, it triggers an Evaluate Situation activity pro-gram. That activity program evaluates another situation that identifies any jobs using more than 20% of the available CPU. When an offending job is found, the CMW sends you a message (Work List Notification), the content of which was specified by the system administrator when defining the associated user choice activity.

Monitoring Your System: Two Scenarios 109
Case Study II: Using Advanced Automation to Resolve the Load_Critical Status Change
FIGURE 29. Defined Policy in Graphic View
Monitoring the display while working on other tasksAs in the previous scenario, you can monitor R&D_Node_A waiting for a color change. But it is more likely that you are working on other day-to-day tasks you need to accomplish. You have relegated the monitoring display to a corner of your display screen where you can scan it occasionally for problems.
In this scenario, when the CPU load exceeds 2.4, the R&D_Node_A managed object shows a color change. In addition, this time when any jobs using 20% or more of the CPU are identified, and you are in the designated Work Group, the CMW generates a Work Item and a Work List Notification pop-up appears on your display. See Figure 30.

Case Study II: Using Advanced Automation to Resolve the Load_Critical Status Change
110 Candle Management Workstation User’s Guide
FIGURE 30. Work List Notification
Viewing the work listClick on the Open Work List button in the Work List Notification dialog box to display your work list. From the Work List – Details display, select the work item you want to work on, in this case, doing something about the job that is using more than 20% of the CPU. Figure 31 shows the Work List with your desired work item selected.
FIGURE 31. Work List Showing Selection
Selecting this work item presents you with a Work Item dialog box that includes a list of predefined actions, as shown in Figure 32. The list of actions could include terminating the offending job(s) or lowering the jobs' priority.

Monitoring Your System: Two Scenarios 111
Case Study II: Using Advanced Automation to Resolve the Load_Critical Status Change
FIGURE 32. Panel of Work Item Dialog Box Showing User Choices

Case Study II: Using Advanced Automation to Resolve the Load_Critical Status Change
112 Candle Management Workstation User’s Guide

113
Customer Support
Appendix ContentsCandle Customer Support . . . . . . . . . . . . . . . . . . . . . . . . . . . . . . . . . . . 114
A

Candle Customer Support
114 Candle Management Workstation User’s Guide
Candle Customer Support
IntroductionCandle Corporation offers a comprehensive maintenance and support plan to ensure you realize the greatest value possible from your Candle software investments. We have more than 200 technicians worldwide, committed to providing you with prompt resolutions to your support requests.
Customer Support hours of operation are from 5:30 A.M. – 5:00 P.M., Pacific Time. In the event of an after-hours or weekend emergency, Candle's computerized call management system ensures that a technician will return your call within one hour. For customers located outside of North America, after-hours and weekend support is provided by Candle Customer Support locations in the United States.
Electronic supportCandle provides information and support services through
n Candle's home page at www.candle.com. You can use the Candle Worldwide Web Site to
– open problem records
– access maintenance information
– order products or maintenance
– access IBM compatibility information
– download fix packs for distributed products
– read news and alerts
– scan a list of scheduled Candle education classes
n Candle Electronic Customer Support (CECS), an electronic customer support facility. You can access this facility using the IBM Global Network. You can use CECS to:
– open problem records
– search our database for solutions to known problems
115
Candle Customer Support
– look for answers to commonly asked questions
– read news and alerts
– scan a list of scheduled Candle education classes
Both CECS and the Candle Worldwide Web Site are available 24 hours a day, 7 days per week.

Candle Customer Support
116 Candle Management Workstation User’s Guide
Telephone supportOur support network consists of product specialists who work with you to solve your problem.
Candle uses an on-line problem management system to log and track all support requests. Your support request is immediately routed to the appropriate technical resource.
When you call to report a problem, please have the following information:
n your Candle personal ID (PID) number
n the release level of the Candle product
n the release level of IBM or other vendor software
n identifying information and dates of recently applied maintenance to your Candle product or IBM product
n a detailed description of the problem (including the error message) and the events preceding the problem
n a description of any unusual events that occurred before the problem
Customer Support Locations and NumbersTo contact a Customer Support representative, refer to the following list. While these phone numbers were accurate at the time this document was published, the current numbers can be found on the Candle Web site, www.candle.com, under Customer Support.Table 5. Customer Support Phone Numbers
Office Telephone FAX
North America (800) 328-1811 (310) 535-3636
(310) 727-4204
Europe
Belgium/Luxembourg +32 (0) 3 270 95 60 +32 (0) 3 270 95 41
France +33 (0) 1 53 61 60 60 +33 (0) 1 53 61 06 16
Germany/Switzerland/Austria
+49 (0) 89 54 554 333 +49 (0) 89 54 554 170
Italy – Freephone 800 780992

117
Candle Customer Support
When your local support office is unavailable, you can contact Candle’s North America support center. If USADirect® service is available in your country, use the 800 telephone number. If USADirect® service is not available, ask your international operator for assistance in calling Candle's local (310) number.
Netherlands +31 (0) 30 600 35 50 +31 (0) 30 600 35 10
Scandinavia +46 (0)8 444 5940 +46 (0)8 623 1855
United Kingdom +44 (0)161 437 5224 +44 (0)161 437 5225
(Southern Europe, Middle East and South Africa Agents call United Kingdom)
Asia Pacific – English Hub +61 2 9954 1818
Australia +61 2 8912 9898
Hong Kong 800 908 457
India +61 2 8912 9898
Indonesia 0018 03061 2061
Malaysia 1800 803 459
New Zealand 0800 449 596
Philippines 1800 1612 0096
Singapore 800 616 2075
Thailand 0018 00612 1045
Asia Pacific – Japanese Hub +81 3 3595 7150 +81 3 3595 7110
Asia Pacific – Korean Hub +82 2 552 8744 +82 2 552 8746
Asia Pacific – Mandarin Hub +88 62 2739 3223 +88 62 2378 5993
Asia Pacific – e-mail address: [email protected]
Table 5. Customer Support Phone Numbers (continued)
Office Telephone FAX
Candle Customer Support
118 Candle Management Workstation User’s Guide
Incident DocumentationYou may be asked to send incident documentation to the Candle Customer Support Center. On the outside of all packages you send, please write the incident number given to you by the Customer Support representative.
Send tapes containing the incident information to the following address, unless directed otherwise by your Customer Support representative:
Candle Customer SupportCandle Support Center, Incident number201 North Douglas StreetEl Segundo, California 90245
Send all other relevant documentation, such as diskettes or paper documentation, to the address provided by your Customer Support representative.
Ensuring Your Satisfaction with Customer SupportCandle Customer Support is committed to achieving high customer satisfaction ratings in all areas. These include
n connecting you to a support representative promptly
n providing you with the appropriate fixes
n answering support questions
n filling your shipping orders
n supplying documentation
If you have a concern that has not been resolved to your satisfaction, you can open a complaint ticket. All tickets are logged and tracked to ensure responsiveness and closure. Using the ticket information, a manager will contact you promptly to resolve your problem.

119
Glossary
A
agent 1) An executable file that gathers and distributes information about system parameters. There is always one agent per managed system. 2) Any process that executes outside of, and on behalf of, a CMS.
aggregate A managed object that contains other managed objects or aggregations of managed objects. The default aggregation icon reflects the most severe state of all the managed objects it contains.
alert A warning message that appears at a console to indicate an event has occurred that may require intervention.
alert adapter An agent that monitors and relays alerts to Candle Command Center products.
alert emitter A feature of an alert adapter that acts as an agent and relays Candle Command Center data to other products. The destination can be either Candle or third-party products.
attribute A discrete characteristic or piece of information, or a property of that information, such as type, source, or severity, about a managed system. CMW users use attributes to build predicates.
authorized function Any CMW function that can be performed only by users who have been granted the authority to use it.
Automated Facilities A Candle Technologies (CT) product that automates responses to monitoring activity and to routine operator tasks.
average (*AVG) A predicate function that uses the average of the numeric values assigned as attributes to evaluate situations.
B
broker Any process that acts on behalf of another; typically used in reference to a Location Broker in a CMW.
G

120 Candle Management Workstation User’s Guide
C
Candle Command Center (CCC) A client-server implementation whose environment includes:n a server known as the Candle Management Server (CMS)
n a client, which can be: 1) a Candle Management Workstation (CMW) running on a workstation for CCC products, or 2) an OMEGAMON II product using a 3270 terminal session
n agents that collect and distribute data to a CMS
Candle Management Server (CMS) The host data management component in a Candle Command Center (CCC) environment that runs on the hub machine, sends out requests to, and receives data from, managed systems having an OMEGAMON monitoring agent or alert adapter installed, and sends the information it receives to the CMW.
Candle Management Workstation (CMW) The workstation component of a Candle Command Center (CCC) environment that provides a programmable workstation-based graphical user interface for CCC. The CMW allows users to define and control all the monitoring and automation that CCC products provide. The CMW uses symbol and color changes to reflect the status changes of every object you are monitoring.
Candle Technologies (CT) An integrated, layered architecture consisting of data access, communication, and presentation components that enable cross-platform operation and integration of data for systems management applications.
catalog A CMS-based definition of all tables, columns, indexes, and applications that exist in the CMS.
CICS Customer Information Control System. IBM’s main on-line transaction processing subsystem that runs under MVS, VSE, OS/2, OS/400, and AIX.
CICSplex A combination of two or more CICS regions working together to form one transaction processing subsystem, regardless of the location of the CICS regions.
CMS See Candle Management Server.
CMW See Candle Management Workstation.
compare value An element that the CMW compares an attribute to in order to determine whether a condition has been met. Compare values can be a number, a text string, or an attribute.Note: Only single-instance attributes for compare values can be used.
connector tool A Graphic view tool that enables you to connect objects in order to establish the logic path.
121
correlate-by-managed-systems situation The monitoring of system conditions on more than one managed system in your environment. These situations embed other situations that are targeted to run on specific managed systems.
count (*COUNT) A predicate function that counts the number of times the attribute occurred. Use this function for both numeric and non-numeric attributes.
critical state The indication that a managed object is in an unacceptable state and that you must take corrective action. The color for the Critical state is red.
CTMON A set of probes and a workstation DLL that allow an adhoc inquiry on the contents of the EIB, selected CMS files, and certain CMS performance statistics.
Current Attributes view A view option available from the Events view that provides detailed updates about the situation that most recently caused an event to occur, including the name of the attribute, the value of the attribute when the Current Attributes view was opened, and a comparison statement.
current interval The number of seconds that have elapsed between the previous sample and the current sample. A sample is the data that the product collects for the server instance.
D
Details view A view option of any CMW resource that displays detailed textual information about an object.
DLL See Dynamic Link Library.

122 Candle Management Workstation User’s Guide
drag and drop A technique employing a pointing device such as a mouse to move or copy an object.
Dynamic Link Library An executable composite of one or more executable objects, bound together by a linking procedure, and loaded at run time.
E
EIB See Enterprise Information Base.
embedded policy A policy being used within another situation acting as a predicate in another situation.
embedding policy A policy that uses other policies.
embedded situation A situation acting as a predicate in another situation.
embedding situation A situation that uses other situations as predicates.
endcode A return code that indicates the result of the activity processing. Successor activities act on the basis of the endcode of their predecessor or predecessors.
Enterprise Information Base 1) The data contained within a CMS that defines the objects, templates, states, situations, nodes, policies, Work Groups, and users.
Enterprise Information Base (cont) 2) The central repository for all persistent data, including situations, user definitions, and managed object definitions.
Enterprise object An aggregation that represents all of your enterprise.The CMW automatically creates the Enterprise object at initial product start-up. The Enterprise object contains all of the managed systems in your enterprise that are running CCC products.
event A change in the status of a situation you are monitoring.
Events view A view option that shows an expanded tree diagram of events branching off managed objects. For any event, the Events view displays the name of the situation that generated the event, the name of the managed system where the event originated, and a time stamp of the event.
Export A CMW feature that allows you to save report data to a file format used by database and spreadsheet programs. Once exported, you can then import the file into one of these programs and print it.
F
function A method of evaluating the information that an attribute supplies. The functions used in CMW are:

123
n Average *AVG
n Count *COUNT
n Make time *TIME
n Maximum *MAX
n Minimum *MIN
n String scan *SCAN
n Substring *STR
n Sum *SUM
n Value
For definitions of these functions, refer to the individual listings in the glossary.
G
gateway See Simple Network Management Protocol gateway.
Graphic view A view option that displays a graphical representation of a managed object or of the elements in the object. This is the view in which situations and policies can be created and modified.
H
Historical view A view option that displays a clock reporting the state of an object for the preceding hour. If the object is an aggregation, the clock displays the most severe state of any of the contained managed objects at any
particular moment. The Historical view for Reports displays a Details view containing information for a selected date and time period.
history bar A graphical representation available in the Graphic view of a managed object that shows the status of the object over varying lengths of time, and is used to monitor performance over time and identify trends or recurring problems.
hub 1) A central host system that collects the status of the situations and policies running on your managed systems. 2) The CMS that has been elected to act as the focal point to which all CMW clients connect. A non-Hub CMS passes its collected data to the hub to be made available to clients, thereby creating an Enterprise-wide view.
I
Icons view A view option that displays each object as an icon.
Initial Attributes view A view option available from the Events view that provides details about the situation that first caused an event to occur, including the name and value of the triggering attribute, and a comparison statement.
IRA Intelligent Remote Agent. Any piece of Candle-supplied data collection code that runs on a distributed platform other than where the CMS resides.

124 Candle Management Workstation User’s Guide
K
KDCLBAD The Data Communication Location Broker Administration facility.
L
log CMW records changes to situations and Enterprise Information Base objects in a log.
location broker 1) Part of the Candle Management Server (CMS) that manages the hub and all other CT components, including monitoring agents and the Candle Management Workstation (CMW). 2) Any entity that provides data communication services on behalf of another local process that requires, but does not possess, that capability. Normally refers to the broker component contained within the CMS.
M
Make time (*TIME) A predicate function that compares a time stamp with the time stamp returned by an attribute. The time stamp format is CYYMMDDHHMMSSMMM. Use this function with all relational operators.
managed object A visual representation, typically an icon, of one or more situations being monitored on one or more managed systems. As the status of a situation changes, the
appearance of a managed object icon on your workstation changes.
managed system (formerly, node) Any system, such as Windows NT or MVS, that a Candle Command Center is monitoring. When a new instance of a type of managed system comes on-line for the first time, information about it is placed automatically in the Managed Systems icon in the CMW main window. See also type of managed system.
managed system list A convenient way to group managed systems of the same type. You can create situations and managed objects, and then distribute them to all managed systems contained in a list. Use managed system lists to quickly remove objects or to add objects to a list that you defined.
Maximum (*MAX) A predicate function that compares the largest value of an attribute to the maximum value you assign to the attribute. Use this function with attributes that use numeric values.
Middleware Software that enables the exchange of information between components in a distributed computing environment.
Minimum (*MIN) A predicate function that compares the smallest value of an attribute with the minimum value you assign to the attribute. Use this function with attributes that use numeric values.

125
monitor interval A specified time, scalable for seconds, minutes, hours, or days, for how often the CMS checks to see if a situation has become true. The minimum monitor interval is30 seconds. The default is 15 minutes.
N
(no symbol on icon) state Indication that the associated object is in an acceptable, or OK, state. The color for the OK state is green.
node See managed system.
node 1) An entry registered in the EIB Nods List that correlates an abstract object i CMW with a tangible entity in the CMS environment. 2)A virtual entity within an SNA environment that is synonymous with a logical unit. 3) Any entity (eligible for communication) within a network.
Not Monitored state Indication that a managed object exists for which there is no Candle Remote Agent on the source system. The color for the Not Monitored state is grey.
O
Object 1) An abstraction consisting of data and the operations associated with that data. 2) An abstract entity created
from a template, ad used to represent a tangible entity in the CMS environment.
OMEGAMON Monitoring Agent (OMA) A process that probes a managed system for data and can make a managed system look like a set of objects on a CMW.
operational area A way of organizing resources. System resources that Candle Command Center products monitor fall into one of the following groups:n change
n communications
n configuration
n output
n performance
n problem
n security
n storage
n work management
P
policy A collection of activities that provides the capability of automating responses to events or routine operator tasks.
predicate The major portion of a situation that functions to compare a system condition (attribute) to a value. Predicates are of the form:

126 Candle Management Workstation User’s Guide
system condition – compared to – value
An example of a predicate isCPU usage – greater than – 90%
See situation.
probe A program identified in the CMS catalog that is directly associated with a column of data within a table. Any request for data that includes that column causes the respective probe to be driven by the data server.
product-provided maps CMW-provided maps in OS/2 metafile format (.MET) or Windows metafile format (.WMF) that can be used as graphical backgrounds to provide visual cues that aid monitoring, especially in the Graphic view of managed objects.For example, you can use a world map as a background, with managed objects placed at various locations on the map.
product-provided situations CMW-provided set of predefined situations for you to use as-is or to modify without having to create your own.
product-provided templates CMW-provided set of predefined templates that you can use as models to create managed objects.
R
relational operator Predicate operators that compare attributes to a compare value. The six relational operators are:n greater than
n less than
n equal to
n not equal to
n greater than or equal to
n less than or equal to
report Displays of data from managed systems. The data may be real-time or historical. Users filter the displays and produce charts.
roll-up state The state reflected by an aggregate managed object when one of its embedded managed objects changes state.
rule The execuable version of a situation as contained in the EIB; written and subsequently processed by the Situation Monitor.
S
seed data A subset of the EIB data specific to one CCC application.
settings page Any page of a Settings notebook, which lets you customize how the CMW operates.

127
settings view A view option that displays the Settings notebook for an object and allows you to specify and modify the properties of an object.
severity The value or relative importance you assign to a particular state. If two or more states occur at the same time, a managed object reflects the state with the highest severity level.
situation A logical expression involving one or more system conditions (attributes) that are of the form
If – system condition – compared to – value – is true
An example of a situation isIF – CPU usage – GT – 90% – TRUE
If and true appear in every situation. The expression “CPU usage GT 90%” is the situation predicate. See predicate.
Situation Monitor (SITMON) An internal driven process that executes within the CMS and drives situations based on their individual execution intervals. The situations are assessed as either true or false based on the data values being analyzed. Situations that have proven true are recorded in the hub CMS and subsequently notified to the CMW clients.
Simple Network Management Protocol (SNMP) gateway An SNMP proxy agent that acts as a bridge between the hub CMS and third-party SNMP management applications, and that uses the native SNMP services of its
host operating system to send SNMP traps (alerts) from the CMS to the third-party application and translate GET and GETNEXT requests from the application to the CMS.
SNA see System Network Architecture.
SNMP see Simple Network Management Protocol.
state An indication associated with an icon, color, and severity level of the status of a managed object at any particular point in time. The five predefined states each managed object can reflect are:n Unknown
n Critical
n Warning
n Not Monitored
n (no symbol on icon)
You can customize the default colors and add new states as needed. For definitions of each state, see individual entries in the glossary.
state change An event triggered by the state manager within the CMW. SITMON drives a situation within CMS, the true state is registered in the Hub Status Table, and the CMW client is notified. Based on the association of a situation to a template, the state manager then uses the template definition to ascertain what state is to be raised. All objects created from that
128 Candle Management Workstation User’s Guide
template then undergo the new state change.
status The true or false condition of a situation assigned to a managed object. See state.
Status History Log A log that lists the reasons each situation reached a certain state, and contains:n global time stamp of change
n managed system on which the change occurred
n name of the situation that changed
n status of the situation at the same time the entry was made
n type of situation
n time on the managed system where the change occurred
status overview object A managed object aggregation that represents the highest level of the enterprise that you are authorized to see.
String scan (*SCAN) A predicate function that searches for text occurring anywhere in the data returned by an attribute. The only relational operator you use with this function is *EQ.
STUBs A non-CMS version of the CCC that relies on workstation-based dummy files to emulate object definitions, the EIB, and application data.
Substring (*STR) A predicate function that searches for text occurring at a specific location in the data returned
by an attribute. The only relational operator you use with this function is *EQ.
Sum (*SUM) A predicate function that adds the values of an attribute. You can use it with all relational operators. Use this function with attributes that use numeric values.
system administrator CMW users who have full access to data, and full authority to product functions, and who can authorize and establish access and privileges for other users. By default, the first user of CMW is a system administrator.
System Network Architecture (SNA) An IBM communications network protocol that connects systems and programs under any operating system image and allows them to participate in distributed processing.
T
Transmission Control Protocol/Internet Protocol (TCP/IP) An open, highly portable communications protocol.
template A model you use to create managed objects. Every managed object you create inherits the characteristics and behaviors of its template. See product-provided templates.
template The basic building block from which an object is built that
129
contains the traits or characteristics the created object will inherit. In CMW, any subsequent changes to a template are inherited by existing objects that were created from that template.
toolbar A set of mouse-driven tools you use in the Graphic view of Situations, Status Overviews, and Enterprise to add, delete, and move objects in situations and managed objects.
type of managed system An operating system, subsystem, or application system type that a Candle Command Center agent is monitoring and that restricts situation attributes to that specific managed system type.
U
Unknown state The state of a managed object that indicates the CMW has lost contact with a remote agent or a remote CMS. The color for the Unknown state is blue.
unplaced object A newly-created or copied object you have not yet placed on the Graphic view. Unplaced objects reside in an Unplaced Objects window in the Graphic view of a situation or a managed object.
user object A representation of a CMW user as defined by the system administrator.
V
Value A predicate function that uses the raw value of an attribute. A value can be a number, text string, attribute, or modified attribute. Use this function with all relational operators.
view A way of looking at information about an object. Each view displays information in a different format. CMW has the following views:n Details
n Events
n Graphic
n Historical
n Icons
n Settings
Not every object has every view.
W
Warning state The indication that a managed object is approaching an unacceptable state and that you should monitor it closely. The color for the Warning state is yellow.

130 Candle Management Workstation User’s Guide

131
Index
Aaccess
system administrator 21user 22
activity statusaccessing activity results 86definition 86Details view 86reviewing 86
Administration icon 30advanced automation 24, 78alert colors 22attribute
expanded value 51Attributes
Current 106Initial 106
audible signal 102automation 24
advanced 24reflex 24
Bbars, history 37beep, specifying 102
CCandle Electronic Customer Support
(CECS) 114
Candle home page 114Candle Internet site 114Candle Worldwide Web site 114case study I 104case study II 108CCC
basic components 19definition 18release version 25what’s new in this release 25
changing the settings for history bars 66CMS 19CMW 19
main window 66startup window 28using to monitor your system 107
CMW main window 29Icons view 29
Configuration icon 31Current Attributes view 50, 51, 106custom report
using as default view 101custom report editor 97customer support
electronic support 114Internet 114locations 116numbers 116telephone support 116
I

132 Candle Management Workstation User’s Guide
Ddefault view
custom report as 101display item 43
in the Events view 43
EEIB Changes log 37, 70Enterprise Graphic view 39–40Enterprise icon 30
Events view as default for 42Enterprise Information Base 37Enterprise Information Base (EIB) Changes
log 70escalation group 79, 82events
pure 43, 55resetting 55sampled 42, 55
Events view 42default view for Enterprise icon 42stopped situation in 50using to investigate a state change 42–51,
106Export feature 60
Fflashing icon, specifying 102
GGraphic view
of history bars 66–67of your computing environment 39–40,
105
Hhelp
how to get it 23historical data
saving with Export 60viewing 60–??, 67–69
historical logs 37EIB Changes log 70Managed System Change log 70Status History log 70
Historical view 37, 68, 69, 106history bars 37, 66–67
Graphic view 66settings 66
History Bars settings page 66home page
Candle 114Hot Console
used with Status History log 73
Iicon size
changing 94modifying 94
icon, configuration 31icon, flashing
specifying 102Icons view
Administration icon 30Enterprise icon 30Log icon 30Managed Systems icon 30Reports icon 31Status Overviews icon 30Work List icon 31
Icons view of CMW main window 29Initial Attributes view 50, 51, 106internet browser, specifying 102Internet site
Candle 114
LLaunchPad 88load_critical condition 104load_warning condition 104Log icon 30logging on 28logs

133
EIB Changes 70Managed System Change 75Operations 74Status History 72
logs, historicalManaged System Change log 70
long-term history bar 66
Mmanaged objects
Graphic view 39–40investigating a Critical or Warning
state 42–51, 106–107monitoring with 42–51, 106–107using to monitor your system 39–40
Managed System Change log 70, 75Managed Systems icon 30microscope, policy 89
starting 91stopping 92
microscopes, policyrunning multiple 92
monitoring your computing environmentusing history bars 66using reports 60–??using the EIB Changes log 70using the Events view 44using the Graphic view 40using the Historical view 68–69
multiple policy microscopesrunning 92
Oobjects, selecting 34OMEGAMON monitoring agent 19on-line tutorial 38Open as Advice 47Open as Terminal 64Operations Log 70Operations log 70, 74output
specifying in reports 63
Ppage setup 32
for printin g 33policies
definition 78using to resolve system problems 78
policy 89policy microscope 89
starting 91stopping 92using 90
policy microscopesrunning multiple 92
printing 32page setup 32, 33
printing reports 32printing views 32Properties settings page 95pure events 43, 55
Rreal-time history bar 66reflex automation 24release
information 25version 25
reports 60adjusting amount of data displayed 63Export feature 60opening a terminal session from 64overview 60printing 32product-specific 60settings dialog for 62using 59viewing 61
Reports icon 31reset an event 55resetting sampled events 55

134 Candle Management Workstation User’s Guide
Ssampled events 42, 55selecting objects 34settings
reports 62settings page
Properties 95State Warning 102Time Span 102Web Link 102
settings pagesHistory Bars 66
short-term history bar 66, 105situation
advice for 47stopped 46, 50
situation, raisedadvice for addressing 47
situationsresetting when true 55
State Warning settings page 66, 102states
investigating cause of a state change 106status change 104Status History Log
automatically refreshing 73Status History log 37, 70, 72, 107Status Overview icon 30stopped situation
cannot launch Attribute view from 50stopping policy microscope 92system administrator access 21
Ttaking action on a work list item 83terminal session
opening from a report 64Time Span settings page 102tree diagram in the Events view 44tutorial 38types of events 42
UUniversal 31, 57Universal Message Console 31, 57user
access 22, 60user choice activity 78
Vview managed objects in the Graphic
view 40view reports of current system conditions 42view, Events 42viewing
summary of states in the preceding hour 69
viewing a summary of states 68views
Current Attributes 50Details 86Events 42Graphic 39–40Historical 68, 69Icons 29Initial Attributes 50
views, printing 32
Wweb link
specifying browser for 102Web Link settings page 102work group
definition 78work item
escalating 84selecting a work item to work on 81transferring to another work group 84
work listdefining the work list window 83icon 82reviewing reports 85taking action on an item 83window 82

135
work items 80Work List icon 31work list item
LaunchPad 88Worldwide Web site
Candle 114
ZZoom to OMEGAMON 64
136 Candle Management Workstation User’s Guide