cancer mcf-7asamodelforfunctionalanalysisofbreast ...mcf-7 (20). although a detailed meta-analysis...
TRANSCRIPT

Research Article
MCF-7 as aModel for Functional Analysis of BreastCancer Risk VariantsAlix Booms, Gerhard A. Coetzee, and Steven E. Pierce
Abstract
Background: Breast cancer genetic predisposition is gov-erned by more than 142 loci as revealed by genome-wideassociation studies (GWAS). The functional contribution ofthese risk loci to breast cancer remains unclear, and additionalpost-GWAS analyses are required.
Methods:We identified active regulatory elements (enhan-cers, promoters, and chromatin organizing elements) by his-toneH3K27 acetylation and CTCF occupancy and determinedthe enrichment of risk variants at these sites. We comparedthese results with previously published data and for other celllines, including humanmammary epithelial cells, and relatedthese data to gene expression.
Results: In terms of mapping accuracy and resolution, ourdata augment previous annotations of the MCF-7 epigenome.After intersection with GWAS risk variants, we found 39
enhancers and 15 CTCF occupancy sites that, between them,overlapped 96 breast cancer credible risk variants at 42 loci.These risk enhancers likely regulate the expression of dozensof genes, which are enriched for GO categories, includingestrogen and prolactin signaling.
Conclusions: Ten (of 142) breast cancer risk loci likelyfunction via enhancers that are active in MCF-7 and are wellsuited to targetedmanipulation in this system. In contrast, riskloci cannot be mapped to specific CTCF-binding sites, and thegenes linked to risk CTCF sites did not show functionalenrichment. The identity of risk enhancers and their associatedgenes suggests that some risk may function during later pro-cesses in cancer progression.
Impact:Here, we report how the ERþ cell lineMCF-7 can beused to dissect risk mechanisms for breast cancer.
IntroductionAccording to the traditional model of carcinogenesis, normal
tissue undergoes rounds of oncogenic mutations during prolif-eration that eventually leads to metastatic tumor growth. Anindividual's inherited genetic predisposition for cancer, whichcan be measured by linkage analysis or genome-wide associationstudies (GWAS), influences the rate of those oncogenic somaticmutations and the environment inwhich the tumors develop (1).In breast cancer, rare but high-penetrance inherited mutations togenes, such as BRCA1 and BRCA2, contribute about 30% to thefamilial risk of developing breast cancer and, in general, havewell-understood biological consequences (2). However, only about5% to 10% of breast cancer cases are actually associated with thistype of germline mutation. In contrast, GWAS show that low-penetrance but common genetic variants explain up to 50% ofdisease heritability and contribute significant risk to the devel-opment of both familial and sporadic breast cancer (3). Unlikehigh-penetrance rare mutations, in most cases, these other risk
genotypes are poorly understood and do not alter protein coding.Elucidating the functional basis of these common risk variants istherefore of great importance.
A recent GWAS uncovered 65 new breast cancer risk locicontributing to a total of roughly 142 reproducible breast cancerrisk loci containing over 38,000 statistically significant (com-bined P value < 5 � 10�8) or near-significant (combined P value< 1 � 10�5) risk variants (4). These variants primarily consist ofSNPs (we use "variant" and "SNP" interchangeably in this text).Due to the large number of risk-associated SNPs as well as to theirpresence in noncoding DNA, it can be difficult to pinpoint whichSNP or combination of SNPs are causal for a disease, let aloneexplain the biological mechanisms/genes involved. This will onlybecomemore challenging as the number of identified risk SNPs isexpected to increase as the sizes of case–control studies growlarger in the near future. Our goal is therefore to prioritize SNPsbased on their potential effects on cell-type–specific genomicactivity.
Risk SNPs are nonrandomly distributed throughout thegenome and have been shown to be enriched in tissue-specificnoncoding regulatory elements (RE), mainly in enhancers (5–7).REs are defined as regions of noncoding DNA that regulate thetranscription of genes. Enhancers are a class of RE that influencecell fate and development through coordinated interactionbetween transcription factors (TF) and their target promoters toalter the transcription of genes (8). Enhancers are marked bysurrounding histone modifications and nucleosome depletion.The histone modification most often used is H3K27 acetylation,because it has been shown that it marks active (engaged) enhan-cers (9). Enhancers are also relatively transient, and their activity isdictated by extracellular signals that activate complex enhancernetworks to promote cell-type– and condition-specific geneexpression. Common breast cancer risk variants present in gene
Center for Neurodegenerative Science, Van Andel Research Institute, GrandRapids, Michigan.
Note: Supplementary data for this article are available at Cancer Epidemiology,Biomarkers & Prevention Online (http://cebp.aacrjournals.org/).
G.A. Coetzee and S.E. Pierce codirected this work.
Corresponding Author: Gerhard A. Coetzee, Van Andel Research Institute,333 Bostwick Avenue N.E., Grand Rapids, MI 49503. Phone: 646-696-1560;E-mail: [email protected]
Cancer Epidemiol Biomarkers Prev 2019;28:1735–45
doi: 10.1158/1055-9965.EPI-19-0066
�2019 American Association for Cancer Research.
CancerEpidemiology,Biomarkers& Prevention
www.aacrjournals.org 1735
on June 23, 2020. © 2019 American Association for Cancer Research. cebp.aacrjournals.org Downloaded from
Published OnlineFirst July 10, 2019; DOI: 10.1158/1055-9965.EPI-19-0066

REs are likely to subtly alter gene expression patterns, comparedwith protective alleles, in ways that predispose some individualsto cancer. For example, studies of the noncoding region 8q24upstream of MYC have shown enrichment of variants associatedwith different tumor types, including breast, in multiple enhan-cers at this location (10–12).
Another important feature shown to coincide with risk SNPsis CTCF (CCCTC binding-factor). CTCF is a highly conserved11-zinc finger protein and is the only known insulator proteinin vertebrates (13). It is most often enriched at loop andtopologically associated domain (TAD) boundaries that sepa-rate transcriptionally active and repressed genes (14). Thisimplicates its importance in the organization of chromatincompartments to prevent aberrant gene–enhancer interactions.Lupianez and colleagues (15) showed that removing the CTCF-associated boundary elements at the Epha4 TAD causes abnor-mal interactions between adjacent TADs and expression ofgenes within those TADs. Others have shown that CTCF isimportant for spatial organization of the genome for properinduction and silencing of transcription (14, 16). Although therelationship between SNPs and CTCF is less clear than that ofSNPs within enhancers, SNP-mediated disruptions of CTCFconsensus sequences have been shown to change the bindingaffinity of the CTCF protein (17). This could result in genespatial network rewiring that has a strong influence on geneexpression changes that indirectly lead to breast cancer. Suchrewiring was demonstrated by a CRISPR-mediated deletion ofprostate cancer risk–associated CTCF sites, which identifiedrepressive chromatin loops [17].
In the present study, we used the MCF-7 cell line as a modelof breast cancer. It is one of the most utilized breast cancer celllines in cancer research due to its long history and expressionof the estrogen receptor (ER; ref. 18). The majority of patients(72.7%) with a known HR/HER status (ER þ progesteronereceptor/human epidermal growth factor receptor) are HRþ/HER2� (19). MCF-7 cells are one of the few breast cancer celllines that is also HRþ/HER2�, making it an extremely relevantmodel for the study of invasive breast cancer. Even, so there iscurrently a lack in the literature of post-GWAS analyses basedon experimental manipulation in ERþ systems, includingMCF-7 (20). Although a detailed meta-analysis of breastcancer risk loci was recently conducted and credible riskvariants (CRV; see Materials and Methods for a detailed def-inition) genome-wide were defined (4), potential functional-ity was only alluded to in broad terms. Here, we analyzeepidemiologically defined genetic risk loci within the MCF-7cancer cell line. In so doing, we identified functional targetsthat can further be tested by genetic manipulation. We report apriority list of breast cancer risk enhancers and risk CTCF-binding sites tailored to the MCF-7 cell line.
Materials and MethodsCell culture
MCF-7 cells were obtained from the ATCC and cultured inDMEM (ATCC, cat # 30-2003) supplemented with 10% FBSand 0.01 mg/mL human recombinant insulin (Gibco, ref# 12585-014). They were incubated in a humidified 37�C,5% CO2 incubator. For routine passaging, cells were grown inT25 and T75 culture flasks and passaged using 0.25% Trypsin/EDTA.
Chromatin immunoprecipitation sequencingFor chromatin immunoprecipitation (ChIP), we followed pre-
viously published protocols from Rhie and colleagues (21) withslight modifications. Roughly 30 to 40 � 106 cells were used perChIP. Upon reaching 70% to 80% confluency, cells were directlyfixed in T75 flasks by adding 16% formaldehyde to the culturemedium to a final concentration of 1%. The reaction wasquenched for 5 minutes at room temperature with 10X (1.15mol/L) glycine. Using a Bioruptor Pico (Diagenode, Cat #B01060001), the isolated chromatin was sonicated for 30-secondon and 30-second off cycles to yield DNA fragments between 200and 500 base pairs. Note that 100 mg of sonicated chromatin wasused for immunoprecipitation, and 1 mg (1%) was used for theinput control. To probe for CTCF or H3K27ac, samples wereincubated at 4�C overnight with a primary antibody [CTCF: CellSignaling monoclonal (D31H2), Cat# 3418; H3K27ac: ActiveMotif, Cat #39133] or an IgG control (Sigma, Cat # R9133). A/Gmagnetic beads (Pierce, Cat # 88802) were then incubated withthe samples for 2 hours at 4�C. Following this incubation, thebeads were washed with a series of buffers of varying salt con-centrations before overnight elution at 67�C. The ChIP, IgG, andInput sampleswere all purifiedusing aQIAprep SpinMiniprepKit(Qiagen, Cat # 27104).
Construction and sequencing of ChIP-Seq librariesLibraries for input and IP samples were prepared by the Van
Andel Genomics Core from 10 ng of input material and allavailable IP material using the KAPA Hyper Prep Kit (v5.16; KapaBiosystems). Prior to PCR amplification, end-repaired and poly-adenylatedDNA fragments were ligated to Bio ScientificNEXTflexAdapters (Bio Scientific). The quality and quantity of the finishedlibraries were assessed using a combination of Agilent DNAHighSensitivity chip (Agilent Technologies, Inc.), QuantiFluor dsDNASystem (Promega Corp.), and Kapa Illumina Library Quantifica-tion qPCR assays (Kapa Biosystems). Sequencing (75 bp, singleend) was performed on an IlluminaNextSeq 500 sequencer usinga 75-bp sequencing kit (v2; Illumina Inc.). Base calling usedIllumina NextSeq Control Software (NCS) v2.0, and the outputof NCS was demultiplexed and converted to FastQ format withIllumina Bcl2fastq v1.9.0.
Identification of ChIP-Seq peaksTwo biological replicates of MCF-7 were used for input and
ChIP for H3K27Ac and separately for CTCF. Following sequenc-ing, fastq files were aligned to the HG19 genome assembly usingdefault setting for BWA v0.7.15 (22). Mapped sequencing depthwas 40 to 50million readsChIP, approximately 110million readsinput for CTCF and 60 to 70 million reads ChIP, approximately150 million reads input for H3K27ac. Aligned reads were calledusing MACS2 v2.1 at a liberal FDR cutoff of 0.1 (23). Forcomparison of our CTCF data with the ENCODE CTCF data[ENCODE1 ¼ ENCSR000DMV, ENCODE2 ¼ ENCSR560BUE,primary antibody: Millipore polyclonal (07-729); ENCODE3 ¼ENCSR000DWH primary antibody: Cell Signaling (2899)], anal-ysis started with fastq files and were aligned with BWA as above,except: reads less than 50 bp in our data and reads less than 20 bpin the ENCODE data were removed using Trim Galore prior topeak calling. Peaks were filtered by irreproducible discovery rate(IDR; V2.0.2) according to default settings. For H3K27Ac, TrimGalorewas not used, andENCODE comparisonwas done startingwith peaks files (also generated using BWA andMACS2). Existing
Booms et al.
Cancer Epidemiol Biomarkers Prev; 28(10) October 2019 Cancer Epidemiology, Biomarkers & Prevention1736
on June 23, 2020. © 2019 American Association for Cancer Research. cebp.aacrjournals.org Downloaded from
Published OnlineFirst July 10, 2019; DOI: 10.1158/1055-9965.EPI-19-0066

data for MCF-7 H3K27ac ChIP-Seq ENCODE1 (ENCSR000EWR,read length: 32 bp, ChIP depth¼�20million reads, input¼�10million reads), ENCODE2 (ENCSR752UOD, read length: 36 bp,ChIP depth: rep1, 60 million and rep2, 20 million reads, input:70–80 million reads), and for human mammary epithelial cell(HMEC; ENCSR000ALW) were used for comparison. Narrow-Peak calls (i.e., ENCFF187RUK, ENCFF37ORFF, ENCFF537JMI,and ENCFF208IPB) were filtered by IDR to generate plots in Fig. 1and for peak coordinates. All H3K27Ac peak data were filtered byIDR (V2.0.2) with the following parameters for peak-merge:–rank P value –soft-idr-threshold 0.01 –peak-merge-methodmax (24). FRiP was calculated using deepTools (V.3.1.3; ref. 25).Intersected datasets are defined by coverage, not peaks, i.e., everybp annotated in all datasets is included; overlapping peaks are notmerged. Prediction for allele-dependent CTCF binding was madeusing MotifBreakR (V.1.8; ref. 26).
Breast cancer risk SNPsAll SNPs used here were derived from the recent breast cancer
GWAS meta-analysis by Michailidou and colleagues (4). Theirreport provided a set of 11.8 million 1000 Genomes SNPs whichwere associated with breast cancer and 20,989 SNPs with signif-icant or near-significant (combined P < 1 � 10�5) associationvalues. Across 142 regions, they selected the most significant SNPor SNPs and identified those nearby SNPs within 500 Kb and 2orders of magnitude significance. These they called CRVs. The riskloci correspond roughly to sets of significant risk SNPs (combinedP value < 5 � 10�8) with at least 400 to 500 Kb interveningdistance. We combined the sets of CRVs and associated annota-tions from their Supplementary Tables S2, S6, S8, S11, S13, andS14 to produce a list of 4,453 breast cancer CRVs corresponding to65 new risk loci and 77 reconfirmed previously published riskloci. Across these regions, we also selected the most significantSNPs per locus and used RaggR (27) to obtain the set of 8,687phase 3 1000 genomes in LD R2 > 0.8 based on European linkagemaps.
Overlap and enrichment of breast cancer risk SNPs in REsSNP enrichment was obtained using Bedtools v2.26.0 to over-
lap risk SNP genomic locations (hg19) with RE locations (28).The ratios of overlapping risk SNP/total risk SNPs were comparedwith the background ratio: either based on the overlap of all 11.8million background SNPs with association values byMichailidouand colleagues (4) or based on the ratio of only those 11.8millionbackground SNPs within 1 Mb of each risk locus (1.25 millionSNPs). The hypergeometric distribution was used to obtainsignificance values of overall overlap frequencies (SupplementaryTable S2).
These enrichment ratios are depicted in Fig. 2B–Dandarebasedon the overlap of all breast cancer risk variants with all enhancers,compared with a single background set. This is useful for deter-mining in general whether the entire set of risk SNPs is related to aspecific type of genomic element or to tissue-specific activity. Themetric quantifies how relevant any particular model is likely to befor examining risk. Unfortunately, when examining each locusindividually, this sort of enrichment calculation can be mislead-ing. This is because, although the background set of SNPs areindependent at both the level of genome and single locus, due togenetic linkage, risk SNPs are not independent of each other at thelevel of a locus. Although multiple significant risk SNPs can bepresent at a single locus, they should not be treated as indepen-
dent, but instead represent a single risk signal. As such, anenrichment score for a single locus can be a function of the localLD structure, which we do not expect to be a good indicator ofdisease relevance. For this reason, the background rate of overlapshould be adjusted separately for each locus.
To compare the significance of risk span/RE overlap at eachlocus separately, themost distant CRVs for each locuswere used todefine a CRV span, and the proportion of that span, in bp, whichoverlapped RE peak coverage, was calculated using Bedtools. Thatvalue was then ranked against a background distribution ofoverlap proportions for each of the 142 loci. The backgrounddistributions were calculated by permutation testing using R,wherein background SNPs within 1 MB were randomly drawn10,000 times and used to form the center of a span equal in lengthto the risk span, and then overlapped with REs. This comparisongenerates a probability value corresponding to the proportion ofthe background distribution with an equal or greater amount ofoverlap as the risk span. The same set of random spans for eachlocuswas used to compare overlapwith different tissue or types ofREs.
These comparisons were used to generate the heatmap shownin Fig. 3. This was done, in addition to using more commonenrichment scores, primarily becausewe think that the location ofindividual risk variants within a locus is affected by how riskassociation is propagated during imputation according to LDrelated to some single risk element. Thus, these multiple variantsrepresent a single signal. Enrichment calculations or statisticaltests that require multiple independent tests are not valid.Randomly drawing individual SNPs from a large set of back-ground SNPs for comparison is likewise not appropriate. Insteadwe asked: given a span of DNA associated with breast cancer risk,what percentage overlaps an MCF-7 RE and how does thatcompare with a background of equal-sized spans nearby? Webelieve that the identification of likely risk region is probablymore accurate for small, well-defined REs in inactive regions, thanfor large REs in regions of high activity. For instance, Supplemen-tary Fig. S2 shows 2 loci with high-risk SNP enrichment but withwidely spaced CRVs so that they are characterized by a low spanoverlap significance and correspond to ambiguity in risk REidentification.
Construction and sequencing of directional mRNA-Seqlibraries
Libraries were prepared by the Van Andel Research InstituteGenomics Core from 1 mg of material using the KAPA StrandedmRNAseq Kit (v4.16) (Kapa Biosystems). RNA was sheared to250–300 bp. Prior to PCR amplification, cDNA fragments wereligated to Bio Scientific NEXTflex Adapters (Bioo Scientific). Thequality and quantity of the finished libraries were assessed using acombination of Agilent DNAHigh Sensitivity chip (Agilent Tech-nologies, Inc.), QuantiFluor dsDNA System (Promega Corp.),and Kapa Illumina Library Quantification qPCR assays (KapaBiosystems).
Differential gene expression analysisExisting RNA-seq data from ENCODE for MCF-7
(ENCSR000CPT) and HMEC (ENCFF000GDZ) and from NCBIfor HMEC (GSE47933) were used for comparison, without alter-ation. To these, we compared newly generated expression datafrom 8WT biological replicates of MCF-7, which were sequencedin two separate experiments. For our experiments, 8 different
Functional Analysis of Breast Cancer Risk Variants in MCF-7
www.aacrjournals.org Cancer Epidemiol Biomarkers Prev; 28(10) October 2019 1737
on June 23, 2020. © 2019 American Association for Cancer Research. cebp.aacrjournals.org Downloaded from
Published OnlineFirst July 10, 2019; DOI: 10.1158/1055-9965.EPI-19-0066

MCF-7 WT clones were expanded until reaching 80% confluencyin a T25 flask. RNA was isolated using a Qiagen RNeasy mini kit(Cat # 74104). Paired-endmRNA libraries were then prepared bythe Van Andel Research Institute Genomics Core as described inthe previous section. Following sequencing, fastq files werealigned to HG19 using STAR v2.5 (29). Alignments (bam files)were converted to feature counts using HTSeq v0.6.0 referencedagainst the ENSEMBLE annotation of HG19: Homo sapiens.
GRCh37.87.gtf counting against the feature "exon," grouped by"gene_id," and using the strand parameter "reverse." This setincluded exon locations for 57,905 genomic entities includingpseudogenes, lncRNAs, and 20,356 protein coding genes. Theresulting gene_id map counts were normalized using edgeR(TMM) and tested for significant differential expression withLimma and Voom, in R (v3.3.1; refs. 30–32). The normalizedcount data for all 8 datasets revealed, through principle
G Coetzee(39.6 Mb)
20.5Mb
2.0 Mb
0.5 Mb
Encode 3(11.9 Mb)
Encode 2(17.5 Mb)
7.2Mb
9.9 Mb
Coetzee(35.2 Mb)
2.9 Mb
0.8 Mb
Encode 1(13.3 Mb)
Encode 2(49.4 Mb)
8.3 Mb
09.7Mb
16.4 Mb
19.8Mb
3.5 Mb41%
21%1%37%
39%44%
7%10%
FE
Unique to CoetzeeOverlap Encode1Overlap Encode2Overlap both
Unique to CoetzeeOverlap Encode3Overlap Encode2Overlap both
H
ESR1
ESR1
CCDC170
CCDC170
RefSeq
Gencode
Coet
zee
Enco
de2
Enco
de1
CTCF
rep.1
rep.2
peaks
rep.1rep.2
peaks
rep.1rep.2
peaks
rep.1rep.2
peaks
Chr6151.94 151.96 151.98 152.00 152.02 152.04
0.0 0.2 0.4 0.6 0.8 1.0Sample 1 Rank
0.0
0.2
0.4
0.6
0.8
1.0
Sam
ple
2 R
ank
0.0
0.2
0.4
0.6
0.8
1.0
Sam
ple
2 R
ank
0.0
0.2
0.4
0.6
0.8
1.0
Sam
ple
2 R
ank
BA
C
D
Co.
En1.
En2.
CTCF
CTCF
H3K27AcH3K27Ac
Figure 1.
Comparison of MCF-7 ChIP-Seq data. A, Genome browser view of representative locus near ESR1. B, IDR plot showing the correspondence between replicates 1and 2 and the threshold for filtering (in black < 0.01) for our H3K27Ac ChIP-Seq (Coetzee; C) for ENCODE dataset 2, and (D) for ENCODE dataset 1. E, Comparisonof H3K27Ac ChIP-Seq annotation coverage. F, Proportion of IDR-defined H3K27Ac peaks from our (Coetzee) data that overlap peaks in ENCODE1, ENCODE2,both, or neither; by at least 1 bp. G, Comparison of CTCF ChIP-Seq annotation coverage. H, Proportion of IDR-defined CTCF peaks from our (Coetzee) data thatoverlap peaks in ENCODE CTCF 2, ENCODE CTCF 3, both, or neither; by at least 1 bp.
A151.90 151.92 151.94 151.96 151.98 152.00 152.02 152.04
Chr6
RefSeq
Gencode
Coetzee Dens.
Coetzee Union
Intersect 2Intersect 3
ESR1
ESR1
CCDC170
CCDC170
CTCF
CRV Risk SpanMost Signif.CRVsLD w/ Most Sig.All Signif.Background
B
C Most Signif. CRVs LD w/ Most Sig. All Signif. BackgroundMCF-7 Unique 8.8 3.4 2.7 2.3 1.0MCF-7 Overlap 5.1 2.8 2.0 1.6 1.0HMEC Overlap 4.8 2.9 1.8 1.7 1.0HMEC Unique 5.4 1.9 1.3 1.7 1.0
Intersect of All 8.2 2.7 2.3 1.6 1.0Intersect of 2 5.5 2.3 2.1 1.4 1.0Coetzee 5.0 2.3 2.2 1.6 1.0Union 4.9 2.2 2.1 1.5 1.0HMEC 5.0 1.9 1.4 1.4 1.0
Coetzee 1.5 1.7 1.5 1.2 1.0Encode CTCF1 0.0 1.8 1.3 1.1 1.0Encode CTCF2 0.0 1.9 1.2 1.0 1.0Encode CTCF3 0.0 1.6 1.2 1.0 1.0Intersection of All 0.0 1.7 1.0 1.0 1.0Union 1.5 1.7 1.5 1.2 1.0
Most Signif. CRVs LD w/ Most Sig. All Signif. Background
Most Signif. CRVs LD w/ Most Sig. All Signif. Background
D
Figure 2.
Enrichment of breast cancer risk variants in MCF-7 regulatory elements. A,Genome browser view of representative locus near ESR1, showing in red: the locationof risk SNPs and background SNPs, and in orange: the location of H3K27ac peaks, based on our data (Coetzee), our data intersected with ENCODE 2 (Intersect 2),our data intersected with both ENCODE data sets (Intersect 3), or the union of the 3 datasets. B, Heat map showing risk the SNP enrichment ratio in each of the 4MCF-7 datasets of MCF-7 H3K27ac peaks, or in HMEC (which has no H3K27ac at the ESR1 locus) for each of the sets of breast cancer risk SNPs. C, Heat mapshowing the SNP enrichment ratio for enhancers that are unique to MCF-7, for MCF-7 enhancers that overlap HMEC enhancers, HMEC enhancers that overlapMCF-7 enhancers, or enhancers unique to HMEC. D, Heat map showing risk the SNP enrichment ratio for CTCF peaks.
Booms et al.
Cancer Epidemiol Biomarkers Prev; 28(10) October 2019 Cancer Epidemiology, Biomarkers & Prevention1738
on June 23, 2020. © 2019 American Association for Cancer Research. cebp.aacrjournals.org Downloaded from
Published OnlineFirst July 10, 2019; DOI: 10.1158/1055-9965.EPI-19-0066

component analysis, that there was very high similarity betweenour WT MCF-7 which was distinct from the ENCODE data(Supplementary Fig. S3). In total, 57,905 gene transcripts weremapped; however, existing MCF-7 and HMEC RNA-seq datasetsonly reported expression levels for a subset of these. Aftermergingthe expression datasets by gene_id, expression values for 15,810genes remained.
Gene ontology analysisGene ontology enrichment analysis was done using String
v.10.5 (33).
Availability of data and materialPublicly available MCF-7 H3K27ac and CTCF ChIP-Seq, and
HMEC RNA-Seq datasets used during the current study are avail-able from the encyclopedia of DNA elements (ENCODE; https://www.encodeproject.org/.
All data generated during this study are included in thispublished article (and its Supplementary information files) orhave been deposited in NCBI's Gene Expression Omnibus (34)and are accessible through GEO Series accession numberGSE130852.
Ethics approvalHuman cell lines used in this study were obtained from the
ATCC and do not require additional ethical approval. All otherdata used were obtained from public sources.
ResultsMCF-7 ChIP-Seq and RNA-seq analyses
With the goal of identifying which genetic breast cancer riskvariants are functional in theMCF-7 cell line, wefirst attempted tolocate REs that are active in MCF-7 cells using ChIP followed byhigh-throughput sequencing (ChIP-Seq). ChIP-Seq has becomewidely used inmany cell types, includingMCF-7, tomap genome-
wide histone modifications and TF-binding sites. Whereas thismethod has been integral in locating gene REs, it can be highlyvariable (35). Antibody quality, sample preparation, sequencingdepth, and MCF-7 cell line heterogeneity are the main sources oftechnical variability. Furthermore, following successful immuno-precipitation and sequencing, various algorithms then must beemployed to define peaks: regions showing a high number ofmapped reads relative to background. In particular, sufficientlydeep sequencing is important for this part of the process whereinactive REs are defined. Deeper sequencing allows for a lowerrelative detection threshold and so can capture low-expressiontranscripts, but also generates greater discrimination amongpeaksand more signal relative to control and so can map features withhigher resolution and more reproducibly. This is important forthe detection of variable regions that may not have robustenrichment but are still highly active and functionally impor-tant (35, 36). An example at one locus showing 3 differentH3K27ac CHIP-Seq experiments, including our own reportedhere, is shown in Fig. 1A.
In addition to technical variation,MCF-7 is prone to instability,andmajor genetic and expression changes can be present betweensubclones (18). Therefore, prior to any genetic manipulation ofMCF-7 for disease modeling, recent and accurate characterizationis recommended. We reviewed existing ENCODE MCF-7 CHIP-SeqH3K27ac andCTCFdatasets and compared these studieswithour own (Fig. 1B–D). We mapped a total of 14,722 H3K27acpeaks, corresponding to a coverage of roughly 35.2 Mb of DNA(Supplementary Table S1). In comparison, the ENCODE 1 andENCODE 2 datasets generate 11,304 and 20,102 reproduciblepeaks covering about 13.3 and 49.4 Mb, respectively (Fig. 1).However, peak size can vary, even if the same peaks have beencalled in multiple datasets. By comparing our peak locations(labeled "Coetzee") with the ENCODE datasets, we found thatonly 37% of our peaks overlapped H3K27ac regions from bothENCODE datasets (by at least 1 bp). In addition, 21% arecompletely unique to our data, 1% overlap peaks in ENCODE
B_cells_peripheral_blood T_cells_peripheral_blood GM12878_lymphoblastoid hematopoietic_stemcells DND41_Tcell_leukemia spleen K562_leukemia ovary hmec A549_lung_carcinoma HeLa-S3_cerv_carcinoma HepG2_hepato_carcinoma MCF-7 CTCF LUHMES.diff enhancers Coetzee H3K27ac Coetzee Enhancers Intersection Encode 1 UnionEncode 2
19_13954571 1_10566215 17_77781725 12_120832146 8_29509616 14_105212261 3_99723580 16_80650805 10_9088113T 21_16520832 6_151952332 7_101552440 8_102478959
MC
F-7
Chip-Seq
Roadm
apenhancers
CRV overlap MCF-7
enhancers
Very little CRV-enhancer overlap in any tissue
Some overlap in most tissue-type
enhancers
Roadmap tissuesoverlap,
not MCF-7
Roadmap overlap
8_117209548 1_118230221 19_13158277 3_172285237 4_89243818 5_32567732 7_139942304
Figure 3.
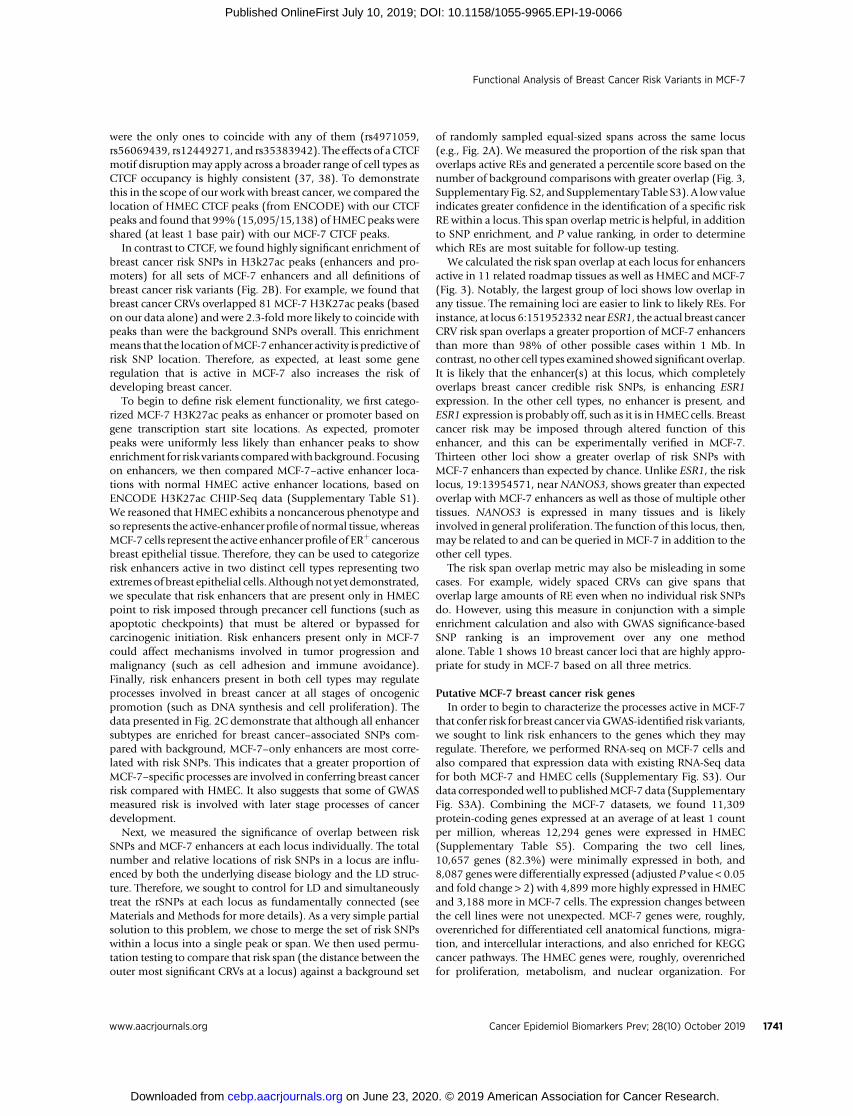
Analysis of individual risk loci and tissue-specific regulatory elements. ChIP-Seq data and roadmap segmentations (subset for enhancers) were used to examinethe significance of overlap with CRV risk spans for each of the 142 breast cancer risk loci (columns). Significance levels are depicted in red with darker redindicating a greater risk-span/RE overlap proportion compared with background levels for that locus. Dendrograms are based on complete linkage using city-block distance measurements of -log(P value). The individual loci showing the most significant overlap are identified by chromosome and position underneath.These are the loci with the most specific correspondence between tissue-specific regulatory elements and breast cancer CRVs.
Functional Analysis of Breast Cancer Risk Variants in MCF-7
www.aacrjournals.org Cancer Epidemiol Biomarkers Prev; 28(10) October 2019 1739
on June 23, 2020. © 2019 American Association for Cancer Research. cebp.aacrjournals.org Downloaded from
Published OnlineFirst July 10, 2019; DOI: 10.1158/1055-9965.EPI-19-0066

dataset 1 (but not 2), and 41% overlap peaks present inENCODE dataset 2 (but not 1). Examining unique DNA coverageacross the three datasets yields a total of 61.4 Mb, which areannotated asH3K27ac in at least 1 experiment and 9.7Mb (15%),which are annotated in all three datasets (Fig. 1E). Based uponan analysis of the proportion of reads in peaks (FRiP), whichindicates the specificity of library following immunoprecipita-tion, our data are similar to that of ENCODE 2, both studies ofwhich used the same primary antibody for H3K27Ac (Supple-mentary Fig. S1). The ENCODE 1 dataset in contrast (the oldeststudy) used a different antibody and shows a lower proportion ofreads in peaks. Analyzing the reproducibility of peak callingbetween the three studies showed larger differences, as seen byIDR analysis. This analysis filters out peaks which are not similaracross two biological replicates. In this case, our data retained62% of defined peaks, ENCODE 2 retained 44%, and the oldestdata, ENCODE 1 retained only 23% of peaks. ENCODE 1 usedboth a different primary antibody and was sequenced to a muchlower depth for both input and control.
We used the same approach in comparing our MCF-7 CTCFdata with three separate experiments fromENCODE (labeled 1–3and unrelated to the H3K27Ac ENCODE data). We detectedalmost double the number of peaks in our data set (65,997 peaks)compared with the other three ENCODE datasets with 38,553,33,312, and 36,057 peaks, respectively, that pass an IDR cutoff ofq < 0.01 (IDR score > 830; Supplementary Table S1). Whencombining all three datasets, they only share 20,601 commonpeaks. After removing CTCF ENCODE1, the least reproducibledata, we further evaluated CTCF ENCODE datasets 2 and 3 incomparison with our own. With our CTCF ChIP-Seq data, wedetected a substantially greater amount of unique CTCF-boundDNA (20.5 Mb) across the genome in comparison with CTCFENCODE 2 and 3 (0.5 and 0.03 MB; Fig. 1G). The majority ofCTCF sites detected by the CTCF ENCODE 2 and 3 datasets werealso detected in our data. Out of the 65,997 CTCF peaks found inour experiment, 39% were unique to our dataset, 10% wereshared with CTCF ENCODE 3 but not CTCF ENCODE 2, 7%were sharedwithCTCFENCODE2but notCTCFENCODE3, and44% were shared between all three datasets (Fig. 1H). These dataillustrate that CTCF peaks are largely conserved across datasets,but deeper sequencing may improve the detection of weakerCTCF-binding signals.
Coincidence of breast cancer risk variants with regulatoryregions
Although most risk variants do not alter protein coding, theymust still show allelic differences in some functional aspect ofgenome biology if they are causally related to the disease. Iden-tifying active regulatory regions that coincide with risk variantlocations can point to such mechanisms. In order to identifybreast cancer risk processes which are active in MCF-7, we inter-sected the locations of risk variants with both our own and theENCODE MCF-7 ChIP-Seq H3K27ac peaks and CTCF-bindingpeaks. To maximize both sensitivity and specificity, multiple setsof SNPswere used in this analysis based ondifferent definitions ofwhich variants are most likely to confer breast cancer risk, allderiving from Michailidou and colleagues (4) and based ondifferent thresholds for significance (see Materials and Methodsfor details, Supplementary Table S2). Overall, we examinedGWAS breast cancer risk variants corresponding to 142 separateloci. These loci each had one or small number of equally most
significant variants per locus, with 210 in total. In addition,Michailidou and colleagues (4) reported a set of CRVs for eachlocus, with an average of 31 (stdev. 50) CRVs per locus thatspanned an average of 114 Kb (stdev. 179 Kb). CRVs are mostlikely to be functional and are based on a locus-specific signifi-cance threshold (see Materials and Methods).
By examining the location of genomic regulatory activity withrespect to risk variants, we canmost easily infer which risk loci arenot functional within a particular cell line. In MCF-7, 76 (of 142)breast cancer risk loci, and 93% of total reported CRVs, do notoverlap any active REs. It is therefore very unlikely that these 76loci confer risk via processes which are active in MCF-7. Incontrast, the remaining 66 risk loci may function via processesthat are intrinsic to, and active in, somebreast cancer cells,makingthem logical targets for experimental manipulated in MCF-7.However, the possibility of spurious coincidence remains, assome rSNPs will overlap active REs simply by chance. Out of the4,453 reported breast cancer CRVs, only 70 (1%) CRVs over-lap (31) H3K27ac peak locations present in all three datasets,whereas 191CRVs overlap (80)H3k27ac peaks based on our dataalone (Supplementary Table S2). Similarly, only 13 CRVs overlapa CTCF-binding peak present in all of the MCF-7 CTCF ChIP-seqdatasets, and96CRVsoverlap (70)peaks basedonourdata alone.For CTCF, of the 13, just 5 (rs3008455, rs8103622, rs1800437,rs10231350, and rs10116233), and of the 96, 16 (SupplementaryTable S4) are predicted to also cause allele-dependent disruptionof a known CTCF-binding motif.
Coincidence of breast cancer risk variants with REs in MCF-7If GWAS-measured breast cancer risk is functional in MCF-7
cells, thenwe predict that the location of breast cancer risk SNPs iscorrelated with the locations of active MCF-7 enhancers and/orCTCF-binding sites. That is, we expect that the character of MCF-7as breast-derived cancer cells can be captured uniquely by thelocation of REs, and this unique activity pattern will predict thelocation of breast cancer CRVs. To test this hypothesis, we com-pared the location of breast cancer risk SNPs with entire set ofimputed SNPs generated by Michailidou and colleagues, the vastmajority of which are not statistically associated with breastcancer. Polymorphisms are distributed nonrandomly throughoutthe genome and tend to occur near active regions of transcriptionand so some breast cancer–unrelated SNP set is required to definea background rate of coincidence. The simplest calculation forSNP enrichment is to compare two ratios: the proportion of riskvariants overlapping enhancers or CTCF sites and the proportionbackground SNPs overlapping the same. We made these enrich-ment calculations using slightly different definitions of MCF-7enhancer or CTCF peaks, based on merging our data with theENCODE data, and for different definitions of risk SNPs, asdescribed above.
To calculate enrichment of breast cancer risk inMCF-7 then, wefirst measured the ratios of CTCF peaks overlapped by both riskvariants and with the entire set of imputed SNPs. By using thiscomparison, we found that overall enrichment of SNPs coincid-ing with CTCF-binding sites is very modest and is close to theoverlap expected by chance (Fig. 2D). Though the difference inenrichment scores between datasets was not large, CRVs showedthe strongest enrichment for all ChIP datasets, indicating that thisdefinition of risk SNPs may be the most relevant to breast cancer(see Supplementary Table S2 for CTCF sites that overlap CRVs).Out of the 210most significant risk variants dataset, ourChIP data
Booms et al.
Cancer Epidemiol Biomarkers Prev; 28(10) October 2019 Cancer Epidemiology, Biomarkers & Prevention1740
on June 23, 2020. © 2019 American Association for Cancer Research. cebp.aacrjournals.org Downloaded from
Published OnlineFirst July 10, 2019; DOI: 10.1158/1055-9965.EPI-19-0066
were the only ones to coincide with any of them (rs4971059,rs56069439, rs12449271, and rs35383942). The effects of aCTCFmotif disruptionmay apply across a broader range of cell types asCTCF occupancy is highly consistent (37, 38). To demonstratethis in the scope of our work with breast cancer, we compared thelocation of HMEC CTCF peaks (from ENCODE) with our CTCFpeaks and found that 99% (15,095/15,138) of HMEC peaks wereshared (at least 1 base pair) with our MCF-7 CTCF peaks.
In contrast to CTCF, we found highly significant enrichment ofbreast cancer risk SNPs in H3k27ac peaks (enhancers and pro-moters) for all sets of MCF-7 enhancers and all definitions ofbreast cancer risk variants (Fig. 2B). For example, we found thatbreast cancer CRVs overlapped 81 MCF-7 H3K27ac peaks (basedon our data alone) and were 2.3-foldmore likely to coincide withpeaks than were the background SNPs overall. This enrichmentmeans that the locationofMCF-7 enhancer activity is predictive ofrisk SNP location. Therefore, as expected, at least some generegulation that is active in MCF-7 also increases the risk ofdeveloping breast cancer.
To begin to define risk element functionality, we first catego-rized MCF-7 H3K27ac peaks as enhancer or promoter based ongene transcription start site locations. As expected, promoterpeaks were uniformly less likely than enhancer peaks to showenrichment for risk variants comparedwithbackground. Focusingon enhancers, we then compared MCF-7–active enhancer loca-tions with normal HMEC active enhancer locations, based onENCODE H3K27ac CHIP-Seq data (Supplementary Table S1).We reasoned that HMEC exhibits a noncancerous phenotype andso represents the active-enhancer profile of normal tissue,whereasMCF-7 cells represent the active enhancer profile of ERþ cancerousbreast epithelial tissue. Therefore, they can be used to categorizerisk enhancers active in two distinct cell types representing twoextremes of breast epithelial cells. Althoughnot yet demonstrated,we speculate that risk enhancers that are present only in HMECpoint to risk imposed through precancer cell functions (such asapoptotic checkpoints) that must be altered or bypassed forcarcinogenic initiation. Risk enhancers present only in MCF-7could affect mechanisms involved in tumor progression andmalignancy (such as cell adhesion and immune avoidance).Finally, risk enhancers present in both cell types may regulateprocesses involved in breast cancer at all stages of oncogenicpromotion (such as DNA synthesis and cell proliferation). Thedata presented in Fig. 2C demonstrate that although all enhancersubtypes are enriched for breast cancer–associated SNPs com-pared with background, MCF-7–only enhancers are most corre-lated with risk SNPs. This indicates that a greater proportion ofMCF-7–specific processes are involved in conferring breast cancerrisk compared with HMEC. It also suggests that some of GWASmeasured risk is involved with later stage processes of cancerdevelopment.
Next, we measured the significance of overlap between riskSNPs and MCF-7 enhancers at each locus individually. The totalnumber and relative locations of risk SNPs in a locus are influ-enced by both the underlying disease biology and the LD struc-ture. Therefore, we sought to control for LD and simultaneouslytreat the rSNPs at each locus as fundamentally connected (seeMaterials and Methods for more details). As a very simple partialsolution to this problem, we chose to merge the set of risk SNPswithin a locus into a single peak or span. We then used permu-tation testing to compare that risk span (the distance between theouter most significant CRVs at a locus) against a background set
of randomly sampled equal-sized spans across the same locus(e.g., Fig. 2A). We measured the proportion of the risk span thatoverlaps active REs and generated a percentile score based on thenumber of background comparisons with greater overlap (Fig. 3,Supplementary Fig. S2, and Supplementary Table S3). A low valueindicates greater confidence in the identification of a specific riskRE within a locus. This span overlap metric is helpful, in additionto SNP enrichment, and P value ranking, in order to determinewhich REs are most suitable for follow-up testing.
We calculated the risk span overlap at each locus for enhancersactive in 11 related roadmap tissues as well as HMEC and MCF-7(Fig. 3). Notably, the largest group of loci shows low overlap inany tissue. The remaining loci are easier to link to likely REs. Forinstance, at locus 6:151952332near ESR1, the actual breast cancerCRV risk span overlaps a greater proportion of MCF-7 enhancersthan more than 98% of other possible cases within 1 Mb. Incontrast, no other cell types examined showed significant overlap.It is likely that the enhancer(s) at this locus, which completelyoverlaps breast cancer credible risk SNPs, is enhancing ESR1expression. In the other cell types, no enhancer is present, andESR1 expression is probably off, such as it is in HMEC cells. Breastcancer risk may be imposed through altered function of thisenhancer, and this can be experimentally verified in MCF-7.Thirteen other loci show a greater overlap of risk SNPs withMCF-7 enhancers than expected by chance. Unlike ESR1, the risklocus, 19:13954571, near NANOS3, shows greater than expectedoverlap with MCF-7 enhancers as well as those of multiple othertissues. NANOS3 is expressed in many tissues and is likelyinvolved in general proliferation. The function of this locus, then,may be related to and can be queried in MCF-7 in addition to theother cell types.
The risk span overlap metric may also be misleading in somecases. For example, widely spaced CRVs can give spans thatoverlap large amounts of RE even when no individual risk SNPsdo. However, using this measure in conjunction with a simpleenrichment calculation and also with GWAS significance-basedSNP ranking is an improvement over any one methodalone. Table 1 shows 10 breast cancer loci that are highly appro-priate for study in MCF-7 based on all three metrics.
Putative MCF-7 breast cancer risk genesIn order to begin to characterize the processes active in MCF-7
that confer risk for breast cancer viaGWAS-identified risk variants,we sought to link risk enhancers to the genes which they mayregulate. Therefore, we performed RNA-seq on MCF-7 cells andalso compared that expression data with existing RNA-Seq datafor both MCF-7 and HMEC cells (Supplementary Fig. S3). Ourdata correspondedwell to publishedMCF-7data (SupplementaryFig. S3A). Combining the MCF-7 datasets, we found 11,309protein-coding genes expressed at an average of at least 1 countper million, whereas 12,294 genes were expressed in HMEC(Supplementary Table S5). Comparing the two cell lines,10,657 genes (82.3%) were minimally expressed in both, and8,087 genes were differentially expressed (adjusted P value < 0.05and fold change > 2) with 4,899 more highly expressed in HMECand 3,188 more in MCF-7 cells. The expression changes betweenthe cell lines were not unexpected. MCF-7 genes were, roughly,overenriched for differentiated cell anatomical functions, migra-tion, and intercellular interactions, and also enriched for KEGGcancer pathways. The HMEC genes were, roughly, overenrichedfor proliferation, metabolism, and nuclear organization. For
Functional Analysis of Breast Cancer Risk Variants in MCF-7
www.aacrjournals.org Cancer Epidemiol Biomarkers Prev; 28(10) October 2019 1741
on June 23, 2020. © 2019 American Association for Cancer Research. cebp.aacrjournals.org Downloaded from
Published OnlineFirst July 10, 2019; DOI: 10.1158/1055-9965.EPI-19-0066

Table
1.MCF-7
breastcancer
risk
enha
ncers;listedarethe10
bestbreastcancer
risk
lociin
MCF-7
andtheco
rrespond
ing10
MCF-7
risk
enha
ncersthat
aremost
suitab
leforfollo
w-uptesting
Locu
sAlt.locu
sID
CRVs
Enh
.ove
rlap
CRVs
in locu
s
Hyp
er.
Pva
l.(-log)
Ratio
enrich
.
Span
ove
r-lapsignif.
(-log)
Lead
SNPID
Comb.
GWAS
Pva
l.
Comb.
GWAS
Pva
l.,ER
Pos.
Risk
enha
ncer
start
Risk
enha
ncer
stop
Gen
eMCF-7
DEGen
es0–5
00
Kb
MCF-7
DEGen
es50
0Kb–1
Mb
1p36
.22
1_1056
6215
850
4.29
5.79
1.72
rs25
06889
2.38
E-20
1.10E-07
1059
5877
1059
9012
PEX14
APITD1,TA
RDBP,
UBE4B,P
EX14
SRM,SLC
25A33
,PIK3C
D,
LZIC,PTC
HD2,CLS
TN1,
EXOSC
10,M
TOR
3p26
.13_
474
2276
122
0.65
3.31
1.71
rs678
7391
9.07E
-19
1.20E-15
472
7872
473
2087
EGOT,
ITPR1
BHLH
E40,A
RL8
B,ITP
R1,
SUMF1
EDEM1
6q25
6_151952
332
1010
12.50
17.64
2.19
rs60954
078
2.84E-54
1.70E-22
151948050
151959
756
ESR
1ZBTB
2,RMND1,AKAP12,
C6orf211,SY
NE1,ESR
1MTH
FD1L,PLE
KHG1
8q22
.38_1024
78959
28
1.50
6.62
1.66
rs514192
5.61E-09
9.90E-09
1024
78133
1024
81107
YWHAZ,
GRHL2
,KLF
10
ZNF70
6,G
RHL2
ANKRD46,Y
WHAZ,
RRM2B
,UBR5,PABPC1
10p14
10_9088113
3042
23.50
8.93
2.15
rs679
58007
1.73E
-10
6.00E-08
9074
392
908932
0GATA
3N/A
GATA
312q24
.31
12_120832
146
226
0.80
2.32
1.54
rs20
6966
3.79
E-08
1.40E-06
120831824
120833
249
DYNLL1,
GATC
TRIAP1,SR
SF9,P
OP5,
PXN,M
SI1,DYNLL
1,COQ5,
UNC119B,
CCDC64,R
NF10
PRKAB1,P2R
X4,C
IT,
ANAPC5
16q23
.216_80650
805
817
9.69
26.12
2.66
rs75
00067
4.06E-27
2.90E-21
80647147
80651103
CDYL2
ATM
IN,C
ENPN,C
DYL2
GAN,C
MIP
17q25
.317_77
781725
313
2.56
9.98
1.90
rs80824
521.14E-10
2.40E-06
7776
976
977
7723
32N/A
CBX2,
CBX8,C
BX4,
CARD14,S
GSH
,SL
C26
A11,T
BC1D16,
EIF4A3
TIMP2,
LGALS
3BP,
ENDOV,U
SP36
,RPTO
R
19p13.12
19_13954
571
1943
13.35
8.74
2.74
rs25
94714
1.08E-08
1.70E-05
13948902
13955
856
JUNB,
NANOS3
MIR24
-2,PALM
3,SA
MD1,
CCDC130,Z
SWIM4,
C19orf57
,PODNL1,
ASF
1B,IL2
7RA,L
PHN1
CALR
,SYCE2,
TRMT1,
CD97,
GIPC1,DNAJB
1,HOOK2,
MAST
1,NFIX,
PKN1,ZNF33
321q21.1
21_1652
0832
22
4.32
143.22
2.52
rs24
039
07
1.87E
-32
4.20E-23
1657
027
81657
4820
NRIP1
NRIP1
HSP
A13,U
SP25
NOTE:E
achen
hancer
ove
rlap
sthemostsignificant
GWASSNPat
thelocus,an
dthelocusshowsboth
anen
richmen
tgreater
than
2(freque
ncyofb
reastcancer
CRVsove
rlap
pingen
hancersco
mpared
withbackg
roun
dove
rlap
freq
uency),aswellasaproportionofthe
CRVrisk
span
that
ove
rlap
sen
hancersgreater
than
more
than
95%
backg
roun
dove
rlap
proportions.The
enrichmen
tand
ove
rlap
values
may
bemodified
byove
rlap
ofrisk
SNPswithother
enha
ncersatthesamelocus.The
ove
rallGWASsignificance,ERþGWASsignificance,an
dreported
gen
esfromMicha
ilidouan
dco
lleag
uesarelisted.Inad
dition,allbut
theen
hancer
atlocus19
areun
ique
toMCF-7
anddono
tove
rlap
HMECen
hancerslocations,sothedifferentially
expressed
gen
es(relativeto
HMEC)within50
0Kbor1MBofea
chlead
SNPareiden
tified
asputativerisk
gen
esin
MCF-7.
Abbreviation:
N/A
,notap
plicab
le.
Booms et al.
Cancer Epidemiol Biomarkers Prev; 28(10) October 2019 Cancer Epidemiology, Biomarkers & Prevention1742
on June 23, 2020. © 2019 American Association for Cancer Research. cebp.aacrjournals.org Downloaded from
Published OnlineFirst July 10, 2019; DOI: 10.1158/1055-9965.EPI-19-0066

instance, the top 1,000 genes most significantly upregulated inMCF-7were statistically enriched for 382GObiological processesincluding "vasculature development," "anatomical structuremor-phogenesis," "regulation of cellular component movement," and"extracellular matrix organization" (FDRs ¼ 5.2E-12, 5.2E-12,2.0E-11, 2.2E-11; Supplementary Table S5). The top 1,000 mostsignificant HMEC genes were enriched for 63 processes including"RNAmetabolic process," "nucleic acid-templated transcription,""nucleobase-containing compound metabolic process," and"RNA biosynthetic process" (FDRs ¼ 7.0E-8, 7.0E-8, 2.1E-7, and2.2E-7; Supplementary Table S5).
Multiple methods exist that attempt to pair enhancers withtarget genes (39–41). The simplest method, which we use here, isto identify nearby genes which are coexpressed with active enhan-cers specifically in a particular cell type, such as MCF-7. For thispurpose, we used only one definition of MCF-7 enhancers basedon our own H3K27ac data (see Fig. 1) following the removal ofpromoter peaks. The majority of previously reported enhancer-gene regulatory pairing occur at distances less than 1 Mb, thoughfar cis and even interchromosomal interactions do exist (42, 43).Based on our previous work, we used here a distance threshold of500 kbdistance to identify putative risk genes expressed inMCF-7.By this proximity cutoff, 522 genes are near-risk enhancers inMCF-7 cells. These potential risk-associated genes expressed inMCF-7 are statistically enriched for 102 GO biological processterms including "nucleosome assembly," "DNA methylation,""chromatin silencing," and "positive regulation of DNA repair"(FDR ¼ 1.4E-5, 7.9E-4, 9.6E-3, and 1.5E-2; SupplementaryTable S6). Likewise, there are 386 putative risk genes expressedin HMEC and 260 genes common to both the HMEC and MCF-7sets. HMECwere statistically enriched for 42 biological processes.However, almost no significantly enriched HMEC processes wereunique, 80%were also significant for the set of MCF-7 risk genes.The exception being enrichment for GO pathways related toNotch signaling or apoptosis (Supplementary Table S6). Thissuggests that fewbreast cancer risk processes are unique toHMEC,compared with MCF-7.
A potentially more accurate method to link REs with targetgenes is by using expression quantitative trait loci (eQTL) data,from sources such as GTEx. These results are biased by tissuesample type and population origin and cannot identify change ishigh variable or lowly expressed genes. However, an eQTLdescribes a direct association between the allelic variation at anSNP and an expression change for a gene within 1Mb. In order tointegrate eQTL data, we identified all SNPs (not just breast cancerrisk SNPs) located within MCF-7 risk enhancers and queried theGTEx database for all significant eQTL genes, associated withthose SNPs in breast tissue. We then removed from this set thosegenes which are not expressed in MCF-7. Doing so produced48 genes (Supplementary Table S7). These genes were not enrich-ed for any GO annotations and may be too stringently filtered toinclude likely risk genes. For instance, ESR1, a gene known to beimportant in breast cancer, and near a risk enhancer (Fig. 1), hasno identified significant eQTLs in the GTEx dataset. Moreover, theCRVs located at that risk locus, one of the most significant of allloci, have also not beenmeasured to be eQTLs for any gene. Thus,this clear test case fails reidentification by GTEx. So, althougheQTL can provide strong support for linking a risk locus to a gene,we think it is currently too restrictive for further use here.
Because enhancer regions active in MCF-7, and not active inHMEC, were most highly correlated with the locations of risk
variants, we sought to associate this subset of enhancers withputative genes. Enhancers alter the expression of nearby genes sowe can assume that most genes that are regulated by this subset ofrisk enhancers will appear differentially expressed relative toHMEC expression levels, in which the risk enhancers are notactive. Although most enhancers upregulate nearby genes,H3K27ac ChIP-Seq will also identify regulatory regions that candownregulate nearby genes. For this reason, we considered DEgenes that were both up- and downregulated with respect toHMEC. Based on 500 KB proximity, 138 DE genes are associatedwith MCF-7–only risk enhancers (Supplementary Table S7).These are enriched for multiple broad GO categories, but alsoincluding the KEGG pathways for estrogen and prolactin signal-ing, identified via 6 and 5 genes, respectively (SupplementaryTable S7).
Finally, in Table 1 we list risk MCF-7 enhancers at 10 breastcancer risk loci, which are highly enriched for SNPs, coincide withthe span of DNA-containing breast cancer CRVs above back-ground levels, and show overlap for the most significant riskSNP. We linked MCF-7 genes to these 10 enhancers based onexpression in MCF-7, significant difference in expression relativeto HMEC, and a distance closer than 1 Mb. These represent themost promising enhancer targets for further functional analysis.
DiscussionMCF-7 is a highly utilized breast cancer cell line. However, the
range of its potential use for the dissection of breast cancer GWASrisk is not immediately obvious. Based on the classical theory ofcarcinogenesis, cancer arises from normal tissue and proceedsthrough the stages of initiation, promotion, and progression.Genetic factors affecting any of these stages may be picked up inGWAS studies, but only a subset of these risk mechanisms arelikely to be active in MCF-7 itself. Only those processes active inMCF-7 can in turn be easily manipulated. By comparing MCF-7with HMEC, we believe that risk arising from gene regulationinvolved in all three stages is active in MCF-7, but that MCF-7 ismost suited for studying the riskmechanisms exacerbating tumorprogression. In particular, estrogen and prolactin signaling genenetworks are especially enriched in breast cancer GWAS riskbiology in MCF-7. Although MCF-7 cells are classified as luminalA/ERþ, it is worth noting that this cell linemay still be relevant fortumorigenic processes in other subtypes including ER� breastcancer. The developmental lineage of breast tumor subtypes iscomplex and not fully understood. Based on the hypothesis thatdifferent subtypes may be derived from the same cell type oforigin, some of the active enhancer–driven processes leading tocancer in each subtype are most likely not mutually exclusive.Further studies need to be done to evaluate the overlapping risk inmultiple breast cancer cell lines of different classifications.
We found that the work reported here is more reproducible indefiningMCF-7–specific H3K27ac histonemarks andCTCF occu-pancy than that in previously reported ENCODE datasets. Thediscrepancy in the total amount of H3K27ac or CTCFDNA and incontinuously designated regions (peaks) is likely due both todifferences in sample preparation and sequencing depth aswell asto intrinsic differences between subclones.
A potential next step in dissecting breast cancer risk inMCF-7 isto performallelic replacement or to delete the entire risk REs usingCRISPR-CAS9 gene disruption.We found thatmultiple enhancersare well suited for follow-up experiments, and a smaller number
Functional Analysis of Breast Cancer Risk Variants in MCF-7
www.aacrjournals.org Cancer Epidemiol Biomarkers Prev; 28(10) October 2019 1743
on June 23, 2020. © 2019 American Association for Cancer Research. cebp.aacrjournals.org Downloaded from
Published OnlineFirst July 10, 2019; DOI: 10.1158/1055-9965.EPI-19-0066

of CTCF sites may also be suitable. Allele-dependent CTCFbinding can potentially disrupt large TAD regions leading to largeexpression changes to nearby genes. For this reason, CTCF can bean ideal target. Unfortunately, we found very low enrichment ofrSNPs, implying more breast cancer risk loci function via enhan-cers inMCF-7. It is possible that the enrichment scoresmaybe lessinformative forCTCF, thoughCTCF-binding sites/peaks aremuchmore specific and narrower than that of H3K27ac peaks and areless likely to overlap multiple risk SNPs simply due to the closeproximity of risk SNPs to each other. This and the greater numberof CTCF peaks (which are largely tissue invariant) may contributeto lower overall enrichment. In total, we found 5 loci which aregood targets for further CTCF examination.
In contrast, at least 10 loci point to specific enhancers as casualin breast cancer risk. For enhancers, we found the greatest degreeof enrichment of risk variants in the MCF-7 cell line as comparedwith a normal precursor model (HMEC), indicating that MCF-7cells are highly relevant for the study of processes leading toabnormal cell growth and tumor formation.
Overall, our results reported here bring into focus how MCF-7 can be used as a model to reveal breast cancer risk mechan-isms in ER-positive genetic predisposition. For enhancers, wefound the greatest degree of enrichment of risk variants in theMCF-7 cell line as compared with a normal precursor model(HMEC), indicating that MCF-7 cells are highly relevant for thestudy of processes leading to abnormal cell growth and tumorformation.
Disclosure of Potential Conflicts of InterestNo potential conflicts of interest were disclosed.
DisclaimerThe content is solely the responsibility of the authors and does not neces-
sarily represent the official views of the NIH.
Authors' ContributionsConception and design: G.A. CoetzeeDevelopment of methodology: A. BoomsAcquisition of data (provided animals, acquired and managed patients,provided facilities, etc.): A. BoomsAnalysis and interpretation of data (e.g., statistical analysis, biostatistics,computational analysis): A. Booms, S.E. PierceWriting, review, and/or revision of the manuscript: A. Booms, G.A. Coetzee,S.E. PierceStudy supervision: G.A. Coetzee, S.E. Pierce
AcknowledgmentsThe authors would like to thank everyone who contributed to this study.
Van Andel Institute also provided the facilities and general support to conductthis research. Marie Adams and the rest of the Genomics Core conductedand advised on next-generation sequencing, and Lee Marshall providedanalysis advice.
Research reported in this publication was supported by the NCI of the NIHunder award number R01CA190182 (to G.A. Coetzee).
The costs of publication of this article were defrayed in part by thepayment of page charges. This article must therefore be hereby markedadvertisement in accordance with 18 U.S.C. Section 1734 solely to indicatethis fact.
Received February 4, 2019; revised May 17, 2019; accepted July 2, 2019;published first July 10, 2019.
References1. Hirshfield KM, Rebbeck TR, Levine AJ. Germline mutations and poly-
morphisms in the origins of cancers in women. J Oncol 2010;2010:297671.
2. Fachal L, Dunning AM. From candidate gene studies to GWAS and post-GWAS analyses in breast cancer. Curr Opin Genet Dev 2015;30:32–41.
3. Skol AD, Sasaki MM, Onel K. The genetics of breast cancer risk in the post-genome era: thoughts on study design to move past BRCA and towardsclinical relevance. Breast Cancer Res 2016;18:99.
4. Michailidou K, Lindstrom S, Dennis J, Beesley J, Hui S, Kar S, et al.Association analysis identifies 65 new breast cancer risk loci. Nature2017;551:92–4.
5. Coetzee SG, Pierce S, Brundin P, Brundin L, Hazelett DJ, Coetzee GA.Enrichment of risk SNPs in regulatory regions implicate diverse tissues inParkinson's disease etiology. Sci Rep 2016;6:30509.
6. Pierce SE, Tyson T, Booms A, Prahl J, Coetzee GA. Parkinson's diseasegenetic risk in a midbrain neuronal cell line. Neurobiol Dis 2018;114:53–64.
7. Rhie SK, Coetzee SG, Noushmehr H, Yan C, Kim JM, Haiman CA, et al.Comprehensive functional annotation of seventy-one breast cancer riskLoci. PLoS One 2013;8:e63925.
8. Plank JL, Dean A. Enhancer function: mechanistic and genome-wideinsights come together. Mol Cell 2014;55:5–14.
9. Creyghton MP, Cheng AW, Welstead GG, Kooistra T, Carey BW, Steine EJ,et al.HistoneH3K27ac separates active frompoised enhancers andpredictsdevelopmental state. Proc Natl Acad Sci U S A 2010;107:21931–6.
10. Sur I, Taipale J. The role of enhancers in cancer. Nat Rev Cancer 2016;16:483–93.
11. Jia L, Landan G, Pomerantz M, Jaschek R, Herman P, Reich D, et al.Functional enhancers at the gene-poor 8q24 cancer-linked locus.PLoS Genet 2009;5:e1000597.
12. Pomerantz MM, Ahmadiyeh N, Jia L, Herman P, Verzi MP, Dodda-paneni H, et al. The 8q24 cancer risk variant rs6983267 shows long-
range interaction with MYC in colorectal cancer. Nat Genet 2009;41:882–4.
13. Merkenschlager M, Nora EP.CTCF and cohesin in genome folding andtranscriptional gene regulation. Annu RevGenomics HumGenet 2016;17:17–43.
14. Nakamoto M, Ishihara K, Watanabe T, Hirosue A, Hino S, Shinohara M,et al. The glucocorticoid receptor regulates the ANGPTL4 gene in a CTCF-mediated chromatin context in human hepatic cells. PLoS One 2017;12:e0169225.
15. Lupianez DG, Kraft K, Heinrich V, Krawitz P, Brancati F, Klopocki E, et al.Disruptions of topological chromatin domains cause pathogenic rewiringof gene-enhancer interactions. Cell 2015;161:1012–25.
16. Guo Y, Rhie SK, Hazelett DJ, Coetzee GA, Farnham PJ. CRISPR-mediateddeletion of prostate cancer risk-associated CTCF sites identifies repressivechromatin loops. Genome Biol 2018;19:160.
17. Allen EK, Randolph AG, Bhangale T, Dogra P, Ohlson M, Oshansky CM,et al. SNP-mediated disruption of CTCF binding at the IFITM3 promoter isassociated with risk of severe influenza in humans. Nat Med 2017;23:975–83.
18. Lee AV, Oesterreich S, Davidson NE. MCF-7 cells–changing the course ofbreast cancer research and care for 45 years. J Natl Cancer Inst 2015;107.pii: djv073.
19. Howlader N, Altekruse SF, Li CI, Chen VW, Clarke CA, Ries LA, et al. USincidence of breast cancer subtypes defined by joint hormone receptor andHER2 status. J Natl Cancer Inst 2014;106. pii: dju055.
20. Rivandi M, Martens JWM, Hollestelle A. Elucidating the underlying func-tional mechanisms of breast cancer susceptibility through post-GWASanalyses. Front Genet 2018;9:280.
21. Rhie SK, Hazelett DJ, Coetzee SG, Yan C, Noushmehr H, Coetzee GA.Nucleosome positioning and histone modifications define relationshipsbetween regulatory elements and nearby gene expression in breast epi-thelial cells. BMC Genomics 2014;15:331.
Booms et al.
Cancer Epidemiol Biomarkers Prev; 28(10) October 2019 Cancer Epidemiology, Biomarkers & Prevention1744
on June 23, 2020. © 2019 American Association for Cancer Research. cebp.aacrjournals.org Downloaded from
Published OnlineFirst July 10, 2019; DOI: 10.1158/1055-9965.EPI-19-0066

22. Li H, Durbin R. Fast and accurate short read alignment with Burrows-Wheeler transform. Bioinformatics 2009;25:1754–60.
23. Zhang Y, Liu T, Meyer CA, Eeckhoute J, Johnson DS, Bernstein BE, et al.Model-based analysis of ChIP-Seq (MACS). Genome Biol 2008;9:R137.
24. Li QH, Brown JB, Huang HY, Bickel PJ. Measuring reproducibility of high-throughput experiments. Ann Appl Stat 2011;5:1752–79.
25. Ramirez F, Ryan DP, Gruning B, Bhardwaj V, Kilpert F, Richter AS, et al.deepTools2: a next generation web server for deep-sequencing data anal-ysis. Nucleic Acids Res 2016;44:W160–5.
26. Coetzee SG, Coetzee GA, Hazelett DJ. motifbreakR: an R/Bioconductorpackage for predicting variant effects at transcription factor binding sites.Bioinformatics 2015;31:3847–9.
27. Barrett JC, Fry B,Maller J, DalyMJ.Haploview: analysis and visualization ofLD and haplotype maps. Bioinformatics 2005;21:263–5.
28. Quinlan AR, Hall IM. BEDTools: a flexible suite of utilities for comparinggenomic features. Bioinformatics 2010;26:841–2.
29. Dobin A, Gingeras TR. Mapping RNA-seq Reads with STAR. Curr ProtocBioinformatics 2015;51:11.14.1–19.
30. Law CW, Chen Y, Shi W, Smyth GK. voom: precision weights unlocklinear model analysis tools for RNA-seq read counts. Genome Biol2014;15:R29.
31. Ritchie ME, Phipson B, Wu D, Hu Y, Law CW, Shi W, et al. limma powersdifferential expression analyses for RNA-sequencing and microarray stud-ies. Nucleic Acids Res 2015;43:e47.
32. RobinsonMD, Oshlack A. A scaling normalizationmethod for differentialexpression analysis of RNA-seq data. Genome Biol 2010;11:R25.
33. Szklarczyk D, Franceschini A, Wyder S, Forslund K, Heller D, Huerta-Cepas J, et al. STRING v10: protein-protein interaction networks,integrated over the tree of life. Nucleic Acids Res 2015;43(Databaseissue):D447–52.
34. Edgar R, Domrachev M, Lash AE. Gene expression omnibus: NCBI geneexpression and hybridization array data repository. Nucleic Acids Res2002;30:207–10.
35. Nakato R, Shirahige K. Recent advances in ChIP-seq analysis: from qualitymanagement to whole-genome annotation. Brief Bioinform 2017;18:279–90.
36. Landt SG, Marinov GK, Kundaje A, Kheradpour P, Pauli F, Batzoglou S,et al. ChIP-seq guidelines and practices of the ENCODEandmodENCODEconsortia. Genome Res 2012;22:1813–31.
37. Wang H, Maurano MT, Qu H, Varley KE, Gertz J, Pauli F, et al. Widespreadplasticity in CTCF occupancy linked to DNA methylation. Genome Res2012;22:1680–8.
38. Moon H, Filippova G, Loukinov D, Pugacheva E, Chen Q, Smith ST, et al.CTCF is conserved from Drosophila to humans and confers enhancerblocking of the Fab-8 insulator. EMBO Rep 2005;6:165–70.
39. Shen Y, Yue F, McCleary DF, Ye Z, Edsall L, Kuan S, et al. A map of the cis-regulatory sequences in the mouse genome. Nature 2012;488:116–20.
40. Heintzman ND, Hon GC, Hawkins RD, Kheradpour P, Stark A, Harp LF,et al. Histone modifications at human enhancers reflect global cell-type-specific gene expression. Nature 2009;459:108–12.
41. Ernst J, Kheradpour P,Mikkelsen TS, ShoreshN,Ward LD, EpsteinCB, et al.Mapping and analysis of chromatin state dynamics in nine human celltypes. Nature 2011;473:43–9.
42. Chepelev I, Wei G, Wangsa D, Tang Q, Zhao K. Characterization ofgenome-wide enhancer-promoter interactions reveals co-expression ofinteracting genes and modes of higher order chromatin organization.Cell Res 2012;22:490–503.
43. Lomvardas S, Barnea G, Pisapia DJ, Mendelsohn M, Kirkland J, Axel R.Interchromosomal interactions and olfactory receptor choice. Cell 2006;126:403–13.
www.aacrjournals.org Cancer Epidemiol Biomarkers Prev; 28(10) October 2019 1745
Functional Analysis of Breast Cancer Risk Variants in MCF-7
on June 23, 2020. © 2019 American Association for Cancer Research. cebp.aacrjournals.org Downloaded from
Published OnlineFirst July 10, 2019; DOI: 10.1158/1055-9965.EPI-19-0066

2019;28:1735-1745. Published OnlineFirst July 10, 2019.Cancer Epidemiol Biomarkers Prev Alix Booms, Gerhard A. Coetzee and Steven E. Pierce VariantsMCF-7 as a Model for Functional Analysis of Breast Cancer Risk
Updated version
10.1158/1055-9965.EPI-19-0066doi:
Access the most recent version of this article at:
Material
Supplementary
http://cebp.aacrjournals.org/content/suppl/2019/07/10/1055-9965.EPI-19-0066.DC1
Access the most recent supplemental material at:
Cited articles
http://cebp.aacrjournals.org/content/28/10/1735.full#ref-list-1
This article cites 42 articles, 4 of which you can access for free at:
E-mail alerts related to this article or journal.Sign up to receive free email-alerts
Subscriptions
Reprints and
To order reprints of this article or to subscribe to the journal, contact the AACR Publications Department
Permissions
Rightslink site. Click on "Request Permissions" which will take you to the Copyright Clearance Center's (CCC)
.http://cebp.aacrjournals.org/content/28/10/1735To request permission to re-use all or part of this article, use this link
on June 23, 2020. © 2019 American Association for Cancer Research. cebp.aacrjournals.org Downloaded from
Published OnlineFirst July 10, 2019; DOI: 10.1158/1055-9965.EPI-19-0066