cancer humans - monographs.iarc.fr · polychlorinated dibenzo-para-dioxins 2. studies of cancer in...
TRANSCRIPT

POLYCHLORINATED DIBENZO-para-DIOXINS
2. Studies of Cancer in Humans
2,3,7,8-TCDD is b g h t to be the most toxic PCDD congener, followed in presumed toxicity by the higher chlorinated PCDDs. Lower chlorinated PCDDs are thought to be much less toxic.
The focus of this review of human studies is on studies in which exposure to 2,3,7,8- TCDD or higher chlorinated P'CDDs can be presumed or is documented. Typically tJiis involves exposure to phenoxy herbicides contaminated by 2,3,7,8-TCDD (particularly 2,4,5-T) or to other contaminated chemicals used in manufactking processes (e.g., TCP).
Shrdies involving only exposure to herbicides not contaminated by PCDDs (e.g., 4-chlom-2-methy2phenoxyacetic acid (MCPA)) are not reviewed (e.g., Coggon et al- , 1986; Lynge, 1993). Studies involving only exposure to unspecified combinations of pesticides and herbicides are also not reviewed (e.g,, Blair et al., 1983) because the

138 IARC MONOGRAHS VOLUM 69
extent of exposure to PCDD-containing herbicides (if any) is unkown. Studies invol-ving only exposure to 2,4-D, that is not likely to have been contaminated by higherchlorinated PCDDs, are also not discussed. Studies involving exposure to substancescontaminated with higher chlorinated PCDDs without 2,3,7,8-TCDD, e.g., PCP, arediscussed separately from studies involving exposure to 2,3,7,8-TCDD.
Blood concentrations reported are lipid-based, unless otherwise noted (see Section1.4).
2.1 Industrial exposures and industrial accidents
The cohort study populations considered by varous authors overlap in manyinstances. However, different publications on overlapping study groups may havedifferent focuses, e.g., incidence/mortality, different follow-up periods, different expo-sure assessment and other characteristics. Therefore, Table 32 presents the relationshipbetween different publications which are considered relevant for this monograph in termsof study population size.
2.1.1 Exposure to 2,3,7,8-TCDD and higher chlorinated PCDDs/PCDFs in chemicalplants
Cohort studies are summarzed in Table 33.
W orkers at chemIcal plants in the United States which produced chemIcals conta-minated with PCDDs/PCDFs (primarly TCP and/or 2,4,5- T) have been studied exten-sively. There has been a series of publications on two separate plants and a larger studyof 12 plants which included most United States workers manufacturing these products
who were exposed specifically to 2,3,7,8-TCDD. ln the latter study, serum PCDDmeasurements were available for some workers.
(a) Two United States plants
Nitro plant
Workers at a Monsanto plant in Nitro, WV, have been studied by Zack and Suskind(1980), Zack and Gaffey (1983) and Collns et al. (1993). Zack and Suskind (1980)
studied 121 male workers (one woman is not included in the mortality analysis) whodeveloped chloracne after an accident during production of TCP in 1949. These workerswere followed through 31 December 1978 with person-time at risk beginnng at theaccident. United States referent rates were used. Thiry-two deaths were observed(standardized mortality ratio (SMR), 0.7; p ~ 0.05), of which nine were cancer deaths(SMR, 1.0). No significant excess was found for any specifie cancer, although lungcancer was elevated (5 observed; SMR, 1.8). One soft-tissue sarcoma was observed - afibrous histiocytoma (classified as a skin cancer (ICD-8, 172-173)), with 0.2 skicancers expected. Thee deaths from lymphatic and haematopoietic cancers were
observed (SMR, 3.4).

POL YCHLORIA TED DIBENZO-para-DIOXINS 139
Table 32. Relationship between Industrial cohort study groups with exposure to2,3,7,8- Tt:i)i)
Kogevinas et aL.
(1997);: Fingerhut et al.
(1991a,b)(USA, NIOSH,12 plants)
;: Bond et al. (1989a),Ott et al. (1987),Cook et al. (1986)
(Dow, Midland, MI);: Zack & Gaffey (1983)
(Monsanto, Nitro, WV);: Collins et aL. (1993)
(Monsanto, Nitro, WV);: Bueno de Mesquita et al.
(1993), Hooiveld et al.(1996a) (Netherlands)
;: Coggon et al. (1991)(United Kingdom)
;: Flesch-Janys et aL.
(1995)(Boehrnger - Ingelheim)
;: Saracci et al. (1991)
;: Becher et al. (1996)
(Boehrnger - Ingelheim,Bayer, BASF (not theaccident) )
Ott & Zober (1996),Zober et aL. (1994),Zober et aL. (1990)
(accident, BASF)
;: Ramlow et aL.
(1996)(Dow,Midland, MI)
Manz et aL. (1991)(Boehrnger-Ingelheim)
A ;: B denotes that the study population of B is a subset of A.A, B denotes that the study populations A and B are almost identicaL.AlI publications mentioned contain results considered to be relevant by the W orking Group.The study populations of Collns et aL. (1993) and Zack & Gaffey (1983) overlap in par.Specifie female cohorts (Kogevinas et al., 1993; Nagel et aL., 1994) are not inc1uded.
Zack and Gaffey (1983) studied 884 white male employees at the Nitro plant whowere active on or after 1 Januar 1955 with one or more years of employment as hourlyworkers. This cohort included all workers at the plant, not just those exposed to PCDDs.FolIow-up was through 31 December 1977 and United States referent rates were used.There were 163 deaths in thIs cohort (SMR, 1.0). Nine deaths from urinar bladdercancer were observed (SMR, 9.9). The excess of urinar bladder cancer was attributed tothe use of 4-amnobiphenyl (see IARC, 1987f), a known urnar bladder carcinogen.Seven of these cancers had been detected earlier in a screening programe. W ork historyof decedents was examned to determne if the men had been assigned to 2,4,5- Tproduction. For 58 men so identified, a proportionate mortality study was conducted.Nine cancers were observed (proportionate mortality ratio (PMR), 0.8). Six were lungcancers (PMR, 1.7). No haematopoietic cancer occurred in ths group. One soft-tissuesarcoma (a liposarcoma) was observed; no expected number for soft-tissue sarcoma wasgiven. (An unkown, but probably small, number of workers who worked with TCP butnot with 2,4,5- T would have been omitted from thIs analysis).
Collns et al. (1993) studied 754 workers who had worked at the Nitro plant for oneday or more between 8 March 1949 (the date of the above-mentioned accident) and
-.to
Table 33. Industrial cohort studies and populations exposed to indus trial exposures and industrial accidents
Reference, Study subjects Study type/ Exposure Gender Cancer site/cause of No. RR 95% CI Commentscountr Period of death obs.
folIow-up
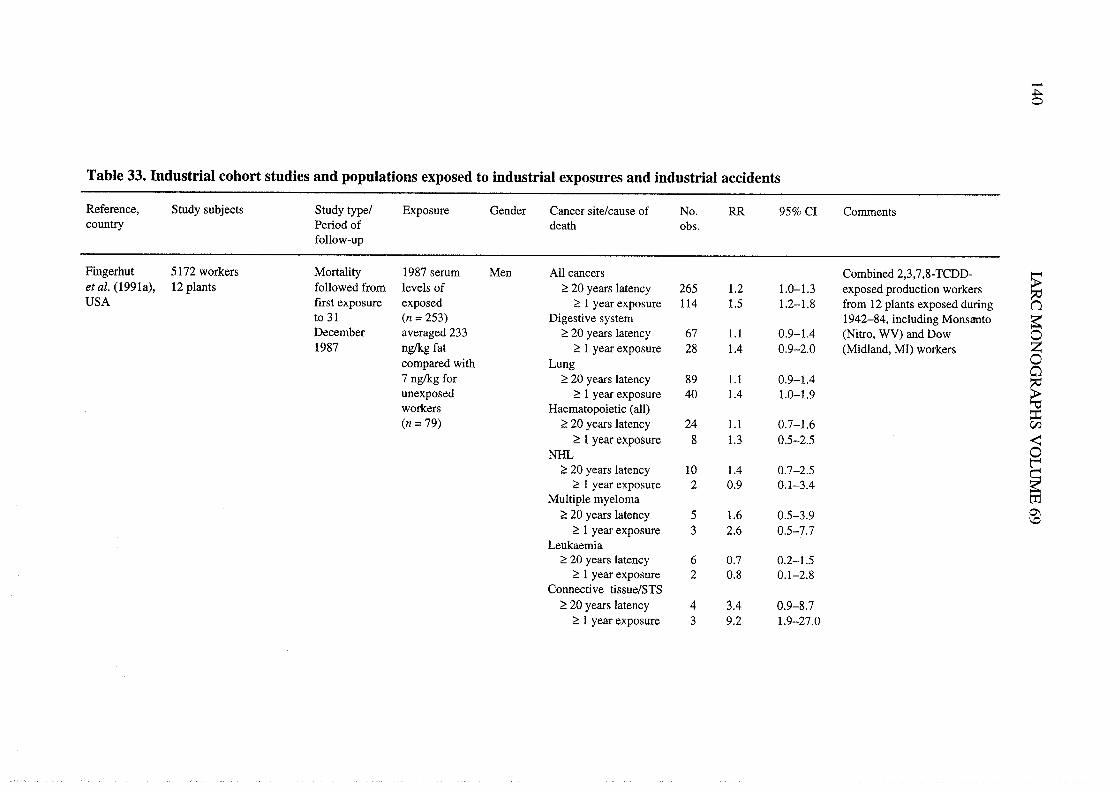
Fingerhut 5172 workers Mortity 1987 serum Men All cancers Combined 2,3,7,8-TCDD- -~et aL. (1991a), 12 plants followed from 1eve1s of ;: 20 years 1atency 265 1.2 1.0-1. exposed production workers :;USA first exposure exposed ;: 1 year exposure 114 1.5 1.2-1.8 from 12 plants exposed during (1
to 31 (n = 253) Digestive system 1942-84, including Monsanto ~December averaged 233 ;: 20 years latency 67 1. 0.9-1.4 (Nitro, WV) and Dow 01987 ng/kg fat ;: 1 year exposure 28 1.4 0.9-2.0 (Midland, MI) workers Z
compared with Lung 0c:7 ng/kg for ;: 20 years latency 89 1. 0.9-1.4
~unexposed ;: 1 year exposure 40 1.4 1.0-1.9workers Haematopoietic (alI) ::(n = 79) ;: 20 years latency 24 1. 0.7-1.6 CI
;: 1 year exposure 8 1. 0.5-2.5 ~NH 0
l';: 20 years latency 10 1.4 0.7-2.5
~;: 1 year exposure 2 0.9 0.1-3.4Multiple myeloma tT
;: 20 years latency 5 1.6 0.5-3.9 0\\0;: 1 year exposure 3 2.6 0.5-7.7
Leukaella;: 20 years 1atency 6 0.7 0.2-1.5
;: 1 year exposure 2 0.8 0.1-2.8Connective tissue/STS
;: 20 years latency 4 3.4 0.9-8.7;: 1 year exposure 3 9.2 1.9-27.0

Table 33 (coiitd)
Reference, Study subjects Study type/ Exposure Gender Cancer site/cause of No. RR 95% CI Commentscountr Period of death obs.folIow-up
Ott & Zober 243 workers accidentally Mortlity and 2,3,7,8-TCDD Men AlI cancers Mortality "'(1996), exposed to 2,3,7,8-TCDD incidence serum levels in .. 0.1 Ilg/kg bw 8 0,8 0.4-1.6 (p","" = 0.07); local reference 0(BASF) in a TCP unit in a 1953-92 138 subjects in 0.1-D.99Ilg/kg bw 8 1.2 0.5-2,3 L'~Germany chemIcal plant 1988-92. 1.0-1.99Ilg/kg bw 8 1.4 0.6-2.7 \.Model-based ~ 2.0 Ilg/kg bw 7 2.0 0.8-4.0
Pestimation for AlI cancers 13 2.0 1.0-3.4 ~ 1 Ilg/kg bw, ;: 20 years of 0other workers Respiratory 6 3.1 1.-6.7 latency
~AlI cancers 18 1.9 1.-3.0 113 chloracne cases, latencyDigestive system 6 1.8 0.7-4.0 ~ 20 years; mortality ;iRespiratory tract 7 2.4 1.0-5.0 gRespiratory tract 8 2.0 0.9-3.9 Incidence, ~ 1.0 Ilg/kg bw t:Digestive tract 11 1.5 1.-1.9 Cox's regression; deaths t:
12 1.4 1.-1.7 Cox's regression; incidentSE
cases; internaI comparson trcontrollng for known Z
Nconfounders 0Man et al. 1184 men and 399 women Mortlity TCP,2,4,5-T Men AlI cancers Gas workers reference -t
~(1991), employed in a herbicide 1952-89 and 2,3,7,8- High exposure 29 1.8 i .2-2.6 (p,~"" = 0.24) i:(Boehrnger- plant; 496 high exposure; TCDD; fat Medium exposure 39 1.2 0.9-1.6 1
VIngelheim) 901 medium exposure; levels in 48 Low exposure 7 1.5 0.6-3.0 ~0Germany 186 low exposure subjects in Women AlI cancers NG 0.9 0.6-1.5 National reference ~1985 Breast 9 2.2 1.0-4.1 ZMedian fat rz2,3,7,8-TCDD,137 ng/kg high
exposureMedian fat2,3,7,8-TCDDmedium + low,60 nglg
...t..

142
CJ
ë~ouo~ln0\f2å cñ
Z .g
"'ooCJ
::olu--.~CJ
..8..ã ~
u .g
..°"di:°oo..::CJ
o~ii--&"' 0.
.. 0 ;:;, "8 ~"d 'C .9
E Q) -
ui il ~
.."e-=~CJ
'-~~~-,.i=~
lJu°E;:CJ
.sBuiaiu~ g
~ i:
° ;:P: 8
IAC MONOGRAPHS VOLUME 69
eo eo
eo~ ~~~~.§ ~ i: ~ 2~ eoeoi: eoi: ~oo 0E
"sb. i: i: ln i: N
OM
.19 ;: -i:lnO\ .ln\O bh 1 i: CJ ¡;
C'o;OÖ¡:~~ ~t; o.i:-
NM
O\N
IL C
J'T E
l 02- 111\0-. 'TOCJ-¡
1 M \0 0 . . K M U'C °
aNo;o;¡:~
0",.. i: El
- .. M 0\ N
ln USE
å':.ClCICICICICI"'u ° 0 0
ii ii ii ii ii ii a E- ë u .. "d
E- E- E- E- E- E- 0 . . - -a "d °
"8 "8 "8 "8 -g "8 v ~ oi E
~ -g
000000 ~t"~
~o.ü
ii ii ii ii ii ii i: Ñ i: ,s ~ ~
~ N ~ ~ ~i' :
1 1 1 1 1
66Ó6Ó
t;a ": C
' C' ": i-N
000000zzzzzz
CJ
..ouãu~i:°~r. "d
o ~
u ~ ~
~i§"d~
~ '..t)
~ -: -:
~ 8 ~
oo 0
U ;:
~ f3 i:
00 *- *-
r-n~~. - 0
MO
;:.. *- cU
N.._
,Õ
.S ~~ ~J;..o~
ÒN
~ 9'
t! No ln~
;:,5"d°..oõ.E
l°C
J..o~o~0\00-..
.s§'~ CJ
õ."2 ~o .. U
~.i ~
~ § 8
ol u il,.~
~~
~ ~
--~
g: ~ g: gf.5 5'
.g0g:0:§:š §
~~~ti8~Q)
¡it;¡it;6,s0
00MJ..
\01-
oNMN
ozoz
N "d
0\ ~
0\ ol
- ..
.. CJ
l8 i)i: ~.9 0
.~ ~~
õ
oui:~~o..-ai:.S~Z-.~o-O\
..lr?-Nr-
1 1 1 1 1
a":aÓC
'
C'~-.r-~
00 0\ i- C' \0
M 'T
--
.~v~
'õ~ l ~
8 0. El
~~ b.~~
_Ud_Z
:; Æ.3 ~
i:°~
CJ
o00 1 ~
i- C' u
~ êñ ~
~ M ~ 8
il"d~~i: 0 :: ¡:
'c.9 ~ ;:
.d ii 0 Zo . 0\ .0....00ii El i: ~
'- *- *- bO
.. ~ 0 i:
..~ 0 N
ã b. U ln
¡:,sE-~
~ C
' \0'î~1'1-aC
'a
": "1 'T ~
'T 0
N C
' ir N..
r-....~("N0\ C' -.~v'õ
CJ g.8 ~
ã M ~
u ìS..
:i .3 ~
,. 00 ,.
¡:"'- õS00 ~
8g i:u.g 00 E- ~ ~ E-
:g 0 æ ~
oq g. g. ~.. 0 0 "1 i-. è) i: e; t-~uU
'T."':dU
:d"'::ililNN uE- uN
.. 0\
.. 00
;. 1
ol CJ
t: 0o ln~
;:
..;: ..~ ~
El i:
J~ .5 ~~ "d o."d
~~'õ§J; õ i:è) ;: 0 ~~
.5'B ',g
J:.g ..~§o-e~
õ. is~
~ u: l:
t; S8;..
~ ~
';: :: §.. ~
~~
êá:O
\o~oii 0~ t; 0
CJ
õi:°..0.8o:du
~~il i: to °
i: .- t- i:,- 0 ~ g'E
oi:e;°U
ln:d~
E- g: u
~ 1 .. f.
o ~~ cÀ ~
fi ii t" N ~
~;;Ñ~f3
:d .. "8 J; ~u § 0 .. ¡:'õ¡:ii~a0- "1
ln M'î "f- "1
olEl
oõ..El
~l~
oou. E-
E- 00
, .ln i-.. t"
ÑÑ
"d,. °
.. "d
Òt
o i:.. .-
g ¡(
u. .c
~ S
§ ~i: ..,- ;:~
~.s
~ 'õ B
o "' en
~ 0.5
=; 00
.. M1 1i- II
£8a ":..
N \0 0
..CJ
~u~ gf~
~.3 Z
~~
CJ
Õ~
-g i:..i:bJol~K
;: ,!3 E- 0.
o 8.;g.~ 8
i: El .. - ~ 0
~ou'T--
il () ,5 Ñ ~
Ò i-
~ or
t: IIo i-~
;:gp"d :q~'-~~~~~
0\ ~o Ë ¡(.. g
~ i::g .5 -g 00
-a ~ .~ _'" .. i-.. .. 0. 1
'§ 0 ~ g ~ eg
o gp.. ~ ~;:~ .- ~ 0. E-
~goo.eo&l '8 ~ ~ "1.13
~ is-ã:§~-6
..':..cu ,. El
i: ... 0
&i ;: .. -g "'
eog:§'ãgf80e;::~

Table 33 (contd)
Reference, Study subjects Study type/ Exposure Gender Cancer site/cause of No. RR 95% CI Commentscountr Period of death obs, "0
follow-up 0l'~Bueno de W orkers in synthesis and Mortality 2,4,5-T, Men AIl cancers 26 1.2 0.5-1. Factory A only, exposed (1
::Mesquita et al. formulation of phenoxy 1955-86 PCDDs, Pancreas 3 2.9 0,6-8.4 workers versus national l'(1993), The herbicides and 2,3,7,8-TCDD Large intestine 3 2.4 0.5-7.0 population 0Netherlands chlorophenols in two Lung 9 1.0 0.5-1.9
~plants (963 exposed, 1111 Prostate 2 2.2 0,3-7.8 ~unexposed); Factory A, Lymphosarcoma 1 2.0 0.1-11.4&1accident in 1963; exposure Myeloid leukaemia 1 2.9 0.1-15,9
to 2,3,7,8-TCDD AIl cancers 31 1. 0.9-3.4 Both plants; exposed versus VVRespiratory tract 9 1.7 0.5-6.3 unexposed ~t:
Accidental AIl cancers 10 lA 0,7-2.5 Factory A; national reference~exposure inN
1963 0Case/control OR ~
¡:Kogevinas 1 1 STS cases and 55 Nested case- Exposure to 21 Men and STS 10/30 10.3 1,2-90.6 Any phenoxy herbicide ~
1et al. (1995), healthy controls; 32 Nll control study chemicals women 9/24 5.6 1.-27.7 Any PCDD or PCDP Vinternational cases and 158 healthy withn the including 5/13 5.2 0.9-31.9 2,3,7,8-TCDD ~0controls IARC cohort major phenoxy NH 19/85 1.3 0,5-2.9 Any phenoxy herbicide tx
reported by herbicides, 20/78 1.8 0.8-4.3 Any PCDD or PCDF~Z
Saracci et al. PCDDs, raw 11/39 1.9 0.7-5.1 2,3,7,8-TCDD en(1991) materials and
other processchemicals
...tw

..tTable 33 (contd)
Reference, Study subjects Study type/ Exposure Gender Cancer site/cause of No. RR 95% CI Commentscountr Period of death obs.follow-up
Kogevinas 21 863 in 36 cohorts from Mortality 2,3,7,8-TCDD 20851 AlI cancers Combined PCDD-exposedet al. (1997), 12 countres or higher men, Exposed to 2,3,7,8- 710 1. 1.0-1.2 workers (production andinternational chlorinated 1012 TCDD and higher spraying) from 36 cohorts
PCDDs versus women Exposed to lower or 398 1.0 0.9-1. with vared follow-up from -not exposed to no PCDD 1939 to 1992. Inc1udes and ~~2,3,7,8-TCDD Digestive system updates lARC cohort (Saraccì nor higher Exposed to 2,3,7,8- 190 (1.0) (0.9- 1.2) et al., 1991), adds NIOSH ~chlorinated TCDD and higher cohort (Fingerhut et al., 0PCDDs or no Exposed to lower or 106 (0.9) (0.7-1.) 1991a,b) and adds four plants ZPCDD no PCDD in Germany (Manz et aL., 00exposure Lung 1991; Becher et aL., 1996;
~Exposed to 2,3,7,8- 225 1. 1.0-1. Flesch-Janys et al., 1995).TCDD and higher Largest combined cohort of "'
:iExposed to lower or 148 1.0 0.9-1.2 PCDD-exposed workers. CIno PCDD ~
Haematopoietic (all) 0~Exposed to 2,3,7,8- 57 1. (0.8- 1.4)
~TCDD and higherExposed to 2,3,7,8- 35 1. (0.8- 1.6) mlower or no PCDD 0\
\0NHExposed to 2,3,7,8- 24 1.4 0,9-2.1TCDD and higherExposed to lower 9 1.0 0.5- 1.9
or no PCDDMultiple myelomaExposed to 2,3,7,8- 9 1.2 0.6-2.3TCDD and higherExposed to 10wer 8 1.6 0.7-3.1or no PCDD

Table 33 (contd)
Reference, Study subjects Study type/ Exposure Gender Cancer site/cause of No. RR 95% CI Cornentscountr Period of death obs.
folIow-up
Kogevinas Leukaemiaet al. (1997), Exposed to 16 0.7 004-1.2 '"international 2,3,7,8-TCDD and 0(contd) higher l'~Exposed to lower 17 lA 0.8-2.3 (J
or no PCDD pConnective tissue/STS 0Exposed to 2,3,7,8- 6 2.0 0.8-4.4
~TCDD and higherExposed to lower or 2 1 A 0.2-4.9 ;ino PCDD ~
mBertzi et al. Residents in contamnated Incidence 2,3,7,8-TCDD: v
Local reference. Median V(1993), zones after the Seveso 1977-86 Zone A; soil Men AlI cancers 7 0.7 0.3-1.5 -Italy accident: Zone A, 724; levels, Digestive system 2 0,7 0,2-2.8 2,3,7,8-TCDD level in the te
reference area (52 samples in trZone B, 4824; Zone R, 15.5- Lung 2 0.8 0.2-3.4 Z31 647; age, 20-74 years 580 ¡.g/m'; Women AlI cancers 7 1.0 0.5-2.1
1992-93), 5.5 ng!kg blood Nmedian blood Digestive tract 3 1. 0.6-504 (Landi et aL., 1996) 0'~'
~levels in adults, ~389 ng!kg ~
1(back- Vcalculation) -0Zone B; soil Men AlI cancers 76 1. 0.9-1.4 Local reference ~levels, Digestive system 18 0.9 0.6-1.5 cz.; 50 ¡.g/m'; Hepatobilar 5 1.8 0.7-4.4median blood Liver 4 2.1 0.8-5.8levels in adults, Lung 18 1. 0.7-1.878 ng!kg Haematopoietic 8 2.1 1.0-4.3(back- NH 3 2.3 0.7-704calcu1ation) Lymphoreticulosarcoma 3 5.7 1.7-19.0
Multiple myeloma 2 3.2 0.8-13.3Leukaemia 2 1.6 004-6.5
,.LVi
-.t0'
Table 33 (contd)
Reference, Study subjects Study type/ Exposure Gender Cancer site/cause of No. RR 95% CI Commentscountr Period of death obs.
follow-up
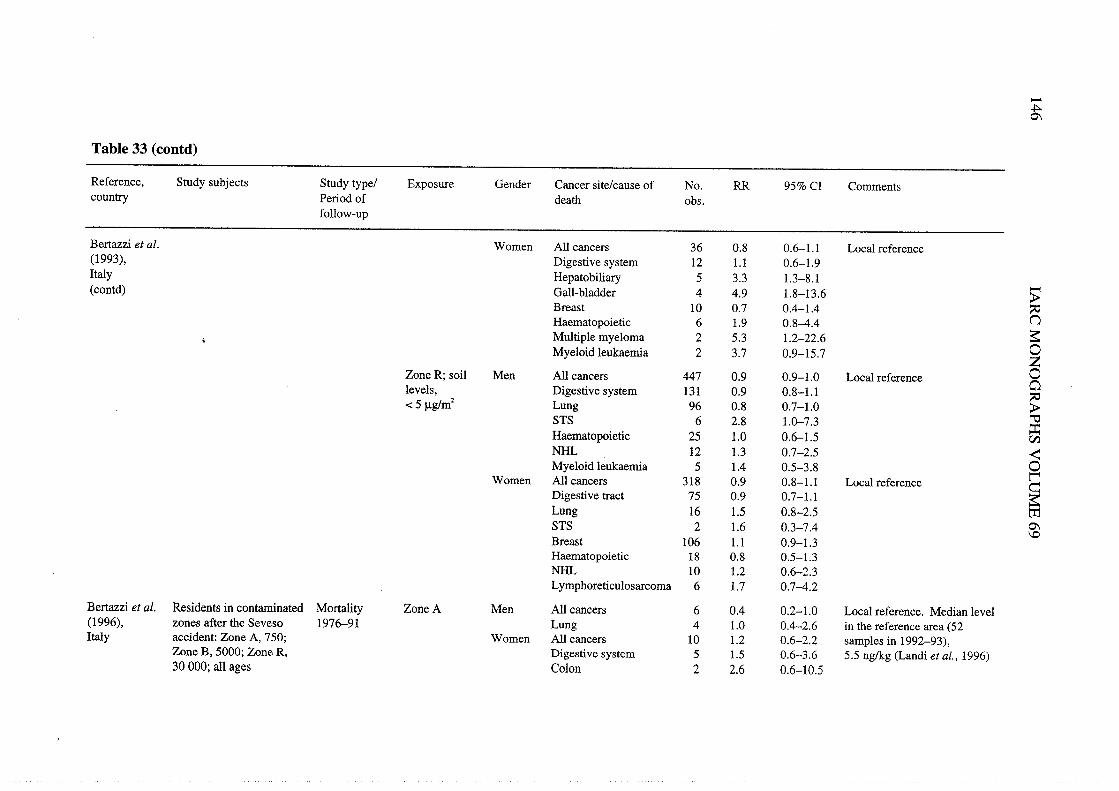
Bertzi et al. Women Ail cancers 36 0.8 0.6-1. Local reference(1993), Digestive system 12 1. 0.6-1.9ltay Hepatobilar 5 3.3 1.-8.1(contd) Gall-bladder 4 4.9 1.8-13.6 :;
Breast 10 0.7 0.4- 1.4 itHaematopoietic 6 1.9 0.8-4.4 \.Multiple myeloma 2 5.3 1.2-22.6 a'Myeloid leukaemIa 2 3.7 0.9-15.7 0
ZZone R; soil Men AIl cancers 447 0.9 0.9- 1.0 Local reference 00levels, Digestive system 131 0.9 0.8-1.
~-c 5 Ilglm2 Lung 96 0.8 0.7-1.0
STS 6 2.8 1.0-7.3 ::Haematopoietic 25 1.0 0.6-1.5 CINH 12 1. 0.7-2.5 ~Myeloid leukaemIa 5 1.4 0.5-3.8 0
t"Women All cancers 318 0.9 0.8-1. Local reference
~Digestive tract 75 0.9 0.7-1.Lung 16 1. 0.8-2.5 trSTS 2 1.6 0.3-7.4 0'
\0Breast 106 1. 0.9-1.3Haematopoietic 18 0.8 0.5-1.NH 10 1.2 0.6-2.3Lymphoreticulosarcoma 6 1.7 0.7-4.2
Bertzi et al. Residents in contanated Mortality Zone A Men AIl cancers 6 0.4 0.2-1.0 Local reference. Median level(1996), zones afer the Seveso 1976-91 Lung 4 1.0 0.4-2,6 in the reference area (52Italy accident: Zone A, 750; Women AIl cancers 10 1.2 0.6-2.2 samples in 1992-93),
Zone B, 5000; Zone R, Digestive system 5 1. 0.6-3.6 5.5 ng/kg (Landi et aL., 1996)30 000; all ages Colon 2 2.6 0.6-10.5

Table 33 (contd)
Reference, Study subjects Study type/ Exposure Gender Cancer site/cause of No. RR 95% CI Commentscountr Period of death obs.foIlow-up
Bertzi et al. Zone B Men AIl cancers 104 1. 0.9-1. Local reference(1996), Digestive system 33 0.9 0.7-1.
"'Itay Rectum 7 2.9 1.4-.2 0(contd) Lung 34 1.2 0.9-1.7 l'~Haematopoietic 12 2.3 1.3--.2 nNH 2 1.5 0.4-.0PHodgkin's disease 2 3.3 0.8-14.0 0LeukaemIa 7 3.1 1.4-.7
~Women AIl cancers 48 0.9 0.7-1.2
Digestive system 18 0.8 0.5-1. ~Stomach 7 1.0 0.5-2.2 gHepatobilar 4 1. 0.4-3.1 tiLiver 3 1. 0.4-.0 tiBreast 9 0.8 0.4-1.5 æHaematopoietic 7 1.8 0.8-3,8 trHodgkin' s disease 2 6.5 1.5-30.0 Z
NMyeloma 4 6.6 2.3-18.5 0Men and Thyroid 2 (3.9) (0.4-14.1) .twomen ~¡:Zone R Men AIl cancers 607 0.9 0.8-1.0 Local reference 1
tiDigestive system 226 0.9 0.8-1.0 ..0Oesophagus 30 1.6 1.-2.4 ;xLung 176 0.9 0.8-1. ..ZSTS 4 2.1 0.7-6.5 CI
Haematopoietic 27 0.8 0.5-1.2Women AIl cancers 401 0.9 0.8- 1.0 Local reference
Digestive system 158 0.9 0.8-1.0Lung 29 1.0 0.7-1.6Breast 67 0.8 0.6-1.0Haematopoietic 29 0.9 0.6-1.4
Abbreviations: NH, non-Hodgkin lymphoma; STS, soft-tissue sarcoma; NG, not given...r-i

148 IAC MONOGRAHS VOLUME 69
22 November 1949 (the date of the last reported case of chloracne resulting from theaccident clean-up) (this study includes the 122 chloracne cases of Zack & Suskind,1980). Person-time at risk began on 8 March 1949 or at date of hire, if hied between 8March and 22 November 1949, and extended through 31 December 1987 (23 198person-years). FoIlow-up was complete for 733 workers. United States referent rateswere used. The cohort was further subdivided into four groups: (1) 461 workers withoutchloracne and judged not to have been exposed to 4-aminobiphenyl; (2) 171 workerswithout chloracne but with exposure to 4-amnobiphenyl; (3) 97 workers with cWoracneand no exposure to 4-aminobiphenyl; and (4) 25 workers with chloracne and exposure to4-aminobiphenyL. Three deaths from soft-tissue sarcoma occurred in the cohort: one inthe group without chloracne but with exposure to 4-amnobiphenyl (upon review, thiscase was not a soft tissue sarcoma) and two in the group with cWoracne and withexposure to 4-aminobiphenyL. Excesses of urinar bladder cancer occurred in all groups,but primarly in the group without cWoracne but with exposure to 4-aminobiphenyl
(10 observed; SMR, 22; 95% CI, 10.4-40.0). The authors considered that the deaths dueto soft-tissue sarcoma may have been caused by 4-aminobiphenyL. (The W orking Groupconsidered that this argument is weakened by two points. First, the one case of soft-tissuesarcoma occurrng in the group without cWoracne but with exposure to 4-aminobiphenylapparently may have been exposed to 2,3,7,8-TCDD, as suggested by additional datapresented in the study. Second, there are no human data indicating that 4-amnobiphenylor other aromatic amines cause soft-tissue sarcoma and hence no strong reason to believeit could act as a confounder for soft-tissue sarcoma occurrence due to PCDDs.) (AIl butone of the confirmed cases of soft-tissue sarcomas of the Fingerhut et aL. (1991a) studyare included in Collns et aL. (1993)).
Midland plant
W orkers at a Dow plant in Midland, MI, have been studied in a series of publications.Ott et al. (1980) studied 204 male workers exposed to 2,4,5-T from 1950 to 1971 (theperiod during which it was manufactured) (157 with less than one year's exposure). Themethod of worker selection may have missed some short-term workers, but aIl workerswith at least one year of employment in the 2,4,5- T work area would have been included.Sorne workers with exposure to TCP (but no exposure to 2,4,5- T) may have beenexcluded from this analysis. No case of chloracne was identified in this group. FolIow-upextended through 1976. United States referent rates were used. Only 11 deaths occurredin this cohort (20 expected) and only one cancer death (a respiratory cancer in a smoker)(3.6 expected).
Cook et al. (1980) studied 61 men at the same plant in Midland, MI, who worked inTCP production in 1964 (there was an incident in June 1964 in the plant and theseemployees have been exposed to 2,3,7,8-TCDD); 49 developed chloracne at that time.FolIow-up extended though 1978 and 40 men were stil working at the end of 1978.United States referent rates were used. Only four deaths were observed versus 7.8expected; three were due to cancer versus 1.6 expected (one soft-tissue sarcoma (fibro-sarcoma) occurred).

POL YCHLORIATED DIBENZO-para-DIOXIS 149
A cohort of 2189 (later 2192) workers at the Midland, MI, plant exposed to higherchlorinated phenols (three or more chlorines) and related products (including 2,4,5- T)was studied by Cook et al. (1986), Ott et al. (1987) and Bond et al. (1989a). (Bond et al.(1989a) also included a sub-cohort analysis of the mortality of 323 men diagnosed withchloracne.) The cohort was defined on the basis of work in deparments manufacturingTCP, PCP, 2,4,5-T and 2,4,5-T esters. Among these, only PCP did not contain 2,3,7,8-TCDD (Fingerhut et aL., 1991b), although it did contain hexa-, hepta- and octa-CDDs.Production of these chemIcals began at varous dates from 1937 to 1955, and endedbetween 1971 and 1982. W orkers were ranked on a scale of 0 to 4 for intensity of expo-sure to 2,3,7,8-TCDD and from 0 to 2 for intensity of exposure to hexa-, hepta- and octa-CDDs, with each unit representing an increase on a logarthmic scale. Exposure datawere available from wipe samples, process streams and intermediate products. 2,3,7,8-TCDD was present at 1818 mg/kg (mean of 28 samples) in TCP waste streams in the1960s and 1970s and at much lower levels in other process streams and in the inter-mediate product (range, 0.1-116 mg/kg) (Ott et aL., 1987). Almost aU of these workerswere included in the United States NIOSH 12-plant cohort studied by Fingerhut et aL.(1991a,b), which was restricted to workers with some exposure to 2,3,7,8-TCDD; theonly workers in the Midland, MI, cohort of 2192 who were excluded from Fingerhutet al. (1991a,b) were approximately 100 workers with exposure to PCP only.
Cook et al. (1986) foUowed the cohort of 2189 men from 1940 though 1979 andfound an SMR for all causes of death of 0.9 and for all cancers of 1.0. No specific cancersite showed an increase.
Ott et al. (1987) followed up the same cohort (2187 men) through 1982 with only 25(1 %) lost to folIow-up; United States referent rates were used. Approximately 50% of thecohort had worked in exposed areas for less than one year and only 209 men had workedfor 10 years or more; 823 were stil employed at the end of follow-up. The overall SMRwas 0.9 (95% confidence interval (CI), 0.8-1.0) based on 370 deaths. There were 102cancer deaths (SMR, 1.0; 95% CI, 0.8-1.3) and the SMR for cancer with 20 or moreyears' latency was not significantly elevated(SMR, 1.3; 95% CI, 1.0-1.6). There was nosignificant elevation for cancer deaths, except for the category of other and unspecifiedneoplasms (12 observed; SMR, 2.6). Respiratory tract cancer mortality (23 deaths; SMR,0.82) was not elevated. Elevations based on small numbers were observed for stomachcancer (6 observed, SMR, 1.6; 95% CI, 0.6-3.4) and lymphatic and haematopoietic
cancers (12 observed; SMR, 1.5; 95% CI, 0.8-2.6), with the excess in the latter categoryaccounted for mainly by non-Hodgkin lymphoma (5 observed; SMR, 1.9; 95% CI, 0.6-4.5) and multiple myeloma (2 observed; SMR, 2.0; 95% CI, 0.2-7.2). One death wasinitially classified as due ta soft-tissue sarcoma (a fibrosarcoma); however, upon patho-logy review, this cancer was determned to be a renal clear-cell carcInoma. Analyses bycumulative exposure intensity scores showed no significant trend (at the p = 0.05 level)with increased exposure to 2,3,7,8-TCDD or to hexa-, hepta- or octa-CDDs for anyspecifie cancer, although there was some increase in digestive tract cancers withincreasing 2,3,7,8- TCDD exposure.

150 lAC MONOGRAHS VOLUME 69
Bond et aL. (1989a) increased by two years (though 1984) the folIow-up of the cohortstudied by Ott et al. (1987) (vital status was established for 2191 subjects). There was anincrease in the number of deaths by 36, bringing the total to 406 (SMR, 0.9; (95% CI,0.8-1.0)). Cancer deaths increased in number by 14 to make a total of 95 (SMR, 1.0;(95% CI, 0.8-1.3)). Two additional deaths from stomach cancer (8 observed (SMR, 2.0;(95% CI, 0.9-3.9)), one (additional) death froID soft-tissue sarcoma (2 observed (onemisclassified); (SMR, 5.0; 95% CI, 0.6-18.1)) and one additional death from non-Hodgkin lymphoma (6 observed; (SMR, 2.1; 95% CI, 0.8-4.5)) occurred. These ele-vations felt short of statistical significance. The two cases of soft-tissue sarcoma (one ofwhich was actually misclassified) occurred in workers with chloracne. No other statis-tically significant trend with cumulative dose (of either 2,3,7,8-TCDD or hexa-, hepta- orocta-CDDs) occurred. Results from a sub-cohort of 323 male workers diagnosed withchloracne were presented, based on a review of 2072 (95% of the cohort) companymedical records. Diagnoses of chloracne were included if they were considered
'probable' or 'definite'; person-time at risk began at the time of diagnosis. This sub-cohort had 4871 person-years of observation and 37 deaths (SMR, 0.8; 95% CI, 0.6-1.1)and only seven cancer deaths (SMR, 0.7; 95% CI, 0.3-1.4). The presence of chloracnewas more prevalent in those who had the highest cumulative exposure to either 2,3,7,8-TCDD or hexa-, hepta- or octa-CDDs. Mortality in this sub-cohort was unremarkableexcept for soft-tissue sarcoma, for which two deaths (which included the misclassifiedcase) were observed versus -c 0.1 expected.
(b) Comprehensive United States study
The largest study of United States production workers exposed to PCDDs wasconducted by the United States NatIonal Institute for Occupational Safety and Health(NIOSH) and published by Fingerhut et aL. (1991a). A more detailed techncal report ofthis study is also available (Fingerhut et aL., 1991b). This 12-plant study included theNitro, WV, plant of Monsanto and the Midland, MI, plant of Dow discussed above,which represented 9% and 40% of the cohort, respectIvely. ln order to be included intothe cohort, all workers had to have had presumed exposure to 2,3,7,8-TCDD. The cohortwas constrcted by NIOSH afer a review of personnel records at 12 United States. plantsproducing chemicals known to be contamnated with 2,3,7,8-TCDD (principally Tepand 2,4,5- T). The cohort included most workers in the United States likely to have beenexposed to 2,3,7,8-TCDD in chemical manufacturing, comprising 5000 men with workrecords showing assignment to a production or maintenance job in a process involving2,3,7,8-TCDD contamination, as well as an additional 172 men without work historyrecords but known to have been exposed at the Nitro, WV, plant based upon inclusion ina prior cross-sectional medical study by Suskind & Hertzberg (1984). These latter 172men and an additional 30 men in the NIOSH study lacked suffcient work historyinformation for their inclusion in more detaled analyses by duration of exposure.Follow-up was conducted though 1987 and United States referent rates were used.Serum levels of 2,3,7,8-TCDD in 253 cohort members at two plants measured in 1987averaged 233 nglg lipid, compared with 7 nglg lipid in a group of 79 unexposed
workers. Levels increased to 418 nglkg for 119 workers exposed for more than one year

POL YCHLORIA TED DIBENZO-para-DIOXINS 151
(Fingerhut et aL., 1991a). Extrapolation to the date when these workers were employed,assuming a half life of 7.1 years, indicated a mean serum level at that time of 2000 nglglipid (highest level, 32000 nglg). Workers had last been exposed 15-37 years earlIer.The correlation between serum 2,3,7,8-TCDD level and duration of exposure was 0.72(Fingerhut et aL., 1991b). There were 1052 deaths in ths cohort, with 116 748 pers on-years. The SMR for aU causes was 1.0 (95% CI, 0.9-1.1). Mortity from all cancers(265 deaths) was slightly but significantly elevated (SMR, 1.2; 95% CI, 1.0-1.3). Soft-tissue sarcoma mortality was elevated based on four deaths (SMR, 3.4; 95% CI, 0.9-8.7).Two of the deaths from soft-tissue sarcoma, upon further review of medical records,were found to be misclassified (false positives), but thee deaths from other causes, uponreview, were found to be soft-tissue sarcomas (false negatives). Other causes of death ofinterest in this study were not remarkable. There were 10 deaths from non-Hodgkinlymphoma (SMR, 1.4; 95% CI, 0.7-2.5); stomach cancer mortity was not elevated (10deaths observed; SMR, 1.0; 95% CI, 0.5-1.9); lung cancer showed a slight increase (89observed; SMR, 1.1; 95% CI, 0.9-1.4). Sub-cohort analyses focused on those workerswith more than one year's duration of 2,3,7,8-TCDD exposure and at least 20 years'potential latency (1520 workers, 29% of the cohort; mean duration of employment, 19years; mean duration of exposure to 2,3,7,8-TCDD, 7 years). ln this sub-cohort, mortalityfrom all cancers combined was significantly elevated (114 observed; SMR, 1.5; 95% CI,1.2-1.8). A wide varety of cancer sites showed sorne excess, but only soft-tissuesarcoma was significantly elevated (3 observed; SMR, 9.2; 95% CI, 1.9-27). The SMRfor lung cancer was 1.4 (95% CI, 1.0-1.9) based on 40 deaths. Conversely, the SMR fornon-Hodgkin lymphoma was not elevated in this' sub-cohort with presumed higherexposure (2 deaths observed; SMR, 0.9; 95% CI, 0.1-3.4). Internal analyses comparnglonger duration of expo~ure to 2,3,7,8-TCDD to a short duration (-c 1 year) referentcategory found nonsignificant positive trends for all cancers and lung cancer (p = 0.3 andp = 0.2, respectively). Rate ratios also increased with latency (all cancer SMRs, 0.7, 1.1and 1.3; lung cancer SMRs, 0.8, 1.0 and 1.2 with latency of -c 10 years, 10-20 years and~ 20 years, respectively). The authors considered that smoking was not likely to beresponsible for the excess of lung cancer for several reasons including that (a) there wasno increase in non-malignant respiratory disease, which is strongly related to smoking;(b) an indirect adjustment for smoking based on known smoking habits for a sample ofthe cohort did not account for the observed increase; and (c) there was no increase inlung cancer among the group with 20 years' potential latency but short duration(-c 1 year) of exposure to 2,3,7,8-TCDD (17 observed; SMR, 1.0). (The Workig Groupnoted that these are indirect ways of controllng for confoundig.)
(c) Germn accident cohortln the 1953 accident at the BASF TCPproduction unit at Ludwigshafen, Germany,
the tota number of employees identified as being involved diectly or in the subsequentclean-up, repai or maintenance activities was 247 (243 men, 4 women). Analyses ofadipose tissue and blood from groups of these workers are. described in Section1.3.1(a)(i). Par of the cohort was first studied by Thess et aL. (1982). It was completedby Zober et aL. (1990) and fuer studiedby Zober et al. (1994) and Ott and Zober

152 IAC MONOGRAPHS VOLUME 69
(1996). Out of the 247, 69 (1 woman) were identified by a company physician early afterthe accident as the most directly involved (cohort CI); 84 (2 women) were identified byAugust 1983 as probably involved (cohort C2); and 94 (1 woman) were recognized bythe end of 1987 as possibly exposed during paricipation in demolition and toxicology
investigations, or because they were members of the safety deparment and plantmanagement at the time of the accident (cohort C3). Their mortality was investigatedthrough 1987, with no loss to follow-up (Zober et aL., 1990). Death certificates wereobtained for 67 deceased subjects, and 11 additional deaths were ascertained through
other means (information from physicians, autopsy reports). Expected deaths were ca1cu-lated from national rates. AlI members of cohort CI were affected by chloracne and theirmortality from malignancies was moderately higher than expectation (9 deaths; SMR,1.3; 95% CI, 0.7-2.3). Other nonsignificant increases were seen for stomach cancer (3deaths; SMR, 3.0; 95% CI, 0.8-7.7), colon and rectum (2 deaths; SMR, 2.5; 95% CI,0.4-7.8) and lung cancer (4 deaths; SMR, 2.0; 95% CI, 0.7-4.6). ln cohort C2, 17workers were affected by chloracne and four had other exposure-related skin lesions.Their mortality from all cancers combined after 20 years since first exposure was signifi-cantly increased (8 deaths; SMR, 2.4; 95% Ci, 1.2-4.3), as was mortality from other andunspecified cancer sites (5 deaths; SMR, 3.2; 95% Ci, 1.3-6.8) (whole cohort).A nonsignificant increase was noted for colorectal cancer (2 deaths; SMR, 2.7; 95% Ci,0.5-8.5) (whole cohort). Suicides were elevated in both cohorts CI and C2. ln cohort C3,where 28 pers ons had experienced mild forms of chloracne, no significant increase fordeaths from any cause was seen, although one single leukaemia death represented agreater than five-fold elevated risk. Among all 127 workers affected by chloracne orother skin lesions (erythema), the mortality from all cancers combined was significantlyelevated afer 20 years since exposure (14 deaths; SMR, 2.0; 95% Ci, 1.2-3.2). Non-significant increases were seen for cancer of the stomach (3 deaths; SMR, 1.8; 95% CI;0.5-4.7), colon and rectum (3 deaths; SMR, 2.2; 95% Ci, 0.6-5.8) and lung (6 deaths;SMR, 1.8; 95% Ci, 0.8-3.6). ln 1986, blood concentrations of 2,3,7,8-TCDD weremeasured in 28 workers. The median values were 24.5 ng/kg in cohort CI (10 subjects),9.5 ng/kg in C2 (7 subjects) and 8.4 ng/kg in C3 (11 subjects). The median value forworkers with chloracne and other skin lesion was 15 ng/kg versus 5.8 ng/kg in thosewithout skin manfestations. The small size of the study population precludes definitiveconclusions.
The cancer incidence and the updated mortality, though 1992, have been reported(Ott & Zober, 1996). The study population comprised the 243 exposed men. One deathfrom a motor vehic1e accident had occurred among the four exposed women, and theywere not furter considered in the analysis. Incident cases were ascertained from
available medical and necropsy data and from survey results (the area was not coveredby a cancer registr). Death certificates were obtaned for all but one of the deceasedworkers. Expected numbers of incident cases were ca1culated from the cancer statistics ofthe state of Saarland and expected deaths were calculated on the basis of national rates.At that time, serum measurements of 2,3,7,8-TCDD were avaiable for 138 cohortmembers (Ott et al., 1993) (see Section 1.3.
1 (a)(i)). Model-based estImates of thecumulative dose of 2,3,7,8-TCDD (f.tglg bw) were calculated for each study subject.
POL YCHLORIA TED DIBENZO-para-DIOXINS 153
Chloracne status was also adopted as an indicator of past exposure to 2,3,7,8- TCDD; 113workers had a diagnosis of chloracne, and 55 were classified as severe. Standardizedmortality and incidence ratios and their 95% Cls were estimated using standardtechnques. Internal dose-response analyses were performed with the Cox's proportionalhazard model, takng into account - among other varables - cigarette smoking and
other potentially confounding exposures. Results of the models were reported in terms ofconditional risk ratios (CRRs). The conditional risk represents the risk per unit increase(1 f.g/kg bw) in 2,3,7,8-TCDD dose. ln the mortality analysis, an increased cancermortality with increasing dose was apparent: 2,3,7,8-TCDD level -= 0.1 f.g/kg bw, eightdeaths (SMR, 0.8; 95% Ci, 0.4-1.6); 0.1-0.99 f.g/kg bw, eight deaths (SMR, 1.2; 95%Ci, 0.5-2.3); 1.0-1.99 f.g/kg bw, eight deaths (SMR, 1.4; 95% Ci, 0.6-2.7); ~ 2 f.g/kgbw, se ven deaths (SMR, 2.0; 95% Ci, 0.8-4.0) (p for trend = 0.07). Digestive system andrespiratory tract cancers also tended to increase "with increasing dose. ln the 2,3,7,8-TCDD category :; 1 f.g/kg bw, after 20 or more years since initial exposure, alI-cancermortality (13 deaths; SMR, 2.0; 95% Ci, 1.1-3.4) and respiratory cancer mortlity(6 deaths; SMR, 3.1; 95% Ci, 1.1-6.7) were significantly increased. ln the sub-cohortwith chloracne, 20 or more years after first exposure, 18 cancer deaths were observed(SMR, 1.9; 95% Ci, 1.1-3.0). An increase was also seen for digestive tract cancer(6 deaths; SMR, 1.8; 95% CI, 0.7-4.0) and respiratory tract cancer (7 deaths; SMR, 2.4;95% Ci, 1.0-5.0). ln the incidence analysis, a slight, nonsignificant increase in the riskfor all cancers combined with increasing 2,3,7,8-TCDD dose was obtained. Respiratorytract cancer incidence was elevated in the high-dose group (8 cases; SMR, 2.0; 95% Ci,0.9-3.9). With the Cox's regression model, afer controllng for other relevant varables,
a significant association between 2,3,7,8-TCDD dose and increase in digestive systemcancer was obtained, as both cause of death (CRR, 1.5; 95% Ci, 1.1-1.9) and incidentcases (CRR, 1.4; 95% Ci, 1.1-1.7). Joint analysis of 2,3,7,8-TCDD dose and cigarettesmoking showed a positive relationship between 2,3,7,8-TCDD dose and all cancerscombined among current cigarette smokers (2,3,7,8- TCDD dose, SMR (95% Ci) incurrent smokers: -= 0.1, 1.2 (0.3-3.1); 0.1-0.99, 1.4 (0.3-4.2); 1.0-1.99, 3.0 (1.1-6.5);
~ 2 f.g/kg bw, 4.0 (1.5-8.6)) but not among nonsmokers.
(~ Offer Germn pwn~
Several reports have considered workers from a chemical plant operated byBoehrnger-Ingelheim, in Hamburg, Germany, that produced herbicides heavily conta-mInated with 2,3,7,8-TCDD and other PCDDs/PCDFs (Manz et aL., 1991; Nagel et aL.,1994; Flesch-Janys et al., 1995; Becher et al., 1996). ln the latter study, workers fromthree other German plants were also considered.
Manz et aL. (1991) reported the mortty experience of workers at the Hamburg plantsince late 1951. An outbreak of chloracne in 1954 led to a halt in the production of TCPand 2,4,5-T. ln 1957, production was resumèd using a new process that reduced 2,3,7,8-TCDD formation. The vital status of all permanent employees at the plant for at leastthee months between 1 Januar 1952 and 31 December 1984 (1184 men, 399 women)
was investigated though 1989. Causes of death were derived from medIcal records or,when not available, from death certficates. 2,3,7,8-TCDD concentrations were measured .

154 lARe MONOGRAHS VOLUME 69
in workers from varous production deparments, mainly after the plant had closed in1984. Workers were classified in exposure groups according to their work history: high(496 subjects), medium (901) and low (186). Mean concentrations of 2,3,7,8-TCDD inadipose tissue in 1985 from 48 volunteer surviving members of the cohort were296 ng/kg (SD, 479; median, 137) in 37 workers in the high-exposure group and 83
nglg (SD, 73; median, 60) in 11 workers in the combined medium-/low-exposure
groups. For comparson, national death rates and rates from a cohort of sorne 3500workers at the Hamburg gas supply company were used. ln the latter case, the folIow-upperiod was restricted to 1985. SMRs and 95% Cls were estimated using standardtechniques assuming a Poisson distribution. Follow-up was 97% successfuL. ln men,mortality due to aU cancers combined was increased in comparson with both the generalpopulation (93 deaths; SMR, 1.2; 95% Ci, 1.0-1.5) and the gas workers (75 deaths;SMR, 1.4; 95% Ci, 1.1-1.8). The increase was highest among those who entered theplant before 1954 (who had the highest exposure to 2,3,7,8-TCDD based on the historyof the plant and subsequent serum measurement) and remained employed for 20 or more ,years. ln men, in comparson with gas workers, deaths from all cancers combined were:high exposure, 29 deaths (SMR, 1.8; 95% Ci, 1.2-2.6); medium exposure, 39 deaths(SMR, 1.2; 95% Ci, 0.9-1.6); and low exposure, seven deaths (SMR, 1.5; 95% Ci, 0.6-3.0) (p for trend = 0.24). Among specifie sites, significant increases were seen for lungcancer (26 deaths; SMR, 1.7; 95% Ci, 1.1-2.4) and malignancies of the haematopoieticsystem (9 deaths; SMR, 2.7; 95% Ci, 1.2-5.0). Smoking prevalence was similar inchemical (73%) and gas (76%) workers. Suicides were also significantly increased incomparson with both reference populations. Among women, mortality from aU cancerscombined was close to expectation; an increase was seen for breast cancer (9 deaths;SMR, 2.2; 95% Ci, 1.0-4.1).
Mortality of the female workers in the cohort was further investigated by Nagel et al.(1994). Compared with the results of Manz et aL. (1991), one additional breast cancerdeath was identified (10 cases; SMR, 2.4; 95% Ci, 1.1-4.4). Cox's regression analysisyielded increasing breast cancer risk with duration of employment. 2,3,7,8-TCDD levelsin blood or adipose tissue were measured for 26 women (22 for blood and 4 for adiposetissue), with an arthmetic mean of 109.7 ng/kg (median, 23 nglg; range, 7-1439 ng/kg).
The mortality experience of 1189 male workers employed for at least three monthsbetween 1952 and 1984 in the same plant in Hamburg was investigated through 1992(Flesch-Janys et al., 1995). A quantitative exposure index was constrcted. Fourteenrelevant production deparments were identified and levels of PCDDs/PCDFs weredetermned in the buildings, products and wastes. A detaled work history for eachworker ever employed in these deparments was constrcted. ln a sample of 190 workers,concentrations of each PCDD/PCDF congener in adipose tissue or whole blood weredetermned, and their levels at the end of workers' exposure were calculated assuming aone-comparment first-order kIetic model; the contrbution of working time in eachproduction deparment to the end-of-exposure levels in these 190 workers was estimated.Based on this model, an estIated tota end-of-exposure level was then calculated for
each worker employed in these deparments. The strongest association with 2,3,7,8-TCDD levels was found for duration of employment in 2,4,5- T (estimated yearly

POL YCHLORIA TED DIBENZO-para-DIOXINS 155
increase, 75.6 ngJg blood) and TCP (estimated yearly increase .. 1957, 292 ng/kg)production deparments. For the entire cohort, the mean estimated 2,3,7,8-TCDD levelwas 141.4 ng/kg (median, 38.2 ngJg). Blood measurements of PCDDs are presented inTable 14. Exposureto other carcinogens (e.g., dimethyl sulfate (see IARC, 1987g) andbenzene (see IARC, 1987h) had occurred in sorne deparments. As a reference, a cohortof 2528 workers from agas supply company was adopted. Causes of death were ascer-tained from hospita and medical records whenever possible, or from death certificates,insurance data or next-of-kin interview. The validity of cause of death determnation wassuccessfully tested. Relative risks at seven exposure levels (reference, the first fourquintiles and the ninth and tenth deciles of the estimated 2,3,7,8-TCDD levels) wereestimated using Cox' s regression techniques. An internal comparson group was alsoadopted composed of the chemical workers in the two lowest quintiles of the exposurelevels distribution. FoIlow-up was 99% successful. Total mortality was elevated in aU2,3,7,8-TCDD exposure categories and showed a significant trend (p = 0.01) withincreasing exposure level. Updated relative risks (RR) for total TEQ levels (not 2,3,7,8-TCDD'levels) were published in an erratum (Flesch-Janys, 1996) and were as follows forall cancers combined (124 cases): 1.0-12.2 ng TEQ/kg, RR, 1.0 (95% CI, 0.6-1.8); 12.3-39.5 ng TEQlkg, RR, 1.3 (95% CI, 0.8-2.1); 39.6-98.9 ng TEQlkg, RR, 1.2 (95% CI,0.7-1.9); 99.0-278.5 ng TEQ/kg, RR, 1.2 (95% CI, 0.8-1.9); 278.6-545.0 ng TEQ/kg,RR, 1.3 (95% CI, 0.7-2.3); 545.1-4362 ng TEQlkg, RR, 2.7 (95% CI, 1.7-4.4).A significant pattern of increasing risk with increasing TEQ levels was also obtained forcardiovascular and ischaemic hear diseases, but not for other causes of death. The
mortality pattern for aIl causes, aIl cancers, cardiovascular diseases and ischaemiç heardiseases remained virally unchanged when 2,3,7,8-TCDD exposure levels were used.When the internaI comparson group of chemical workers was adopted, thé relative riskestirnates were lower and the confidence intervals wider. Nevertheless, total mortality(RR, 1.4; 95% CI, 1.0-2.1) and all-cancer mortality (RR, 2.0; 95% CI, 1.1-3.8) remainedc1early elevated in the highest exposure category. When the 149 workers with exposureto one of the possible confounders (dimethyl sulfate) were excluded from analysis, theaIl-cancer mortality remained elevated, especially in the highest exposure category (RR,2.3; 95% CI, 1.1-4.6) and the dose-response pattern was significant (p.. 0.01). Smokighabits and socioeconomic status were similar in the chemical and gas worker cohorts. Nodata on specifie cancer sites were r~ported.
Becher et al. (1996) reported the mortality of 2479 male workers employed in fourGerman plants who were involved in the production of phenoxy herbicides and chloro-phenols or who were likely to have been in contact with these substances and their conta-minants, PCDDs (often including 2,3,7,8-TCDD) and PCDFs. Only workers withGerman nationality and at least one month of employment were included. The foIlow-upwas pedormed through 1989 (1992 in one plant). Cause of death was recorded fromdeath certificates or, in sorne cases, hospital or physician reports. Expected figures werecalculated from national rates. Blood concentrations of 2,3,7,8-TCDD were measured inworkers from thee of the four plants (Kogevinas et al., 1997). Workers in the Hamburgplant (plant 1), including a group of females not considered here, had already been underinvestigation (see above; Manz et aL., 1991; Nagel et al., 1994; Flesch-Janys et al., 1995;

156 IARC MONOGRAHS VOLUME 69
Flesch-Janys et aL., 1996b). ln this plant (1144 male workers), concentrations of 2,3,7,8-TCDD in the order of 5-10 mg/kg were measured in 1957-70 in sorne products (chloro-phenols and 2,4,5- T and its esters) and of 10-50 mg/kg in sorne process and wastestreams. After the early 1970s, the concentrations were below 1 mg/kg. Numerous casesof chloracne occurred in 1954, at the early stage of development of herbicide manu-facture. Measurements of blood concentrations from 190 workers in 1985-94 rangedbetween 3 and 2252 ng/kg (mean, 141 ng/kg). ln plant II (135 workers), TCP was manu-factured with 2,3,7,8-TCDD levels on average about 10 llglkg. Eleven cases of chloracnewere reported among maintenance workers in the early 1970s and measurements in1989-92 from 20 workers ranged between 23 and 1935 nglkg fat (mean, 401.7 ng.kg). lnplant III (520 workers), a varety of phenoxy herbicides were produced. 2,3,7,8-TCDDlevels in the products were reported to be in the 'sub-ppm range'. ln plant iV (680workers) (BASF, but the cohort is different from that of the accident study), phenoxyherbicides were synthesized in a large building where many other chemicals were alsoproduced. Measurements in 1996 from 19 workers ranged between 1.3 and 6.49 nglkg fat(mean, 3.2 ng/kg). ln this plant, slightly elevated concentrations of higher chlorinatedPCDDs were found in synthesis workers. No cases of chloracne were reported in plantsID or IV. ln the total cohort, mortality increases were seen for all cancers combined (138deaths; SMR, 1.2; 95% Ci, 1.0-1.4), cancer of the buccal cavity and pharnx (9 deaths;SMR, 3.0; 95% Ci, 1.4-5.6), lung cancer (47 deaths; SMR, 1.4; 95% Ci, 1.1-1.9),lymphatic and haematopoietic neoplasms (13 deaths; SMR, 1.7; 95% Ci, 0.9-2.9) andnon-Hodgkin lymphoma (6 deaths; SMR, 3.3; 95% Ci, 1.2-7.1). Examnation of trendswith increasing tirne since first exposure showed: for all cancers combined (0-10 years:15 deaths; SMR, 0.9; 95% Ci, 0.5-1.5; lQ- 20 years: 46 deaths; SMR, 1.3; 95% Ci,
0.9-1.7; ~ 20 years: 77 deaths; SMR, 1.2; 95% Ci, 1.0-1.5 fp for trend = 0.67)), forlymphatic and haematopoietic neoplasms (0-10 years: 2 deaths; SMR, 1.1; 95% Ci, 0.1-4.0; lQ- 20 years: 4 deaths; SMR, 1.7; 95% Ci, 0.5-4.4; ;; 20 years: 7 deaths; SMR,1.9; 95% Ci, 0.8-4.0 fp for trend = 0.51)) and for non-Hodgkin lymphoma (0-10 years:o deaths; lQ- 20 years: 2 deaths; SMR, 3.6; 95% Ci, 0.4-13.1; ~ 20 years: 4 deaths;SMR, 4.3; 95% Ci, 1.2-10.9; fp for trend = 0.24)). AH-cause (345 deaths; SMR, 1.2;95% Ci, 1.0-1.3) and alI-cancer mortlity (97 deaths; SMR, 1.3; 95% Ci, 1.1-1.6) waselevated only for plant 1, where statistically significant increases were also seen for lungcancer (31 deaths; SMR, 1.5; 95% Ci, 1.0-2.1), lymphatic and haematopoietic neoplasms(11 deaths; SMR, 2.4; 95% Ci, 1.2-4.3), non-Hodgkin lymphoma (4 deaths; SMR, 3.8;95% Ci, 1.0-9.6) and multiple myeloma (3 deaths; SMR, 5.4; 95% Ci, 1.1-15.9). Morta-lit Y from accidents and suicide was also increased. An increase in the incidence of non-Hodgkin lymphoma for plant II (2 deaths; SMR, 12.0; 95% Ci, 1.5-43.5), and in that ofcancer of the buccal cavity and pharnx for plant IV (6 deaths; SMR, 8.2; 95% Ci, 3.0-17.9) were seen.
(e) British plants
Four cohorts of workers employed between 1963 and 1985 in British factoriesproducing or formulating - among other chemicals - phenoxy herbicides, including2,4,5-T (Kauppinen et aL., 1993) and chlorophenols (sorne of which may have been

POL YCHLORIATED DIBENZO-para-DIOXINS 157
contamnated by PCDDs) were investigated (Coggon et al., 1991). ln one of the plants(factory A), 2,4,5-T was synthesized between 1968 and 1978. ln the other plants, 2,4,5-Twas formulated orny. The study was restricted to men. A total of 2239 subjects(employed during 1963-85) met the inclusion criteria. Job histories were used to classifyworkers according to potential exposure to phenoxy herbicides and chlorophenols.
Approximately 50% of employees had directly worked with phenoxy herbicides. Noenvironmental or personal monitoring had been cared out. Subjects were traced up toDecember 1987. Information was obtained on cause of death for deceased persons andon any cancers registered among living study subjects. Expected figures were obtainedfrom rates for England and Wales, and in sorne analyses adjustment for local differencesin mortality was applied. ln the combined cohort, aU-cause mortality was slightly higherthan expected (152 deaths; SMR, 1.1; 95% Ci, 0.9-1.3), and this was largely due toexcesses of circulatory diseases and deaths from violent causes. Mortality from aU-cancers combined was as expected (37 deaths; SMR, 1.0; 95% CI, 0.7-1.4). StatisticaUynonsignificant excesses were present for lung cancer (19 deaths; SMR, 1.3; 95% CI, 0.8-2.1) and non-Hodgkin lymphoma (2 deaths; SMR, 2.3; 95% CI, 0.3-8.3), even afer localadjustment. When analysis was restricted to subjects with greater than backgroundexposure to phenoxy compounds or chlorophenols, the SMR for lung cancer was 1.2 (14observed deaths; (95% CI, 0.7-2.1)). Both non-Hodgkin lymphoma deaths occurredamong these workers (SMR, 2.8; (95% CI, 0.3-10.2)). ln factory A, 12 cancer deathswere observed (12.3 expected) and six were from lung cancer (SMR, 1.3 (95% CI, 0.5-2.8)).
(j Dutch plants
The mortality of two cohorts of workers employed between 1955 and 1986 in thesynthesis and formulation of phenoxy herbicides and chlorophenols in the Netherlandswas examned (Bueno de Mesquita et al., 1993). ln one of the plants (A), where the mainproduction was 2,4,5-T and derivatives, an accident in 1963 caused a release of PCDDs,including 2,3,7,8-TCDD. ln factory B, production included MCPA, 4-chloro-2-methyl-phenoxypropionic acid (MCPP) and 2,4-D. The study enrolled 2074 manufacturing maleworkers from the two plants (963 exposed to phenoxy herbicides and 1111 not exposed).ln addition, 145 workers probably exposed to 2,3,7,8- TCDD during the industralaccident and the clean-up operations were examined. Definition of individual exposure tophenoxy herbicides, chlorophenols or contamnants (PCDDs/PCDFs) was based onoccupational history derived from job records and personal interviews, including periodsof employment in different deparents and positions held. Follow-up was 97%complete. The 190 female workers were excluded from the analysis. Of the accidentworkers, orny 139 had suffcient data for analysis. Expected numbers of deaths werecalculated frOID national rates. ln addition, mortalty rates of exposed and non-exposedworkers were Internally compared by Poisson regression analysis. Among subjects infactory A orny, in comparson with the general population, aU-cancer mortality was
Increased (26 deaths; SMR, 1.2; 95% CI, 0.8-1.7). Statistically nonsignificant increaseswere also seen for cancers of the pancreas (3 deaths; SMR, 2.9; 95% CI, 0.6-8.4), largeintestine (3 deaths; SMR, 2.4; 95% CI, 0.5-7.0) and prostate (2 deaths; SMR, 2.2; 95%

158 lARe MONOGRAPHS VOLUME 69
CI, 0.3-7.8), lymphosarcoma (non-Hodgkin lymphoma) (1 death; SMR, 2.0; 95% CI,0.1-11.4) and myeloid leukaemia (1 death; SMR, 2.9; 95% CI, 0.1-15.9). No death dueto soft-tissue sarcoma was reported. In comparson with the non-exposed workers,exposed subjects in both plants exhibited increased mortality from all cancers combined(31 exposed deaths; rate ratio (RR), 1.7; 95% CI, 0.9-3.4) and respiratory tract cancer (9deaths; RR, 1.7; 95% CI, 0.5-6.3). Six cancers of the urogenital organs were observedamong the exposed and none among the non-exposed. A nonsignificant increase indeaths from lymphatic and haematopoietic neoplasms was also noted (4 deaths; RR, 2.6;95% CI, 0.3-125). Increases in aH cancers combined (RR, 2.0; 95% CI, 0.8-4.9) andlung cancer (RR, 3.9; 95% CI, 0.5-31.1) were confined to factory A, where the accidentoccurred and where the opportunity for exposure to 2,3,7,8-TCDD was highest. ln thesmaH group of accident-exposed workers, 10 cancer deaths were observed (SMR, 1.4;95% CI, 0.7-2.5).
T~e study was later extended in time (1955-91) and enlarged in size (2298 subjectsincluding 191 females) (Hooiveld et al., 1996a; Kogevinas et al., 1997). More accurateand elaborate proxies of exposure were used in the analysis, based on modelled 2,3,7,8-TCDD levels in serum, measured in 1993 in a súbset of31 surviving exposed (mean con-centration, 53 ng/kg; range, 1.9-194) and 16 unexposed (mean concentration, 8 ng/kg)cohort members. Fourteen subjects exposed during the accident in factory A in 1963 hadthe highest levels (mean concentration, 96 ng/kg; range, 15.8-194). ln this factory, bothaH-cause (139 observed; SMR, 1.3; 95% CI, 1.1-1.5) and aH-cancer mortality(510bserved; SMR, 1.5; 95% CI, 1.1-1.9) were significantly increased. Excesses atspecifie sites were seen for urinar bladder (4 observed; SMR, 3.7; 95% CI, 1.0-9.5),kidney cancer (4 observed; SMR, 4.1; 95% CI, 1.1-10.4) and non-Hodgkin lymphoma(3 observed; SMR, 3.8; 95% CI, 0.8-11.0). Non-Hodgkin lymphoma was also increasedin factory B (1 case orny). Age- and time-adjusted relative risks comparng exposed andunexposed workers in factory A showed significant increases in mortalty from all causes(139 observed; RR, 1.8; 95% CI, 1.2-2.5) and aH cancers (51 observed; RR, 3.9; 95% CI,1.8-8.8). Lung and urinar tract cancers showed numerically higher, but statisticaHynonsignificant increases. Thee non-Hodgkin lymphomas were seen among the exposedand one ahiong the unexposed (a nonsignficant increase). When workers were subdi-vided into three categories (low, medium and high exposure) according to model-predicted serum levels of2,3,7,8-TCDD, relative risks for all causes, aIl cancers and lungcancer were significantly elevated in both middle and high categories, and were highestin the highest exposure group.
(g) lARe multi-country studyAn international cohort of workers exposed to phenoxy herbicides and chlorophenols
was set up by the International Agency for Research on Cancer in association with theUnited States National Institute of EnvIronmenta Health Sciences (Saracci et al., 1991).The cohort included 16863 men and 1527 women employed in production or spraying,distrbuted among 20 cohorts from 10 countres, including the British and Dutch cohortsdescribed above. TheIr mortty from 1955 onwards was examned, and folIow-up wassuccessful for 95% of the cohort members. National mortalty rates were used for

POL YCHLORIA TED DIBENZO-para-DIOXINS 159
reference. Exposure assessment was based on work histories collecte,d in each factorythough questionnaires with the assistance of industral hygienists, workers and factorypersonneL. A tota of 13 482 workers were classified as 'exposed' to phenoxy herbicides,416 were classified as 'possibly exposed', 541 had 'unkown' exposure and 3951 wereclassified as 'non-exposed. ln the entire cohort, aH-cause mortity was lower thanexpected (SMR, 0.95; 95% CI, 0.9-1.0). Among men exposed to phenoxy herbicides orchlorophenols, mortality from all cancers combined was close to expectation (499observed; SMR, 1.0; 95% CI, 0.9-1.1). Significant increases were seen for thyroidcancer (4 observed; SMR, 3.7; 95% CI, 1.0-9.4) and benign and unspecified neoplasms(12 observed; SMR, 2.0; 95% CI, 1.0-3.5); significant deficits were observed for skin (3observed; SMR, 0.3; 95% CI, 0.1-0.9) and brain cancer (6 observed; SMR, 0.4; 95% CI,0.1-0.8). Elevated risks were also seen for cancers of the nose and nasal cavities (3observed; SMR, 2.9; 95% CI, 0.6-8.5), testis (7 observed; SMR, 2.3; 95% CI, 0.9-4.6)and other endocrine glands (3 observed; SMR, 4.6; 95% CI, 1.0-13.5) and for soft-tissuesarcomas (4 observed; SMR, 2.0; 95% CI, 0.6-5.2). ln the probably exposed category,lung cancer mortality was significantly increased (11 observed; SMR, 2.2; 95% CI, 1.1-4.0). Significant increases were also seen among non-exposed workers, for unspecifieddigestive organs and for benign and unspecified neoplasms. The increase in soft-tissuesarcoma concerned workers after 10-19 years since first exposure (4 observed; SMR,6.1; 95% Ci, 1.7-15.5); no differentiation in risk was noted in relation to duration ofexposure or probable 2,3,7,8-TCDD exposure. The SMR estimates for testicular andthyroid cancer were highest among workers probably exposed to 2,3,7,8-TCDD (SMR,3.0 and 4.3, respectively) compared with those probably not exposed (SMR, 1.6 and 3.1,respectively).
Two nested case-control studies of soft-tissue sarcoma (11 incident cases, 55controls) and non-Hodgkin lymphoma (32 incident cases, 158 controls) were conductedby Kogevinas et al. (1995) within the IARC cohort studied by Saracci et aL. (1991).Exposures to 21 chemicals or mitures were estimated by a panel of thee industral
hygienists. Levels of exposure were evaluated using a relative scale, since few actualmeasurements of past exposure were available. A cumulative exposure score wascalculated for each subject and chemical, on the basis of estimated level of exposure andduration of exposure (in years). The model that was used as the conceptual framework inderiving levels of exposure included varables related to deparment/job, emission ofchemicals, contact with chemicals, personal protection, and other relevant determnantsof exposure. Excess risk for soft-tissue sarcoma was associated with exposure to anyphenoxy herbicide (odds ratio, 10.3; 95% Ci, 1.2-91.0) and to each of the three majorclasses of phenoxy herbicides (2,4-D, 2,4,5-T and MCPA). Soft-tissue sarcoma was alsoassociated with exposure to any PCDD/PCDF (odds ratio, 5.6; 95% Ci, 1.1-28.0) andwith exposure to 2,3,7,8-TCDD (odds ratio, 5.2; 95% Ci, 0.9-32.0). Associationsbetween non-Hodgki lymphoma and phenoxyherbicides were generally weaker. Theodds ratio between non-Hodgkin lymphoma and 2,3,7,8-TCDD exposure was 1.9 (95%Ci, 0.7-5.1). A monotonie increase in risk was observed for cumulative exposure (cate-gorized in four categories, non-exposed, low, medium, high exposure) to 2,4- D (oddsratio for highest category, 13.7; 95% Ci, 0.9-309; p-value for trend = 0.01), 2,4,5-T

160 IAC MONOGRAHS VOLUME 69
(odds ratio for highest category, 7.7; 95% CI, 0.5-477; p-value for trend = 0.07), anyPCDD/PCDF (odds ratio for highest category, 19.0; 95% CI, 1.3-1236; p-value for trend= 0.008) and 2,3,7,8-TCDD (odds ratio for highest category, 10.6; 95% CI, 0.6-671;p-value for trend = 0.04). (The Working Group noted that analysis for specifie exposureswas complicated by the exposure of most workers to a multitude of herbicides.)
Whle Saracci et al. (1991) studied the men in the IARC cohort, 701 women werestudIed by Kogevinas et al. (1993) for both cancer incidence and mortality. Among 169women probably exposed to 2,3,7,8-TCDD, excess incidence was observed for aIlcancers combined (9 cases; standardized incidence ratio (SIR), 2.2; 95% CI, 1.0-4.2).There was one case of breast cancer (SIR, 0.9; 95% CI, 0.0-4.8). For 532 womenprobably not exposed to 2,3,7,8-TCDD, the rate ratio for incidence of aIl cancerscombined was 0.8 (20 cases; 95% CI, 0.5-1.2). Cause-specifie analyses were based onsmall numbers. Mortality results paralleled those for incidence.
The international cohort studied by Saracci et al. (1991) was updated and expandedwith the data of Fingerhut et al. (1991a,b) and Becher et aL. (1996) (Kogevinas et al.,1997). FolIow-up differed by plant, but most European plants were foIlowed though1991-92, while the United States plants were followed through 1987. Each of the 21 863male and female workers exposed to phenoxy herbicides or chlorophenols was placed inone of three categories: (1) those exposed to 2,3,7,8-TCDD or higher chlorinated PCDDs(n = 13 831); (2) those not exposed to 2,3,7,8-TCDD or higher chlorinated PCDDs (n =7553); and (3) those of unkown exposure to 2,3,7,8-TCDD or higher chlorinatedPCDDs (n = 479). The latter category included all workers in one British cohort forwhich production history, paricularly for 2,4,5- T, was incomplete. Thee criteria wereused to c1assify workers as exposed to 2,3,7,8-TCDD or higher chlorinated PCDDs:(i) employment during the period of production, formulation or spraying of 2,4,5- T,2,4,5-trchlorophenoxypropionic acid, TCP, hexacWorophene, Erbon, Ronnel, PCP or2,3,4,6-tetrachlorophenol; and (ii) employment in plants with documented (thoughserum, adipose tissue or environmental measurements) exposure to 2,3,7,8-TCDD orhigher cWorinated PCDDs at levels above background; or (iii) in the absence of PCDDmeasurements, employment in plants or companies with documented large-scaleproduction, formulation or spraying of the above-mentioned phenoxy herbicides andchlorophenols. An average production of these chemicals of 10 tonnes per year waschosen a priori, below which it was considered that the probability of contamnation andsignificant exposure to 2,3,7,8-TCDD and higher chlorinated PCDDs would be minimalfor most workers in a cohort. Current mean levels of 2,3,7,8-TCDD, measured in 574workers from 10 companies in 7 countres, ranged from 3 to 389 ng/kg lipid. Amongworkers exposed to 2,3,7,8-TCDD or higher chlorinated PCDDs, mortality was elevatedfor soft-tissue sarcoma (6 deaths; SMR, 2.0; 95% CI, 0.8-4.4). Mortality from all cancerscombined (710 deaths; SMR, 1.1; 95% CI, 1.0-1.2), non-Hodgkin lymphoma (24 deaths;SMR, 1.3; 0.9-2.1) and lung' cancer (225 deaths; SMR, 1.1; 95% CI, 1.0-1.3) wasslightly elevated. RIsks for' a1 cancers combined and for soft-tissue sarcomas andlymphomas increased with tIme since first exposure. Workers not exposed to 2,3,7,8-TCDD or higher chloriated PCDDs had SMRs of 1.0 for all cancers, for non-Hodgkinlymphoma and for lung cancer; soft-tissue sarcoma was slightly elevated, based on two

POL YCHLORINA TED DIBENZO-para-DIOXINS161
deaths (SMR, 1.4; 95% CI, 0.2-4.9). ln a direct comparson between those exposed tohigher chlorinated PCDDs versus lower ones or none, a rate ratio of 1.3 (95% Ci, 1.0-1.8) for all cancers combined was found. This study represents the largest overall cohortof 2,3,7,8- TCDD-exposed workers.
2.1.2 Population exposure due to industrial accident
The mortality and cancer incidence among the population of Seveso exposed in theindustrial accident described in Section 1.3.1 were investigated. The contaminated areawas subdivided into three exposure zones (zone A, zone B and zone R), according to theaverage levels of 2,3,7,8-TCDD measured in soil samples. The most contaminated,
Zone A, extended for 87 hectares and average soil levels between 15.5Ilg/m2 and580lig/m2 were found. ln Zone B (270 hectares), soil levels did not exceed, on average,50lig/m2. ln Zone R (1430 hectares), soil levels were generally below 5 Ilg/m2. Allpersons residing in these zones at the time of the accident, as well as all newbom infantsand new residents in the subsequent 10-year period, were considered to have beenexposed. Measurements of blood levels of 2,3,7,8- TCDD in members of the exposedpopulation are described in Section 1.3.1. Thee exposure categories were formed,corresponding to the zone of residence of the subjects at the time of the accident or laterentr into the area. As a reference, the population of 11 municipalities surrounding the
contaminated area was adopted. Ethnie, social, cultural and occupational characteristicswere closely comparable. The exposed and referent populations were followed up as ifthey were a unique cohort, blindly to the exposure status of the subjects. The follow-upafter 15 years was ;: 99% successful (Bertazzi et aL., 1993). Causes of death were derivedfrom death certificates. ln the period 1976-91, there were 750 subjects in Zone A and 16cancer deaths, 5000 subjects in Zone B and 152 cancer deaths, and 30000 subjects inZone R and 1008 cancer deaths. The reference population comprised over 200 000subjects (Bertazzi et al., 1996).
The cause-, age-, gender- and calendar time-specific mortality rates in the exposedand reference populations were compared using Poisson regression methods (Bertazziet al., 1996). All-cause and alI-cancer mortality did not differ significantly from thoseexpected in any of the contamnated zones. Mortality from gastrointestinal cancer wasincreased. Women had a relative risk for all digestive system cancers combined of 1.5(5 deaths; 95% Ci, 0.6-3.6) in Zone A and liver cancer (3 deaths; RR, 1.3; 95% Ci, 0.4-4.0) in Zone B. Among men, increases were seen for rectal cancer (7 deaths; RR, 2.9;95% Ci, 1.4-.2) in Zone B and for cancer of the oesophagus (30 deaths; RR, 1.6; 95%Ci, 1.1-2.4) in Zone R. Neoplasms of the lymphatic and haematopoietic tissues wereclearly elevated in Zone B. The highest risks were seen for leukaemia in men (7 deaths;RR, 3.1; 95% Ci, 1.4-.7), multiple myeloma in women (4 deaths; RR, 6.6; 95% Ci,
2.3-18.5) and Hodgkin's disease in both men and women (men: 2 deaths; RR, 3.3; 95%Ci, 0.8-14.0; women: 2 deaths; RR, 6.5; 95% Ci, 1.5-30.0). Two cases of thyroid cancerin Zone B; one each in men and women, represented a notable, although nonsignificantincrease (RR, 3.9; 95% Ci, 0.4-14.1). Four cases of soft-tissue sarcoma were seen in

162 IARC MONOGRAPHS VOLUME 69
Zone R among men (RR, 2.1; 95% CI, 0.7-6.5). Breast cancer was below expectation inall zones.
Cancer incidence data are available for the period 1977-86 (Bertazzi et al., 1993) forthe population aged 20-74 years and residing in the area at the date of the accident.Cancer diagnoses were obtained from the regional registration system of hospitaladmissions and discharges. Of the 41 801 relevant medical records, 41 778 were success-fully reviewed. The proportion of non-detected cases ranged from 2.6% to 6.8% acrosshospitals, and the overall histologie al confirmation rate was 72%. Quality andcompleteness of cancer case ascertainment did not var appreciably across zones or with
the referent population. ln Zone A, no significant differences from expectation were seen(14 cancer cases in total). ln Zone B, hepatobiliar cancer was increased among bothwomen (5 cases; RR, 3.3; 95% CI, 1.3-8.1) and men (5 cases; RR, 1.8; 95% CI, 0.7-4.4).Haematopoietic system neoplasms were significantly increased. Among women,increases were seen for multiple myeloma (2 cases; RR, 5.3; 95% Ci, 1.2-22.6) andmyeloid leukaemia (2 cases; RR, 3.7; 95% Ci, 0.9-15.7) and, among men, increaseswere seen for lymphoreticulosarcoma (3 cases; RR, 5.7; 95% Ci, 1.7-19.0) and multiplemyeloma (2 cases; RR, 3.2; 95% CI, 0.8-13.3). ln Zone R, soft-tissue' sarcoma incidencewas increased in both women (2 cases; RR, 1.6; 95% CI, 0.3-7.4) and men (6 cases; RR,2.8; 95% Ci, 1.0-7.3). Breast and endometral cancers were below expectation. Thecancer incidence among subjects aged 0-19 years was analysed separately (Pesatoriet al., 1993). Given the small number of events, the three contamnated zones and bothgenders were grouped together. Seventeen cancer cases were observed (RR, 1.2; 95% Ci,0.7-2.1). Two ovaran cancer cases were observed versus none expected. Two thyroidgland cancers among girls gave a relative risk of 4.6 (95% Ci, 0.6-32.7). Lymphatic andhaematopoietic neoplasms were increased (9 cases; RR, 1.6; 95% CI, 0.7-3.4),
paricularly Hodgkin's lymphoma (3 cases. RR, 2.0; 95% Ci, 0.5-7.6) and myeloidleukaemia (3 cases; RR, 2.7; 95% Ci, 0.7-11.4). (The Working Group noted that the sizeof the most exposed population is small and that the latency of 15 years may be short forcertain health effects to manifest themselves. Measurements of blood levels of 2,3,7,8-TCDD (see Section 1.3.1) are available for only small samples of the exposed popu-lations.)
2.1.3 Industrial exposure to higher chlorinated PCDDs
Two United States studies have focused on cohorts exposed to PCP or chlorophenates(penta and tetra); these chemicals contain predominantly higher chlorinated PCDDs (C16-:Cig) but not 2,3,7,8-TCDD (United States Environmental Protection Agency, 1994).Many workers in one ofthese studies also had exposure to 2,3,7,8-TCDD.
ln. another study of pentachlorophenate-exposed industral workers, Hertzman et al.(1997) studied 23 829workers from 11 Canadian sawmills in British Columbia whichused chlorophenates from the 1940s to the 1970s. Another 2658 unexposed workers fromthee sawmills not using chlorophenates were also studied. Cohort members had to haveworked for at least one year between 1 Januar 1950 and 31 December 1985. Follow-upwas though 1990. Jobs were rated according to level of chlorophenate exposure and a
POL YCHLORIATED DIBENZO-para-DIOXINS 163
quantitative eKposure score was developed. Most exposure was dermal, although someinhalation exposure could occur. ln the 1960s and 1970s, sawmills switched from usingpredominantly pentachlorophenates, which would be expected to have contained highercWorinated PCDDs and PCP, to tetrachlorophenates (less contaminated with higherchlorinated PCDDs). Exposure to chlorophenates was widespread in the industry. Woodwas dipped in chlorophenates and then planed; exposures occurred during both
processes. Urine samples taken in the 1980s showed significant levels of chlorophenates(median, 180 J.g/L) (Hertzman et al., 1988). Mortality and cancer incidence rates werecompared with the population of British Columbia; cases were identified from eithercancer registry data Qr death certificates. There were 583 190 person-years inchlorophenate mills and 41 280 in non-chlorophenate mills, with 70 119 potentialperson-years lost to follow-up (11.2%); analyses were conducted either assuming thatlost-to-follow-up workers were alive until the end of 1990 (method 1) or assuming thatperson-time ended when a worker was lost to follow-up (method 2). There were 4710deaths in the cohort (1950-89) (4539 in exposed mill workers and 171 in non-exposedmill workers) and 1547 incident cancer cases (1969-89) (1498 in exposed mill workersand 49 in non-exposed mill workers). The SMR for all causes of death among workers atchlorophenate mills was 0.81 (95% Ci, 0.79-0.83) by method 1 of treating loss tofollow-up and 0.96 (95% CI, 0.94-0.99) by method 2; the SMR for non-chlorophenatemills was 0.89 (95% CI, 0.78-1.01) with method 2. ln the chlorophenate mill workers,there were six deaths from soft-tissue sarcoma (SMR using method 1 for loss to follow-up, 1.2; 95% CI, 0.5-2.3; SMR using method 2, 1.4; 95% CI, 0.6-2.8). There were 11incident cases of soft-tissue sarcoma (SIR using method 1, 1.0; 95% CI, 0.6-1.7; andusing method 2, 1.2; 95% CI, 0.7-1.9). There were 36 deaths from non-Hodgkin
lymphoma (SMR using method 1,0.9; 95% CI, 0.7-1.2 or SMR using method 2, 1.1;95% CI, 0.8-1.4) and 23 deaths from lymphosarcoma (SMR using method 1, 1.3; 95%CI, 0.9-1.8 or SMR using method 2, 1.5; 95% CI, 1.0-2.1). There were 63 incident casesof non-Hodgkin lymphoma during the study period (SMR using method 1, 1.0; 95% CI,0.8-1.2 or SMR using method 2, 1.2; 95% CI, 1.0-1.5). While no trend was observed formortality from non-Hodgkin lymphoma with cumulative exposure, a significant positivetrend of SIR for non-Hodgkin lymphoma was seen with increasing cumulative exposureto chlorophenate (p = 0.02). The SIR for the group with the highest cumulative exposureand 20 or more years' exposure was 1.5 (p = 0.04).
Ramlow et al. (1996) studied 770 workers from the occupational cohort in Midland,MI, studied by Ott et al. (1987) and Bond et aL. (1989a) (see Section 2.1.1), but restrictedto those cohort members with sorne exposure to PCP. Although the authors provide nodetails, most of these workers (approximately 85%) were also exposed to 2,3,7,8-TCDDbased on detailed data from the United States NIOSH cohort (Fingerhut et al., 1991b).FolIow-up was from 1940 though 1989; both the United States population and anothergroup of unexposed male workers from the same company were used as referent groups.Exposure scores for PCP were developed, in addition to the exposure scores for 2,3,7,8-TCDD and hexa-, hepta- or octa-CDDs used previously by Ott et aL. (1987). The averagelength of follow-up was 26.1 years and 'there were 20 107 person-years in the study.There were 229 deaths from all causes in the whole cohort (SMR, 0.9; 95% CI, 0.8-1.1)

164 IARC MONOGRAPHS VOLUME 69
and 50 cancer deaths (SMR, 1.0; 95% CI, 0.7-1.3). The SMR for a category of non-Hodgkin lymphoma and myeloma combined was 2.0 (5 deaths; 95% CI, 0.7-4.7); theauthors noted that two of these cancers were myeloma (versus approximately 0.8
expected), while three were non-Hodgkin lymphomas (approximately 1.7 expected).Stomach cancer mortality was slightly elevated (4 deaths; SMR, 1.7; 95% CI, 0.5-4.3),as was kidney cancer mortality (3 deaths; SMR, 2.3; 95% CI, 0.5-6.7). No deaths fromliver cancer were observed (1.1 expected) nor from thyroid cancer (0.1 expected),cancers a priori of interest from animal studies. Results of analyses for;; 15 years'potential latency were also presented, which differed lIttle from those of the overallanalysis. Analyses by cumulative exposure to PCP were conducted for 'low PCP' and'high PCP' groups compared with unexposed workers using a varety of lag periods. Asignificant positive trend was noted for kidney cancer with increasing exposure when a15-year lag was used (p = 0.03) and a nearly significant positive trend was noted for thecombined category of non-Hodgkin lymphoma and myeloma (p = 0.08). Similar trendswere seen for these two cancer categories when the data were stratified by level ofexposure to 2,3,7,8-TCDD or hexa-, hepta or octa-CDDs.
ln three cohorts included in the IARC international cohort, 842 workers wereevaluated to have been exposed to higher chlorinated PCDDs but not to 2,3,7,8-TCDD.The workers had been producing PCP in a plant in England, 2,3,4,6-tetrachlorophenol ina plant in Finland and a varety of phenoxy herbicides in a plant in Germany. ln the lattergroup of workers, serum levels of 2,3,7,8-TCDD were around background, while an'elevation was seen for higher chlorinated PCDDs, especially among synthesis workers(Messerer et aL., 1996). Mortality from aIl neoplasms was around that expected fromnational mortaIity rates (41 deaths; SMR, 1.0; 95% Ci, 0.7-1.4). No deaths from soft-tissue sarcoma (0.2 expected) or non-Hodgkin lymphoma (0.7 expected) were registeredin these three cohorts, while mortality from lung cancer was higher (19 deaths; SMR,1.5; 95% Ci, 0.9-2.3) than in 2,3,7,8-TCDD-exposed workers (Kogevinas et aL., 1997).
2.2 Herbicide exposures
Introduction
Studies of herbicide exposure among farers, pesticide applicators and other non-industral populations were included in this review either if there was explicit evidencethat exposure included 2,4,5-T (known to be contamnated with 2,3,7,8-TCDD), or ifdata on individual exposure to phenoxy herbicides as a class was available and it wasknown that 2,4,5- T was used in the area. SeveraI studies of applicators without adequatedocumentation of exposure to 2,4,5- T or other phenoxy herbicides were not consideredinformative, such as those of Barhel (1981), Corrau et aL. (1989) and Eriksson et aL.(1992). ln addition, studies with exposure to phenoxy herbicides limited to 2,4-D, MCPAor other compounds typically not found to be contamnated with higher chlorinatedPCDDs were excluded, such as those of Wigle et aL. (1990) and Morrson et aL. (1993,1994). Simlarly, studies of paper and pulp mill workers were not considered, becausemeasurements of PCDDs in biological tissues of workers have not shown that their levelswere elevated (Rosenberg et aL., 1994, 1995; Mouradian et al., 1995; see Section 1.3.1).

POL YCHLORIATED DIBENZO-para-DIOXINS 165
ln these studies, direct evidence of exposure to 2,3,7,8-TCDD is often lacking. Thelimited data available indicate that exposure to 2,3,7,8- TCDD is likely to be substantiallylower than exposure in industrial cohorts (see Section 1.3.1). For example, in the mostheavily exposed applicators of 2,4,5- T in New Zealand, who applied 2,4,5- T for at least180 months, the estimated mean serum level of 2,3,7,8-TCDD at the time of blooddrawing was 53 ng/kg (Smith et al., 1992a). Back extrapolation of this level to the periodwhen 2,4,5-T was likely to be most contaminated with 2,3,7,8-TCDD gave a value ofaround 300 ng/kg. Among United States Air Force personnel (Ranch Hand) who appliedAgent Orange from 1962 to 1971, generally for relatively short periods, the medianserum 2,3,7,8-TCDD level in 1987 was 13 ng/kg, which when back-extrapolated wouldbe about 50 ng/kg (Roegner et al., 1991). These levels are about one order of magnitudelower than the back-extrapolated 2,3,7,8-TCDD levels estimated for many industrialcohorts. ln data from Australia (Johnson et al., 1992a), the range of serum 2,3,7,8-TCDDlevels at time of blood drawing in 1990 in 33 applicators randomly selected from a groupof 654 men who had applied 2,4,5-T and 2,4-D for at least 12 months was 2-34 ng/kg.Back -extrapolation to the time exposure ceased, using a half life of 7.1 years, revealed
that those who sprayed after 1974 (the period when 2,3,7,8-TCDD contamination of2,4,5- T was markedly reduced) had a significantly lower mean exposure rate (0.06 ng/kgper month) compared with workers who sprayed before 1965 (2.7 ng/kg per month) orduring 1965-74 (2.3 nglg per month). For those workers who sprayed during 1965-74,the estimated serum TCDD concentrations at termnation of employment ranged from 13to 329 ng/kg.
ln Sweden, no difference in 2,3,7,8-TCDD levels in adipose tissue was found between13 exposed (mean 2,3,7,8-TCDD, 2 ng/kg) and 18 non-exposed subjects (mean 2,3,7,8-TCDD, 3 ng/kg) (Nygren et aL., 1986; see Section 1.3.1(a)(ii)). Exposure was defined asin the Swedish case-control studies on soft-tissue sarcoma and non-Hodgkin lymphoma(e.g., Hardell et al., 1981) (see Section 2.2.2). The 13 exposed subjects sampled were nota representative sample of phenoxy herbicide applicators in Sweden, and these resultsmay not be generalizable.
Applicators of phenoxy herbicides in most of the epidemiological studies applied
these herbicides for only a short time. Analyses restricted to 'long duration' ofteninc1uded only a few subjects exposed for more than a year. ln light of the above data, it isto be expected that 2,3,7,8-TCDD levels in herbicide applicators would be very low.
2.2.1 Applicator cohorts (Table 34)
(a) Commercial
A cohort study of 348 male railroad workers in Sweden exposed to herbicides duringthe period 1957-72 was initially followed though 1972 (Axelson & Sundell, 1974) andsubsequently through 1978 (Axel son et al., 1980). The workers had been exposed toamtrole (see IARC, 1987i) and to phenoxy herbicides, paricularly 2,4-D and 2,4,5-T.Only workers with a minimum of 45 days of exposure, not necessarly continuous, wereinc1uded in the cohort. W orkers were classified into three sub-cohorts depending on the
type of herbicide used: those with exposure to amitrole, those with exposure to

..0'0'
Table 34. Cohort studies of cancer in relation to herbicide application
Reference, Study subjects Study type/ Exposure Gender Cancer site/ No RR 95% CI Commentscountr Period of cause of death obs.
folIow-up
Axe1son et al. 348 rai1road herbicide Morta1ity 2,4-D, 2,4,5- Men AlI cancers 13 2.4 (1.3-4.1) Exposed in 1957-61(1980), sprayers 1957-78. T, amtro1e and Stomach 3 5.3 (1.-15.5) Exposed in 1957-61Sweden Latency combinations, AlI cancers 3 1.5 (0.3-4.4 ) Exposed to amtrole
~~ 10 years others 6 1.9 (0.7-4.1) Exposed to phenoxy nherbicides ~6 3.4 (1.2-7.4) Exposed to both 0
AlI cancers 6 2.3 (0.8-5.0) FolIow-up 1972-78 ZStomach 2 7.7 (0.9-27.8) Exposed to phenoxy 0
ciherbicides
~RiIhmäk et al. 1926 herbicide Mortality, 2,4-D,2,4,5-T, Men AlI cancers:i(1982), applicators during 1972-80 ~ 2 weeks per No latency 26 (0.7) (0.5-1.0) Cf
Finand 1955-71 year ~ 10 years latency 20 (0.8) (0.5-1.3) ~~ 15 years latency 5 (0.4) (0.1-1.0) 0
t"Lung c:~ 10 years 1atency 12 (1.) (0.6-1.9) ~~ 15 years latency 4 (0.9) (0.2-2.2) 't
0'Prostate 1.~ 10 years latency 2 ( 1.8) (0.2-6.6)
Multiple myeloma~ 10 years 1atency 1 (5.0) (0.1-28)
Most heavi1y AlI cancersexposed ~ 10 years latency 5 (0.5) (0.2-1.2)~ 8 weeks per ~ 15 years 1atency 1 (0.2) (0.0-1.)year or during5 years

Table 34 (contd)
Reference, Study subjects Study type/ Exposure Gender Cancer site/ No RR 95% CI Comments 'icountr Period of cause of death obs. 0follow-up t"~n
Hansen et al. 4015 gardeners, Incidence, Greenhouse Men AIl cancers 184 1. 0.9-1.2 P(1992), 1975-84 1975-84 workers Respiratory tract 41 1.0 0.7-1.3 0Denmark (10-20%): STS 3 5.3 1.-15~fungicides, Haematopoietic (all) 15 1.4 0.8-2.4~insecticides; NH 6 1.7 0.6-3.8tioutdoor CLL 6 2.8 1.0-6.0
gardeners Other leukaemIa 3 1.4 0.3-4.2 00(80-90% ): AU cancers 33 0.9 0.6-1. æ2,4-D,2,4,5-T, W omen Respiratory tract 2 0.7 0.1-2.6
~MCPA, Breast 10 1. 0.5-2.1amtrole, other STS 0 0 0-1 0herbicides Haematopoietic (all) 2 1.4 0.2-5.0 ~
$:NHL 2 3.6 0.4-13~CLL 0 0 0-17 10Other 1eukaemIas 0 0 0-11 -0
Hogstedt & 145 forestr workers, Mortality 2,4-D, 2,4,5- T Men AU cancers (mortality) 2 (0.4) (0.0-1.3) Exposed~Westerlund 251 unexposed 1954-78, 2: 5 days 3 (3.0) (0.6-8.8) Foremen u:(1980), foresters incidence 5 (0.8) (0.3-1.8) Unexposed
Sweden 1958-78 All cancers (incidence) 3 (0.4) (0.1-1.0) Exposed5 (3.6) (1.2-8.3) Foremen
"'0\-i

-0\00
Table 34 (contd)
Reference, Study subjects Study type/ Exposure Gender Cancer site/ No RR 95% CI Commentscountr Period of cause of death obs.
follow-up
Wikund et aL. 20 245 pesticide Incidence, Herbicides Men All cancers(1987, 1988, applicators, licensed 1965-82 (2070% ): (99% ); No latency 558 0.9 0.8-0.9 -1989), 1965-76 MCPA, dinoseb, Women ;? 10 years latency 281 0.9 (0.8- 1.0) ~Sweden 2,4-D,2,4,5-T; (1%) Lung n
insecticides No latency 38 0.5 0.4-.7 ~(15-50% ): ;: 10 years latency 23 0.6 (0.4-0.8) 0DDT, NH Z0fenitrothon; No latency 21 1.0 0.6-1. 0fungicides ;: 10 years latency 12 1.2 0.6-2.0 ~(10-30%): Hodgki's disease 'imaneb, No latency 11 1.2 0.6-2.2 :i
entradimefon ;: 10 years latency 4 1.5 0.4-3.7 ~STS 0No latency 7 0.9 0.4-1.9 t"
~;: 10 years latency 4 1.0 0.3-2.7trKetchum & 1261 Ranch Hand Mortality Agent Orange Men All cancers 30 0.9 0.6-1.3 US Air Force Viet 0\
Aktar (1996), veterans (Viet Nam) though 1993 median serum Lung 3 (0.9 0.5-1.6) Nam veterans who \0USA 2,3,7,8-TCDD All haematopoietic 12 (0.9 0.2-2.5) applied Agent Orange,
12 ng/g in NH 1 (1.4 0.0-7.7) compared to 19 1011987 STS 1 (2.4 0.1-13.6) Air Force Viet Nam( comparson Digestive system 5 (0.7 0.2-1.5) veterans who did not4 ng/g) apply Agent Orange
Abbreyiations: NH, non-Hodgkin lymphoma; STS, soft-tissue sarcoma; CLL, chronic lymphocytic leukaemia

POL YCHLORIA TED DIBENZO-para-DIOXINS 169
phenoxyherbicides and those with exposure to both. Workers had also been exposed tosorne less commonly used herbicides such as monuron, diuron, or atrazine (see IARC,1991). None of the 348 individuals was lost to folIow-up. Underlying cause of death wasrecorded on the basis of information from death certificates as classified by the NationalCentral Bureau of Statistics. Expected numbers of deaths were calculated using cause-,calendar period- and age-specific national mortality rates. Mortality rates for 1975 wereused for the period 1975-78 since national rates were not available at the time of thestudy for the last three years. ln the total cohort, alI-cause mortality was approximatelythat expected (45 deaths; SMR, 0.9, (95% CI, 0.7-1.2)) and mortality from aIl cancerscombined was slightly elevated (17 deaths; SMR, 1.4 (95% CI, 0.8-2.3)). The SMRs forall cancers in the sub-cohort exposed to phenoxy herbicides was 1.1 (6 deaths (95% CI,0.4-2.3)), with an excess observed for stomach cancer (2 deaths; SMR, 3.1 (95% CI,0.4-11.1)). The SMR for all cancers combined in the sub-cohort exposed to bothphenoxy herbicides and amitrole was 2.1 (6 deaths (95% Ci, 0.8--.5)) with an excess forstomach cancer based on only one death (0.3 expected) and lung cancer (one death; 0.5expected). When a 10-year latency period was applied, the SMR for aIl cancerscombined for the phenoxy herbicides sub-cohort was 1.9 (6 deaths (95% CI, 0.7--.2))and that for the sub-cohort exposed to both phenoxy herbicides and amItrole was 3.4 (6deaths (95% CI, 1.2-7.3)).
A follow-up study was conducted among forestr workers in Sweden (Hogstedt &Westerlund, 1980). One hundred and fort-five male forestr workers registered ashaving worked with phenoxy herbicides (2,4-D and 2,4,5-T) for at least five days, 16foremen (c1aimed to be highly exposed) and 251 unexposed foresters were identifiedfrom pay lists of a timber company in Hälsingland between 1954 and 1967. Persons whoworked for more than five days with other herbicides were not inc1uded. Vital status andcause of death were assessed for the period 1954-78 from national health registers,except for three exposed and seven unexposed foresters. Incident cancer cases between1958 and 1978 were identified though cancer registres. National statistics were used asa reference. The average duration of exposure was 30 days (range, 6-114) among forestworkers and 176 days (range, 16-317) among foremen. ln the exposed cohort, 29 deathsoccurred versus 28.0 expected; 47 deaths were observed in the unexposed versus 64.4expected. Tumour deaths were thee (versus 1.0 expected) among foremen, two (versus5.4 expected) among exposed workers and five (versus 6.4 expected) among unexposedworkers. Incident cancer cases were in excess among foremen (5 versus 1.4 expected; p-0 0.02) and less than expected in the other exposed workers (3 versus 8.4 expected). Nospecifie cancer site was remarkable (stomach (1), pancreas (2), lung (1), skin (1), prostate(2), urinar bladder (1)).
A cohort of male phenoxy herbicide applicators in Finland was followed prospec-tively from 1972 to 1980 (Riihmäk et al., 1982). The herbicides 2,4-D and 2,4,5-T hadbeen used in Finland since the mid-1950s, with the peak consumption (about 50-70tonnes of active ingredient per year) occurrng in the late 1960s. Analysis of sorne oldherbicide preparations used in Finland in 1962-67 suggested that the 2,3,7,8-TCDDcontent ranged between 0.1 and 0.9 mgJg. After 1972, the use of these chemicalsdeclined. The cohort of herbicide applicators was identified in 1972 from the personnel

170 lARe MONOGRAHS VOLUME 69
records of the four main Finnish employers involved in chemical control of brushwood.The cohort inc1uded 1971 men exposed to 2,4-D and 2,4,5-T for at least two weeksduring 1955-71. The data were collected by office personnel in the companies fromvarous sources such as payrolls. ln some cases, supplementar information was soughtthrough interviews with foremen and c1erks. About a quarer of the population had beenexposed for more than eight weeks, as of 1971. During 1955-71, 45 individuals died,leaving 1926 subjects alive followed during 1972-80; fifteen subjects were not located inthe population data register and were excluded from the cohort. The underlying cause ofdeath for all deceased subjects was retrieved from death certificates registered at theCentral Statistical Office. National age- and sex-specific mortality rates for 1975 wereused to calculate expected numbers of deaths. Mortality from all cancers during theperiod 1972-80 was lower than expected from national rates (26 deaths (SMR, 0.7; 95%Ci, 0.5-1.0)), with a slightly higher rate observed during the last years of follow-up,(1977-80; 17 deaths (SMR, 0.9; 95% CI, 0.5-1.5)). Similar results were obtained whenallowing for a 10-year or a 15-year latency period, or when the analysis was restricted tosubjects with the longest duration of exposure. The SMR for lung cancer, allowing for a10-year latency period, was 1.1 (12 deaths (95% Ci, 0.6-1.9)). There were no deathsregistered from malignant lymphomas or soft-tissue sarcoma.
Cancer incidence was studied in a cohort of 20 245 licensed pesticide applicators inSweden (Wiklund et al., 1987, 1988, 1989). Since 1965, a licence has been mandatoryfor using the most acutely toxic pesticides. The workers in the study had been issued alicence between 1965 and 1976 and were followed up for cancer incidence to 31December 1982. A survey of a random sample of 273 workers showed that 72% hadbeen exposed to phenoxy herbicides for one day or more during the 1950s, 1960s and1970s. Phenoxy herbicides had been used in Sweden since the late 1940s. The maincompound used in agriculture was MCPA and, since the mid-1960s, MCPP and dichlor-prop (2-(2,4-dichlorophenoxy)propionic acid). 2,4-D and 2,4,5- T were used to a lesserextent. Cancer incidence rates for the Swedish population were used for comparson. Atotal of 558 cancer cases were observed in the cohort (SIR, 0.86; 95% CI, 0.79-0.93).Excess risks were observed for lip cancer (14 observed; SIR, 1.8; 95% CI, 1.0-2.9),testicular cancer (18 observed; SIR, 1.6; 95% CI, 0.9-2.5) and Hodgkin's disease (11observed; SIR, 1.2; 95% CI, 0.6-2.2) but not for lung cancer (38 observed; SIR, 0.5;95% CI, 0.4-.7), non-Hodgkin lymphoma (21 observed; SIR, 1.0; 95% CI, 0.6-1.5) orcancer at any other site. The SIR for testicular cancer increased with time since licence(0- years, 0.9;,5-9 years, 1.4; ~ 10 years, 2.5; based on four, six and eight cases, respec-
tively). The SIR for lung cancer increased with years since first employment from 0.3(0- years) to 0.5 (5-9 years) to 0.6 (~ 10 years). The authors provided data showing thatsmoking was less prevalent among pesticide applicators than among other occupationalcategories in Sweden, strongly suggesting that the observed deficit of lung cancer wasdue to lower cigarette consumption. A follow-up from the date of licence until31 December 1984 indicated no excess riskfor soft-tissue sarcoma (7 cases observed;SIR, 0.9; 95% CI, 0.4-1.9) (Wikund et aL., 1988).
A hIstorical cohort study was conducted among Danish gardeners heavily exposed topesticides (Hansen et aL., 1992). The cohort comprised 859 women and 3156 men and

POL YCHLORIA TED DIBENZO-para-DIOXINS171
included aH employed persons who, in May 1975, were members of one of the 10 localtrade unions of gardeners associated with the Danish Union of General Workers.Subjects were foHowed from 1 May 1975 to 1 Januar 1985 through the records of theDanish Central Population Register, with 100% of the subjects being traced. Cancerincidence was recorded through the Danish Cancer Registry. The analysis was limited tosubjects 30-79 years of age. The gardeners constituted three fairly separate groups,namely workers in greenhouses (nearly aH female), a smaH group of nursery gardenersand gardeners in public parks, gardens and cemeteries (the majority of workers).
Gardeners working outdoors had been exposed to phenoxy herbicides (2,4-D, MCP A,2,4,5- T) and amitrole. This exposure took place regularly throughout the growing season.Data on individual job histories were not obtained, except for a limited subset of cancercases. A total of 219 cancer cases were identified in the study, 217 among subjects aged30-79 years. There was no elevation in incidence of all cancers combined (SIR, 1.0; 95%CI, 0.9-1.2) or of most common neoplasms. An increased risk was seen for soft-tissuesarcoma (code 197 in ICD 7th revision), with an SIR of 4.6 (3 cases; 95% CI, 0.9-13.3)which was statisticaHy significant among men (3 cases; SIR, 5.3; 95% CI, 1.1-15.4).Elevated risks were seen for non-Hodgkin lymphoma (8 cases; SIR, 2.0; 95% CI, 0.9-3.9) and for chronic lymphatic leukaemia (6 cases; SIR, 2.5; 95% CI, 0.9-5.5). Twoindividuals with soft-tissue sarcoma, six with non-Hodgkin lymphoma and three withchronic lymphatic leukaemia had worked as gardeners for more than 10 years. Noadditional soft-tissue sarcoma cases were identified in this cohort when the records of thecancer registry were searched for sarcomas which might have occurred in parenchymalorgans and consequently not been included in the ICD code (code 197, 7th rev.) used forthe main analysis.
(b) Military
United States Viet Nam veterans as a group, with the exception of those known tohave directly handled Agent Orange, show no evidence of exposure to PCDDs or PCDFsabove that of other veterans who did not serve in Viet Nam (i.e., beyond backgroundlevels), on the basis of serum measurements. However, veterans actuaHy involved inspraying, as members of the Air Force Operation Ranch Hand or of the Ary ChemicalCorps, have shown elevated serum levels of 2,3,7,8- TCDD (see Section 1.3.
1 (a)(ii)).The mortality of 1261 Ranch Hand veterans has been compared with that of 19 101other Air Force Viet Nam veterans who were not exposed to Agent Orange (Michaleket al., 1990). Person-time at risk began when the tour of dut
Y in Viet Nam began. Themost recent mortaIity report extends foHow-up through 1993 (Ketchum & Aktar, 1996),with 31 394 person-years among Ranch Hand personnel and 490 792 person-yearsamong the comparson group. The SMR for aIl causes of death was 1.0 (95% CI, 0.8-1.2), based on 118 deaths. There were 30 cancer deaths (SMR, 0.9; 95% CI, 0.6-1.3) and12 lung cancer deaths (13.0 expected). There was one death from soft-tissue sarcoma(a fibroma; ICD 171.3) versus 0.4 expected for the category canèer of the connectivetissue (ICD 171.0-171.9), and one from non-Hodgkin lymphoma (0.7 expected). No caseof chloracne has been reported among Ranch Hand veterans.

172 IAC MONOGRAHS VOLUME 69
The mortality of 894 members of the Ary Chemical Corps was studied by Thomasand Kang (1990). FolIow-up extended through 1987, and the United States populationwas used as the referent. Person-time at risk was taken to begin when service ended inViet Nam. There were 53 deaths (SMR, 1.1) in this cohort, with about 16000 person-years and an average follow-up of 18 years. There were six cancer deaths (SMR, 0.9):two lung cancer deaths versus 1.8 expected, two leukaemias versus 0.5 expected and twobrain cancers versus 0.4 expected. Review of medical records found two incident casesof Hodgkin's disease, with approximately 0.7 expected.
2.2.2 Community-based case-control studies
Although many case-control studies may include one or more questions concemingexposure to herbicides, the W orking Group considered only those in which exposure toPCDD-containing herbicides was a major hypothesis being tested, and where such expo-sure was evaluated in detaiL.
Studies of soft-tissue sarcoma and haematopoietic tumours have been systematicallyreviewed. For other sites (Section 2.2.2(d)), studies in which phenoxy herbicides werenot a main focus of interest have not been examined.
(a) Soft-tissue sarcoma (see Table 35)
A series of studies on soft-tissue sarcoma were conducted in Sweden applying similarmethodology (Hardell & Sändstrom, 1979; Eriksson et aL., 1981; Hardell & Erisson,1988; Eriksson et al., 1990). Relevant exposure measurements are presented in Tables16 and 17.
The first case-control study associating phenoxy herbicides and chlorophenols withsoft-tissue sarcoma was conducted in 1978 in the population of the region of Umeå, innorthern Sweden (Hardell & Sändstrom, 1979). The study was initiated following a casereport of three soft-tissue sarcoma patients who had been exposed to phenoxy herbicides(Hardell, 1977). The study included 21 living and 31 deceased pathologically verifiedsoft-tissue sarcoma male cases, diagnosed in one hospital during 1970-77. Four popu-lation controls matched for age, sex, place of residence and vital status were selected percase. Living controls were selected from the national population registry and deceasedcontrols from the national registry of causes of death. The response rate was 100% forcases and 99% for the controls. A self-administered questionnaie was sent to livingsubjects and to the next-of-kin of deceased subjects (approximately 60% of all ques-tionnaires). Information was requested about a varety of exposures and the questionnairewas supplemented by telephone interviews of selected subjects. Any subject exposed formore than one day was characterized as exposed. Exposure to phenoxy herbicides and/orchlorophenols was associated with a six-fold increased risk. ln the matched analysis, theodds ratio was 6.2 (confidence intervals not provided). ln an unmatched analysis, theodds ratio was 5.7 (95% CI, 2.9-11.3). The odds ratio among living subjects was 9.9 andthat among deceased subjects was 3.8. The odds ratio for exposure only to phenoxyherbicides was 5.3 (95% CI, 2.4-11.5). After excluding the three index cases (but not

Table 35. Case-ontrol studies on soft-tissue sarcoma containing information on exposure to phenoxy herbicides,
chlorophenols or PCDDs
Reference, No. of casesl Gender Exposure Relative risk Commentscountr controls (95% CI)
"00Hardell & 52/208 Men Exposure to phenoxy herbicides or chlorophenols 5.7 (2.9-11.3) Odds ratios for living subjects l'~Sandström for more than one day were higher than those for n(1979), Exposure to phenoxy herbicides only 5.3 (2.4-11.5) deceased subjects ~Sweden 0Ericksson et aL. 11 0/220 Men Exposure to phenoxy herbicides or chlorophenols 5.1 (2.5-10.4) Odds ratio from matched ~(1981), for more than one day analysis ;p~Sweden Exposure for more than one day to phenoxy 17.0 (NR) tT
herbicides contamnated with 2,3,7,8-TCDD ÛÛExposure for more than one day to phenoxy 4.2 (NR)63herbicides not contaminated with 2,3,7,8- TCD D~Exposure to chloropheno1s for one week 3.3 (1.3-8.1) N
continuously or one month discontinuously 0.tHardell & 54/490 (311 Men Exposure to phenoxy herbicides for more than 3.3 (1.4-8.1) Odds ratio from matched ¡:
~Eriksson (1988), population one day (comparson with population controls) analysis. Odds ratio was 1ÛSweden controls, 179 slightly lower (2.2; 95% CI, -0cancer 0.9-5.3) when comparng ~con troIs ) with cancer controls. ZCIEriksson et al. 218/212 Men Exposure to phenoxy herbicides for more than 1.3 (0.7-2.6) Odds ratio from matched
(1990), one day analysis. Risk for exposure toSweden Exposure to 2,4,5- T 1.8 (0.9-3.9) 2,4,5-T before 1950 was
Exposure to PCP for one week continuously or 3.9 (1.2-12.9) higher (odds ratio, 2.9; 95%one month discontinuously CI, 1.1-8.0)
....w

-Table 35 (contd)
...l
Reference, No. of cases/ Gender Exposure Relative risk Commentscountr controls (95% CI)
Hardell et al. 352/865 Men 2,3,7,8-TCDD exposure Odds ratios (90% CI)(1991), Non-exposed 1.0 Referent group non-exposedSweden Less than one year to phenoxy herbicides 3.0 (2.0-.5) to phenoxy herbicides or
contamnated with 2,3,7,8-TCDD chlorophenols. PooledMore than one year to phenoxy herbicides 7.2 (2.6-20) analysis of the four above-contaminated with 2,3,7,8-TCDD mentioned studies by Hardell,
~Erisson and colleagues nExposure to other PCDDs ~Non-exposed 1.0 0
ZLess than one year to phenoxy herbicides 1.7 (1.0-2.9) 0contamnated with other PCDDs ciMore than one year to phenoxy herbicides 6.2 (2.9-13)
~contamnated with other PCDDs :iSmith et al. 82/92 Men Phenoxy herbicides Odds ratios (90% CI)
CI
~(1984b), Potentially exposed ~ i day not in 5 years before 1.3 (0.6-2.5) 0New Zealand cancer registration
~Probably or definitely exposed for ~ 5 days not in 1.3 (0.6-2.9)10 years before cancer registration tr
0\Chlorophenols \0
Potentially exposed ~ i day not in 5 years before 1.5 (0.5-4.5)cancer registrationProbably or definitely exposed for ~ 5 days not in 1.6 (0.5-5.2)10 years before cancer registration
Smith & Pearce 51/3 i 5 Men Phenoxy herbicides 0.7 (0.3-1.5) Odds ratios (90% CI)(1986), (new study) Potentially exposed for ~ 1 day not in 5 yearsNew Zealand before cancer registration
133/407 1.1 (0.7-1.8)(combined)
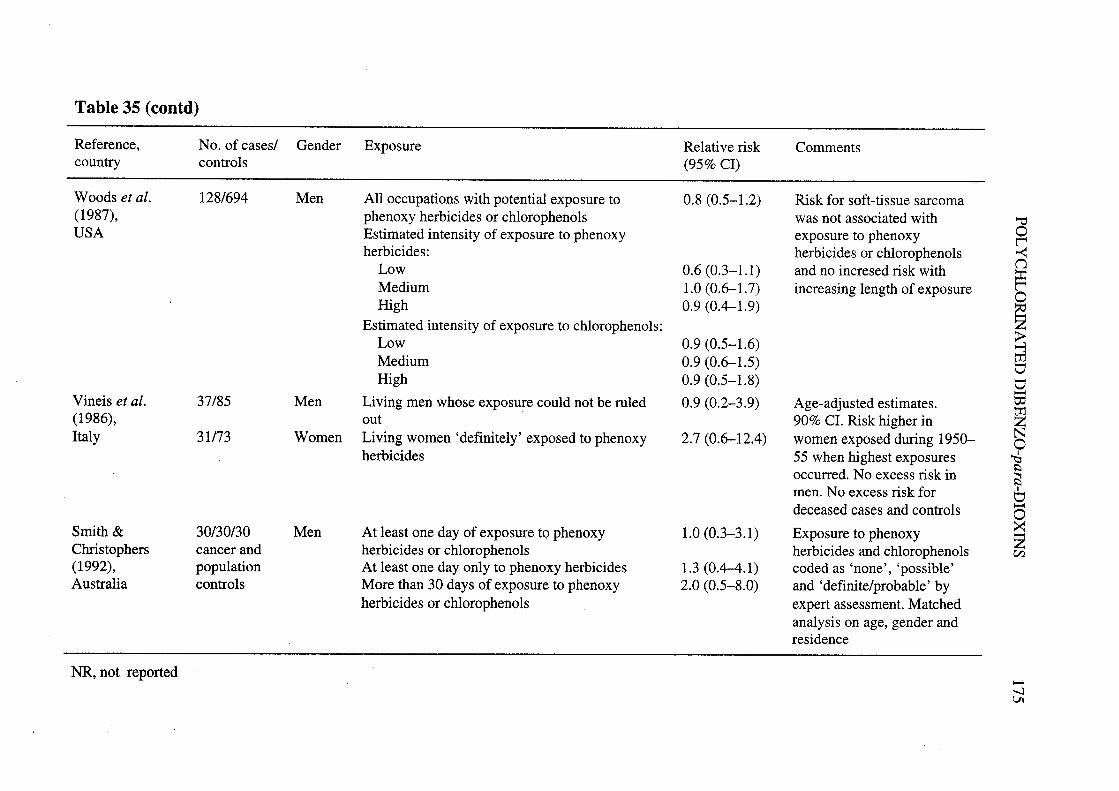
Table 35 (contd)
Reference, No. of cases/ Gender Exposure Relative risk Commentscountr controls (95% CI)
Woods et al. 128/694 Men AH occupations with potential exposure to 0.8 (0.5-1.2) Risk for soft-tissue sarcoma(1987), phenoxy herbicides or chlorophenols was not associated with 'iUSA Estimated intensity of exposure to phenoxy exposure to phenoxy 0i:
herbicides: herbicides or chlorophenols ~Low 0.6 (0.3-1.1) and no incresed risk with (1
~Medium 1.0 (0.6-1.7) increasing length of exposure 0High 0.9 (0.4-1.9)~Estimated intensity of exposure to chlorophenols:~Low 0.9 (0.5-1.6)t;Medium 0.9 (0.6-1.5) Ü
High 0.9 (0.5-1.8) Ü-Vineis et al. 37/85 Men Living men whose exposure could not be ruled 0.9 (0.2-3.9) Age-adjusted estimates. t:(1986), out 90% CI. Risk higher in ~Italy 31/73 W omen Living women 'definitely' exposed to phenoxy 2.7 (0.6-12.4) women exposed during 1950- N0
herbicides 55 when highest exposures ~occurred. No excess risk in \:
~men. No excess risk for 1Üdeceased cases and controls -0
Smith & 30/30/30 Men At least one day of exposure to phenoxy 1.0 (0.3-3.1) Exposure to phenoxy ~Chrstophers cancer and herbicides or chlorophenols herbicides and chlorophenols en(1992), population At least one day only to phenoxy herbicides 1.3 (0.4-.1) coded as 'none', 'possible'Australia controls More than 30 days of exposure to phenoxy 2.0 (0.5-8.0) and 'definite/probable' by
herbicides or chlorophenols expert assessment. Matchedanalysis on age, gender andresidence
NR, not reported -..VI

176 IARC MONOGRAHS VOLUME 69
four additional cases inc1uded in a pilot study), this odds ratio became 4.7 (95% CI, 2.0-10.7). Tobacco smoking, exposure to DDT, exhaust fumes and emulsion agents did notappear to be associated with risk for soft-tissue sarcoma.
Responding to criticisms that selection and information bias could have affected theresults of the previous study (Hardell & Sändstrom, 1979) and of a study on malignantlymphomas (Hardell et al., 1981), Hardell (1981) conducted a further analysis usingcolon cancer patients as controls. The study is fully described in Section 2.2.4(d). Resultsobtained when using colon cancer patients as controls were very similar to the originalresults obtained when using population controls.
A case-control study of the association between soft-tissue sarcoma and phenoxyherbicides and chlorophenols was conducted among the population of the five southem-most counties of Sweden (Erisson et aL., 1981). The study included 110 pathologicallyverified soft-tissue sarcoma cases (including 38 deceased cases) reported to the cancerregistry during 1974-78. Two population controls matched for age, place of residenceand vital status were selected per case. Living controls were selected from the nationalpopulation registry and deceased controls from the national registry of causes of death. Aself-administered questionnaire was sent to living subjects and to the next-of-kin
(approximately 35% of all questionnaires) of deceased subjects. Information wasrequested about a varety of exposures. The questionnaire was supplemented by tele-phone interviews for subjects with incomplete or obscure replies to questions on expo-sure to sol vents or pesticides, and also for aH subjects reporting work in agriculture,forestry or horticulture. Any subject exposed to phenoxy herbicides for more than oneday was characterized as exposed. The predominant exposure in this area was to MCP A,considered to be free of 2,3,7,8-TCDD contamination, to 2,4-D and the analogous
phenoxypropionic acids, MCPP and dichlorprop, possibly contaminated by PCDDs otherthan 2,3,7,8-TCDD. A high level of exposure to chlorophenols used as wood preser-vatives was defined as one week of continuous or one month of discontinuous exposure.The odds ratio for exposure to phenoxy herbicides and/or chlorophenols was 5.1 in thematched analysis (95% CI, 2.5-10.4). The odds ratio for exposure to any phenoxyherbicide was 6.8 (95% CI, 2.6-17.3). A higher relative risk was observed for exposureto phenoxy herbicides considered to be contamnated with 2,3,7,8-TCDD (odds ratio,17.0) compared with herbicides uncontaminated with 2,3,7,8-TCDD (odds ratio, 4.2).Longer duration of exposure to phenoxy herbicides (more or less than 30 days) was notassociated with an increased risk. High-level exposure to chlorophenols was associatedwith an increased risk (odds ratio, 3.3; 95% CI, 1.3-8.1), while low-level exposure wasnot associated with an increased risk. Tobacco smoking or exposure to organic solvents,varous pesticides or other chemical agents did not appear to be associated with risk forsoft-tissue sarcoma.
A case-control study on soft-tissue sarcoma was conducted in the population of threenortern counties of Sweden (Hardell & Eriksson, 1988). The study included 55 male
histopathologically confired soft-tissue sarcoma cases (18 alive, 37 deceased) aged 25-80 years. Cases were diagnosed during 1978-83 and were identified through the regionalcancer registr in Umeå. ln eight cases, the tumour was classified as probable soft-tissue
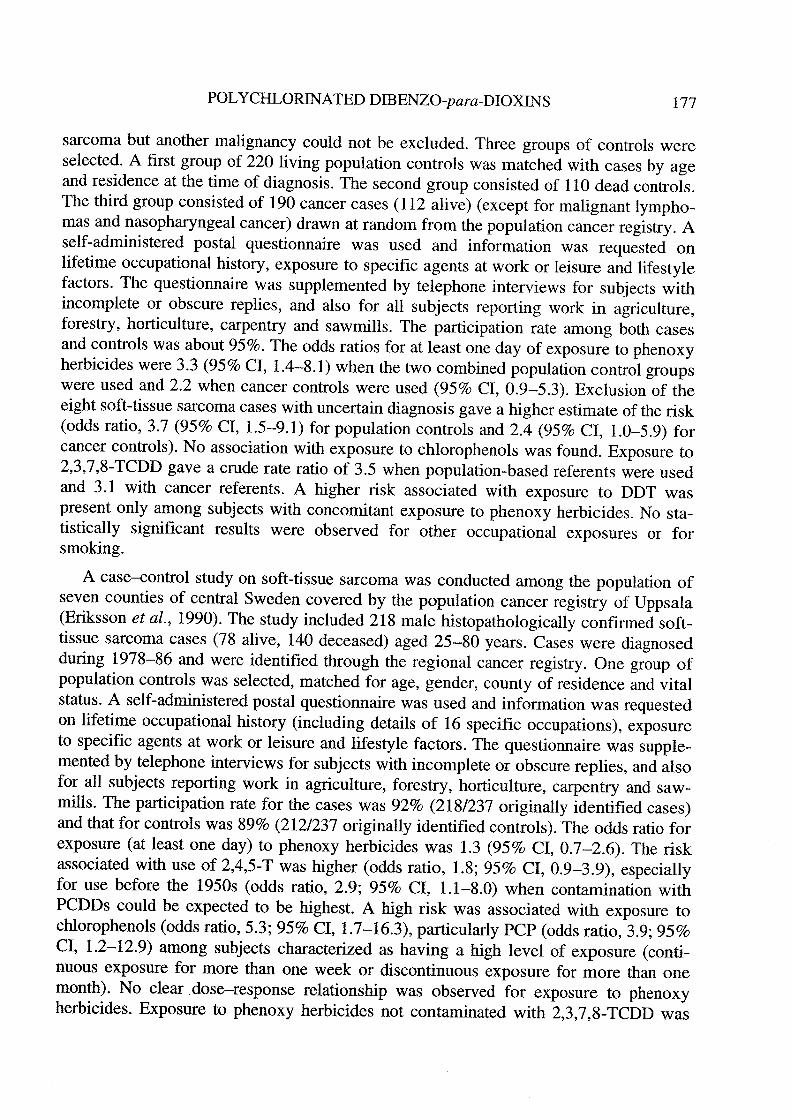
POL YCHLORINATED DIBENZü-para-DIOXINS 177
sarcoma but another malignancy cou Id not be excluded. Three groups of controls wereselected. A first group of 220 living population controls was matched with cases by ageand residence at the time of diagnosis. The second group consisted of 110 dead controls.The third group consisted of 190 cancer cases (112 alive) (except for malignant lympho-mas and nasopharngeal cancer) drawn at random from the population cancer registry. Aself-administered postal questionnaire was used and information was requested onlifetime occupational history, exposure to specifie agents at work or lei sure and lifestylefactors. The questionnaire was supplemented by telephone interviews for subjects withincomplete or obscure replies, and also for aH subjects reporting work in agriculture,forestry, horticulture, carentry and sawmills. The paricipation rate among both casesand controls was about 95%. The odds ratios for at least one day of exposure to phenoxyherbicides were 3.3 (95% CI, 1.4-8.1) when the two combined population control groupswere used and 2.2 when cancer controls were used (95% CI, 0.9-5.3). Exclusion of theeight soft-tissue sarcoma cases with uncertain diagnosis gave a higher estimate of the risk(odds ratio, 3.7 (95% CI, 1.5-9.1) for population controls and 2.4 (95% CI, 1.0-5.9) forcancer controls). No association with exposure to chlorophenols was found. Exposure to2,3,7,8-TCDD gave a crude rate ratio of 3.5 when population-based referents were usedand 3.1 with cancer referents. A higher risk associated with exposure to DDT waspresent only among subjects with concomitant exposure to phenoxy herbicides. No sta-tisticaHy significant results were observed for other occupational exposures or forsmoking.
A case-control study on soft-tissue sarcoma was conducted among the population ofseven counties of central Sweden covered by the population cancer registry of Uppsala(Eriksson et al., 1990). The study included 218 male histopathologically confired soft-tissue sarcoma cases (78 alive, 140 deceased) aged 25-80 years. Cases were diagnosedduring 1978-86 and were identified through the regional cancer registry. One group ofpopulation controls was selected, matched for age, gender, county of residence and vitalstatus. A self-administered postal questionnaire was used and information was requestedon lifetime occupational history (including details of 16 specifie occupations), exposureto specifie agents at work or leisure and lifestyle factors. The questionnaire was supple-mented by telephone interviews for subjects with incomplete or obscure .replies, and alsofor all subjects reporting work in agrculture, forestry, hortiçulture, carentry and saw-mills. The paricipation rate for the cases was 92% (218/237 originally identified cases)and that for controls was 89% (212/237 originally identified controls). The odds ratio forexposure (at least one day) to phenoxy herbicides was 1.3 (95% CI, 0.7-2.6). The riskassociated with use of 2,4,5-T was higher (odds ratio, 1.8; 95% CI, 0.9-3.9), especiallyfor use before the 1950s (odds ratio, 2.9; 95% CI, 1.1-8.0) when contamnation withPCDDs could be expected to be highest. A high risk was associated with exposure tochlorophenols (odds ratio, 5.3; 95% CI, 1.7-16.3), paricularly PCP (odds ratio, 3.9; 95%CI, 1.2-12.9) among subjects characterized as having a high level of exposure (conti-nuous exposure for more than one week or discontinuous exposure for more than onemonth). No clear. dose-response relationship was observed for exposure to phenoxyherbicides. Exposure to phenoxy herbicides not contamnated with 2,3,7,8-TCDD was
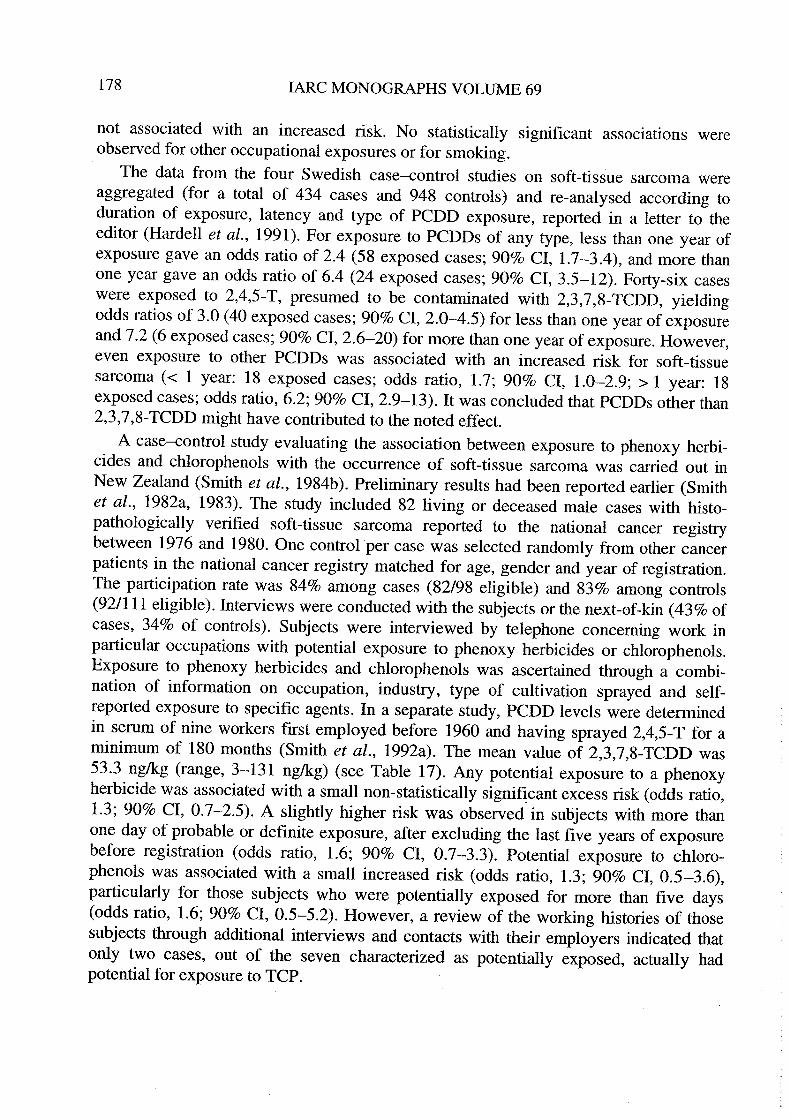
178 IARC MONOGRAPHS VOLUME 69
not associated with an increased risk. No statistically significant associations wereobserved for other occupational exposures or for smoking.
The data from the four Swedish case-control studies on soft-tissue sarcoma wereaggregated (for a total of 434 cases and 948 controls) and re-analysed according to
duration of exposure, latency and type of PCDD exposure, reported in a letter to theeditor (Hardell et al., 1991). For exposure to PCDDs of any type, less than one year ofexposure gave an odds ratio of 2.4 (58 exposed cases; 90% CI, 1.7-3.4), and more thanone year gave an odds ratio of 6.4 (24 exposed cases; 90% CI, 3.5-12). Fort
y-six caseswere exposed to 2,4,5-T, presumed to be contaminated with 2,3,7,8-TCDD, yieldingodds ratios of 3.0 (40 exposed cases; 90% CI, 2.0-4.5) for less than one year of exposureand 7.2 (6 exposed cases; 90% CI, 2.6-20) for more than one year of exposure. However,even exposure to other PCDDs was associated with an increased risk for soft-tissuesarcoma (-c 1 year: 18 exposed cases; odds ratio, 1.7; 90% CI, 1.0-2.9; ::1 year: 18exposed cases; odds ratio, 6.2; 90% CI, 2.9-13). It was concluded that PCDDs other than2,3,7,8-TCDD might have contributed to the noted effect.
A case-control study evaluating the association between exposure to phenoxy herbi-cides and chlorophenols with the occurrence of soft-tissue sarcoma was cared out inNew Zealand (Smith et aL., 1984b). Preliminar results had been reported earlier (Smithet aL., 1982a, 1983). The study included 82 living or deceased male cases with histo-pathologically verified soft-tissue sarcoma reported to the national cancer registrbetween 1976 and 1980. One controlper case was selected randomly from other cancerpatients in the national cancer registry matched for age, gender and year of registration.The participation rate was 84% among cases (82/98 eligible) and 83% among controls(92/111 eligible). Interviews were conducted with the subjects or the next-of-kin (43% ofcases, 34% of controls). Subjects were interviewed by telephone conceming work inparicular occupations with potential exposure to phenoxy herbicides or chlorophenols.
Exposure to phenoxy herbicides and chlorophenols was ascertained through a combi-nation of information on occupation, industry, type of cultivation sprayed and self-reported exposure to specifie agents. ln a separate study, PCDD levels were determnedin serum of nine workers first employed before 1960 and having sprayed 2,4,5-T for aminimum of 180 months (Smith et al., 1992a). The mean value of 2,3,7,8-TCDD was53.3 ng/kg (range, 3-131 ng/kg) (see Table 17). Any potential exposure to a phenoxyherbicide was associated with a small non-statistically significant excess risk (odds ratio,1.3; 90% CI, 0.7-2.5). A slightly higher risk was observed in subjects with more thanone day of probable or definite exposure, after excluding the last five years of exposurebefore registration (odds ratio, 1.6; 90% CI, 0.7-3.3). Potential exposure to chloro-phenols was associated with a small increased risk (odds ratio, 1.3; 90% CI, 0.5-3.6),paricularly for those subjects who were potentially exposed for more than five days(odds ratio, 1.6; 90% CI, 0.5-5.2). However, a review of the working histories of thosesubjects through additional interviews and contacts with their employers indicated thatonly two cases, out of the seven characterized as potentially exposed, actually had
potential for exposure to TCP.

POL YCHLORIA TED DIBENZO-para-DIOXINS 179
An update was conducted by Smith and Pearce (1986) combining new data, includinga general population control group, with the study population of Smith et al. (1984b).New cases diagnosed from 1980 to 1982 (n = 51) were compared with populationcontrols (n = 315). The odds ratio estimate was 0.7 (90% CI, 0.3-1.5) for probable ordefinite exposure to phenoxy herbicides for more than one day not in the five yearsbefore cancer registration. The odds ratio estimate for the combined studies was 1.1(90% CI, 0.7-1.8). There was no evidence in either study of an increase in risk withlonger duration of exposure or longer latency since first exposure.
A population-based case-control study was conducted in three provinces of northernItaly where rice growing is the predominant agrcultural activity and phenoxy herbicideshave been used since 1950 (Vineis et aL., 1986). During 1950-55, rice weeding was stilldo ne manually, mostly by a seasonal work force of women, who were presumed to havehad the highest exposure to phenoxy herbicides, predominantly 2,4,5- T. Incident cases ofsoft-tissue sarcoma aged 20 years or older, with a proven or suspected histological dia-gnosis in 1981-83 were identified through all the pathology deparments of the threeprovinces, and six pathology deparments of the city of Turin and the National CancerInstitute in Milan. Out of 135 cases initially identified, 37 were excluded because thediagnosis was not confired or because the cases were prevalent or were visceralsarcomas. Of the remaining 98 eligible cases, interviews were obtained from 68 patientsor next-of-kin (44 living, 24 deceased). The paricipation rate was 69%. A randomsample of living controls was drawn from electoral registers. Deceased controls (anycause of death apar from suicide) matched by age, sex, year of death and municipalitywere selected through demographic offices of the relevant municipalities. Interviewswere obtained from 122/168 eligible controls (paricipation rate 73%) and 36/40 relativesof deceased subjects (paricipation rate 90%). Direct interviews were cared out withsubjects, who were asked for information on lifetime occupational history, and additionalinformation on jobs with titles indicating potential exposure to phenoxy herbicides orchlorophenols. ln addition, supplementar questionnaires were administered to subjectsworking in agriculture, paricularly cultivation of rice and other crops. Two expertsassessed exposure to phenoxy herbicides and classified subjects into three categories: (1)those not exposed to phenoxy herbicides; (2) those for whom exposure could not be ruledout; and (3) those 'definitely' exposed, based on occupational histories primarly as riceweeders. Among living subjects, no men were 'definitely' exposed. Among livingwomen, four cases and five controls were 'definitely' exposed (odds ratio, 2.7; 90% CI,0.6-12.4). The odds ratio for the combined categories 2 and 3 was 2.4 (5 exposed cases;90% CI, 0.6-10.3). Among living women continuously exposed during 1950-55, thecrude odds ratio was (9.9) (3 exposed cases, 1 exposed control). No excess risk wasobserved when analyses were limited to deceased subjects. (The Working Group notedthat no distinction was made between herbicides likely to be contamnated with PCDDsand others.)
A population-based case-control study was conducted in western Washington State,United States, to evaluate the relationship between occupational exposure to phenoxyherbicides and chlorophenols and risk for soft-tissue sarcoma and non-Hodgkinlymphoma (Woods et al., 1987). Living and deceased cases, aged 20-79 years and

180 IARC MONOGRAHS VOLUME 69
diagnosed during 1981-84, were identified from the population-based tumour registrythat covers 13 counties of the state. Enrolled in the study were 128 pathologically
reviewed soft-tissue sarcoma cases (97 alive, 31 dead). Population controls were selectedusing random digit diallng or from social security records (for older cases) or non-cancerdeath certificates (for deceased cases). Controls were matched for age and vital statuswith a parallel series of non-Hodgkin lymphoma cases. The paricipation rate was 62%for soft-tissue sarcoma cases (128/206) and 76% for controls. Subjects were interviewedin person and information was requested on occupational exposures to phenoxy herbi-cides and chlorophenols and to other potential risk factors. Additional information wasrequested for specifie occupations and job activities involving potential exposure to thechemicals of interest. The risk for soft-tissue sarcoma associated with aIl occupationsinvolving potential exposure to phenoxy herbicides was 0.8 (95% CI, 0.5- 1.2). Exposureto phenoxy herbicides or chlorophenols was not associated with increased risk for soft-tissue sarcoma. No association was seen with estimated intensity of exposure to eitherphenoxy herbicides or chlorophenols. (The W orking Group noted that no informationwas provided on use of specifie herbicides.)
A case-control study on patients with soft-tissue sarcoma was undertaken in Victoria,Australia, during 1982-88 (Smith & Chrstophers, 1992). The study included 30 malecases with soft-tissue sarcoma registered in the Victoria Cancer Registr. Cases werefirst diagnosed between 1976 and 1987. For each case, one cancer control was selectedfrom the cancer registry, matched for age, sex and residence. A second set of populationcontrols was selected from the electoral register using the same matching criteria. Theresponse rate~ were 70% for cases, 56% for cancer controls and 70% for populationcon troIs. Cases were interviewed mostly before 1986, while both series of controls weremostly interviewed after 1986. A comprehensive occupationaI history was obtainedthrough a personal interview. Exposures to phenoxy herbicides and to chlorophenols
were coded by expert assessment as none, possible or definite/probable. Exposureswithn the five-year period before the year of diagnosis of a case were ignored, for bothcases and their matched controls. The main chlorinated herbicides used in Victoria were2,4-D, 2,4,5- T and MCP A. There were no significant differences between population andcancer controls with respect to definIte exposure and these two groups were combinedfor the analysis. For soft-tissue sarcoma, the odds ratio was 1.0 (95% CI, 0.3-3.1) for atleast one day' s exposure to phenoxy herbicides or chlorophenols and 1.3 (95% CI, 0.4-4.1) for exposure only to phenoxy herbicides. The odds ratio for more than 30 days ofexposure to phenoxy herbicides or chlorophenols was 2.0 (95% CI, 0.5-8.0). (TheW orking Group noted that no distinction was made between herbicides like1y to becontaminated with PCDDs and others.)
(b) MaUgnant lymphomas (see Table 36)A case-control study followed the report in Sweden of 17 cases of histiocytic mali-
gnant lymphoma, 11 of whom had been exposed to phenoxy herbicides or chlorophenols(HardelI, 1979). AlI men aged 25-85 years admitted between 1974 and 1978 to the onco-logy deparment of the University Hospital in Umeå, Sweden, with histologically verifiedmalignant lymphoma were included in the study (Hardell et aL., 1981). For every living
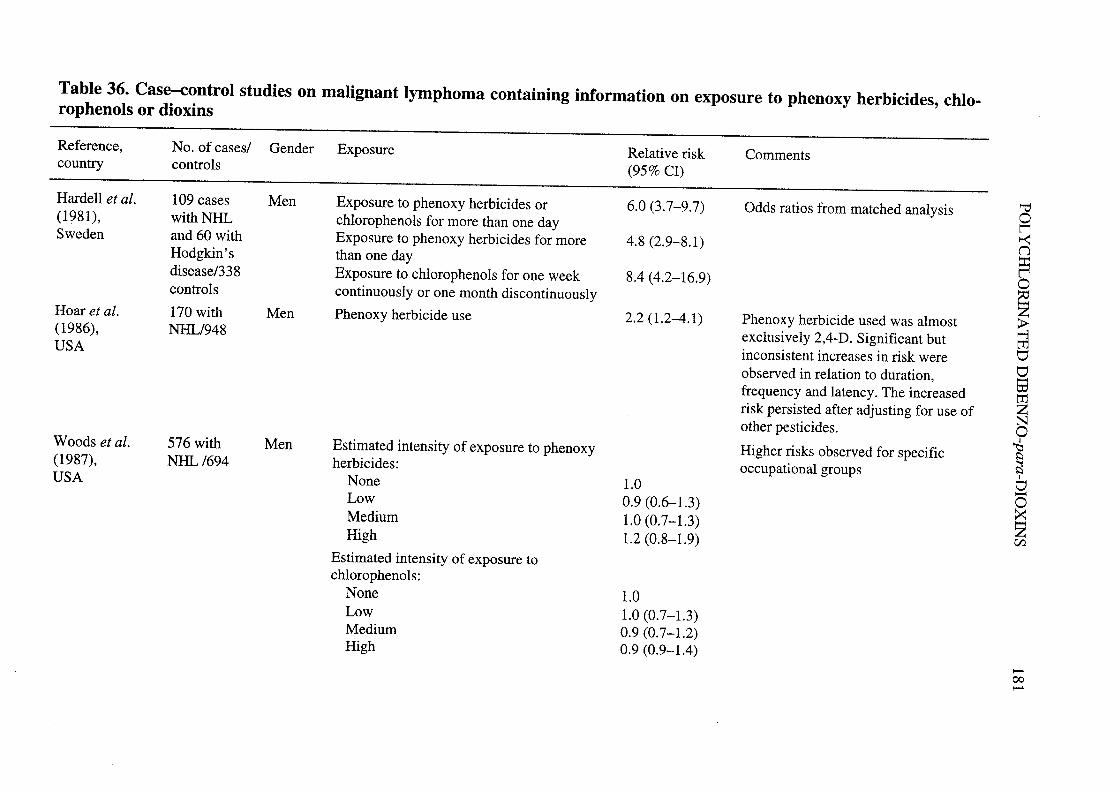
Table 36. Case-control studies on maUgnant lymphoma containing information on exposure to phenoxy herbicides, chlo-rophenols or dioxins
Reference,country CommentsNo. of cases/ Gender Exposure
controlsRelative risk(95% CI)
Hardell et al.(1981),Sweden
Hoar et al.(1986),USA
Woods et al.(1987),USA
109 cases Menwith NHand 60 with
Hodgkin' sdisease/338controls
170 with MenNH/948
576 with MenNH /694
Exposure to phenoxy herbicides orchlorophenols for more than one dayExposure to phenoxy herbicides for morethan one dayExposure to chlorophenols for one weekcontinuously or one month discontinuously
Phenoxy herbicide use
Estimated intensity of exposure to phenoxyherbicides:
NoneLowMediumHigh
Estimated intensity of exposure tochlorophenols:
NoneLowMediumHigh
6.0 (3.7-9.7)
4.8 (2.9-8.1)
8.4 (4.2-16.9)
2.2 (1.2-4.1)
1.00.9 (0.6-1.3)1.0 (0.7-1.3)1.2 (0.8-1.9)
1.01.0 (0.7-1.3)0.9 (0.7-1.2)0.9 (0.9-1.4)
Odds ratios from matched analysis
Phenoxy herbicide used was almostexc1usively 2,4-D. Significant but
inconsistent increases in risk wereobserved in relation to duration,frequency and latency. The increasedrisk persisted after adjusting for use ofother pesticides.
Higher risks observed for specificoccupational groups
"'o~~n:i~o~~~titi-tetrZNo~~~
1
ti-o~Zen
-00-


POL YCHLORINA TED DIBENZO-para-DIOXINS 183
case (in total 107), eight controls matched for sex, age and place of residence wereextracted from the national population registry and the two closest in age were used inthe analysis. For the 62 deceased cases, 10 controls per case were selected from thenational registry of causes of death among those who had died from causes other thanmalignant tumour, matched for sex, age, municipality and year of death. The two
deceased controls closest in age to the cases were used in the analysis. Exposures werereconstructed by means of a self-administered questionnaire. The data concemingdeceased subjects were obtained by contact with next-of-kin. For exposure to phenoxyherbicides or chlorophenols, an odds ratio of 6.0 (95% CI, 3.7-9.7) was obtained. Forphenoxy herbicides alone (41 exposed cases), the odds ratios were 4.8 (95% CI, 2.9-8.1)and 7.0 for those exposed for more than 90 days. Five cases and no controls were
exposed only to MCP A; 7 cases and 1 control only to 2,4-D. These herbicides were notlikely to be contaminated with PCDDs or PCDFs. Fifty cases were exposed to chloro-phenols, giving an odds ratio of 2.9 (95% CI, 1.6-5.2) for those with low-level exposureand 8.4 (95% CI, 4.2-16.9) for high-level exposure. High-level exposure to organicsol vents was also associated with a significantly increased risk. Combined exposure tosolvents and phenoxy herbicides or chlorophenols further increased the odds ratioestimate. Separate analysis for Hodgkin's disease (60 cases) and non-Hodgkin lymphoma(109 cases) yielded simIlarly increased risks. (The Working Group noted that nodistinction was made between herbicides likely to be contaminated with PCDDs andothers.)
A population-based case-control study on lymphoma was conducted in Kansas, amajor wheat-producing state in the United States (Hoar et al., 1986). All newly
diagnosed cases of Hodgkin' s disease and non-Hodgkin lymphoma among white maleresidents in Kansas aged 21 years or older, diagnosed from 1976 through 1982, wereidentified through the population-based cancer registry covering the state of Kansas. AUcases included in the study were histologically confired. Interviews were conductedwith 121 cases with Hodgkin's disease and 170 with non-Hodgkin lymphoma (96%paricipation rate). One-half of the patients with non-Hodgkin lymphoma and one-thirdof those with Hodgkin's disease had died before the study began. Controls were 948white men resident in Kansas matched to cases for age and vital status. The response ratefor controls was 94%. Subjects were interviewed by telephone and detailed informationwas obtained concerning farng practices, including years lived or worked in fars,crops grown or livestock raised, herbicides and insecticides used, numbers of years andacres of treatment and protective equipment used. Corroborative evidence was sought fora sample of 130 subjects by contacting their suppliers. Far herbicide use was associatedwith an increased risk for non-Hodgkin lymphoma (odds ratio, 1.6; 95% CI, 0.9-2.6).The relative risk for non-Hodgkin lymphoma increased significantly with the number ofdays of herbicide exposure per year and with latency. Men exposed to herbicides formore than 20 days per year had a six-fold increased risk for non-Hodgkin lymphoma(odds ratio, 6.0; 95% CI, 1.9-19.5). Frequent users (:: 20 years per year) who mIxed orapplied the herbicides themselves had an odds ratio of 8.0 (95% CI, 2.3-27.9). Use ofphenoxy herbicides (odds ratio, 2.2; 95% CI, 1.2-4.1) essentiaIly indicated use of 2,4-D,since only three cases, and 18 controls had used 2,4,5-T, and aIl but two of these controls

184 lARC MONOGRAPHS VOLUME 69
had also used 2,4-D. Far herbicide use was not associated with risk for Hodgkin'sdisease (odds ratio, 0.9; 95% CI, 0.5-1.5). For this neoplasm, no consistent pattern ofexcess risk was observed either with duration or frequency of exposure. The authors
noted that the observed excess risk for non-Hodgkin lymphoma was associated withexposure to phenoxy herbicides (2,4-D) which were not contaminated with 2,3,7,8-TCDD, although they might be contaminated with other PCDD congeners.
A population-based case-control study from western Washington State (Woods et aL.,1987), described above, included 576 non-Hodgkin lymphoma cases (402 alive, 174dead). Population controls were selected using random digit dialling or from socialsecurity records (for older cases) or non-cancer death certificates (for deceased cases).Controls were frequency matched for age and vital status with the non-Hodgkinlymphoma cases. The paricipation rate was 77% for non-Hodgkin lymphoma cases and76% for controls. The risk for non-Hodgkin lymphoma associated with aIl occupationsinvolving potential exposure to phenoxy herbicides was 1.1 (95% CI, 0.8-1.4). Exposureto phenoxy herbicides or chlorophenols was not associated with increased risk for non-Hodgkin lymphoma. No association was seen with estimated intensity of exposure toeither phenoxy herbicides or chlorophenols. A statistically significant excess risk fornon-Hodgkin lymphoma was observed for specifc occupational groups, includingfarers (odds ratio, 1.3; 95% CI, 1.0-1.7) and subjects spraying forests with herbicides
(odds ratio, 4.8; 95% CI, 1.2-19.4). AlI forestr sprayers reported combined use of 2,4-Dand 2,4,5-T. (The Working Group noted that no information was provided on use ofspecifie herbicides.)
Following the same methodology, a population-based case-control study was con-ducted in western Washington State on non-Hodgkin lymphoma and phenoxy herbicideexposure in farers (Woods & Polissar, 1989). Cases of non-Hodgkin lymphoma
occurrng between 1983 and 1985 were identified from the cancer surveilance system.A total of 694 control men without cancer selected randomly from the same geographicalarea were matched with the 576 cases by five-year age group and vital status. Amongthem, 181 non-Hodgkin lymphoma cases and 196 controls reported having worked asfarers. Information on exposure to phenoxy herbicides was obtained through personal
interviews. Regular use was defined as 'more than just once or twice per year'. Mantel-Haenszel odds ratios were calculated for farers, for all subjects for 2,4,5- T and for'phenoxy per se' exposures, among others. No excess risks 'were observed in aIl subjectsnor in the group of farers for the above exposures: for 2,4,5- T, the odds ratios were 0.7
(95% CI, 0.3-2.1) in farers and 1.0 (95% CI, 0.4-2.0) for all subjects; for 'phenoxyper se', the odds ratios were 0.7 (95% CI, 0.3-1.5) and 0.9 (95% CI, 0.5-1.5),respectively.
Pearce et al. (1987) expanded a previously reported case-control study on malignantlymphomas and farng in New Zealand (Pearce et aL., 1986). The study included malepublic hospital patients registered under ICD codes 200 or 202 durig the period 1977-81, who were under the age of 70 years. AlI cases were pathologically verified. Out of atotal of 215 eligible cases, 183 cases were enrolled in the study (paricipation rate 85%).For each of the cases, two cancer controls were randomly selected from the cancer

POL YCHLORIA TED DIBENZO-para-DIOXINS 185
registry files, matched for age and year of cancer registration. ln total, 338 controls wereenrolled (81 % paricipation rate). Interviews were conducted by telephone with thepatients or their next-of-kin (no information was given on the proportion of interviewswith next-of-kin). Information was requested conceming work in paricular occupationswith potential exposure to phenoxy herbicides or chlorophenols. If the response to a stemquestion was affirmative, then a series of subsidiar questions were asked to c1arfy thework done and the actual potential for exposure to specifie chemicals. Exposure tophenoxy herbicides and chlorophenols was ascertained through a combination ofinformation on occupation, industr, type of cultivation sprayed and self-reportedexposure to specifie agents. The proportions of cases and controls who had worked in theoccupations examined in this study were very similar. The odds ratio for any potentialexposure to phenoxy herbicides was 1.0 (95% CI, 0.7-1.5) and none of the odds ratiosrelating to specifie phenoxy herbicides was elevated. The odds ratio for any potentialexposure to chlorophenols was slightly elevated (odds ratio, 1.4; 95% CI, 0.8-2.3),largely due to the results for meat workers, which included workers potentially exposedto 2,4,6-TCP in pelt depaitments. ln a re-analysis of the data (Pearce, 1989), littleevidence was found of an association of non-Hodgkin lymphoma either with duration orwith frequency of phenoxy herbicide use. Findings were similar in the earlier publicationusing general population controls (Pearce et al., 1986). (The Working Group noted thatno distinction was made between herbicides likely to be contaminated with PCDDs andothers.)
Olsson and Brandt (1988) examined the lifetime work history of 167 incident cases ofnon-Hodgkin lymphoma diagnosed at a hospital in Lund (Sweden) between 1978 and1981 in adult men and in 130 age-matched population controls, 50 from the same geo-graphical area as the cases and 80 from different pars of Sweden. Exposure to organicsolvents, phenoxy herbicides and chlorophenols was given special attention. Interviewerswere not blind to subject status (case or control). One day of handling was taken toconstitute exposure to phenoxy acids or chlorophenols. Odds ratios were estimated usinglogistic models, adjusting for age. The roles of different exposures, of their interactionand of length of exposure were examned using logistic regression analysis. ln themultivarate analysis, the odds ratio for exposure to phenoxy herbicides was 1.3 (95% CI,0.8-2.1) and that for chlorophenols was 1.2 (95% CI, 0.7-2.0). Separate analysis forlocalized 'skin lymphoma' yielded a significantly increased risk (odds ratio, 10.0; 95%CI, 2.7-37.1) for exposure to phenoxy herbicides. No interaction between exposures wasdetected. Risk for non-Hodgkin lymphoma was significantly associated with length ofexposure to solvents but not to phenoxy herbicides and cWorophenols. (The WorkingGroup noted that no distinction was made between herbicides likely to be contamnatedwith PCDDs and others.)
Concurrent population-based case-control interview studies of leukaemia, non-
Hodgkin lymphoma and multiple myeloma in Iowa, United States, and leukaemia andnon-Hodgkin lymphoma in Minnesota, United States, were conducted durng 1981-84.The studies used the same questionnaie and the same controls. Results from the case-control study on non-Hodgkin lymphoma were reported by Cantor et al. (1992). Resultsfor the studies on leukaemia (Morrs Brown et aL., 1990) and multiple myeloma (Morrs

186 IARC MONOGRAHS VOLUME 69
Brown et al., 1993) are described in Section 2.2.2(c). AlI male cases of non-Hodgkinlymphoma aged 30 years or older and newly diagnosed during 1980-82 were ascertainedfrom Iowa State Health Registry records and a special surveilance of Minnesotahospitals and pathology laboratory records. Residents of Iowa and of selected areas ofMinnesota were eligible. A review panel of four pathologists confirmed diagnoses. Outof 780 reported non-Hodgkin lymphoma cases, 622 (438 living, 184 deceased) wereconfirmed a& non-Hodgkin lymphoma and interviewed. The paricipation rate wasslightly above 80% (exact proportion not estimable). A population control group of 1245white men without haematopoietic or lymphatic cancer was randomly selected andfrequepcy matched with the non-Hodgkin lymphoma and leukaemia cases by five-yearage group, vital status at time of interview and state of residence. Random digit diallngwas used to select controls for living cases under 65 years of age. A 1 % random listing ofMedicare files was used for the selection of controls for living cases over 65 years of age.State death certificates were used for deceased cases. The paricipation rate was around77% in all three groups of controls. Direct structured interviews were conducted during1981-84. Detailed information on farng and pesticide use was requested for allsubjects who had worked on a far for at least six months since the age of 18 years. Theinformation recorded included years of farng activity, tota acreage, crops grown and
detailed history of pesticide use. There was a small increase in risk (odds ratio, 1.2; 95%CI, 1.0-1.5) associated with ever living or working on a far. The odds ratio for use ofone or more herbicides was 1.3 (95% CI, 1.0-1.6), but no single family of herbicides wassignificantly associated with risk for non-Hodgkin lymphoma. No significant riskelevations were observed for ever handling, mixing or applying specifie phenoxy
herbicides. The odds ratio for 2,4-D was 1.2 (95%, 0.9-1.6) and that for 2,4,5-T was 1.2(95% CI, 0.7-1.9). The risk for 2,4,5-T was slightly higher among farers who did notuse protective gear (odds ratio, 1.4; 95% CI, 0.7-2.5). The odds ratios for handling theseherbicides before 1965 (assuming a latency of about 15 years) were 1.3 (95% CI, 0.9-1.8) for 2,4-D and 1.7 (95% CI, 0.8-3.6) for 2,4,5-T. The authors stated that there wasminimal confounding of results for any single pesticide by exposure to pesticidesbelonging to other chemical famlies.
The case-control study conducted in Victoria, Australia, described in Section 2.2.2( a)(Smith & Chrstophers, 1992), also included 52 male cases with malignant lymphoma.The odds ratios for malignant lymphoma were 1.5 (95% CI, 0.6-3.7) for at least oneday's exposure to phenoxy herbicides or cWorophenols, 1.1 (95% CI, 0.4-3.0) forexposure only to phenoxy herbicides and 1.4 (95% CI, 0.3-6.1) for exposure only tochlorophenols. The odds ratio for more than 30 days of exposure to phenoxy herbicidesor chlorophenols was 2.7 (95% CI, 0.7-9.6). (The Working Group noted that nodistinction was made between herbicides likely to be contamnated with PCDDs andothers.)
(c) Other haematopoietic maUgnancies (see Table 37)
A case-control study on leukaemia was conducted in Iowa and Minnesota, UnitedStates (Morrs Brown et aL., 1990) using the same methodology and same control groupas that described in Section 2.2.2(b) (Cantor et aL., 1992). AlI newly diagnosed cases of
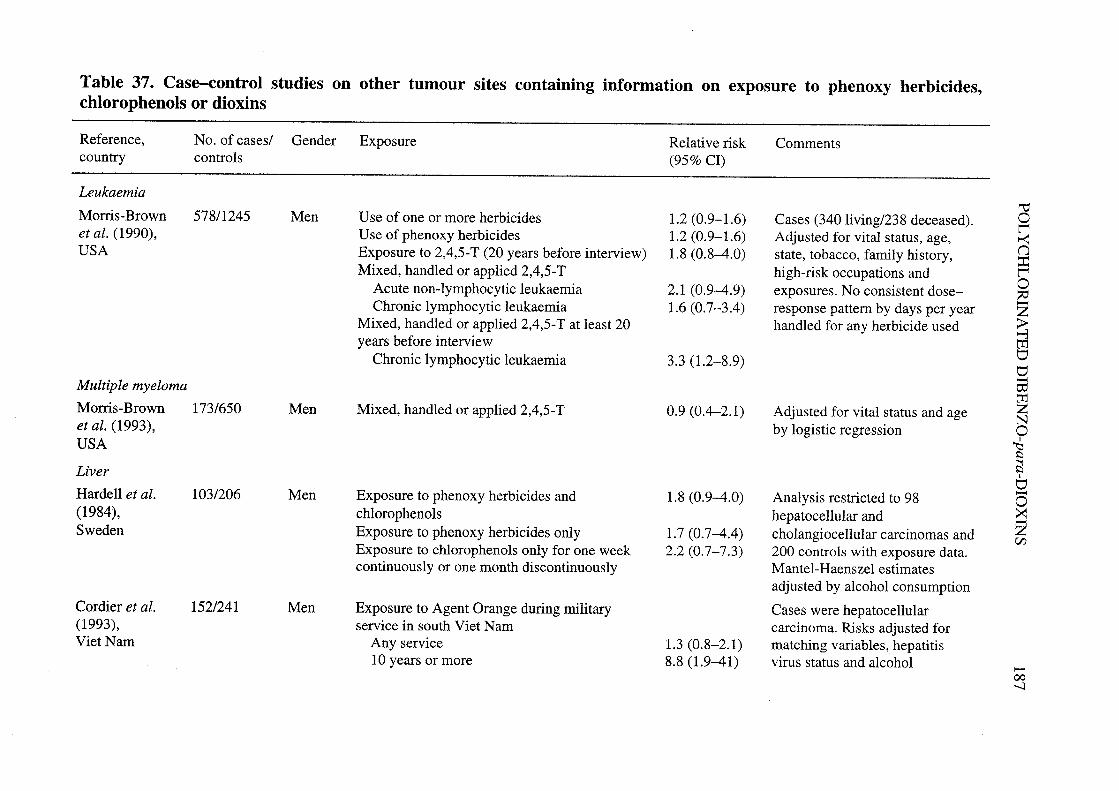
Table 37. Case-control studies on other tumour sites containing information on exposure to phenoxy herbicides,
chlorophenols or dioxins
Reference, No. of cases/ Gender Exposure Relative risk Commentscountr controls (95% CI)
Leukaemia
Morrs-Brown 578/1245 Men Use of one or more herbicides 1.2 (0.9-1.6) Cases (340 living/238 deceased).et al. (1990), Use of phenoxy herbicides 1.2 (0.9- 1.6) Adjusted for vital status, age,USA Exposure to 2,4,5-T (20 years before interview) 1.8 (0.8-4.0) state, tobacco, family history,
Mixed, handled or applied 2,4,5- T high-risk occupations andAcute non-Iymphocytic leukaemia 2.1 (0.9-4.9) exposures. No consistent dose-Chronic lymphocytic leukaemia 1.6 (0.7-3.4) response pattern by days per year
Mixed, handled or applied 2,4,5- T at least 20 handled for any herbicide usedyears before interview
Chronic lymphocytic leukaemia 3.3 (1.2-8.9)
Multiple myeloma
Morrs-Brown 173/650 Men Mixed, handled or applied 2,4,5- T 0.9 (0.4-2.1) Adjusted for vital status and ageet al. (1993), by logistic regressionUSA
Liver
Hardell et al. 103/206 Men Exposure to phenoxy herbicides and 1.8 (0.9-4.0) Analysis restricted to 98(1984), chlorophenols hepatocellular andSweden Exposure to phenoxy herbicides only 1.7 (0.7-4.4) cholangiocellular carcinomas and
Exposure to chlorophenols only for one week 2.2 (0.7-7.3) 200 con troIs with exposure data.continuously or one month discontinuously Mantel-Haenszel estimates
adjusted by a1cohol consumption
Cordier et al. 152/241 Men Exposure to Agent Orange during militar Cases were hepatocellular(1993), service in south Viet Nam carcinoma. Risks adjusted forViet Nam Any service 1.3 (0.8-2.1) matching varables, hepatitis
10 years or more 8.8 (1.9-41) virus status and a1cohol
"tol'~()::l'o~Z~""rdvv-timZNo~¡:
~1
V-o~ZV1
-00..

-0000
Table 37 (contd) -~¡oReference, No. of cases/ Gender Exposure Relative risk Comments n
countr controls (95% CI) ~0ZColon 0c.
Hardell (1981), 157/451 Men More than one day of exposure to: Mantel-Haenszel estimates~Sweden Phenoxy herbicides 1.3 (0.6-2.8) adjusted by age, vital status and 'i
Chlorophenols 1.8 (0.6-5.3) place of residence :iC/
Nasopharynx + nasal ~0Hardell et al. 71/541 Men Exposure to phenoxy herbicides for more than 2.1 (0.9-4.7) Mantel - Haenszel estimates 1:
c:(1982), one day adjusted by age and vital status ~Sweden Exposure to chlorophenols for one week 6.7 (2.8-16.2) tr
0'continuously or one month discontinuously \0

POL YCHLORIA TED DIBENZO-para-DIOXINS 189
leukaemia among white men aged 30 years or older were ascertained from tumourregistry or hospital records retrospectively (one year before the star of the study) orprospectively (two years after the star of the study). Interviews were completed with86% of the cases (or next-of-kin). The final study population consisted of 578 cases (340living, 238 deceased) and 1245 population controls. Apar from the main interview(described above), a supplementar interview was conducted including 92 cases and 211controls (or their next-of-kin) from Iowa who had reported agricultural use of pesticidesin their initial interview. There was a small risk for all leukaemias among persons whohad lived or worked on a far as an adult (odds ratio, 1.2; 95% CI, 1.0-1.5). A similarrisk was seen for farers reporting ever having used herbicides (odds ratio, 1.2; 95% CI,
0.9-1.6) or phenoxy herbicides (odds ratio, 1.2; 95% CI, 0.9-1.6). Risks for allleukaemias were not significantly increased among subjects who personally mixed,handled or applied specifie herbicides. When analyses were restricted to persons firstexposed to specifie herbicides more than 20 years before interview, increased risks wereobserved for exposure to MCPA (odds ratio, 2.4; 95% CI, 0.7-8.2) and 2,4,5-T (oddsratio, 1.8; 95% CI, 0.8-4.0). Among specifie cell types, the highest risk for those whohandled 2,4-D was seen for chronic myelogenous leukaemia (odds ratio, 1.9; 95% CI,0.9-3.9). The odds ratios for those who handled 2,4,5- T were 2.1 (95% CI, 0.9-4.9) foracute non-Iymphocytic leukaemia and 1.6 (95% CI, 0.7-3.4) for chronic lymphocyticleukaemia. The risk for those who handled 2,4,5- T at least 20 years before interview wassignificantly elevated for chronic lymphocytic leukaemia (odds ratio, 3.3; 95% CI, 1.2-8.9). No consistent dose-response pattern in terms of days of handling per year was seenfor any of the herbicides used.
A case-control study on multiple myeloma was conducted in Iowa, United States(Morrs-Brown et aL., 1993), using the same methodology and same control group as thatdescribed above in Section 2.2.2(b) (Cantor et aL., 1992). AlI cases of multiple myelomaamong adult white men aged 30 years or older and diagnosed during 1981-84 wereidentified from the Iowa State Health Registry. Pathological material and laboratoryreports were reviewed by an expert pathologist. Included the study were 173 cases (101alive, 72 deceased) and 650 controls (452 alive, 198 deceased). Interviews were
completed for 84% of multiple myeloma cases and 78% of controls. Sorne farng
activity was reported by 64% of the cases and 58% of the controls (odds ratio, 1.2; 95%CI, 0.8-1.7). Risks were not elevated for subjects who handled the phenoxy herbicides2,4-D (odds ratio, 1.0; 95% CI, 0.6-1.6) or 2,4,5-T (odds ratio, 0.9; 95% CI, 0.4-2.1).
(d) Other solid tumours (Table 37)
Hardell (1981) conducted a case-control study on colon cancer patients following thesame methodology as that described earlIer (see Section 2.2.2(a); Hardell & Sändstrom,1979; Eriksson et aL., 1981; Hardell et aL., 1981). Cases were 157 men with colon cancer
(response rate, 98.1 %) aged 25-85 years who were residents of the region of Umeå,Sweden, and who had been reported to the Swedish Cancer Registr in 1978-79. Al had
a histopathological diagnosis of adenocarcinoma. Sixty-five cases (41 %) were deceased.The 541 controls were derived from two earlIer studies (Hardell & Sändstrom, 1979;Hardell et al., 1981). A low excess risk was observed for exposure to phenoxy herbicides

190 IARC MONOGRAHS VOLUME 69
(odds ratio, 1.3; 95% CI, 0.6-2.8) and for exposure to chlorophenols (odds ratio, 1.8;95% CI, 0.6-5.3). (The Working Group noted that no distinction was made betweenherbicides likely to be contaminated with PCDDs and others.)
ln a case-control study on nasal and nasopharngeal cancer in the region of Umeå,Sweden, Hardell et al. (1982) followed the same methodology as that described above(Hardell & Sändstrom, 1979; Hardell et aL., 1981). The cases comprised all male patientsaged 25-85 years with histopathologically confirmed nasopharngeal cancer (n = 27) andcancer of the nose and nasal sinuses (n = 44). AlI cases had been reported to the SwedishCancer Registry in 1970-79 and were residents in the three most northem counties ofSweden. The 541 controls were derived from two earlier studies in the same region(Hardell & Sändstrom, 1979; Hardell et al., 1981). Fifty (70.4%) of the cases weredeceased, compared with 245 (45.3%) of the controls. (No information was provided onresponse rates.) Exposure to phenoxy herbicides was associated with a two-fold risk forthe combination ofnasopharngeal and nasal cavity cancer (odds ratio, 2.1; 95% Ci, 0.9-4.7). A high risk was found for high-level exposure to chlorophenol, defined as a cumu-lative exposure of one week of continuous or one month of discontinuous exposure (oddsratio, 6.7; 95% CI, 2.8-16.2). No obvious difference was reported between cases andcontrols for low-level exposure to chlorophenols. The risk associated with use of chloro-phenol exposure was higher among wood workers (odds ratio, 8.4) than in other occu-pations (odds ratio, 2.7) but, in a stratified analysis, it was shown that occupation as awood worker was not a confounding factor for exposure to chlorophenols. (The W orkingGroup noted that no distinction was made between herbicides likely to be contamInatedwith PCDDs and others.)
Men aged 25-80 who had been diagnosed with liver cancer between 1974 and 1981and reported to the Deparment of Oncology, Umeå, Sweden, were included in anothercase-control study (Hardell et al., 1984). Microscope slides were reviewed for the 166assembled cases, and 103 cases of primar liver cancer were retained for the study; 206population-based controls were matched with cases for age and residence. Informationon exposure was obtained as in previous studies (see Hardell & Sandström, 1979);responses were obtained for 102 cases and 200 controls. The analyses were restricted tothe 98 cases of hepatocellular and cholangiocellular carcinoma. Odds ratios, withoutcontrollng for other agricultural exposures, were 1.8 (95% Ci, 0.9-4.0) for exposure tophenoxy herbicides and chlorophenols, 1.7 (95% Ci, 0.7-4.4) for exposure to phenoxyherbicides only and 2.2 (95% CI, 0.7-7.3) for high-Ievel exposure to chlorophenols only.(The W orking Group noted that no distinction was made between herbicides likely to becontaminated with PCDDs and others.)
A case-control study conducted in two hospitals in Hanoi (Viet Nam) between 1989and 1992 included 152 male cases of hepatocellular carcinoma and 241 hospital controls,admitted mainly in abdominal surgery deparments, matched for age, sex and area ofresidence at the time of admission (Cordier et al., 1993). Exposure to Agent Orange mayhave occurred during stays in the south of Viet Nam afer 1960 (date of the beginnng ofspraying missions) especia1ly for milita purposes. Duration of militar service in the
south, for Nort Vietnamese soldiers, was considered as a proxy for exposure to Agent
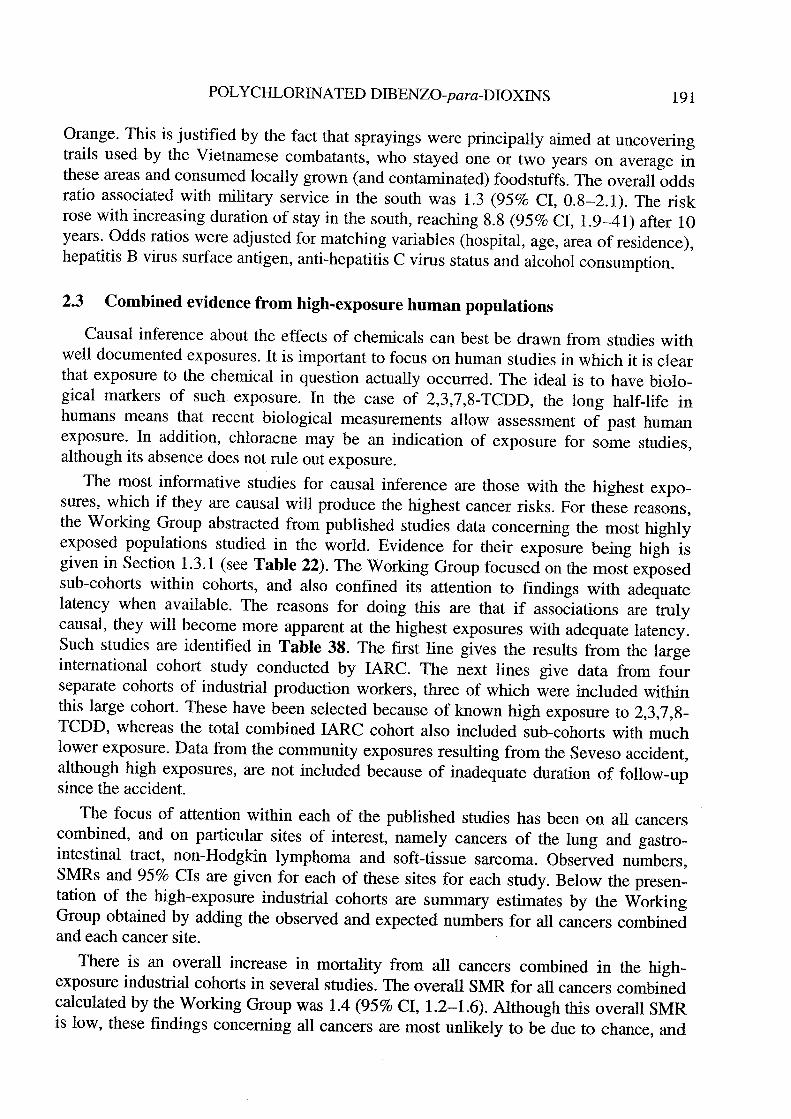
POL YCHLORINA TED DIBENZO-para-DIOXINS 191
Orange. Ths is justified by the fact that sprayings were principally aimed at uncoveringtrails used by the Vietnamese combatants, who stayed one or two years on average inthese areas and consumed locally grown (and contamnated) foodstuffs. The overall oddsratio associated with militar service in the south was 1.3 (95% CI, 0.8-2.1). The riskrose with increasing duration of stay in the south, reaching 8.8 (95% CI, 1.9-41) after 10years. Odds ratios were adjusted for matching variables (hospital, age, area of residence),hepatitis B virus surface antigen, anti-hepatitis C virus status and alcohol consumption.
2.3 Combined evidence from high-exposure human populations
Causal inference about the effects of chemicals can best be drawn from studies withwell documented exposures. It is important to focus on human studies in which it is clearthat exposure to the chemical in question actually occurred. The ideal is to have biolo-gical markers of snch exposure. ln the case of 2,3,7,8-TCDD, the long half-life inhumans means that recent biological measurements allow assessment of past humanexposure. ln addition, chloracne may be an indication of exposure for some studies,although its absence does not rule out exposure.
The most informative studies for causal inference are those with the highest expo-sures, which if they are causal wil produce the highest cancer risks. For these reasons,the W orking Group abstracted from published studies data concernng the most highlyexposed populations studied in the world. Evidence for their exposure being high isgiven in Section 1.3.1 (see Table 22). The Working Group focused on the most exposedsub-cohorts within cohorts, and also confined its attention to findings with adequatelatency when available. The reasons for doing this are that if associations are trulycausal, they wil become more apparent at the highest exposures with adequate latency.Such studies are identified in Table 38. The first line gives the results from the largeinternational cohort study conducted by lARe. The next lines give data from fourseparate cohorts of industrial production workers, three of which were included withnthis large cohort. These have been selected because of known high exposure to 2,3,7,8-TCDD, whereas the total combined IARC cohort also inc1uded sub-cohorts with muchlower exposure. Data from the community exposures resulting from the Seveso accident,although high exposures, are not inc1uded because of inadequate duration of follow-up
since the accident.
The focus of attention within each of the published studies has been on all cancerscombined, and on paricular sites of interest, namely cancers of the lung and gastro-intestinal tract, non-Hodgkin lymphoma and soft-tissue sarcoma. Observed numbers,SMRs and 95% Cls are given for each of these sites for each study. Below the presen-tation of the high-exposure industraI cohorts are summar estimates by the W orkingGroup obtained by adding the observed and expected numbers for aIl cancers combinedand each cancer site.
There is an overall increase in mortality from all cancers combined in the high-exposure industral cohorts in several studies. The overall SMR for all cancers combinedcalculated by the Working Group was 1.4 (95% Ci, 1.2-1.6). Although this overall SMRis low, these findings concernng all cancers are most unliely to be due to chance, and

..\0Table 38. Summary of the combined international cohort and selected industrial cohort studies with high exposure levels N
Reference AU cancers Lung cancer Non-Hodgkin lymphoma Soft-tissue sarcoma Gastrointestinal cancer
Obs. SMR 95% CI Obs. SMR 95% CI Obs. SMR 95% CI Obs. SMR 95% CI Obs. SMR 95% CI
Interntional cohort
Kogevinas et aL. 394 1.2 1. -1. 127 1.2 1.0-1.4 14 1.6 0.9-2.7 3 2.3 0.5-6.6 190 1.0 0.9-1.2(1997)"
Industrial populations (high-exposure subcohorts) -Fingerhut et al. 114 1.5 1.2-1.8 40 1.4 1.0-1.9 2 0.9 0.1-3.4 3 9.2 1.9-27.0 28 1.4 0.9-2.0 ;¡::(1991a/ n(USA) ~Becher et al. 105 (1.3) (1.0-1.5) 33 (1.4) (1.0-2.0) 6 (4.6) (1.7-10.0) 0 0.0 27 (0.9) (0.6-1.4)
0- Z( 1996)' 0(Gennany)
~Hooiveld et al. 51 1.5 1.-1.9 14 1.0 0.5-1.7 3 3.8 0.8-11.0 0 0.00 - NR(1996a/ "'
::(N etherlands) CI
~Ott & Zober 18 1.9 1.-3.0 7 2.4 1.0-5.0 NR NR 6 1.8 0.7-4.0 0(1996)' t"(BASP, æaccident) tI
0'Total (288) (1.4) (1.2-1.6) (94) (l.4) (1.-1.7) (11) (2.6) (1.3-4.7) (3) (4.7) (61) (1.2) (0.9-1.5) \0
P value 0: 0.001 0: 0.01 0: 0.01 0.23
NR, not reporteda Kogevinas et al. (1997): men and women ~ 20 years since first exposure, except for digestive cancer for which no latency data were available. These data
include the cohorts of Fingerhut et al. (1991a,b), Becher et al. (1996), Hooiveld et aL. (1996a), the onginal IARC cohort (Saracci et aL, 1991) and other cohorts.bPingerhut et al. (199Ia): Men;: 20 years latency and ~ 1 year exposurecBecher et aL. (1996): Men, Cohort L and II, summed (Boehnnger-Ingelheim, Bayer-Uerdingen cohorts)dHooiveld et al. (l996a): Men and women, Factory Ae Ott & Zober (1996): Men, chloracne subgroup, ~ 20 years latency. Data presented for lung cancer are all respiratory tract cancers combined. No data were
available for soft-tissue sarcoma and non-Hodgkin lymphoma.

POL YCHLORIA TED DIBENZO-para-DIOXINS 193
are consistent across the studies with the highest exposure. Increases in all cancers
combined of this magnitude have rarely been found in occupational cohorts.
The combined SMR for lung cancer was calculated to be 1.4 (95% CI, 1.1-1.7). Thefindings are unlikely to be due to chance. It is the view of the W orking Group that theselung cancer results are not the result of confounding by cigarette smoking. As with allcancers combined, the strength of association is again low .
The overall estimate for non-Hodgkin lymphoma was significantly elevated (SMR,2.6; 95% CI, 1.3-4.7), but there was no increased risk in the large NIOSH cohort. TheSMR for gastrointestinal cancer was 1.2 (95% CI, 0.9-1.5). For soft-tissue sarcoma, theoverall SMR was approximately 4.7 (calculated by the Working Group, estimatingexpected values of 0.20 and 0.12 for Becher et al. (1996) and Hooiveld et aL. (1996a)
respectively).
The available dose-response data are presented in Table 39. Two studies give dose-response relationship data for all cancers combined based on evidence for 2,3,7,8-TCDDexposure. ln the Boehrnger-Ingelheim cohort (cohort 1 in Becher et al.), the relativensks are given for seven levels of toxic equivalents for 2,3,7,8-TCDD (Flesch-Janyset al., 1995). The rate ratios fluctuate, but there is a clear elevation for the highestexposure group, which involves workers with markedly higher blood and fat 2,3,7,8-TCDD levels than for the other categories (RR, 2.7; 95% CI, 1.7-4.4). The overall testfor trend resulted in a p value less than 0.01, but this is largely the result of the high RRfor the highest exposure group.
The second study giving dose-response data for all cancers involves the BASFaccident cohort, based on the entire cohort (n = 243). Workers were divided into fourcategories of measured and estimated 2,3,7,8-TCDD levels. There was a trend forincreasing SMR with measured exposure up to a relative risk of 2.0 (95% CI, 0.8-4.0).The test for trend using cumulative dose as a continuous varable in Cox's regressionanalysis yielded confidence intervals indicating a p value of 0.05. Thus ths study and theBoehrnger-Ingelheim cohort together provide dose-response evidence supporting acausal relationship between 2,3,7,8-TCDD exposure and mortality from all cancerscombined. Further subdivision of the data indicates that the positive dose-response wasrestrcted to smokers.
Concernng specific cancer sites, dose-response information from higWy exposedpopulations is available in one publication only involving two cancer sites, non-Hodgkinlymphoma and soft-tissue sarcoma. For each site, there are trends of increasing risks withincreasing exposures classified as low, medium and high. Whle confidence limits arebroad, the test for trend gave p values of 0.1 for non-Hodgkin lymphoma and 0.04 forsoft-tissue sarcoma.
ln summar, the epidemiological evidence from the most highly 2,3,7,8-TCDD-exposed populations studied produces strong evidence of increased risks for all cancerscombined, along with less strong evidence of increased risks for cancers of paricularsites. Ths situation appears to be unique, compared with established human carcinogens.The overall findings are unlikely to be due to chance. There is no obvious basis to infer

194 IARC MONOGRAHS VOLUME 69
Table 39. Cohort or nested case-control studies ofindustriaI workers presenting dose-response data
Boehringer-Ingelheim cohort, Gennany (Fesch-Janys,1996), aIl cancers
PCDD/PCDF TEQ (nglblood fat)" Rateratio
(95% CI)
o1.0-12.212.3-39.539.6-98.999.0-278.5278.6-545.0545.1-4361.9
1.01.0 (0.6-1.8)1.3 (0.8-2.1)1.2 (0.7-1.9)1.2 (0.8- 1.9)1.3 (0.7-2.3)2.7 (1.7-4.4)
Test for linear trend p .. 0.01
BASF accident cohort, Gennany (Ott & Zober, 1996), aIlcancers
2,3,7,8-TCDD No. of subjects No. of SMR (95% CI)
(l1g/kg bw) deaths.. 0.10.1-0.991.0- 1.99~2.0
108664722
fp = 0.05)
88
87
0.8 (0.4-1.6)
1.2 (0.5-2.3)
1.4 (0.6-2.7)
2.0 (0.8-4.0)
IARC nested case-control stndy (Kogevinas et al., 1995)
2,3,7,8-TCDD Number of Odds (95% CI)exposure cases/contro1s ratio
Non-Hodgkin lymphomaNon-exposed 21/119 1.0Law 4/18 1.4 (0.4-.6)Medium 3/8 3.6 (0.7-18.7)High 4/13 3.6 (0.6-19.2)
Test for 1inear trend p = 0.1
Soft-tissue sarcomaNon-exposed 6/42 1.0Law 1/4 2.8 (0.1-54.8)Medium 1/4 6.6 (0.1-540)High 3/5 10.6 (0.6-71)
Test for lInear trend p = 0.04
aEstimated German PCDD/PCDF TEQ 1evels at the end of
exposure above German median background

POLYCHLORINATED DIBENZO-para-DIOXINS 195
that the findings are due to confounding with smoking, nor with occupational exposures to other chemicals, but such confounding cannot be ruled out. There is evidence in some studies of dose-response relationships, although dose-response data are not available fur some of the largest studies. The reIative risk estimates for all cancers, lung cancer and gastrointestinal cancer involve relatively low strengths of association. Higher relative risk estimates are present in some studies concerning non-Hodgkin lymphoma and soft- tissue sarcoma, but the total numbers of cancers are small, in particular for soft-tissue sarcoma.