canadian tagging of commercial groundfish · pdf filecanadian tagging of commercial groundfish...
TRANSCRIPT

CANADIAN TAGGING OF COMMERCIAL
GROUNDFISH AND SMALL PELAGIC FISH IN THE
VICINITY OF THE SCOTIAN SHELF AND GULF OF ST.
LAWRENCE, 1953-1985
Wayne T. Stobo and G. Mark Fowler
Fisheries and Oceans Canada
Bedford Institute of Oceanography
P.O. Box 1006
Dartmouth, N.S.
B2Y 4A2
2006
Canadian Technical Report of Fisheries and Aquatic Sciences 2669

Canadian Technical Report of Fisheries and Aquatic Sciences
Technical reports contain scientific and technical information that contributes to existing knowledge but which
is not normally appropriate for primary literature. Technical reports are directed primarily toward a worldwide
audience and have an international distribution. No restriction is placed on subject matter and the series reflects the
broad interests and policies of Fisheries and Oceans Canada, namely, fisheries and aquatic sciences.
Technical reports may be cited as full publications. The correct citation appears above the abstract of each
report. Each report is abstracted in the data base Aquatic Sciences and Fisheries Abstracts.
Technical reports are produced regionally but are numbered nationally. Requests for individual reports will be
filled by the issuing establishment listed on the front cover and title page.
Numbers 1-456 in this series were issued as Technical Reports of the Fisheries Research Board of Canada.
Numbers 457-714 were issued as Department of the Environment, Fisheries and Marine Service, Research and
Development Directorate Technical Reports. Numbers 715-924 were issued as Department of Fisheries and
Environment, Fisheries and Marine Service Technical Reports. The current series name was changed with report
number 925.
Rapport technique canadien des sciences halieutiques et aquatiques
Les rapports techniques contiennent des renseignements scientifiques et techniques qui constituent une
contribution aux connaissances actuelles, mais qui ne sont pas normalement appropriés pour la publication dans un
journal scientifique. Les rapports techniques sont destinés essentiellement à un public international et ils sont
distribués à cet échelon. II n'y a aucune restriction quant au sujet; de fait, la série reflète la vaste gamme des intérêts
et des politiques de Pêches et Océans Canada, c'est-à-dire les sciences halieutiques et aquatiques.
Les rapports techniques peuvent être cités comme des publications à part entière. Le titre exact figure au-
dessus du résumé de chaque rapport. Les rapports techniques sont résumés dans la base de données Résumés des
sciences aquatiques et halieutiques.
Les rapports techniques sont produits à l'échelon régional, mais numérotés à l'échelon national. Les demandes
de rapports seront satisfaites par l'établissement auteur dont le nom figure sur la couverture et la page du titre.
Les numéros 1 à 456 de cette série ont été publiés à titre de Rapports techniques de l'Office des recherches sur
les pêcheries du Canada. Les numéros 457 à 714 sont parus à titre de Rapports techniques de la Direction générale
de la recherche et du développement, Service des pêches et de la mer, ministère de l'Environnement. Les numéros
715 à 924 ont été publiés à titre de Rapports techniques du Service des pêches et de la mer, ministère des Pêches et
de l'Environnement. Le nom actuel de la série a été établi lors de la parution du numéro 925.

Canadian Technical Report of
Fisheries and Aquatic Sciences 2669
2006
CANADIAN TAGGING OF COMMERCIAL GROUNDFISH AND SMALL
PELAGIC FISH IN THE VICINITY OF THE SCOTIAN SHELF AND GULF OF ST. LAWRENCE, 1953-1985
by
Wayne T. Stobo and G. Mark Fowler
Fisheries and Oceans Canada
Bedford Institute of Oceanography
P.O. Box 1006
Dartmouth, N.S.
B2Y 4A2
E-mail: [email protected]
E-mail: [email protected]

ii
© Her Majesty the Queen in Right of Canada, 2006.
Cat. No. Fs 97-6/0000E ISSN 0706-6457
Correct citation for this publication:
Stobo, W.T. and G.M. Fowler, 2006. Canadian tagging of commercial groundfish and small
pelagic fish in the vicinity of the Scotian Shelf and Gulf of St. Lawrence, 1953-1985. Can. Tech.
Rep. Fish. Aquat. Sci. 2669: xii + 137 p.

iii
TABLE OF CONTENTS
LIST OF TABLES ............................................................................................................v
LIST OF FIGURES..........................................................................................................vi
LIST OF APPENDICES ................................................................................................viii
ABSTRACT......................................................................................................................x
INTRODUCTION.............................................................................................................1
OVERVIEW......................................................................................................................2
DATA QUALITY .............................................................................................................5
RECOVERY PARAMETERS..........................................................................................7
SPECIES SYNOPSES ....................................................................................................10
Atlantic Wolffish (Anarhichas lupus) .................................................................10
Atlantic Cod (Gadus morhua).............................................................................10
Cunner (Tautogolabrus adspersus).....................................................................13
Haddock (Melannogrammus aeglefinus) ............................................................14
Atlantic Halibut (Hippoglossus hippoglossus)....................................................15
Herring (Clupea harengus) .................................................................................16
Mackerel (Scomber scombrus) ............................................................................18
American Plaice (Hippoglossoides platessoides) ...............................................18
Pollock (Pollachius virens) .................................................................................19
Sea Raven (Hemitripterus americanus) ..............................................................20
Thorny Skate (Raja radiata) ...............................................................................21
White Hake (Urophycis tenuis)...........................................................................21
Windowpane Flounder (Scophthalmus aquosus) ................................................22
Winter Flounder (Pseudopleuronectes americanus) ...........................................22
Winter Skate (Raja ocellata)...............................................................................23
Witch Flounder (Glyptocephalus cynoglossus)...................................................23
Yellowtail Flounder (Limanda ferruginea).........................................................25

iv
REFERENCES................................................................................................................27
Tables ..............................................................................................................................30
Figures .............................................................................................................................32
Appendix A (Summary of Tagging Activities) ...............................................................53
Appendix B (Release Location Maps) ............................................................................63
Appendix C (Release Length Data Summaries)..............................................................95
Appendix D (Subsampled Length-Frequencies) ...........................................................101
Appendix E (Data Formats) ..........................................................................................109
Appendix F (Publications) ............................................................................................131

v
LIST OF TABLES
Table 1. Aspects of recovery data quality for different species and tagging programs................. 30
Table 2. Temporal breakdown of recovery data for different species and tagging
programs................................................................................................................... 31

vi
LIST OF FIGURES
Figure 1. Map of the area encompassing most of the tagging activities discussed ...................... 32
Figure 2. Overview of groundfish tag returns by month from the 1953-73 and 1978-85
tagging programs................................................................................................. 33
Figure 3. Recovery locations of Atlantic wolffish (catfish) tagged off southwest Nova
Scotia (4Xqr) in May-June 1963 ......................................................................... 34
Figure 4a. Recoveries locations of Atlantic cod tagged near Seven Islands, Quebec, in
October of 1961 and May of 1964 ...................................................................... 35
Figure 4b. Recoveries from Atlantic cod tagged near Chaleur Bay, New Brunswick, in
September of 1961 and May of 1964 .................................................................. 36
Figure 5. Recovery locations for cunner tagged in St Margarets Bay, Nova Scotia
(4Xm) in July 1980 ............................................................................................. 37
Figure 6. Unpublished movements of haddock tagged on the Scotian Shelf and in the
Bay of Fundy during 1959-1973 ......................................................................... 38
Figure 7. Recoveries from mackerel tagged throughout the Bay of Fundy (July, 1974),
Scotian Shelf (October, 1973-74), Sydney Bight (July, 1974), and Gulf
of St Lawrence (September-October, 1974-74) .................................................. 39
Figure 8. Recoveries from white hake tagged near Souri, PEI, in August of 1967...................... 40
Figure 9. Movements of white hake tagged near Souri, PEI in September 1979......................... 41
Figure 10. Movements of winter flounder tagged in and around Passamaquoddy Bay,
New Brunswick, and off Halifax, Nova Scotia, between 1971 and 1985 ........... 42
Figure 11. Movements of witch flounder tagged in and around Passamaquoddy Bay,
New Brunswick, in the summer of 1973............................................................. 43
Figure 12. Movements of witch flounder tagged on the Scotian Shelf northwest of Sable
Island in April of 1965 ........................................................................................ 44
Figure 13. Movements of witch flounder tagged on Banquereau (4Vc) in March of 1965 .......... 45
vii
Figure 14. Movements of witch flounder tagged off Cape Canso (4Wd) in February,
1964..................................................................................................................... 46
Figure 15. Movements of witch flounder tagged along the edge of the Laurentian
Channel (4Vb) in October of 1964...................................................................... 47
Figure 16. Movements of witch flounder tagged in the northern portion of Sydney Bight,
Cape Breton (4Vn) in October, 1963 .................................................................. 48
Figure 17. Recovery locations of witch flounder tagged in the Cape Breton Trough, Gulf
of St Lawrence (4Tg) in October, 1963............................................................... 49
Figure 18. Movements of yellowtail flounder tagged on the Scotian Shelf near Sable
Island in 1966-67................................................................................................. 50
Figure 19. Recovery locations of yellowtail flounder tagged off southwest Nova Scotia
in April, 1972 and off Halifax, Nova Scotia in January-February, 1979 ............ 51

viii
LIST OF APPENDICES
Appendix A. Summary of Tagging Activities............................................................................... 53
Appendix B. Release Location Maps ............................................................................................ 63
Figure 1. American Plaice 1953-1973.......................................................... 64
Figure 2. American Plaice 1978-1985.......................................................... 65
Figure 3. Windowpane Flounder, Atlantic Wolffish, Cunner, Sea
Raven 1963-1984 ......................................................................................... 66
Figure 4. Atlantic Cod 1953-1955................................................................ 67
Figure 5. Atlantic Cod 1956-1958................................................................ 68
Figure 6. Atlantic Cod 1959-1960................................................................ 69
Figure 7. Atlantic Cod 1961-1966................................................................ 70
Figure 8. Atlantic Cod 1969-1973................................................................ 71
Figure 9. Atlantic Cod 1978-1979................................................................ 72
Figure 10. Atlantic Cod 1980-1981.............................................................. 73
Figure 11. Atlantic Cod 1984 4X/5Z ........................................................... 74
Figure 12. Atlantic Cod 1985 4X/5Y/5Z ..................................................... 75
Figure 13. Haddock 1953-1956.................................................................... 76
Figure 14. Haddock 1957-1958.................................................................... 77
Figure 15. Haddock 1959-1973.................................................................... 78
Figure 16. Haddock 1978-1983.................................................................... 79
Figure 17. Haddock 1984-1985 4X/5Y/5Z .................................................. 80
Figure 18. Atlantic Halibut 1958-1963 ........................................................ 81
Figure 19. Atlantic Halibut 1964-1965 ........................................................ 82
Figure 20. Atlantic Halibut 1966-1973 ........................................................ 83
Figure 21. Atlantic Halibut 1963-1968 Subarea 3 ....................................... 84
Figure 22. White Hake, Thorny Skate, Winter Skate 1967-1980 ................ 85
Figure 23. Herring 1973-1982 [Scotian Shelf, Bay of Fundy]..................... 86
Figure 24. Herring 1976-1981 [Gulf of St Lawrence, Sydney Bight].......... 87
Figure 25. Atlantic Mackerel 1973-1974 ..................................................... 88
Figure 26. Pollock 1960-1984 4W/4X ......................................................... 89
Figure 27. Pollock 1979-1983 4W/3Pn........................................................ 90
Figure 28. Winter Flounder 1971-1985........................................................ 91
Figure 29. Witch Flounder 1963-1973......................................................... 92
Figure 30. Yellowtail Flounder 1966-1985.................................................. 93
Appendix C. Release Length Data Summaries ............................................................................. 95

ix
Appendix D. Subsampled Length-Frequencies........................................................................... 101
Pollock 1960, 1963, and 1978.................................................................... 102
Pollock 1979............................................................................................... 102
Pollock 1980............................................................................................... 103
Pollock 1981-1984 ..................................................................................... 103
Herring 1973, 1974, and 1976.................................................................... 104
Herring 1977 .............................................................................................. 105
Herring 1978 .............................................................................................. 106
Herring 1979-1981 ..................................................................................... 107
Appendix E. Data Formats .......................................................................................................... 109
1953-73 Groundfish Tagging Data Format ................................................ 110
1978-85 Groundfish Tagging Release Data Format................................... 118
1978-85 Groundfish Tagging Recoveries Data Format ............................. 121
Tagging Database Structure and Format as of January, 2006 .................... 126
Herring Tag/Recovery Data Format ........................................................... 127
Appendix F. Publications ............................................................................................................ 131

x
ABSTRACT
Stobo, W.T. and G.M. Fowler, 2006. Canadian tagging of commercial groundfish and small
pelagic fish in the vicinity of the Scotian Shelf and Gulf of St. Lawrence, 1953-1985. Can. Tech.
Rep. Fish. Aquat. Sci. 2669: xii+ 137 p.
We examined marine finfish tagging studies conducted between 1953 and 1985, during
which over 556,400 groundfish and small pelagic fish, representing 17 species, were tagged by
personnel of the St. Andrews Biological Station and the Bedford Institute of Oceanography. The
geographical area involved in these studies extended from the Gulf of St. Lawrence to the
northeastern portion of the Gulf of Maine. Over 40,800 tags were recovered by the fishing
industry.
This report documents tagging procedures, recovery parameters, and database formats
developed to provide a permanent record of the work, and release length frequency information
on species for which the data were not compatible with the databases. We provide maps
detailing the locations, numbers and dates of release of all the species.
We provide individual species synopses, in which previously published recovery maps
and conclusions on stock movements are updated for a number of tagging studies that were
published using incomplete recovery periods, or have not been previously reported. We also
provide a comprehensive list of publications and reports produced, related to those tagging
studies.

xi
RÉSUMÉ
Stobo, W.T. and G.M. Fowler, 2006. Canadian tagging of commercial groundfish and small
pelagic fish in the vicinity of the Scotian Shelf and Gulf of St. Lawrence, 1953-1985. Can. Tech.
Rep. Fish. Aquat. Sci. 2669: xii+ 137 p.
Nous avons examiné les études de marquage de poissons de mer effectuées entre 1953 et 1985,
au cours desquelles plus de 556 400 poissons de fond et petits poissons pélagiques, représentant
17 espèces, ont été marqués par le personnel de la Station biologique de St. Andrews et de
l’Institut océanographique de Bedford. La zone géographique sur laquelle portaient ces
opérations de marquage allait du golfe du Saint-Laurent au nord-est du golfe du Maine. Plus de
40 800 étiquettes ont été récupérées par l’industrie de la pêche.
Le présent rapport décrit les procédures de marquage, les paramètres de récupération des
étiquettes et les formats de la base de données ayant permis de créer un registre permanent des
travaux, ainsi que les fréquences de longueur lors de la remise à l’eau dans le cas d’espèces pour
lesquelles les données n’étaient pas compatibles avec la base de données. Il contient aussi des
cartes détaillées indiquant les lieux et dates de remise à l’eau des poissons de chaque espèce ainsi
que leur nombre.
Nous présentons ici des synopsis par espèce, comprenant des mises à jour des cartes des lieux de
récupération et conclusions sur les migrations des stocks établies d’après diverses études de
marquage publiées qui comportaient des périodes de récupération incomplètes ou d’études dont il
n’avait pas encore été rendu compte. Nous établissons aussi une liste exhaustive des publications
et rapports concernant ces études de marquage.

xii
1
INTRODUCTION
Mark-recapture studies have been conducted in the Northwest Atlantic since the late 1800s
(Needler, 1930; Templeman, 1963; McFarlane et al, 1990). These early investigations were often
secondary objectives on research vessel cruises and were only concerned with elucidating the
movements of populations or sub-populations in fairly general terms. In the 1950s, researchers
became concerned with the population structure and seasonal movements of commercial fish
stocks, and tagging efforts were intensified. Special-purpose cruises by research vessels and
commercial charters, and inshore fixed gear, were used to apply large numbers of tags to various
demersal and pelagic species of fish.
Prior to the mid-1970’s, most of the tagging on the Scotian Shelf and in the western Gulf of
St. Lawrence was carried out by researchers from the St. Andrews Biological Station. Although
responsibility for conducting tagging studies in these waters subsequently became more dispersed
throughout New Brunswick and Nova Scotia, a centralized tag clearing house was established at the
Biological Station. A single return address was applied to all tags to reduce the chances of post-
recovery data loss, enhance efforts to follow up on missing information, standardize data formatting
and processing, improve quality control, and facilitate electronic data entry and accessibility. This
resulted in a single database of groundfish mark-recapture data for the Scotian Shelf and Gulf of St.
Lawrence areas covering tagging activities conducted from 1953 to 1973.
Separate database structures were designed to deal with the small pelagic tagging studies.
The largest single species tagging effort occurred on herring (Clupea harengus) with over 500,000
tags applied. In 1957-58 a major tagging project on juvenile herring was conducted in the Bay of
Fundy using operculum and dorsal fin clip tags. In 1970-71, a large scale adult herring tagging
study was conducted in the southern Gulf of St. Lawrence and off southern Newfoundland (in
conjunction with the Newfoundland laboratory) using internal magnetic tags. These studies pre-
dated electronic data storage and the data from these studies were never entered into a computer
data storage system. Between 1973 and 1982 additional major herring tagging studies were
conducted throughout the Gulf of St. Lawrence, Scotian Shelf and Bay of Fundy using the external
t-bar tag. The information from these studies was stored in an electronic database. Mackerel
(Scomber scombrus) and large pelagic fish (tuna and shark) tagging studies also pre-dated
electronic data storage; the release and recovery information on mackerel is, however, included in
this report.
When tagging of groundfish species was resumed in 1977 following the extension of
Canadian marine jurisdiction in 1977, the centralized groundfish tagging data processing procedure
was also resumed, but with a revised data format and processing protocol. Thus the groundfish
tagged between 1978 and 1985 were maintained on a different database than those tagged during
the 1953-1973 phase of the program.

2
In 1985, it was decided to merge the historical databases for groundfish and small pelagics
within a common format to facilitate analyses, and provide comprehensive documentation of the
multitude of tagging studies and associated data considerations gathered within this single database
(currently maintained by Population Ecology Division, Bedford Institute of Oceanography,
Department of Fisheries & Oceans, Dartmouth, Nova Scotia, Canada, B2Y 4A2).
It is hoped that this document will serve as a useful guide for researchers interested in such
data. Initial results of many of the 1953-76 tagging studies have been described, but the conclusions
are often incomplete since they are generally based on only the first few years of recoveries. The
incomplete reporting is likely due to the extended time lag between application and virtual
completion of recoveries; for most groundfish this lag can be 5 or more years (Fowler and Stobo,
1991; Stobo et. al. 1988). Recoveries from many of the more recent studies have not yet been
analysed even though recoveries are complete.
It is the purpose of this report to summarize the groundfish and small pelagics tagging
studies conducted between 1953 and 1985 throughout the Gulf of St. Lawrence, Scotian Shelf and
Bay of Fundy (NAFO Divisions 4R,S,T,V,W,X), and those releases made in the northeastern
portion of the Gulf of Maine (NAFO Divisions 5Y,Z and southwestern Newfoundland (NAFO
Divisions 3P,N,O) associated with the Scotia-Fundy region. We concentrate on describing the
available data, with some comments on the completed tag recovery results, as an overview, and
briefly review some of the studies conducted to date.
We have also provided an update on publications derived from these data, expanding, or
revising, the inferences drawn by the authors, based on the additional recoveries made subsequent
to earlier publication. Examinations of the results for species, for which only small numbers were
tagged, were included if it was felt these releases might otherwise not warrant separate
investigations of their own accord.
OVERVIEW
Figure 1 provides a depiction of the geographic areas, often referred to in the text as unit
areas. Development of these areas was an action taken by both Canada and the United States to
provide additional geographical sectioning of the northwestern Atlantic to the areas delineated by
the North Atlantic Fisheries Organization (NAFO). Throughout this report we will use the NAFO
areas and Canadian Fishing unit areas together without reference to origin.
Cod (Gadus morhua) was the prominent groundfish species in both the 1953-73 and 1978-
85 groundfish programs, with lesser but consistent effort directed to haddock (Melannogrammus
aeglefinus) and American plaice (Hippoglossoides platessoides). Pollock (Pollachius virens)
tagging occurred primarily during the 1978-85 period and was directed at juveniles (ages 0-2).
White hake (Urophycis tenuis), yellowtail flounder (Limanda ferruginea), witch flounder
(Glyptocephalus cynoglossus), and Atlantic halibut (Hippoglossus hippoglossus) were tagged in
sufficient numbers for analyses only during the 1953-73 period, and winter flounder

3
(Pseudopleuronectes americanus) only during the 1978-85 period. Herring and mackerel were the
only two small pelagic species tagged during the study period (1953-85).
The majority of the groundfish tagged throughout 1953-73 and 1978-85 were caught by
otter trawl. Handlining and inshore traps were the next most common capture methods; the pollock
tagging work relied almost exclusively on commercial and research inshore traps. Most of the
herring were captured close to shore by purse seine, using either chartered or commercially active
vessels; commercially active weirs and traps were also frequent methods of capture. Mackerel were
trapped, seined, or handlined.
Upon capture, the herring, mackerel and groundfish in the 1978-85 period were usually
tagged with T-bar anchor tags, while groundfish from the 1953-73 period were usually tagged with
Petersen discs. The T-bar anchor tags consisted of lengths of machine labelled, coloured, No. 20
vinyl tubing (8 cm long, and yellow the most common colour), attached to a nylon T-bar of the
same sort used to attach price tags to clothing. The T-bar was inserted into the dorsal musculature
of the fish using a hollow needle, and was applied to fish using a ‘tagging gun’, similar to that used
in the clothing industry, although with stainless steel parts. Prior to the development of these T-bar
tags, the vinyl tube alone, or with a wire inserted the length of the tube, was used as the tag. It was
inserted through the dorsal musculature by means of a hollow needle and the ends of the vinyl, or
wire, were tied together to form a loop; in this form it was called a spaghetti tag, and both are
encountered today in general language and the literature. The T-bar anchor tag is often referred to
as a spaghetti tag, as it uses the same vinyl tube. In this manuscript we distinguish the T-bar anchor
tags from the older tied spaghetti tags, and sometimes elaborate where the T-bar version is termed a
spaghetti tag in the literature. The Petersen disc tags were two 1.8 cm diameter discs of various
compositions and colours (again, yellow was the favoured colour, though sometimes a different
colour was used for each disc). They were typically secured together by passing a stainless steel
wire through the dorsal musculature of the fish by means of a hollow needle, then passing each end
of the wire through a disc, and then twisting the ends of the wire with pliers to hold the discs
against the sides of the fish. In all cases, the tags were uniquely numbered and thus identified
individual fish, as well as containing instructions for returning the tag, with associated recapture
information, to obtain a reward. The labelling was English-only for most of the tagging studies
considered here, but some of the early Gulf of St. Lawrence studies using Petersen disc tags
included examples of French-only and bilingual labelling (by taking advantage of the two disc
surfaces). Details of tagging methodology and data processing protocols for groundfish are
provided by Beanlands and McGlade (1982) for both groundfish tagging periods, and by Stobo et al
(1975) for herring. Parsons and Moores (1973) provide the description of the tagging method used
in the mackerel studies we describe in this paper, which was initially reported by Beckett et. al.
(1974). The various tagging studies have been tabulated (Appendix A) and mapped (Appendix B)
to provide an overview of seasonal and geographic coverage. Numbers recovered are included in
the tables to indicate where analyses might be worthwhile.
Both groundfish databases included fields for fish length (usually fork length) at both
release and recapture. Appendix C provides a summary of the length ranges tagged. The herring
database did not incorporate a field for either release or recapture length. Length frequency
information is available in the database from tagging studies on all adult pollock but 12300 of the
55857 juvenile pollock tagged were not measured. Release length frequency information for tagged

4
but unmeasured juvenile pollock and all the herring tagging activity was obtained from subsamples
of the catch rather than measuring the actual fish being tagged. The pollock length frequencies
presented in Appendix C are the actual subsample counts. Much of the herring tagging activity was
conducted during ongoing commercial purse seine operations, thus only a few hundred herring were
tagged during each of several seine sets during a night of tagging activity; and tagging was
conducted over several nights. The herring length frequencies were weighted by catch and
combined for the length frequency information presented in this report. Mackerel were not
measured. The existence of pollock recovery lengths in the absence of release length data
sometimes caused confusion, such as blank lengths at initial capture being mathematically
misconstrued as zeros. This departure from other groundfish protocols for pollock should be kept
in mind if analyses are conducted on the pollock length data. Appendix D tabulates the subsample
length frequencies for the indicated pollock and herring tagging, as this information is not part of
the tagging database.
Most of the other differences between the tagging databases involve data coding, rather than
substantive changes in procedures. Appendix E details the formats of the databases, and includes
field summaries and background information for clarification. Two aspects of variation in data
processing between tagging programs deserve special mention. Firstly, the 1953-73 groundfish
tagging program did not consider day of the month relevant, such that release and recapture dates
are only accurate to the month. And secondly, the apparent high precision of herring recovery
locations is partially due to the use of a digitization procedure for data entry that created exact co-
ordinates, even though the original data often provided more generalized locations.
Preliminary analyses of data fields commonly associated with data processing, and
sometimes overlooked during mark-recapture analyses, were conducted to identify any factors that
could conceivably bias results. Details of these examinations have been included with the format
descriptions of the original databases in Appendix E. The most relevant observations (pervasive or
critical) are briefly discussed in the Data Quality section. Simple summaries of data fields that
might be of interest to researchers, but are not extensively discussed in this report, have also been
incorporated into the format descriptions for the various databases.
The ‘Tagging Database Structure and Format as of January, 2006’ in Appendix E depicts
the latest version of the finfish mark:recapture database. It represents a redesign of the database
structure to combine historical and current tagging programs for various groundfish and pelagic
species. It includes additional variables and codes beyond those pertaining to the tagging discussed
in this report, but comparison with the preceding older database formats in Appendix E should
clarify features applicable to post-1985 tagging studies. The PROGRAM code in the current
database identifies broad suites of tagging studies, and preserves the specific origins of the data.
The tagging studies presented in this report are contained in PROGRAMs 2 (1978-1985 groundfish
tagging), 3 (1953-1973 groundfish tagging), and 4 (1973-1982 herring tagging). Many of the
species dealt with in this report remained the subjects of tagging studies after 1985, so attention
should be paid to the PROGRAM and/or YEAR of tagging when analyses might be affected by
incomplete recoveries from more recent studies. This may be especially relevant with respect to
cod, haddock, halibut, herring, American plaice, yellowtail flounder, and winter flounder, all of
which have been the targets of post-1985 tagging studies.

5
As a general guideline to assist researchers in planning analytic approaches to the tagging
data, we conducted cursory examinations of geographic and temporal recovery data to address
trends in data volume with varying degrees of data precision, and to assess the impact of elapsed
time since tagging on conclusions drawn from recovery data (e.g. short-term versus long-term post-
release periods). Results of these analyses are presented in the Recovery Parameters section.
Reviews of the status of tagging studies are organized in the Species Synopses, with each
species represented by three subsections – General Description, Updates to Historical Tagging
Studies, and Summary of Unexamined Recoveries.
The General Description subsection provides a comprehensive summary of the tagging
conducted on a species. A search through the historical literature pertaining directly to the tagging
programs described in this paper was conducted in order to flag potentially 'forgotten' releases, to
confirm completeness of the present databases, and to update or amend some of the earlier studies.
Most of the results of the 1953-82 tagging and much of those for the later studies have been
reported (Appendix F). However, many of the reports analyzing the tag recovery data were based
on recoveries made within a year of tagging, to portray fish movements in a timely fashion for stock
assessments. These reports were commonly presented in the form of Research Documents to
bodies deliberating international and national fish conservation measures, typically the International
Commission for the Northwest Atlantic Fisheries (ICNAF) and the Canadian Atlantic Fisheries
Scientific Advisory Committee (CAFSAC). Further, many of these reports appear only as
summaries in ICNAF Annual Proceedings or in Research Station Annual Progress Reports. Since
returns from longer periods at large could conceivably provide a more complete description of fish
movements and migrations, we re-examined the results of the historical releases using the total
recoveries.
In the Updates to Historical Tagging Studies subsection we document any discrepancies
noted between previously published results and those from analyses of the complete recovery data
sets; and, where appropriate, we confirm the conclusions of some past studies that were presented
as being of a speculative nature at the time. We do not attempt a comprehensive review of the
research to date (Appendix A outlines the associations between the various tagging groups and the
historical literature), nor do we comment on discrepancies in earlier work where a subsequent
publication has already resolved the issue. We chose 1992 as a cutoff date for the update exercise,
as more recent publications would have included all recoveries in their analyses.
Tagging data for which we could find no evidence of a report being published, is noted in
the Summary of Unexamined Recoveries subsections. Cases of unexamined tagging data from this
period relate largely to incidental tagging of fish other than the species that a given study targeted.
If there was also no indication of current or pending interest in these species, we conducted basic
spatial/temporal analyses of the recoveries, and any further investigations that seemed warranted, on
a case by case basis.
DATA QUALITY
The tagging data comprise a large number of separate tagging studies conducted over a
great many years, and were subjected to differing degrees of auditing and editing, and some of
6
the original data records no longer exist. This is especially relevant to anyone analysing and
interpreting the information associated with tag recoveries. Typically, bad or suspect data will
not be clearly resolvable. Typographical entry errors, and imprecise or erroneous data collection
procedures, are possible sources of error. Release data were generally subjected to reasonable
levels of quality control since they were collected by scientific staff or under supervision of
scientific staff. Although some errors in release locations have occurred we have corrected many
in the course of this work and thus may no longer be of concern. Release length data likely
contain transcription errors, mostly within the range of plausible values, and thus unlikely to be
suspected unless subsequently paired with impossible recovery lengths. Very extreme release
lengths should be regarded with caution, since we are unable to verify them. Recovery records of
unusually small or large fish could be valid, or the result of transcription errors, or imprecise
measurement by the individual recovering the fish (e.g. estimation of length rather than true
measurement, or lack of documentation of whether the measurement unit was inches or
centimeters). Invalid values for minutes of latitude or longitude (e.g. over 60) for recovery
locations could be simple typographical errors, or failures to recognize decimal degrees for a
returned tag. Another source of recovery location data error, that cannot be easily discerned, is
technically valid coordinates, which are, nevertheless, incorrect. These could occur for a
multitude of reasons – a fish plant worker assuming a fish came from the wrong ship, a
fisherman active in more than one area making a guess where a fish was caught, etc. Some
errors, such as extreme outliers, or recovery locations on or very near land (most often at or near
a fish plant or home address), can be deduced from simple plots. But in many cases we can only
speculate whether an unexpected or uncommon recovery location is valid.
The expectation of tag recovery from any large-scale marine finfish tagging study is usually
low due to a number of factors (e.g. mortality, tag loss, reluctance to submit tags, etc.). In addition,
however, there is a reduction in usable recoveries due to incomplete reporting of the recovery
information, primarily date or location. As a result of the data omission, a significant proportion of
all recovery tags submitted will be of limited use, or unusable, for many investigations. With some
species, such as herring, overall chances of recovery are very low, so many thousands of fish have
to be tagged to clearly determine movement patterns. As well, the mass processing involved in the
herring fishery greatly diminishes the chances of detecting tags relative to the more individually-
handled groundfish species.
Generally, about 60-75% of the recoveries for any major groundfish release will have both
month and Cartesian co-ordinates (latitude and longitude) of recapture; only data with these
attributes are useful in examining seasonal distribution and movements. The remaining recoveries,
however, may still be useful in examining stock range (if geographical coordinates are provided),
tag retention (if recovery date is provided), or growth (if recovery date and length are provided). As
previously noted, some of the coordinates of geographic recovery location in the herring database
(see Table 1) are partly due to the data entry procedure which imposes precision on generalized
recovery locations. We note that a data quality code for the herring database identifies only 7660 of
the 13806 recoveries as 'good'. The remainder break out as 4567 immediate recoveries (any
recaptures within two weeks of tagging), 861 without any location data, 470 with incomplete dates,
and a further 245 designated as ‘suspect’ for undefined reasons. These latter 245 recoveries might
represent returns for which original geographic co-ordinates were not as precise as those derived

7
through digitization, but we suspect that some portion of the ‘good’ data also had precision added
by the digitization procedure.
One of the recovery data attributes least likely to be documented is the method of capture.
But it is often desireable to identify the actual fishery involved in order to properly weigh the
recoveries against catch or to qualify conclusions on distribution against distribution of fishing
effort. Although the data field in the database for gear type frequently indicates ‘unknown’ or
‘other’, we have attempted to ascertain likely recapture gears for species for which the likely fishery
source can readily be identified from our knowledge of the fisheries or other data supplied with the
recovered tag. Angling is the most likely source of ‘other’ recoveries from the 1978-85 groundfish
tagging. Of the 1010 'other' recoveries in the 1978-85 database, 990 have month and Cartesian co-
ordinates of recapture; so high a proportion of returns with such detailed information is only
replicated in the case of angling, for which every recovery (800 tags) has similarly precise data.
Angling is also the best candidate in cases in which groundfish recoveries caught by 'unknown'
gears are associated with known capture depths for both programs. Roughly 75% of groundfish
recoveries have capture depth, yet virtually all recoveries by angling have known depths. It would
be fairly unusual to know the depth of capture without being aware of the method of capture, and
for angled fish, it is easy to apply depths by reference to a pier or other near-shore structure. As
well, during the 1953-73 program, there was no data code for angling, and the code only appears to
have been used for 2 years (1981 and 1982) of the 1978-85 program. Thus the ‘unknown’ capture
method designation in association with known capture depth may be a result of the absence of a
proper code, not knowledge of the gear type. Most of the herring recoveries by undefined gears
come from either Passamaquoddy Bay or Chaleur Bay, areas in which weirs and purse seines,
respectively, are the most common gears used, and thus the most likely 'unknown' capture methods
for these species in these areas.
RECOVERY PARAMETERS
A major consideration when analyzing temporal aspects of tag returns for any species is a
roughly exponential decline in rates of recovery over time (Table 2). Discerning migration or
dispersion patterns for groups of fish that take more than 2-3 years for the pattern to fully develop
would require the initial application of a few thousand tags. Early studies, like those conducted
during the 1953-73 period, rarely exceeded a thousand tags. Compounding this decrease in
recovery information over time is the generally high probability of tagged fish being recaptured
very soon after release in the same vicinity, providing information of limited value in studies
concerned with seasonal migrations or stock boundaries. Usually 10-25% of the total tags
recovered from a given groundfish release group, and 66% of a given herring release group will be
recaptured within three months of being tagged, and in the area of release. We refer to such
recoveries as ‘immediate recoveries’, since they generally only provide information on local
movements. Exceptions would occur tagging in the absence of fishing activity, or just prior to
initiation of migratory activity by the fish being tagged. Herring tend to be highly mobile, so two
weeks is commonly used as the time duration for defining an immediate recovery for this species.
Using a 2-week ‘immediate recovery’ period for herring, as opposed to the 3-months commonly

8
used for groundfish, would reduce the immediate recapture segment of the herring data from 66%
to 33%. In practice, the only way to determine if short-term recoveries for any tagging study
provide useful information is to examine them separately from the rest of the recoveries.
Longer-term comparisons within a fish stock, such as between a release in the 1950's and
another in the 1980's, must consider historical changes in both the fisheries and the tagging
programs before interpreting results. Cod, haddock, pollock and plaice were tagged in significant
numbers during both the 1953-73 and 1978-85 groundfish programs. Consistently higher
recoveries were obtained for the earlier program, which could lead to faulty conclusions without
considering several factors related to the tagging that differed between programs. The influences of
these disparate conditions of initial capture and release on subsequent recoveries were examined
previously (Fowler and Stobo, 1999), so we restrict ourselves in this report to discussing those
differences between the two programs that may not be apparent from scrutiny of the transcribed
data itself.
The greatest difference between the two programs, best reflected by cod and plaice
recoveries, was the deliberate avoidance of tagging activity in the presence of an active fishery
during 1978-85. The immediate recaptures (i.e. within 3 months of release) are substantially higher
for 1953-73 studies (23% of all cod and 27% of all plaice returns) compared with 1978-85 studies
(13% of cod and 14% of plaice returns). The net result is that the actual proportions of 'usable'
recoveries of cod and plaice for the two programs are much closer than their total recoveries might
indicate. A more specific difference between pollock tagging projects was the emphasis on tagging
juveniles in their inshore nursery areas during the 1978-85 studies. The earlier (1960) study on
pollock predominantly targeted offshore adults. Low returns from the 1978-85 pollock releases
relative to the 1960 release of adult pollock could partially reflect the lesser recruitment of the
pollock to fisheries throughout their juvenile phase, during which time natural mortality would take
its toll. As the individual juvenile pollock tagged were often not measured (see Overview) the
contrast in maturity stage between these and other fish (of any species) is not always evident in the
data itself. Although pollock tagged as juveniles provided fewer recoveries than pollock tagged as
adults, immediate recaptures of the juvenile pollock were quite high (see Table 2) for a groundfish,
and subsequent recoveries did not exhibit as great a degree of decline in recovery rates over time as
groundfish tagged as adults. The higher immediate recaptures are probably due to the initial
availability of juveniles to inshore fisheries (i.e. angling off the pier for harbour pollock), and by
virtue of their schooling habit, to weirs, followed by a period of reduced availability to fishing gear
when the young pollock are offshore but smaller than commercially sought. Subsequent
recruitment to the adult fishery accounts for the lesser decline observed in recovery rates with time.
Proportionately more fish may thus remain available a few years after tagging if released as
juveniles rather than as adults.
Evolution in the fisheries themselves over the years can also impose differences in recovery
rates that may be misconstrued as due to some other factor, or simply attributed to sampling
variance (thus inflating the error component of contrasts). While draggers (otter trawlers)
predominated the 1953-85 groundfish fisheries, longlining, handlining and gillnetting were
consistently important. But use of the Danish seine was considerably greater, and that of hook-and-
line gears drastically less, in commercial fisheries during the 1978-85 period compared to the 1953-
73 period. Most of the hook-and-line recoveries (460 out of 540 total) were made during 1954-56.

9
Since that time hook-and-line fishing has been virtually eliminated. While the most obvious
changes in favoured gear types over time may still serve as a crude index of long-term changes in
the fishery, these changes may be less important than innovations within a gear type. In parallel
with these changes in the fisheries, and of greater concern to tagging studies, has been evolution in
the ways that fish are handled after they are caught. Groundfish recoveries from the 1953-73
program were usually made by fishermen themselves, whereas recoveries from the 1978-85
program were as likely to have been made by a plant worker as a fisherman. This may reflect
increasing automation in the fishing industry over the years, such that tags became less likely to be
observed by fishermen as on-board processing technology changed. If similar development is
assumed for shore-based processing technology, and so long as human observation is necessary to
affect discovery, we have the implication of continuously declining likelihoods of recovery of tags
over time. The potential impact on tagging studies is perhaps best demonstrated by herring, where
the low overall recovery rate of 4% may be a consequence of automated processing employed for
the majority of the catch during those recovery periods (capture by purse seine; processed as fish
meal).
In earlier periods of fisheries activity, a population of fish might disappear from the
recovery record for certain months because the fishery was either not directing towards that species,
or was unaware of their location. More recently, fisheries management plans often exclude effort
from the fishing grounds for certain months when the fish are present as a conservation measure.
Change in the application of fishery management practices may also affect the apparent results of
tagging studies in more subtle ways. The best example concerns monthly trends in recovery rates.
Comparing the total (all species combined) 1953-73 groundfish program recoveries to the 1978-85
groundfish program recoveries for like months (Figure 2), we observed that returns generally
peaked around August for the earlier program and around June for the later program. This shift in
the monthly probability of recapture between programs may reflect the initiation of Total Allowable
Catches (TACs) in the 1970s, motivating fishermen to concentrate their effort on particular species
earlier in the year to obtain as much of the higher economic value fish as possible before fisheries
could be closed due to quota limits (the ‘race for the fish’). We use this example to draw attention
to the biasing influence that fishing effort could have if quantitatively examining recovery data for
seasonal trends.
With herring, the low recoveries in the Gulf of St. Lawrence and Sydney Bight during
February through April correspond to the period of greatest icing over of fishing grounds or
inclement sea state conditions in several areas; the drop-off in returns thus may reflect the species'
unavailability to the fishery due to seasonal environmental events. In the Bay of Fundy, the herring
fishery is prosecuted by gears types which target different phases and seasonal occurrences of
herring. Weirs are immobile, restricted to along-the-shore locations, primarily target juvenile
herring, and usually operate only from May to October. Gillnets primarily target spawning fish on
the spawning grounds so their use is largely limited, both to the late summer-early fall and
geographically restricted to the spawning grounds. Purse seines are highly mobile and the boats can
follow concentrations of fish through all phases of their life cycle, inclusive of migrations. Thus
most recoveries of herring between December and April are made by purse seiners. When
examining returns from the perspective of seasonality the extent and duration of ice cover during
specific years, and the other factors, would have to be assessed. As well, the anomalous drop in

10
recovery rates for December (total 550 returns) relative to November (total 1223 returns) and
January (total 2203 returns) represents non-fishing over Christmas, rather than any intrinsic aspect
of fish behaviour.
SPECIES SYNOPSES
Atlantic wolffish (Anarhichas lupus), often referred to as catfish
General Description
A total of 113 wolffish were tagged, all off southwest Nova Scotia (areas 4Xq,r) in May-
June 1963 with spaghetti tags (Appendix B Figure 3). (As opposed to the more recent T-bar anchor
tag, often called a spaghetti tag, the tag used in this study was the original spaghetti tag, a thin vinyl
tube inserted through the flesh adjacent to the dorsal fin and the ends tied together to form a loop.)
The majority of fish were between 88 and 97 cm in length (range: 76-109 cm).
Updates to Historical Tagging Studies
We could not find any published information on wolffish tagging results for the Scotian
Shelf area. Thus, no updates were possible.
Summary of Unexamined Recoveries
There were 13 recoveries from the release of 113 wolffish near Yarmouth, N.S. in May-
June 1963 (Figure 3). The recovery rate was 0.115 (Table 1), 7 being recovered within three
months of release and all 13 within 4 years. Since all of the recoveries occurred near the release
locations, perhaps it was not considered worth a formal report at the time; the species was of little
commercial interest in the 1960s.
Cod (Gadus morhua)
General Description
Cod has been the most consistently tagged species in NAFO Subarea 4 during the 1953-85
period (Appendix B Figures 4-12), with tagging activity occurring in 21 of the 33 years (Appendix
A). During the 1978-85 period, tagging activity occurred in 6 of the 8 years. Tagging in NAFO
Subarea 5 occurred only in the eastern portion (areas 5Zj and 5Yb), and only during 1984-85. Of
the almost 81,000 tags applied throughout Subareas 4 and 5, 67% were applied during the 1978-85
period (Table 1). During the 1953 to 1973 period, a combination of tags were used, but Petersen
discs were the most prevalent. During the 1978-85 period, T-bar anchor tags were used almost
exclusively; a major exception was 1001 Petersen disc tags applied in April 1979 in area 4Vc.

11
In area 4X, the 1953-73 releases were mainly in the inshore areas of southwestern Nova
Scotia (area 4Xo, 1816 fish) and the Bay of Fundy (area 4Xr, 57 fish; area 4Xs, 1050 fish) during
the April to October period (Appendix B Figures 4, 7, 8). Only 107 fish were tagged offshore
(areas 4Xn,p), in the vicinity of Brown's Bank (Appendix B Figure 8). Between 1979 and 1985,
over 13,600 cod were tagged in area 4X (Appendix B Figures 9-12). Most of these fish were
tagged offshore (area 4Xp, 10787 fish) during February and March, 1984-85 in an attempt to target
spawning components (Appendix B Figures 11, 12).
In area 5Zj, over 3,000 cod were tagged on the eastern edge of Georges Bank during
February and March, 1984-85, (Appendix B Figures 11, 12). An additional 350 were tagged
offshore, in area 5Yb, near the entrance to the Bay of Fundy (Appendix B Figure 12) in July, 1985.
Generally, very few cod under 30 cm were tagged; the majority of fish tagged were between
40-70 cm in all releases and areas. The absence of small fish is more a result of selective fishing
than population structure, since areas known or found to contain small fish were avoided. As a
result, a skew to larger sizes occurs in the frequency distributions; this was most apparent in the
1984 and 1985 releases near Brown's Bank (4Xp) where a substantial proportion of cod tagged
were greater than 70 cm (see Appendix C).
The overall recovery rate for the 1953-73 releases was substantially higher (0.279 vs 0.161)
than that obtained from the 1978-85 releases (Table 1). In both periods, however, the proportion
recovered per year was similar (Table 2), with 60% of the total recoveries being recovered within
one year of release and over 95% within four years.
Updates to Historical Tagging Studies
[Publications List references: 2, 3, 5, 6, 7, 8, 9, 10, 13, 14, 15, 16, 17, 19, 21, 22, 24, 25, 27, 28, 29,
30, 31, 32, 33, 34, 35, 37, 38, 39, 41, 45, 47, 48, 52, 53, 57, 67]
Kohler (1975) analysed cod tagging results from the Sydney Bight area and suggested a
single stock occupied both 4Vn and 4T, but presented only a gross recoveries plot without any
temporal breakdown. Since it is well known that Sydney Bight is an overwintering area for cod,
this was doubtless an oversight. An analysis of the complete dataset indicated that the cod tagged
in Sydney Bight overwintered there from January to March, entered the Gulf of St. Lawrence in
April, then dispersed throughout the Gulf for the rest of the year.
More problematic than relevant today, an early paper on cod and haddock mortalities
(Paloheimo, 1958) used tag return data to derive natural and fishing mortality estimates. Mortality
rates were computed separately for each of three tag types applied in 1953, using recoveries through
1957. Unfortunately, the numbers for the Lea hydrostatic and Petersen disc tags for the cod
recoveries in this study, were reversed. Beyond some comments comparing results between the two
tags that would be reversed, the error did not alter the conclusion, as the estimated natural mortality
for cod was considered too dubious in any case.
Lastly, in a paper comparing recovery rates between tag types (Fowler & Stobo, 1991), the
symbols identifying Petersen disc and T-bar anchor tags (referred to as spaghetti tags in that paper)
are reversed in the graphs displaying recovery rates by year. Petersen discs are really depicted by
the white symbols and spaghetti tags by the black symbols.

12
Summary of Unexamined Recoveries
A case of apparently unexamined data relates to cod tagged in the Gulf of St. Lawrence in
1961 and 1964. In September-October, 1961 and in May, 1964, cod were tagged off Seven Islands
(NAFO area 4Sz), Quebec and in the vicinity of Chaleur Bay (NAFO area 4Tk), New Brunswick,
giving the appearance of deliberately paired tagging studies from each side of the Laurentian
Channel. The mark:recapture data for these four release events exists in our database. However, in
Lettaconnoux (1965) there is also some reference to a tagging event off Seven Islands in September
of 1964. We have been unable to find any release or recovery data related to that release event.
There are several reports and publications which describe the results of the Gulf tagging in
this area; but discrete reference to the actual tagging event is often not given and the associated
information not helpful in determining which event is being reported. In a 1963 report, Jean
described the results of the 1961 Seven Islands tagging, but made no reference to the Chaleur Bay
releases made in the same year. Lettaconnoux (1963) provided a brief summary of tagging results
for this area of the Gulf, but the report does not identify the tagging events involved, although that
report would have to apply to pre-1964 tagging events. There are data in the database for the May,
1964, tagging events off Seven Islands and Chaleur Bay, but we were unable to find any mention of
the results of these tagging events in the literature. The only mention of any discrete 1964 Gulf of
St. Lawrence tagging we could find, (Lettaconnoux, 1965) refers to 2700 4S cod tagged in
September of 1964, the tagging event for which we could find no data.
Somewhat confusingly, we have suggestions from the ICNAF Annual Proceedings for 1962
(Lettaconnoux, 1963) and in Jean (1964) that tagging results indicated that 4S and 4T stocks might
not be independent. We cannot determine exactly which of the September-October 1961, May
1964, and September 1964 tagging studies were considered by Jean (1964), but the ICNAF
Proceedings could only have relied on the May 1961 tagging, assuming no other studies of which
we are unaware. Results of our update analyses (Figure 4a) indicate that the September and
October 1961 and May 1964 Gulf of St. Lawrence tagging studies support the interpretation of Jean
(1963). The total recoveries indicate that the cod tagged in the two NAFO Divisions exhibited
overlap in their ranges for most of a year, but centres of concentration were sufficiently separate
that two biological stocks were clearly evident. To clarify the situation we summarized the
movements of these cod based solely on recoveries made subsequent to the calendar year in which
they were tagged (i.e. excluded recoveries made between Oct-Dec, 1961, and May-Dec, 1964).
Thus the suggestion that 4S and 4T stocks might not be independent seems a bit misleading.
Possibly it only alludes to their overlapping distributions without intending to imply a stronger
relationship.
Given the confusion over the identity of the data being considered by Jean (1964) and
interpretations of ICNAF (Lettaconnoux,1963), we focused our update analyses on the tagging
results reported by Jean (1963), with which we had consistent results and could confirm we had all
the data previously analyzed. With the May 1964 tagging in 4Sz and 4Tk not available in time for
Jean (1963), and about twice the recoveries from the 1961 tagging as Jean (1963) due to continuing
tag returns after publication of results, we could break out individual months where desired,
whereas Jean (1963) was limited to a more generalized seasonal (winter, summer, autumn)
13
breakdown of recoveries. The 4S fish favoured their area of release from about July through
December (Figure 4a), with recoveries on the decline throughout that period. There was extensive
movement into the Chaleur region during this period. In January recoveries were made in the
southeastern portion of the Gulf of St. Lawrence, with increasing numbers from February through
April. The recovery locations were highly concentrated along the west coast of Newfoundland
from 3Pn to 4Rc. There were only a few recoveries from the Sydney Bight area. During the May-
June period these fish appear to have returned to the Chaleur-4S areas, with recoveries in the
Chaleur area slightly predominant. Not apparent to Jean (1963) due to the lesser amount of data
available, we think recoveries in the northeastern Gulf suggest that movement through 4S to 4R
may have been more common than through 4T.
Tag recoveries from cod tagged in the vicinity of the Bay of Chaleur (4Tn, and 4Tk just
outside 4Tn) suggest the fish were concentrated in the Chaleur area from roughly May through
November, with few recoveries occurring in November and none in December (Figure 4b).
Recoveries next appeared in the Sydney Bight area (4Vn), with a few returns in January, but in
greater numbers during February and March. During this period some recoveries were also made in
the Cape Ray area (Newfoundland side of the Laurentian Channel). In April, recoveries declined,
but those recoveries made, were concentrated in the Sydney Bight area. By May most of the
recoveries were being made either from Chaleur Bay or the 'Lip', an area in 4Tf where cod tend to
emerge from the greater depths of the Laurentian Channel to enter the southern Gulf of St.
Lawrence shallows. May and June were months of the greatest dispersion in recoveries as the cod
departed the southeastern entrance to the Gulf and returned to the Chaleur area across 4Tf.
In overview, both 4S and 4T-tagged fish underwent winter migrations out of the Gulf.
During the winter sojourn at the southeastern entrance to the Gulf of St. Lawrence, the 4S cod were
rarely recovered from the Sydney Bight fishery, most remaining on the Newfoundland side of the
Laurentian Channel, while 4T cod were similarly pre-disposed to remain on the Nova Scotian side
of the Channel. Both the 4S and 4T fish returned to the Gulf in the spring. The two groups
appeared to mix in the summer-fall when the 4S cod ranged freely into the Chaleur area of 4T.
Little reciprocal movement of the Chaleur-tagged cod into 4S was evident.
Four cod tagging events conducted between 1979 and 1981 have yet to be reported in the
literature. They comprise: winter tagging in 4Wk in 1979; winter tagging in 4Wk in 1980; fall
tagging in 4Wh,f in 1981; and fall tagging in Sydney Bight (4Vn) in 1980.
Cunner (Tautogolabrus adspersus)
General Description
Forty-seven cunner were tagged with T-bar anchor tags in July, 1980, in St. Margarets Bay
in area 4Xm (Appendix B Figure 3). They were caught by research vessel otter trawl.
Updates to Historical Tagging Studies
We could not find any published information on cunner tagging results for the Scotian Shelf area.
Thus, no updates were possible.

14
Summary of Unexamined Recoveries
The 47 cunner tagged in St. Margarets Bay in July of 1980 produced only three recoveries, all in the
vicinity of the tagging location, approximately one week after release (Figure 5).
Haddock (Melannogrammus aeglefinus)
General Description
A total of 43,999 haddock were tagged between 1953 and 1985, the majority in the 1978-85
period (36,373 vs 7626 fish; Table 1). Petersen disc tags were most commonly used in the earlier
years (1953-73) and T-bar anchor tags in later years (1978-85). In the Gulf of St. Lawrence tagging
was limited to September-October, 1956, during which 999 fish were tagged (Appendix B Figure
13). On the Scotian Shelf, haddock tagging was concentrated in the southwest (4WX) between
1953 and 1986 (Appendix B Figures 13-17). Tagging on the central part of the Shelf (4W) was
largely restricted to 1959 when 1,297 fish were tagged (Appendix B Figure 15). In the Bay of
Fundy (areas 4Xr,s and 5Yb), haddock tagging occurred throughout the 1957-85 period, with
releases in the years 1957, 1963, 1966, 1973, 1982 and 1985 of 818, 661, 319, 242, 2893 and 483
tagged fish respectively (Appendix B Figures 14-17). Off southern Nova Scotia (areas 4Xn,o,p) the
largest releases occurred with 581, 1392, 251, 900, 3547, 10952 and 11993 fish tagged in 1953,
1957, 1969, 1971, 1983, 1984 and 1985 respectively. Releases on the eastern edge of Georges
Bank (unit areas 5Zj,m; Appendix B Figure 17) occurred in 1984 (3189 fish) and 1985 (2944 fish).
The length range of haddock tagged was 10 - 93 cm; a single fish was documented as146
cm, but that may have been an entry error. The majority of fish tagged in the Gulf of St. Lawrence
in 1956 ranged from 44-56 cm, similar to those tagged on the Scotian Shelf during the 1950's and
1960's. Generally fish tagged on the eastern Scotian Shelf (4W) and in the Bay of Fundy (unit areas
4Xr,s) tended to have relatively more small fish than those tagged on the southwestern part of the
Shelf (unit areas 4Xn,o,p). This tendency was also apparent in the 1970's and 1980's releases. In a
small release in February 1980, off Halifax, few fish were greater than 30 cm, and in a much larger
release (2893 fish) in June, 1982, in St. Mary's Bay (area 4Xr) few fish were more than 40 cm.
Haddock tagged in 1984 and 1985 on the northeast part of Georges Bank (areas 5Zj,m) tended to be
slightly larger than southwestern Scotian Shelf fish (modal length of 60 vs 55 cm) tagged during the
same period.
Recovery rates (Table 1) were much higher during the 1953-73 period than the 1978-85
period (0.124 vs 0.030). In fact, for the 1978-85 period, recoveries from the individual releases
were heavily skewed to even lower recovery rates with 19 out of 23 releases having less than 3%
recoveries; the higher overall rate was largely due to the recovery rate of 14.4% associated with the
1982 St. Mary's Bay release (Appendix A). The timing of recoveries however was similar between
the two release periods; in both cases, over 50% of the recoveries were made within one year of
release and over 90% within 3 years (Table 2).

15
Updates to Historical Tagging Studies
[Publications List references: 8, 11, 26, 27, 31, 32, 36, 37, 42, 43, 44, 46, 52]
None.
Summary of Unexamined Recoveries
During the process of verifying if tag recoveries had been analyzed in the past and reported
in ICNAF Annual Proceedings ( Martin, 1960; Martin, 1961; Beverton and Hodder, 1962;
Lettaconnoux, 1963; Lettaconnoux, 1965; Hart, 1966; McCracken, 1973) , we came to suspect
that some of the apparently unexamined haddock data may have actually been assessed, but results
not published if they only served to substantiate conclusions drawn from previous tagging studies.
There may also be some ambiguity concerning the identification of tagging studies in some of these
reports. Probably all the haddock recoveries from apparently unexamined 1959-73 releases were
considered by ICNAF during assessments without being well documented, as they replicate the
observations noted for a March 1960 release, recoveries for which were discussed in the ICNAF
Annual Proceedings for that year (Martin, 1961). For instance, we expect the March 1959 tagging
would have contributed to the 1960 review of haddock movements, yet only the March 1960
tagging is explicitly mentioned. Although the analysis provided in 1960 was extremely cursory and
preliminary, the authors observation of lack of movement of haddock from their release locations
on the Scotian Shelf is substantiated across the various 1959-73 data sets (Figure 6). This lack of
movement also applies to Bay of Fundy releases (‘Scotian Shelf’ may have been used in its context
of a management unit, inclusive of the Bay of Fundy).
Results from tagging during the 1978-85 period have yet to be published.
Atlantic Halibut (Hippoglossus hippoglossus)
General Description
Halibut tagging was conducted on the Scotian Shelf (4VWX) and southern Grand Banks
(3Ps,3NO) during the 1958-73 period. In total, 1296 halibut were tagged (Table 1). The largest
single release was on Banquereau (area 4Vs; 704 fish) in March, 1963, just east of Sable Island
(Appendix B Figure 18). The next largest- release (149 fish) was at the same location in February,
1964 (Appendix B Figure 19). The remainder of the releases on the Scotian Shelf (198 fish) were
relatively small (Appendix B Figures 18-20) and spread across the Shelf. Almost all the halibut
tagged off Newfoundland were initially captured near the edge of the continental shelf (Appendix B
Figure 21). The largest single release was 81 fish in February 1963 south of the Avalon Peninsula.
The remainder (164 fish) of the releases were again relatively small and dispersed along the Shelf
edge from St. Pierre and Miquelon Islands to the tail of the Grand Banks. Petersen disc tags were
used exclusively.
The lengths of the fish tagged ranged from 25-196 cm. Generally however, few halibut
were more than 130 cm, and the majority from the Scotian Shelf were less than 70 cm while the

16
majority from off Newfoundland were greater than 70 cm. The overall recovery rate (Table 1) was
high (0.224) with recoveries spread over several years. Within 2 years of release, less than 55% of
total recoveries had been made and slightly more than 80% within 4 years (Table 2). One fish was
recaptured after 18 years at large (Stobo et al. 1988).
Updates to Historical Tagging Studies
[Publications List references: 18, 69]
None.
Summary of Unexamined Recoveries
None.
Herring (Clupea harengus)
General Description
Between 1973 and 1982 over 341,000 more herring were tagged (Table 1) throughout
NAFO Subarea 4 with T-bar anchor tags (Appendix B Figures 23, 24). The fish were caught by
purse seines, weirs and traps. Over 66,000 fish were tagged in the Passamaquoddy Bay - Grand
Manan region (area 4Xs) of the Bay of Fundy between 1973 and 1981, most during the June-
December period. On the Nova Scotia side of the Bay, almost 117,000 herring were tagged, all
between 1974 and 1979 during the months of June to September; the tagging sites extended from
Minas Basin to south of Yarmouth (areas 4Xr,q). Almost 55,000 herring were tagged along the
south shore of Nova Scotia between Chedabucto Bay and Cape Sable Island (areas 4Wd,k and
4Xm,o) during March to August in the 1976-82 period. During the 1976 to 1979 winter fishery
seasons (October-March) along the coast of Cape Breton, over 31,000 herring were tagged in the
vicinity of Chedabucto Bay (area 4Wd). In the Sydney Bight region (area 4Vn) over 18,000 herring
were also tagged during the winter fishery seasons of l977 through 1980 (Appendix B Figure 24).
An additional 2975 fish were tagged in April-May 1981 at the entrance to Bras d'Or Lakes in
Sydney Bight to examine local stock movements.
In the Gulf of St. Lawrence, over 56,000 herring were tagged between 1976 and 1981
(Appendix B Figure 24). At the Magdalen Islands (area 4Tf) 9849 fish were tagged during the
1976 spring spawning fishery and in August-September of the same year 27,972 fish were tagged
off the Gaspé Bay - Chaleur Bay region (areas 4Tm,n) during the fall spawning fishery. An
additional 18298 herring were tagged at Souris, PEI (unit area 4Tg) in October of 1978 and 1981 to
address herring movements associated with that localized fishery.
The herring were not measured individually when tagged, rather random samples of about 100 fish
per release group were taken from the capture gear and measured. The lengths ranged from 10-42
cm with the smallest fish being caught by the traditional "sardine" fisheries in the Bay of Fundy
(areas 4Xr,s) and off southwestern Nova Scotia (area 4Xo). Both inshore fixed gear (weirs and

17
traps) and more offshore gillnet and purse seine fisheries occur in these areas however, resulting in
an extended length range (10-36 cm) of both juveniles and adults being routinely caught. Generally
few herring under 18 cm were caught, or tagged, in other areas. The recovery rate for herring was
0.041 (Table 1), comparable to that obtained in the earlier studies. Over 65% of the recoveries were
made within 3 months of release (Table 2), over 90% were made within 1 year and over 97%
within 2 years, a shorter time frame than that observed for most groundfish species.
Updates to Historical Tagging Studies
[Publications List references: 58, 59, 61, 63, 64, 65, 66, 68, 70, 71, 72]
A Research Document on herring tagged in the Bay of Fundy (Stobo et al, 1975) merits
attention, not for any problems with their conclusions, but rather to clarify the extreme variability in
results that disturbed the authors at the time. Observing substantial differences in recovery rates
between tagging experiments, ranging from 0.3% to 13.7% across 16 release groups, they
unsuccessfully sought an explanation by examining the relationship between recovery rate and fish
length. In fact most of the variation between groups was attributable to the combined effects of two
factors, neither of which involved fish length. On the one hand, the authors used a data filter prior
to analysis to remove immediate recaptures that provided no relevant information on fish
movements. By convention, two weeks was used as a breakpoint to remove recoveries made
shortly after release and before a suitable period for herring to disperse. Unfortunately the two
week exclusion may have been too arbitrary, especially for Mill Cove, Campobello Island releases.
Local recoveries were still being made at very high rates beyond the two weeks. Even one more
week of exclusion would have fully halved the recovery rates for these releases. Coupled with this
difference in the actual duration of ‘immediate’ recoveries between groups was a problem with
non-representation of recoveries from the four August, 1974 releases. These latter fish were tagged
just after the fishery was closed, and recoveries were tallied only to mid-April of 1975 (just in time
for the stock assessment meetings), which was prior to the June start-up of the purse seine fishery.
Had just a few more months passed before counting returns, the total recoveries available for
analysis from these four groups would have been 2-3 times those presented. Overall, increasing the
immediate recovery period by one week and incorporating recoveries made after April of 1975
removes most of the variability in recovery rates between experiments, although the first two
taggings of the study remain anomalously both the lowest (at 0.3%) and highest (at 8.5%). They
were also the smallest release groups in the study. If all current recoveries had been available, the
immediate recapture period adjusted to three weeks, and the two first and smallest tagging
experiments of the study disregarded, the range in recovery rates would have been 0.9% to 4.1%,
which seems reasonable variation for this sort of data.
Summary of Unexamined Recoveries
None.

18
Mackerel (Scomber scombrus)
General Description
Between October, 1973 and October, 1974 over 12,600 mackerel were tagged (Table 1)
using T-bar anchor tags. The Gulf of St. Lawrence releases (2622 fish) were hand- lined from
small boats near the north side of Prince Edward Island (areas 4Tg,j), while the Scotian Shelf
releases (3421 in area 4Vn, 6448 in area 4Xm and 173 in area 4Xs) were caught in commercial fish
traps and weirs(Appendix B Figure 25). No length frequencies were taken, but the tagging protocol
required that all fish tagged had to be at least 23cm in length.
The recovery rate was 0.014 with almost 95% of the recoveries being made within 1 year of
release (Table 2), and all being made within 2 years.
Updates to Historical Tagging Studies
[Publications List references: 1, 62]
A research document (Stobo, 1976) on 1973-74 mackerel tagging off Halifax, N.S.,
northern Cape Breton, and Prince Edward Island, itself an update of Beckett et al (1974), noted that
fisheries throughout NAFO Subareas 3-6 exploited the same fish to some degree at different times
of the year, but the author did not consider the data at that time to be sufficient to indicate the extent
of intermixing between northern and southern contingents of the stock.
A further 14 tags for the November-April recovery months were subsequently turned in,
virtually all from the general vicinity of Cape Cod. Overwintering off New England is consistent
for all tagged groups regardless of release location, and the wide dispersion of recoveries during the
remaining months of the year gives no suggestion that the various releases are discrete from one
another (Figure 7).
Summary of Unexamined Recoveries
None.
American Plaice (Hippoglossoides platessoides)
General Description
A total of 9512 plaice were tagged between 1953 and 1985 (Appendix B Figures 1,2), the
majority in the 1978-85 period (6855 vs 2657; Table 1). Tagging was concentrated in the southern
Gulf of St Lawrence (areas 4Tf,g,k,i,m,n) with 2185 and 5743 tags applied there in the 1958-63 and
1979-80 periods respectively. On the Scotian Shelf (including the Bay of Fundy) only 1584 tags
have been applied, primarily in 3 localized areas and times: 200 in Passamaquoddy Bay in 1966
(area 4Xs), 236 off southern Nova Scotia in 1972 (area 4Xo) and 1065 off Halifax in l98O (area
4Xm). Petersen disc tags were used for most of the 1958-73 releases. In the 1979-84 releases, T-
bar anchor tags were used exclusively on the Scotian Shelf, while in the Gulf of St. Lawrence a

19
combination of T-bar anchor tags (997) and Petersen discs (1078) were used, the Petersen discs
being applied as part of an experiment to compare the retention of tag types on the fish.
Generally a wide size range of fish were tagged in all releases (between 10 – 69 cm with a
single fish at 86 cm), the majority being between 23-55 cm. The recovery rate was much higher for
the early than later period releases (0.354 vs 0.066; Table 1) and for both periods approximately
50% of the total recoveries occurred within 1 year of release; over 90% of total recoveries had
occurred within 4 years (Table 2).
Updates to Historical Tagging Studies
[Publications List references: 7, 8, 23, 25, 26, 54, 55]
In a paper comparing recovery rates between tag types (Fowler and Stobo, 1991), the
symbols identifying Petersen disc and T-bar anchor tags (referred to as spaghetti tags in the paper)
were reversed in the graphs displaying recovery rates by year (Figure 2 of Fowler and Stobo, 1991).
Petersen discs are really depicted by the white symbols and spaghetti tags by the black symbols.
And within the text, in noting no significant difference between tags for plaice, the two tags were
again switched - the spaghetti tag actually gave a marginally higher recovery rate than the Petersen
disc.
Summary of Unexamined Recoveries
No results from post-1963 tagging have been published.
Pollock (Pollachius virens)
General Description
A total of 56,874 pollock were tagged between 1953 and 1985 (Appendix B Figures 25,
26), most in the period 1978-85 (55,865 of them; Table 1). Most of the 1008 fish tagged in the
earlier period were caught in July, 1960, near the entrance to Passamaquoddy Bay (area 4Xs) and
tagged with Petersen disc tags (Appendix B Figure 26). In the later period, tagging was conducted
every year from 1978 to 1984. T-bar anchor tags were used exclusively, and almost all were
obtained from inshore traps or handlining. Offshore tagging was attempted in 1978 using a bottom
trawl, but was unsuccessful. Although the offshore tows were of short duration (averaging 10
minutes per tow), and substantial numbers of pollock were caught, almost all were moribund by the
time they were removed from the trawl. Since the species did not appear to be capable of surviving
the trawl-based tagging procedures, subsequent tagging efforts were concentrated on shallow
inshore areas. The most consistent tagging effort was conducted in the Chedabucto Bay region
(area 4Wd), where between 2728 and 5131 fish were tagged during May- June every year between
1979 and 1983. An additional 991 and 2942 fish, respectively, were tagged just outside
Chedabucto Bay in 1978 and 1979 (Appendix B Figure 27). In the Passamaquoddy Bay region

20
(area 4Xs), fish were tagged every year from 1980 to 1984 although the dates and locations changed
somewhat between years; the numbers tagged ranged from 800 to 3999. Most of the remaining
pollock were tagged along the shore of south and southwest Nova Scotia (areas 4Wk, and 4Xm,o,r)
between 1978 and 1981. A single release (312 fish) was made off southwestern Newfoundland
(area 3Pn) in August, 1982 (Appendix B Figure 27).
Pollock tagged in the 1960's were relatively large fish, ranging from 52 to 88 cm in length.
In contrast, the inshore, or 'harbour pollock' tagged during the 1978-84 period were almost all under
45 cm in length. Clay et al. (1989) suggested that pollock grow to a length of 17 cm during the first
year of life and to 30 cm during their second year. That would suggest that most fish tagged in
4Wd and 4Xs were l-year old fish while most of those tagged around southwest Nova Scotia were a
mixture of 0-group and l-year olds. Clay et al. (1989) also provide the length ranges of each of the
juvenile tagging release groups; those length ranges include both the database and subsample length
frequency data presented in this report.
The recovery rate of the 1960's releases was double that of the 1978-84 period (0.216 vs
0.101; Table 1). For both periods, over 90% of total recoveries occurred within 4 years (Table 2).
But almost 40% of the tag recoveries from the 1978-94 releases occurred within 3 months of
release; for the same period, less than 20% of the 1960's releases were recovered. The difference in
short-term recovery rates was probably because 0-group and l-year old pollock move little during
the first two summers of life and often re-entered traps in which they were originally caught. If the
first 3 months of recoveries are removed from the year and total tallies, the revised proportional
recovery rates for the 4 years post-release are 0.247, 0.503, 0.725 and 0.862 versus 0.470, 0.645,
0.863 and 0.952 for the 1978 and 1960's release periods, respectively. With that modification, the
proportion recovered from the 1978-84 period is only half. Subsequently, natural mortality would
have removed a large proportion of the 1978-84 fish before they recruited to the commercial
fishery, while pollock tagged in the 1960's were of commercial fishing size.
Updates to Historical Tagging Studies
[Publications List references: 4, 8, 49, 50, 51, 60]
None.
Summary of Unexamined Recoveries
None.
Sea Raven (Hemitripterus americanus)
General Description
A total of 20 sea raven were tagged with T-bar anchor tags in January-February in 1979-80
(Table 1). The tagging area was nearshore in areas 4Xm and 4Wk (Appendix B Figure 3). No
recoveries have been made.

21
Updates to Historical Tagging Studies
None.
Summary of Unexamined Recoveries
None.
Thorny Skate (Raja radiata)
General Description
Fifty-one thorny skate were tagged with T-bar anchor tags in February of 1979 and 1980
nearshore in areas 4Xm and 4Wk (Appendix B Figure 22). No recoveries have been made.
Updates to Historical Tagging Studies
None.
Summary of Unexamined Recoveries
None.
White Hake (Urophycis tenuis)
General Description
White hake tagging has been restricted to the south-eastern portion of the Gulf of St. Lawrence
(areas 4Tg,h) (Figure 22). Twenty-two hundred and seventy-one were tagged with Petersen discs in
August, 1967 and 196 were tagged with T-bar anchor tags in September, 1979.
The majority of the fish tagged in 1967 were between 52 and 70 cm, with an extended range
from 37 to 106 cm. The length range of the fish tagged in 1979 was more restricted (40-82 cm)
with the majority between 43 and 60 cm. The recovery rate for the 1967 releases was 0.293 (Table
1) with almost 90% of the recoveries being made within 2 years of release and over 96% within 4
years (Table 2). Only 4 recoveries were made from the 1979 release, all in the second year.
Updates to Historical Tagging Studies
[Publications List references: 20]
An example of the potential contribution that 'subsequent' recoveries of tags can make to
our understanding of a situation is provided by the analysis of white hake movements in the Gulf of
St Lawrence. Kohler (1971) used 606 recaptures to the end of 1969 to describe the movements of

22
fish tagged in August of 1967. Nearly 400 of these fish were of little use since they were
'immediate' recaptures, so the investigation was effectively left with about 200 recoveries made
over a two year period. Another 63 recoveries were made during 1970-78, such that a redundant
localized concentration of hake became apparent during June (and once continued into July) in the
vicinity of Baie Verte in the Northumberland Strait (Figure 8). This grouping of hake coincides
with the timing of spawning for these fish (Markle et al, 1982), and collaborates the belief of local
fishermen that white hake spawn in the Strait (Halliday and Pinhorn, 1982; Clay et al, 1985). It also
serves to better pinpoint just where in the Strait these fish spawn, and supports the hypothesis put
forward by Markle et al (1982), based on larval surveys, that white hake in the southwestern Gulf
undergo mass spawning as opposed to the prolonged and dispersed spawning associated with
Scotian Shelf hake.
Summary of Unexamined Recoveries
The 196 white hake released off Pictou Island, N.S. (area 4Tg) in 1979 provided four
recoveries, all during July-August of 1981. Three were recovered in the northern Nortumberland
Strait and one was recovered near the tagging location (Figure 9).
Windowpane Flounder (Scophthalmus aquosus)
General Description
Twenty-eight windowpane were tagged with T-bar anchor tags in August, 1984 (Appendix
B Figure 3) in the Passamaquoddy Bay area of the Bay of Fundy (area 4Xs). No recoveries have
been made.
Updates to Historical Tagging Studies
None.
Summary of Unexamined Recoveries
None.
Winter Flounder (Pseudopleuronectes americanus)
General Description
Of the 1410 winter flounder tagged, forty-four were tagged between 1971 and 1973, the
remainder between 1979 and 1985 (Table 1; Appendix B Figure 28). Petersen disc tags were used
in the earlier period and T-bar anchor tags in the latter period. The early period tagging was
restricted to the Passamaquoddy Bay region of the Bay of Fundy (area 4Xs). In January and
February in 1979 and 1980, three hundred and fifty-nine fish were tagged off Halifax and St.

23
Margaret's Bay (areas 4Xm and 4Wk), while 1007 were tagged in the Passamaquoddy Bay region
(area 4Xs) between August 1984 and November 1985.
The size of fish tagged ranged from 12-53 cm with the majority being between 23-40 cm.
The recovery rate was much higher for the early releases (0.114 vs 0.023; Table 1) although due to
the limited releases the overall number of recoveries was small. Over 90% of the recoveries had
been made within 2 years of release (Table 2).
Updates to Historical Tagging Studies
None.
Summary of Unexamined Recoveries
The tagging of winter flounder in and around Passamaquoddy Bay, N.B., and off Halifax,
N.S. may have been a deliberate investigation of the species that was never reported in the
literature. A total of 1410 fish were released and 37 tags recovered across about 8 tagging studies
(most targeting other species). We conducted a casual investigation of the recoveries and
concluded that winter flounder movements, of short distances and no discernible pattern, probably
represent directionless foraging (Figure 10). One of the fish tagged near Halifax was reported off
the north tip of Cape Breton 8 years later. Given the long time period such a recovery is plausible,
but we would want to see more occurrences before ruling out that it is merely a reporting error.
Winter Skate (Raja ocellata)
General Description
A total of 12 winter skate were tagged, all in February, 1980, nearshore in area 4Xm
(Appendix B Figure 22). No recoveries have been made.
Updates to Historical Tagging Studies
None.
Summary of Unexamined Recoveries
None.
Witch Flounder (Glyptocephalus cynoglossus)
General Description
During the 1963-66 and 1972-73 periods, 2731 witch were tagged (Appendix B Figure 29).
In 1963, tagging was conducted in October in the southeastern Gulf of St. Lawrence (areas 4Tf,g;

24
134 fish) and off the northeastern portion of Cape Breton (area 4Vn; 190 fish). In 1964-65 tagging
was limited to the eastern Scotian Shelf (areas 4Vb,c,n and 4Wd,h; 2314 fish) during the October-
April period. In April, 1972, sixteen fish were tagged off southwest Nova Scotia (area 4Xo), while
all of the 1973 releases occurred within the Bay of Fundy (areas 4Xr,s; 66 fish).
In the 1960's the size range of fish tagged was extensive (29-90 cm) with no dominant
modes in the distribution of lengths. In the 1970's the length range was more limited (41-64 cm)
but again with a fairly even distribution of lengths over that range. The recovery rate was 0.050
(Table 1), but the recovery period has been prolonged, with slightly less than 85% being recovered
within 4 years of release (Table 2).
Updates to Historical Tagging Studies
[Publications List references: 12, 56]
None.
Summary of Unexamined Recoveries
The only reference we could find to any of the witch flounder tagging was a brief mention
in the ICNAF Annual Proceedings for 1965 (Hart, 1966), where it was reported that tagged witch
stay in the vicinity of the tagging locations. But the only tagging study identified in this report was
for 1965, ostensibly referring to both eastern Scotian Shelf studies in that year; however the authors
may have also considered the 1964 tagging in forming their conclusions. In either case, some
tagging studies were not reported in the literature, and the studies that were commented upon had
only provided one or two years of recovery data by 1966. We took a preliminary look at all the
recoveries (returns were still occurring during the 1970’s) with respect to eight release group
definitions, and formed the general impression that most of the witch flounder groups dispersed
randomly or with a directional bias; therefore they would not be construed as remaining in the area
of release. Some observations related to specific tagging studies:
Tagging near Passamaquoddy Bay (Figure 11): only two recoveries recorded, both local.
Tagging off Southwest Nova Scotia: no recoveries.
Tagging West of Sable Island, 1965 (Figure 12): reasonable numbers of tagged fish were recovered,
53 with coordinates for the recovery location. We suspect that the 24 releases farthest offshore are
subject to incorrectly transcribed latitudes, and may belong with the 467 fish tagged directly north
of them. Of 4 recoveries from these 24 fish, 3 were located where the northern group were tagged,
and the other was recovered to the east of the northern tagging location. If this is correct, then
almost all recoveries were local to the tagging area. Two recoveries were reported from the vicinity
of the ‘Lip’, a small area off Cape North where fish converge in the spring and fall to enter or leave
the Gulf of St Lawrence (the Lip represents a cut connecting the Cape Breton Trough and
Laurentian Channel). As no witch flounder were recovered in between the release area and the

25
‘Lip’, these two recoveries seem dubious. However the intervening areas are also characterized by
a preponderance of untrawlable bottom conditions.
Tagging in 4Vc (Figure 13): eight recoveries were made, suggesting quite extensive dispersal,
especially to the north. One recovery was reported off Scaterie, two at the ‘Lip’, and one across
the Laurentian Channel in the northern Gulf of St Lawrence (4Ss).
Tagging in 4Wd (Figure 14): seven recoveries were made, suggesting quite extensive dispersal,
predominantly northeastwards, with five tags reported on or near the edge of the Laurentian
Channel in 4Vc (2) and 4Vn (3).
We examined the Sydney Bight/Lip area recoveries from the 4W/4Vc releases described in
the previous three subsections, checking for commonality in data that might suggest hoarding and
subsequent batch submission of tags, as opposed to tags being treated as singular events. Such an
occurrence could associate a single reporting error with multiple recoveries. However the
Bight/Lip area recovery locations from Scotian Shelf tagging appear generally unique, with only
two of the tags representing a common return event. We could still be seeing an effect of boats
leaving regular fishing areas on the Shelf to prosecute the seasonally brief but intensive Lip fishery,
with undetected, tagged witch in their holds from fishing in the 4W/4Vc area. But the apparent
movement of witch flounder from 4W and Banquereau areas to the Sydney Bight area cannot be
discounted.
Tagging on the Edge of the Laurentian Channel in 1964 (Figure 15): four recoveries were made,
suggesting extensive dispersal north and west. It is hard to comment on the possibility of
eastward movement down the slope into the Channel, as Channel depths are beyond most
fishing. Thus we would not expect to see recoveries from fish moving east unless they crossed
over to the Grand Banks. But the absence of recoveries from regularly fished depths and areas
to the south (Banquereau) suggests there may be little movement in this direction.
Tagging in Northern Sydney Bight (Figure 16): thirteen recoveries were made, twelve indicating
local dispersion and one from 3Ps directly across the Laurentian Channel from the release area.
Tagging in the Cape Breton Trough (Figure 17): four recoveries were made, three in the vicinity
of the release area and one off the Madelene Islands near the edge of the Laurentian Channel.
Yellowtail Flounder (Limanda ferruginea)
General Description
A total of 3185 yellowtail have been tagged (Table 1; Appendix B Figure 30), the majority
in June-September 1966 (2596 fish) and May 1967 (452 fish) on Sable Island Bank (areas
4We,f,h,j) and Banquereau (area 4VSc). Of the remaining 137, small numbers were tagged along

26
the south coast of Nova Scotia and 116 were tagged in Passamaquoddy Bay (area 4Xs) in 1984-85.
In 1966-67, Petersen disc tags were used while in the 1979-85 period, T-bar anchor tags were used.
The length range of the fish tagged was 18-54 cm with the majority between 30 and 42 cm.
The recovery rates (Table 1) were dramatically higher from the earlier period (0.082) with
only 1 recovery being made from the more recent releases (0.007). Over 90% of the recoveries were
made within 3 years of release (Table 2).
Updates to Historical Tagging Studies
None.
Summary of Unexamined Recoveries
None of the yellowtail tagging has been reported in the scientific literature. We looked at two
major and two minor release groups. While a cursory examination of plottable recoveries might
suggest some very pronounced movements, we concluded that yellowtail flounder probably do not
move extensively, but exhibit highly localized random dispersal. We review the data for each
release grouping below:
Tagging in the vicinity of Sable Island (4We, 4Wh, 4Vc) in 1966 (Figure 18): there were 52
plottable recoveries from tagging in this area, 16 of them depicting long-distance movements,
including 11 reports from Georges Bank. However 10 of the Georges Bank recoveries were made
from 3 recapture events in the same month that these fish were tagged, and the last recovery was
made the following month. It is highly improbable that these 10 fish would have moved from Sable
Island to Georges Bank in a month, so that information is probably erroneous. Of the remaining 5
non-local recoveries, 3 were reported from Banquereau and two from adjacent banks. When the
improbable recoveries are discounted, the low number of apparently long-range movements suggest
that yellowtail flounder are quite sedentary.
Tagging in 4Wj and 4Wh in 1967 (Figure 18): of 32 plottable recoveries from these fish, only 4
were both non-local and theoretically possible (we discounted a fifth recovery from 4Vc during
the month of release).
Tagging off Southwest Nova Scotia (Figure 19): the single yellowtail tagged in 1972 was
recovered in the vicinity of the release area in 1981.
Tagging near Halifax (Figure 19): Only one recovery occurred from the 20 yellowtail flounder
tagged in January-February 1979-80 near Halifax, N.S., in the following spring in the vicinity of the
tagging site.

27
REFERENCES
Beanlands, D. and McGlade, J. 1982. Groundfish tagging procedures. Lab. Ref. 82/3.
Beckett, J.S., Stobo, W.T., and Dickson, C.A. 1974. Southwesterly migration of Atlantic
mackerel, Scomber scombrus, tagged off Nova Scotia. ICNAF Res. Doc. 74/94.
Beverton, R.J.H. and Hodder, V.M. 1962. Report of the working group of scientists on fishery
assessment in relation to regulation problems. 7. Subarea 4. ICNAF Ann. Proc. 11 (sup):37-
52.
Clay, D., Currie, L., and Hurlbut, T. 1985. A first assessment of Gulf white hake: NAFO
Division 4T/1985. CAFSAC Res. Doc. 85/64.
Clay, D., Stobo, W.T., Beck, B., and Hurley, P.C.F. 1989. Growth of juvenile pollock
(Pollachius virens L.) along the Atlantic coast of Canada with inferences of inshore-
offshore movements. J. Northw. Atl. Fish. Sci. 9(1):37-43.
Fowler, G.M. and Stobo, W.T. 1991. Comparative recoveries of spaghetti tags and Petersen disc
tags on Atlantic cod (Gadus morhua) and American plaice (Hippoglossoides platessoides).
J. Northw. Fish. Sci. 11:39-42.
Fowler, G.M. and Stobo, W.T. 1999. Effects of release parameters on recovery rates of tagged
groundfish species. Can. J. Fish. Aquat. Sci. 56:1732-1751.
Halliday, R.G. and Pinhorn, A.T. 1982. The groundfish resource in the Gulf of St. Lawrence.
Can. Tech. Rep. Fish. Aquat. Sci. 1086. Department of Fisheries and Oceans, Ottawa,
Ontario, Canada.
Hart, J.L. 1966. Summaries of research and status of fisheries by subareas, 1965. 3. Subarea 4.
ICNAF Ann. Proc. 16:41-43.
Jean, Y. 1963. Where do Seven Islands cod come from? Trade News 16(2):6-7.
Jean, Y. 1964. Seasonal distribution of cod (Gadus morhua L.) along the Canadian Atlantic
coast in relation to water temperature. J. Fish. Res. Bd. 21(3):429-460.

28
Kohler, A.C. 1971. Tagging of white hake, Urophycis tenuis Mitchell, in the southern Gulf of St.
Lawrence. ICNAF Res. Bull. 8:21-25.
Kohler, A.C. 1975. Recoveries from 1969 cod tagging in ICNAF Divisions 4VN. ICNAF Res.
Doc. 75/91.
Lettaconnoux, R.H. 1963. Summaries of research, 1962, by subarea. 3. Subarea 4. ICNAF Ann.
Proc. 13:35-37.
Lettaconnoux, R.H. 1965. Summaries of research and status of fisheries, by subareas for 1964. 3.
Subarea 4. ICNAF Ann. Proc. 14:38-40.
Markle, D.F., Methven, D.A., and Coates-Markle, L.J. 1982. Aspects of spatial and temporal co-
occurrence on the life history stages of the sibling hakes, Urophycis chuss (Walbaum 1792)
and Urophycis tenuis (Mitchell 1815) (Pisces: Gadidae). Can. J. Zool. 60: 2057-2078.
Martin, W.R. 1960. Canadian research report, 1959. B. Subareas 4 and 5. ICNAF Ann. Proc.
10, Part III:25-31.
Martin, W.R. 1961. Canadian research report, 1960. B. Subareas 4 and 5. ICNAF Ann. Proc.
11, Part III:31-37.
McCracken, F.D. 1973. Summaries of research and status of fisheries for subareas and seals,
1972. 4. Subarea 4. ICNAF Ann. Rep. 23:102-105.
McFarlane, G.A., Wydoski, R.S., and Prince, E.D. 1990. Historical review of the development of
external tags and marks. Amer. Fish. Soc. Symp. 7:9-29.
Needler, A.W.H. 1930. The migrations of haddock and the interrelationships of haddock
populations in North American waters. Contrib. Can. Biol. Fish., N.S., 6(10):243-313.
Paloheimo, J.E. 1958. Determination of natural and fishing mortalities of cod and haddock from
analysis of tag records off western Nova Scotia. J. Fish. Res. Bd. Can. 15:1371-1381.
Parsons, L.S. and Moores, J.A. 1973. Long-distance migration of an Atlantic mackerel, Scomber
scombrus, tagged in Newfoundland waters. Intern. Comm. Northw. Atlant. Fish. Res. Doc.
73/82.
Stobo, W.T. 1976. Movements of mackerel tagged in Subarea 4. ICNAF Res. Doc. 76/VI/49.
Stobo, W.T., Scott, J.S., and Hunt, J.J. 1975. Movements of herring tagged in the Bay of Fundy.
ICNAF Res. Doc. 75/38.

29
Stobo, W.T., Neilson, J.D., and Simpson, P.G. 1988. Movements of Atlantic halibut
(Hippoglossus hippoglossus) in the Canadian North Atlantic. Can. J. Fish. Aquat. Sci. 45:
484-491.
Templeman, W. 1963. Comparison of returns from different tags and methods of attachment
used in cod tagging in the Newfoundland area, 1954 and 1955. ICNAF Spec Publ.
4:272-287.

30
Table 1. Aspects of recovery data quality for different species and tagging programs.
Species Program
Number
Released
Number
Recovered
Percent
Recovered
Number
with
NAFO
Division
plus
Year
plus
NAFO
Unit
Area
plus
Month
plus
Latitude
and
Longitude
Percent
Recovered
ATLANTIC WOLFFISH 1953 - 1973 113 13 11.5% 13 13 12 12 11 9.7%
ATLANTIC COD 1953 - 1973 26777 7465 27.9% 7429 7409 6586 6432 5570 20.8%
1978 - 1985 54214 8730 16.1% 8519 8467 7259 6988 5618 10.4%
CUNNER 1978 - 1985 47 3 6.4% 3 3 3 3 3 6.4%
HADDOCK 1953 - 1973 7626 948 12.4% 908 905 840 823 646 8.5%1978 - 1985 36373 1095 3.0% 1085 1084 987 963 877 2.4%
ATLANTIC HALIBUT 1953 - 1973 1296 290 22.4% 279 277 182 178 166 12.8%
HERRING 1973 - 1982 341091 13806 4.0% 13724 12910 12910 12641 12641 3.7%
MACKEREL 1973 - 1974 12664 178 1.4% 57 56 56 56 55 0.4%
AMERICAN PLAICE 1953 - 1973 2657 941 35.4% 932 932 673 665 523 19.7%
1978 - 1985 6855 455 6.6% 441 441 355 331 265 3.9%
POLLOCK 1953 - 1973 1008 218 21.6% 218 211 196 195 195 19.3%1978 - 1985 55865 5615 10.1% 5464 5286 4590 4424 4095 7.3%
SEA RAVEN 1978 - 1985 20 0 0.0%
THORNY SKATE 1978 - 1985 51 0 0.0%
WHITE HAKE 1953 - 1973 2271 666 29.3% 656 654 643 634 597 26.3%
1978 - 1985 196 4 2.0% 4 4 4 4 4 2.0%
WINDOWPANE FLOUNDER 1978 - 1985 28 0 0.0%
WINTER FLOUNDER 1953 - 1973 44 5 11.4% 5 5 4 4 4 9.1%1978 - 1985 1366 32 2.3% 32 32 26 21 15 1.1%
WINTER SKATE 1978 - 1985 12 0 0.0%
WITCH FLOUNDER 1953 - 1973 2731 136 5.0% 129 129 116 115 91 3.3%
YELLOWTAIL FLOUNDER 1953 - 1973 3049 251 8.2% 250 249 239 235 114 3.7%
1978 - 1985 136 1 0.7% 1 1 1 1 1 0.7%

31
Table 2. Temporal breakdown of recovery data for different species and tagging programs.
NUMBERS AND PERCENTS OF RECOVERIES
Species
Program
Number
Released
Number
Recovered
with Date
Known to
Month
Within 3
Months of
Release
Between 3
Months and
1 Year of
Release
Between 1
and 2
Years of
Release
Between 2
and 3
Years of
Release
Between 3
and 4
Years of
Release
Over 4
Years
after
Release
ATLANTIC W
OLFFISH
1953 - 1973
113
13
7 53.8%
1 7.7%
4 30.8%
0 .0%
1 7.7%
_
ATLANTIC COD
1953 - 1973
26777
7376
1694 23.0%
2668 36.2%
1672 22.7%
721 9.8%
309 4.2%
312 4.2%
1978 - 1985
54214
8159
1032 12.6%
3874 47.5%
1877 23.0%
744 9.1%
374 4.6%
258 3.2%
CUNNER
1978 - 1985
47
3 3 100.0%
__
__
_
HADDOCK
1953 - 1973
7626
924
133 14.4%
407 44.0%
212 22.9%
92 10.0%
40 4.3%
40 4.3%
1978 - 1985
36373
1053
135 12.8%
424 40.3%
286 27.2%
130 12.3%
53 5.0%
25 2.4%
ATLANTIC HALIBUT
1953 - 1973
1296
275
29 10.5%
46 16.7%
74 26.9%
40 14.5%
32 11.6%
54 19.6%
HERRING
1973 - 1982
341091
13066
8605 65.9%
3167 24.2%
944 7.2%
241 1.8%
75 .6%
34 .3%
MACKEREL
1973 - 1974
12664
176
128 72.7%
39 22.2%
9 5.1%
__
_
AMERICAN PLAICE
1953 - 1973
2657
922
247 26.8%
276 29.9%
203 22.0%
81 8.8%
53 5.7%
62 6.7%
1978 - 1985
6855
408
55 13.5%
143 35.0%
95 23.3%
54 13.2%
29 7.1%
32 7.8%
POLLOCK
1953 - 1973
1008
207
39 18.8%
79 38.2%
29 14.0%
37 17.9%
15 7.2%
8 3.9%
1978 - 1985
55865
5176
1955 37.8%
794 15.3%
826 16.0%
714 13.8%
442 8.5%
445 8.6%
SEA RAVEN
1978 - 1985
20
0_
__
__
_
THORNY SKATE
1978 - 1985
51
0_
__
__
_
WHITE HAKE
1953 - 1973
2271
655
349 53.3%
142 21.7%
98 15.0%
40 6.1%
16 2.4%
10 1.5%
1978 - 1985
196
4 0 .0%
0 .0%
4 100.0%
__
_
WINDOWPANE FLOUNDER
1978 - 1985
28
0_
__
__
_
WINTER FLOUNDER
1953 - 1973
44
5 0 .0%
3 60.0%
2 40.0%
__
_1978 - 1985
1366
30
16 53.3%
6 20.0%
5 16.7%
2 6.7%
0 .0%
1 3.3%
WINTER SKATE
1978 - 1985
12
0_
__
__
_
WITCH FLOUNDER
1953 - 1973
2731
132
35 26.5%
24 18.2%
34 25.8%
12 9.1%
7 5.3%
20 15.2%
YELLOWTAIL FLOUNDER
1953 - 1973
3049
244
43 17.6%
54 22.1%
100 41.0%
29 11.9%
7 2.9%
9 3.7%
1978 - 1985
136
1 0 .0%
0 .0%
1 100.0%
__
_

32

33
0
200
400
600
800
1000
1200
1400
1600
1800
2000
Jan Feb Mar Apr May Jun Jul Aug Sep Oct Nov Dec
Month of Recovery
Number of Recoveries
1978-85 Program
1953-73 Program
Figure 2. Overview of groundfish tag returns by month from the 1953-73 and 1978-85 tagging
programs.

34

35

36

37
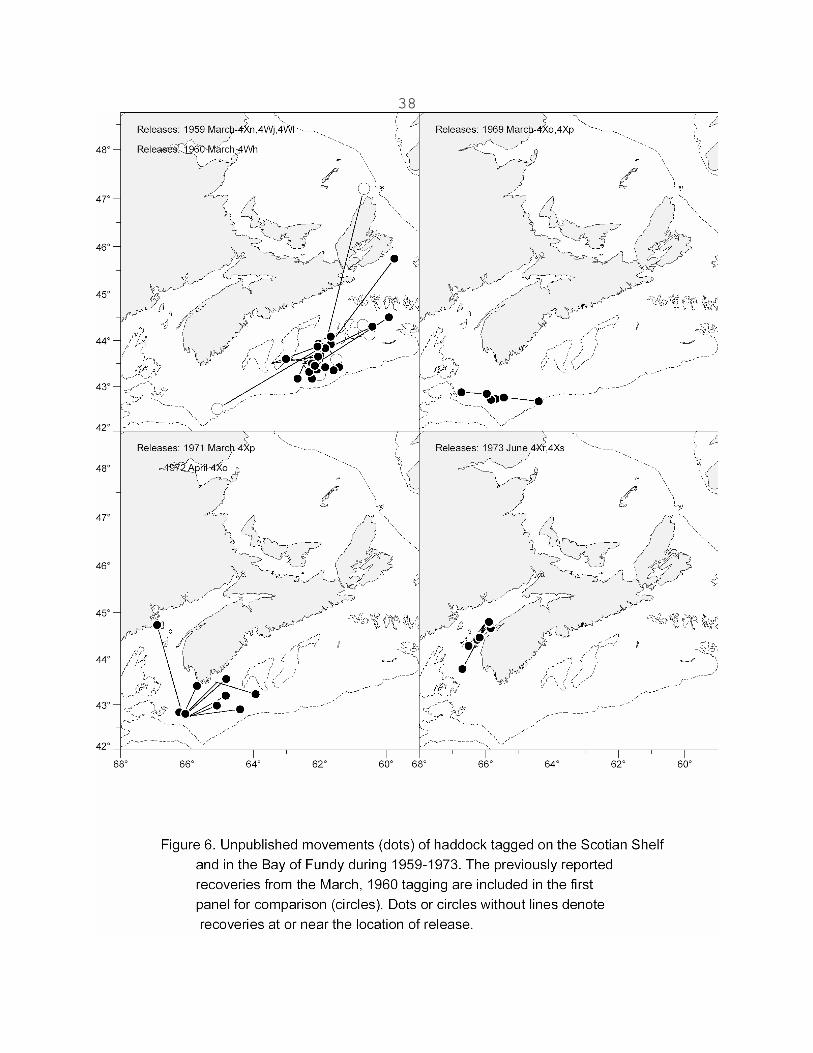
38
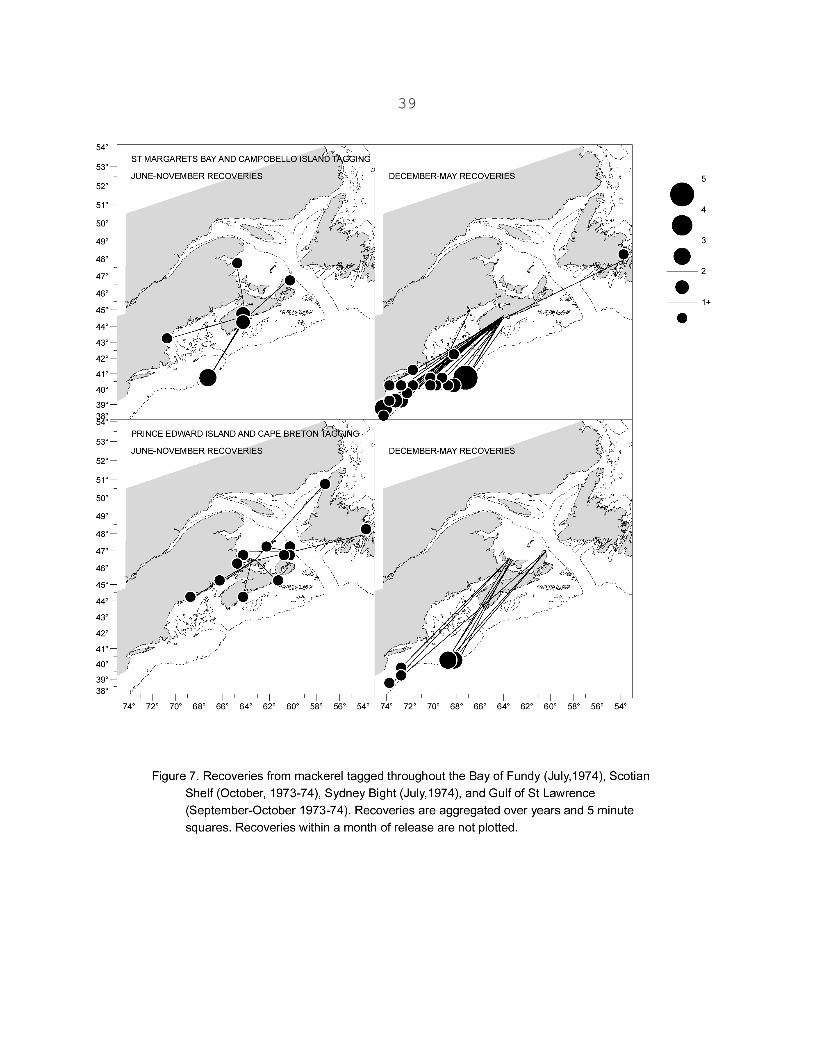
39

40

41

42

43

44
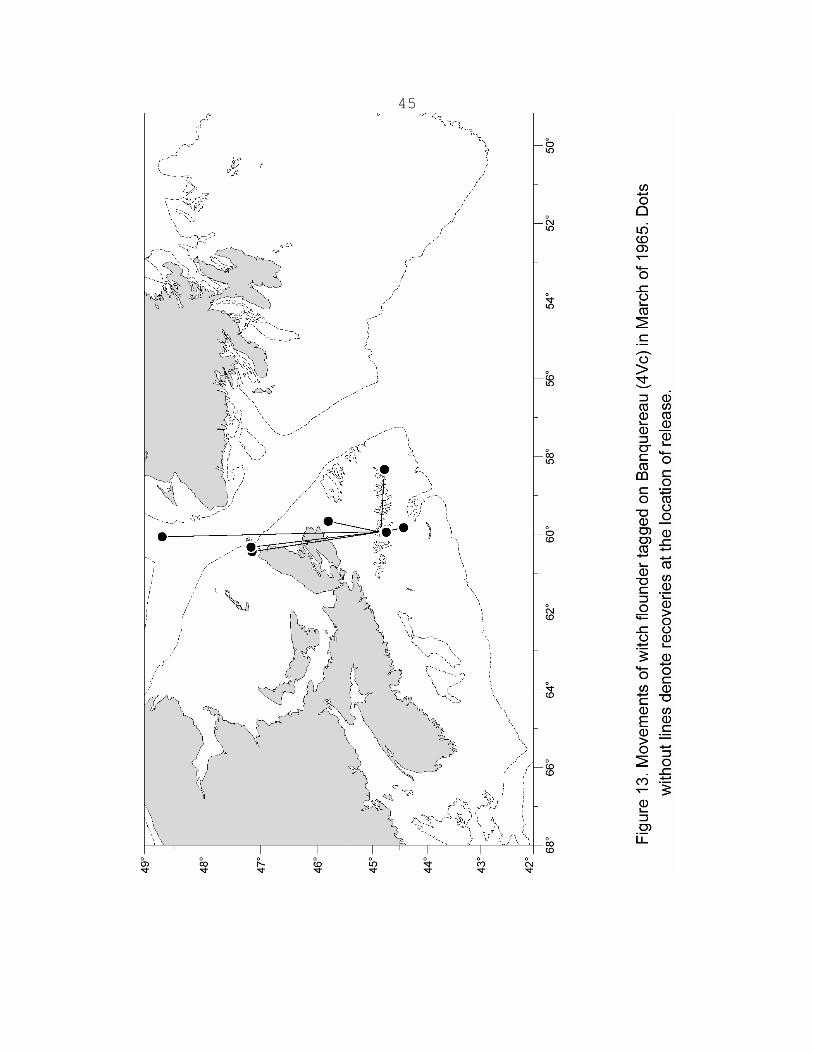
45

46
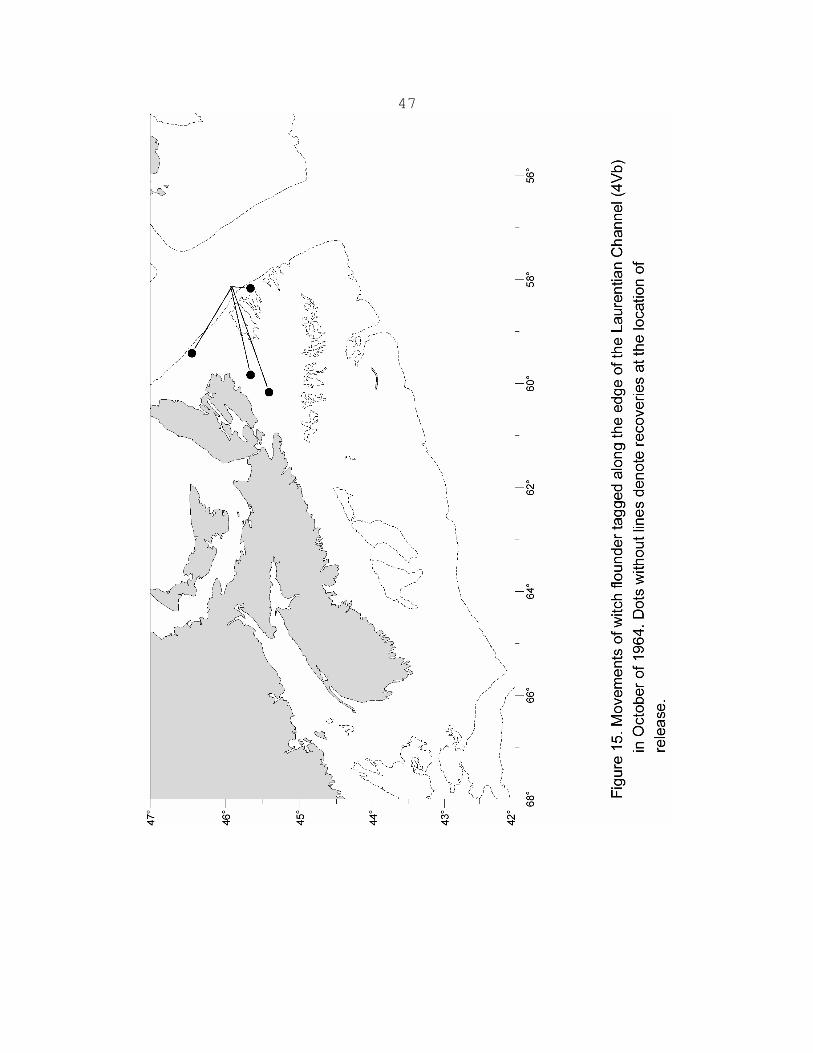
47

48

49

50
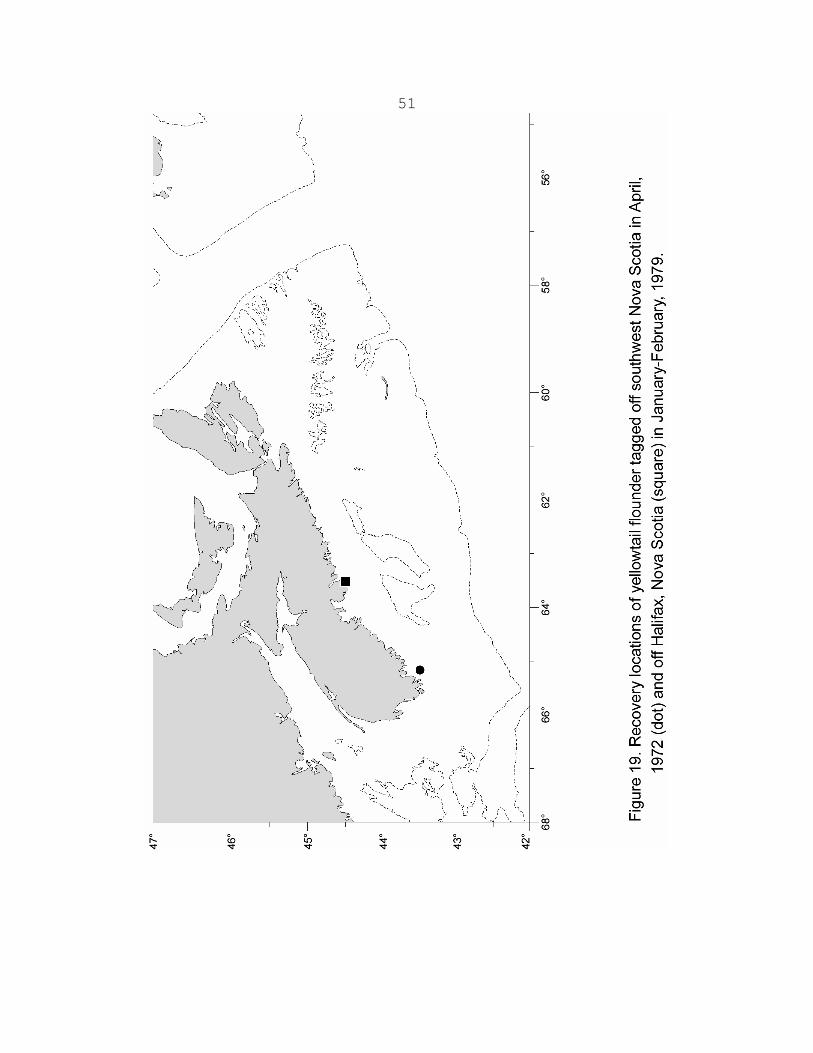
51

52

53
Appendix A
Tabular summary of the tagging activities described in this document. Numeric labels
in the References column denote publications in Appendix F. A question mark means the
data does not appear to have been analyzed with respect to movements, although it may have
been examined in other respects, and the amount of data is non-trivial. An asterisk is used to
flag tagging of an incidental nature for which we have reported previously unpublished
results in the text.
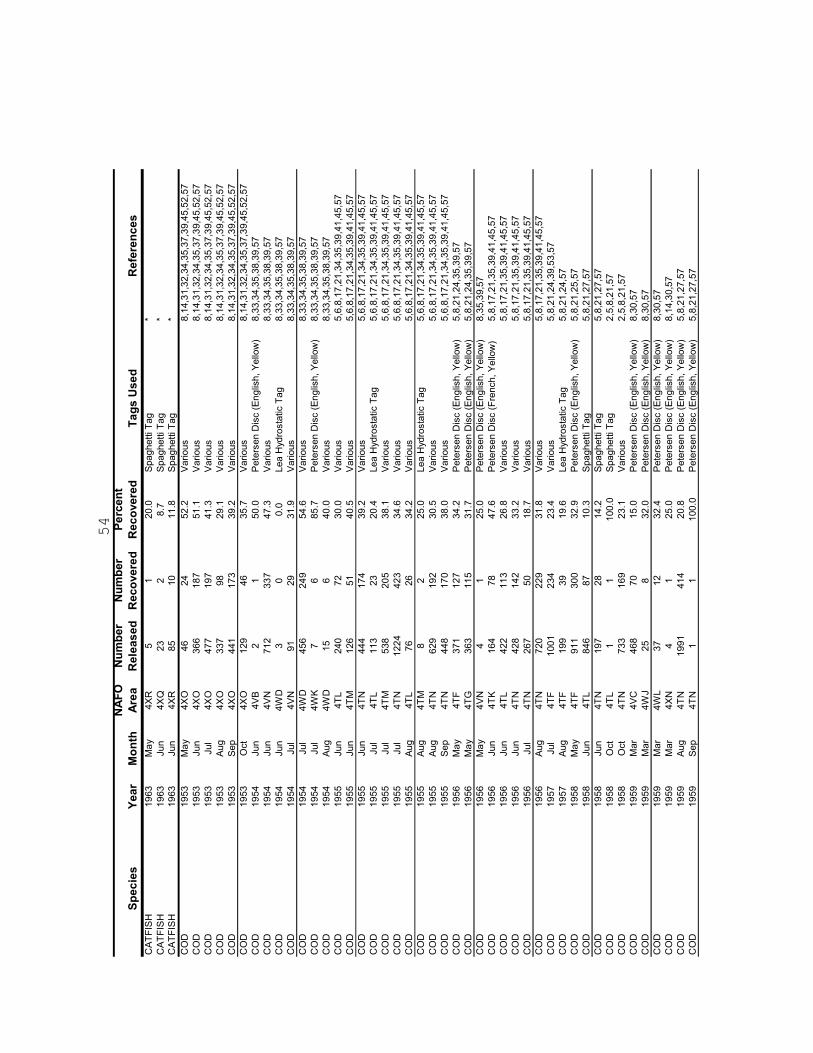
54
Species
Year
Month
NAFO
Area
Number
Released
Number
Recovered
Percent
Recovered
Tags Used
References
CATFISH
1963
May
4XR
51
20.0
Spaghetti Tag
*
CATFISH
1963
Jun
4XQ
23
28.7
Spaghetti Tag
*CATFISH
1963
Jun
4XR
85
10
11.8
Spaghetti Tag
*
COD
1953
May
4XO
46
24
52.2
Various
8,14,31,32,34,35,37,39,45,52,57
COD
1953
Jun
4XO
366
187
51.1
Various
8,14,31,32,34,35,37,39,45,52,57
COD
1953
Jul
4XO
477
197
41.3
Various
8,14,31,32,34,35,37,39,45,52,57
COD
1953
Aug
4XO
337
98
29.1
Various
8,14,31,32,34,35,37,39,45,52,57
COD
1953
Sep
4XO
441
173
39.2
Various
8,14,31,32,34,35,37,39,45,52,57
COD
1953
Oct
4XO
129
46
35.7
Various
8,14,31,32,34,35,37,39,45,52,57
COD
1954
Jun
4VB
21
50.0
Petersen Disc (English, Yellow)
8,33,34,35,38,39,57
COD
1954
Jun
4VN
712
337
47.3
Various
8,33,34,35,38,39,57
COD
1954
Jun
4WD
30
0.0
Lea Hydrostatic Tag
8,33,34,35,38,39,57
COD
1954
Jul
4VN
91
29
31.9
Various
8,33,34,35,38,39,57
COD
1954
Jul
4WD
456
249
54.6
Various
8,33,34,35,38,39,57
COD
1954
Jul
4WK
76
85.7
Petersen Disc (English, Yellow)
8,33,34,35,38,39,57
COD
1954
Aug
4WD
15
640.0
Various
8,33,34,35,38,39,57
COD
1955
Jun
4TL
240
72
30.0
Various
5,6,8,17,21,34,35,39,41,45,57
COD
1955
Jun
4TM
126
51
40.5
Various
5,6,8,17,21,34,35,39,41,45,57
COD
1955
Jun
4TN
444
174
39.2
Various
5,6,8,17,21,34,35,39,41,45,57
COD
1955
Jul
4TL
113
23
20.4
Lea Hydrostatic Tag
5,6,8,17,21,34,35,39,41,45,57
COD
1955
Jul
4TM
538
205
38.1
Various
5,6,8,17,21,34,35,39,41,45,57
COD
1955
Jul
4TN
1224
423
34.6
Various
5,6,8,17,21,34,35,39,41,45,57
COD
1955
Aug
4TL
76
26
34.2
Various
5,6,8,17,21,34,35,39,41,45,57
COD
1955
Aug
4TM
82
25.0
Lea Hydrostatic Tag
5,6,8,17,21,34,35,39,41,45,57
COD
1955
Aug
4TN
629
192
30.5
Various
5,6,8,17,21,34,35,39,41,45,57
COD
1955
Sep
4TN
448
170
38.0
Various
5,6,8,17,21,34,35,39,41,45,57
COD
1956
May
4TF
371
127
34.2
Petersen Disc (English, Yellow)
5,8,21,24,35,39,57
COD
1956
May
4TG
363
115
31.7
Petersen Disc (English, Yellow)
5,8,21,24,35,39,57
COD
1956
May
4VN
41
25.0
Petersen Disc (English, Yellow)
8,35,39,57
COD
1956
Jun
4TK
164
78
47.6
Petersen Disc (French, Yellow)
5,8,17,21,35,39,41,45,57
COD
1956
Jun
4TL
422
113
26.8
Various
5,8,17,21,35,39,41,45,57
COD
1956
Jun
4TN
428
142
33.2
Various
5,8,17,21,35,39,41,45,57
COD
1956
Jul
4TN
267
50
18.7
Various
5,8,17,21,35,39,41,45,57
COD
1956
Aug
4TN
720
229
31.8
Various
5,8,17,21,35,39,41,45,57
COD
1957
Jul
4TF
1001
234
23.4
Various
5,8,21,24,39,53,57
COD
1957
Aug
4TF
199
39
19.6
Lea Hydrostatic Tag
5,8,21,24,57
COD
1958
May
4TF
911
300
32.9
Petersen Disc (English, Yellow)
5,8,21,25,57
COD
1958
Jun
4TL
846
87
10.3
Spaghetti Tag
5,8,21,27,57
COD
1958
Jun
4TN
197
28
14.2
Spaghetti Tag
5,8,21,27,57
COD
1958
Oct
4TL
11
100.0
Spaghetti Tag
2,5,8,21,57
COD
1958
Oct
4TN
733
169
23.1
Various
2,5,8,21,57
COD
1959
Mar
4VC
468
70
15.0
Petersen Disc (English, Yellow)
8,30,57
COD
1959
Mar
4WJ
25
832.0
Petersen Disc (English, Yellow)
8,30,57
COD
1959
Mar
4WL
37
12
32.4
Petersen Disc (English, Yellow)
8,30,57
COD
1959
Mar
4XN
41
25.0
Petersen Disc (English, Yellow)
8,14,30,57
COD
1959
Aug
4TN
1991
414
20.8
Petersen Disc (English, Yellow)
5,8,21,27,57
COD
1959
Sep
4TN
11
100.0
Petersen Disc (English, Yellow)
5,8,21,27,57

55
Species
Year
Month
NAFO
Area
Number
Released
Number
Recovered
Percent
Recovered
Tags Used
References
COD
1959
Sep
4WF
99
22
22.2
Petersen Disc (English, Yellow)
2,8,57
COD
1959
Sep
4WH
15
320.0
Petersen Disc (English, Yellow)
2,8,57
COD
1959
Sep
4WL
11
100.0
Petersen Disc (English, Yellow)
2,8,57
COD
1960
Feb
4VN
923
219
23.7
Various
2,8,28,29,57
COD
1960
Mar
4WH,J
506
157
31.0
Various
2,8,28,29,57
COD
1960
Aug
4TN
58
10
17.2
Petersen Disc (English, French)
5,8,21,27,57
COD
1960
Sep
4TN
1589
331
20.8
Various
5,8,21,27,57
COD
1960
Oct
4TN
52
22
42.3
Petersen Disc (English, French)
5,8,21,27,57
COD
1961
Sep
4TN
1814
453
25.0
Various
*,8,21,57
COD
1961
Oct
4SZ
1500
288
19.2
Petersen Disc (English, French)
8,15,16,22,57
COD
1962
Apr
4VN
501
147
29.3
Petersen Disc (English, Yellow)
8,30,57
COD
1964
May
4SY
40
0.0
Petersen Disc (English, French)
8,48,57
COD
1964
May
4SZ
888
205
23.1
Petersen Disc (English, French)
*,8,48,57
COD
1964
May
4TK
997
297
29.8
Petersen Disc (English, French)
*,8,21,57
COD
1966
May
4XS
504
209
41.5
Petersen Disc (English, Yellow)
3,8,13,14,47,57
COD
1969
Jan
4VN
1018
139
13.7
Petersen Disc (English, Yellow)
8,19,57
COD
1969
Jun
4XN
35
38.6
Petersen Disc (English, Yellow)
8,10,14,57
COD
1969
Jun
4XO
10
0.0
Petersen Disc (English, Yellow)
8,10,14,57
COD
1969
Jun
4XP
69
17
24.6
Petersen Disc (English, Yellow)
8,10,14,57
COD
1970
Mar
4XP
21
50.0
Petersen Disc (English, Yellow)
8,10,14,57
COD
1972
Apr
4XO
138
39
28.3
Petersen Disc (English, Yellow)
8,10,14,57
COD
1973
Jun
4WF
11
100.0
Petersen Disc (English, Yellow)
8,57
COD
1973
Jun
4WJ
22
100.0
Petersen Disc (English, Yellow)
8,57
COD
1973
Jun
4WL
11
100.0
Petersen Disc (English, Yellow)
8,57
COD
1973
Jun
4XR
57
12
21.1
Petersen Disc (English, Yellow)
8,14,47,57
COD
1973
Jun
4XS
535
115
21.5
Petersen Disc (English, Yellow)
8,14,47,57
COD
1973
Jul
4XS
11
327.3
Petersen Disc (English, Yellow)
8,14,47,57
COD
1978
Oct
4WE
2340
695
29.7
T-Bar Anchor Tag
8,57,67
COD
1978
Nov
4WE
3682
1065
28.9
T-Bar Anchor Tag
8,57,67
COD
1978
Nov
4WJ
50
0.0
Petersen Disc (English, Yellow)
8,57,67
COD
1978
Nov
4WL
71
14.3
Petersen Disc (English, Yellow)
8,57,67
COD
1979
Jan
4WK
75
10
13.3
T-Bar Anchor Tag
?,8,57
COD
1979
Feb
4WK
506
79
15.6
T-Bar Anchor Tag
?,8,57
COD
1979
Apr
4VC
4302
933
21.7
Various
7,8,57,67
COD
1979
Jun
4XO
696
238
34.2
T-Bar Anchor Tag
8,9,13,14,57
COD
1979
Jun
4XR
141
38
27.0
T-Bar Anchor Tag
8,9,13,14,57
COD
1979
Sep
4TG
1994
104
5.2
T-Bar Anchor Tag
5,8,21,57,67
COD
1979
Sep
4TL
1965
17
0.9
T-Bar Anchor Tag
5,8,21,57,67
COD
1979
Nov
4WK
27
13.7
T-Bar Anchor Tag
8,57
COD
1980
Feb
4WK
75
68.0
T-Bar Anchor Tag
?,8,57
COD
1980
Feb
4XM
815
110
13.5
T-Bar Anchor Tag
8,13,14,57
COD
1980
Apr
4WK
30
0.0
T-Bar Anchor Tag
8,57
COD
1980
May
4TG
61
58.2
T-Bar Anchor Tag
5,8,21,57,67
COD
1980
May
4WK
18
15.6
T-Bar Anchor Tag
8,57
COD
1980
Jun
4TG
249
72.8
T-Bar Anchor Tag
5,8,21,57,67
COD
1980
Sep
4VN
2923
527
19.7
T-Bar Anchor Tag
?,8,57
COD
1980
Oct
4VN
2852
317
11.1
T-Bar Anchor Tag
?,8,57
COD
1980
Nov
4TG
2481
572
23.1
T-Bar Anchor Tag
5,8,21,57,67
COD
1980
Dec
4TG
2396
495
20.7
T-Bar Anchor Tag
5,8,21,57,67

56
Species
Year
Month
NAFO
Area
Number
Released
Number
Recovered
Percent
Recovered
Tags Used
References
COD
1981
Apr
4TG
3530
403
11.4
T-Bar Anchor Tag
5,8,21,57,67
COD
1981
Apr
4VC
2148
487
22.7
T-Bar Anchor Tag
8,57,67
COD
1981
May
4VC
2300
479
20.8
T-Bar Anchor Tag
8,57,67
COD
1981
Sep
4WF
1999
43
2.2
T-Bar Anchor Tag
?,8,57
COD
1981
Sep
4WH
400
12
3.0
T-Bar Anchor Tag
?,8,57
COD
1984
Feb
4XP
4000
600
15.0
T-Bar Anchor Tag
8,13,14,57
COD
1984
Feb
5ZJ
1996
193
9.7
T-Bar Anchor Tag
8,13,14,57
COD
1984
Mar
4XP
787
124
15.8
T-Bar Anchor Tag
8,13,14,57
COD
1984
Aug
4XS
67
34.5
T-Bar Anchor Tag
8,13,14,57
COD
1985
Jan
4XS
40
0.0
T-Bar Anchor Tag
8,13,14,57
COD
1985
Feb
4XP
1625
223
13.7
T-Bar Anchor Tag
8,13,14,57
COD
1985
Mar
4XP
4375
481
11.0
T-Bar Anchor Tag
8,13,14,57
COD
1985
Mar
5ZJ
1050
139
13.2
T-Bar Anchor Tag
8,13,14,57
COD
1985
Jul
4XR
216
25
11.6
T-Bar Anchor Tag
8,13,14,57
COD
1985
Jul
4XS
1399
95
6.8
T-Bar Anchor Tag
8,13,14,57
COD
1985
Jul
5YB
350
48
13.7
T-Bar Anchor Tag
8,13,14,57
COD
1985
Nov
4XS
282
35
12.4
T-Bar Anchor Tag
8,13,14,57
COD
1985
Dec
4XS
73
68.2
T-Bar Anchor Tag
8,13,14,57
CUNNER
1980
Jul
4XM
47
36.4
T-Bar Anchor Tag
*
HADDOCK
1953
May
4XO
117
40
34.2
Various
8,31,32,36,37,40
HADDOCK
1953
Jun
4XO
55
22
40.0
Various
8,31,32,36,37,40
HADDOCK
1953
Jul
4XO
223
60
26.9
Various
8,31,32,36,37,40
HADDOCK
1953
Aug
4XO
126
38
30.2
Various
8,31,32,36,37,40
HADDOCK
1953
Sep
4XO
34
926.5
Various
8,31,32,36,37,40
HADDOCK
1953
Oct
4XO
25
520.0
Various
8,31,32,36,37,40
HADDOCK
1954
Jun
4VN
33
100.0
Petersen Disc (English, Yellow)
8
HADDOCK
1954
Jul
4WK
25
416.0
Petersen Disc (English, Yellow)
8HADDOCK
1954
Jul
4XO
10
0.0
Petersen Disc (English, Yellow)
8HADDOCK
1954
Aug
4WD
11
19.1
Petersen Disc (English, Yellow)
8HADDOCK
1956
Sep
4TG
281
33
11.7
Petersen Disc (English, Yellow)
8,40,42,44,46
HADDOCK
1956
Sep
4TH
352
61
17.3
Petersen Disc (English, Yellow)
8,40,42,44,46
HADDOCK
1956
Oct
4TG
223
34
15.2
Petersen Disc (English, Yellow)
8,40,42,44,46
HADDOCK
1956
Oct
4TH
143
47
32.9
Petersen Disc (English, Yellow)
8,40,42,44,46
HADDOCK
1957
Mar
4XN
336
22
6.5
Petersen Disc (Red/W
hite)
8,26,40,42,44
HADDOCK
1957
Mar
4XO
56
35.4
Petersen Disc (Red/W
hite)
8,26,40,42,44
HADDOCK
1957
Mar
4XP
98
55.1
Petersen Disc (Red/W
hite)
8,26,40,42,44
HADDOCK
1957
Apr
4XN
634
43
6.8
Various
8,26,40,42,44
HADDOCK
1957
Oct
4XS
112
18
16.1
Petersen Disc (English, Yellow)
8,40,42,43,44
HADDOCK
1957
Nov
4XS
706
197
27.9
Petersen Disc (English, Yellow)
8,40,42,43,44
HADDOCK
1957
Dec
4XO
268
66
24.6
Petersen Disc (English, Yellow)
8,40,42,43,44
HADDOCK
1958
Apr
4XS
31
00.0
Petersen Disc (English, Yellow)
8HADDOCK
1959
Mar
4WJ
258
15
5.8
Petersen Disc (English, Yellow)
*,8,44
HADDOCK
1959
Mar
4WL
224
11
4.9
Petersen Disc (English, Yellow)
*,8,44
HADDOCK
1959
Mar
4XN
29
26.9
Petersen Disc (English, Yellow)
*,8,44
HADDOCK
1959
Sep
4WF
147
00.0
Petersen Disc (English, Yellow)
8,44
HADDOCK
1959
Sep
4WH
64
00.0
Petersen Disc (English, Yellow)
8,44
HADDOCK
1959
Sep
4WL
40
0.0
Petersen Disc (English, Yellow)
8,44
HADDOCK
1960
Mar
4WH
600
15
2.5
Petersen Disc (English, Yellow)
8,27,44
HADDOCK
1963
Nov
4XR
661
93
14.1
Petersen Disc (English, Yellow)
8,11

57
Species
Year
Month
NAFO
Area
Number
Released
Number
Recovered
Percent
Recovered
Tags Used
References
HADDOCK
1966
Oct
4XR
107
14
13.1
Petersen Disc (English, Yellow)
8,11
HADDOCK
1966
Oct
4XS
212
46
21.7
Petersen Disc (English, Yellow)
8,11
HADDOCK
1969
Jun
4XN
50
0.0
Petersen Disc (English, Yellow)
8HADDOCK
1969
Jun
4XO
12
18.3
Petersen Disc (English, Yellow)
*,8
HADDOCK
1969
Jun
4XP
234
93.8
Petersen Disc (English, Yellow)
*,8
HADDOCK
1970
Mar
4XP
22
00.0
Petersen Disc (English, Yellow)
8HADDOCK
1971
Mar
4XP
900
15
1.7
Petersen Disc (English, Yellow)
*,8
HADDOCK
1972
Apr
4XO
47
24.3
Petersen Disc (English, Yellow)
*,8
HADDOCK
1973
Jun
4XR
121
86.6
Petersen Disc (English, Yellow)
*,8
HADDOCK
1973
Jun
4XS
119
65.0
Petersen Disc (English, Yellow)
*,8
HADDOCK
1978
Nov
4WJ
28
00.0
Various
?,8
HADDOCK
1978
Nov
4WL
110
32.7
Various
?,8
HADDOCK
1979
Jan
4WK
10
00.0
T-Bar Anchor Tag
?,8
HADDOCK
1980
Feb
4WK
67
00.0
T-Bar Anchor Tag
?,8
HADDOCK
1980
Feb
4XM
74
00.0
T-Bar Anchor Tag
?,8
HADDOCK
1982
Jun
4XR
2973
429
14.4
T-Bar Anchor Tag
?,8
HADDOCK
1983
Mar
4XP
297
17
5.7
T-Bar Anchor Tag
?,8
HADDOCK
1983
Apr
4XN
2831
192
6.8
T-Bar Anchor Tag
?,8
HADDOCK
1983
Apr
4XP
419
11
2.6
T-Bar Anchor Tag
?,8
HADDOCK
1984
Feb
4XP
1999
13
0.7
T-Bar Anchor Tag
?,8
HADDOCK
1984
Feb
5ZJ
236
00.0
T-Bar Anchor Tag
?,8
HADDOCK
1984
Mar
4XN
4733
76
1.6
T-Bar Anchor Tag
?,8
HADDOCK
1984
Mar
4XP
4220
150
3.6
T-Bar Anchor Tag
?,8
HADDOCK
1984
Mar
5ZM
2953
49
1.7
T-Bar Anchor Tag
?,8
HADDOCK
1984
Aug
4XS
30
0.0
T-Bar Anchor Tag
?,8
HADDOCK
1985
Mar
4XN
2874
90.3
T-Bar Anchor Tag
?,8
HADDOCK
1985
Mar
4XP
5994
69
1.2
T-Bar Anchor Tag
?,8
HADDOCK
1985
Mar
5ZJ
2944
43
1.5
T-Bar Anchor Tag
?,8
HADDOCK
1985
Apr
4XN
2925
19
0.7
T-Bar Anchor Tag
?,8
HADDOCK
1985
Apr
4XP
200
00.0
T-Bar Anchor Tag
?,8
HADDOCK
1985
Jul
4XR
134
10.7
T-Bar Anchor Tag
?,8
HADDOCK
1985
Jul
4XS
50
00.0
T-Bar Anchor Tag
?,8
HADDOCK
1985
Jul
5YB
299
10.3
T-Bar Anchor Tag
?,8
WHITE HAKE
1967
Aug
4TG
1951
591
30.3
Petersen Disc (English, Yellow)
20
WHITE HAKE
1967
Aug
4TH
320
75
23.4
Petersen Disc (English, Yellow)
20
WHITE HAKE
1979
Sep
4TG
196
42.0
T-Bar Anchor Tag
*
HALIBUT
1958
Aug
4WJ
20
0.0
Petersen Disc (English, Yellow)
18,69
HALIBUT
1958
Aug
4WL
10
0.0
Petersen Disc (English, Yellow)
18,69
HALIBUT
1958
Sep
4WL
93
33.3
Petersen Disc (English, Yellow)
18,69
HALIBUT
1959
Mar
4WJ
32
66.7
Petersen Disc (English, Yellow)
18,69
HALIBUT
1959
Mar
4WL
19
315.8
Petersen Disc (English, Yellow)
18,69
HALIBUT
1959
Mar
4XN
60
0.0
Petersen Disc (English, Yellow)
18,69
HALIBUT
1959
Sep
4WF
10
0.0
Petersen Disc (English, Yellow)
18,69
HALIBUT
1959
Sep
4WH
10
0.0
Petersen Disc (English, Yellow)
18,69
HALIBUT
1960
Mar
4WH
29
931.0
Petersen Disc (English, Yellow)
18,69
HALIBUT
1960
Mar
4WJ
10
0.0
Petersen Disc (English, Yellow)
18,69
HALIBUT
1962
Feb
5YB
31
33.3
Petersen Disc (English, Yellow)
18,69
HALIBUT
1962
Mar
4VC
466
105
22.5
Petersen Disc (Yellow/Red)
18,69
HALIBUT
1962
Mar
4WG
238
47
19.7
Petersen Disc (Yellow/Red)
18,69

58
Species
Year
Month
NAFO
Area
Number
Released
Number
Recovered
Percent
Recovered
Tags Used
References
HALIBUT
1963
Feb
3OA
21
628.6
Petersen Disc (Yellow/Red)
18,69
HALIBUT
1963
Feb
3OC
35
822.9
Petersen Disc (Yellow/Red)
18,69
HALIBUT
1963
Feb
3OE
10
0.0
Petersen Disc (Yellow/Red)
18,69
HALIBUT
1963
Feb
3PH
28
517.9
Petersen Disc (Yellow/Red)
18,69
HALIBUT
1963
Aug
4XP
93
33.3
Petersen Disc (Yellow/Red)
18,69
HALIBUT
1963
Aug
4XR
32
66.7
Petersen Disc (Yellow/Red)
18,69
HALIBUT
1963
Aug
5YB
52
40.0
Petersen Disc (Yellow/Red)
18,69
HALIBUT
1964
Feb
4VC
139
42
30.2
Petersen Disc (Yellow/Red)
69
HALIBUT
1964
Feb
4WG
18
10
55.6
Petersen Disc (Yellow/Red)
69
HALIBUT
1964
Feb
4WK
10
0.0
Petersen Disc (Yellow/Red)
69
HALIBUT
1964
May
3NE
52
40.0
Petersen Disc (Yellow/Red)
69
HALIBUT
1964
Jun
3NC
10
0.0
Petersen Disc (Yellow/Red)
69
HALIBUT
1964
Jun
3OC
90
0.0
Petersen Disc (Yellow/Red)
69
HALIBUT
1964
Jun
3OD
52
40.0
Petersen Disc (Yellow/Red)
69
HALIBUT
1964
Jun
3OE
13
00.0
Petersen Disc (Yellow/Red)
69
HALIBUT
1964
Jun
3PD
10
0.0
Petersen Disc (Yellow/Red)
69
HALIBUT
1964
Jun
3PE
31
33.3
Petersen Disc (Yellow/Red)
69
HALIBUT
1964
Jun
3PG
61
16.7
Petersen Disc (Yellow/Red)
69
HALIBUT
1964
Jun
4XN
81
12.5
Petersen Disc (Yellow/Red)
69
HALIBUT
1964
Jun
4XP
20
0.0
Petersen Disc (Yellow/Red)
69
HALIBUT
1964
Oct
3OC
10
220.0
Petersen Disc (Yellow/Red)
69
HALIBUT
1964
Oct
3OD
20
0.0
Petersen Disc (Yellow/Red)
69
HALIBUT
1964
Oct
3OE
20
0.0
Petersen Disc (Yellow/Red)
69
HALIBUT
1964
Nov
3NF
10
0.0
Petersen Disc (Yellow/Red)
69
HALIBUT
1965
Jan
3OE
41
25.0
Petersen Disc (Yellow/Red)
69
HALIBUT
1965
Mar
4VC
73
42.9
Petersen Disc (Yellow/Red)
69
HALIBUT
1965
Mar
4VN
11
100.0
Petersen Disc (Yellow/Red)
69
HALIBUT
1965
Mar
4WH
91
11.1
Petersen Disc (Yellow/Red)
69
HALIBUT
1965
Mar
4WJ
20
0.0
Petersen Disc (Yellow/Red)
69
HALIBUT
1965
Mar
4WL
30
0.0
Petersen Disc (Yellow/Red)
69
HALIBUT
1965
Mar
4XM
21
50.0
Petersen Disc (Yellow/Red)
69
HALIBUT
1965
Apr
4WH
72
28.6
Petersen Disc (Yellow/Red)
69
HALIBUT
1965
Apr
4WJ
10
0.0
Petersen Disc (Yellow/Red)
69
HALIBUT
1965
Apr
4XN
30
0.0
Petersen Disc (Yellow/Red)
69
HALIBUT
1965
May
3NC
51
20.0
Petersen Disc (Yellow/Red)
69
HALIBUT
1965
May
3OC
10
110.0
Petersen Disc (Yellow/Red)
69
HALIBUT
1965
May
3OD
22
14.5
Petersen Disc (Yellow/Red)
69
HALIBUT
1965
May
3OE
14
321.4
Petersen Disc (Yellow/Red)
69
HALIBUT
1965
Aug
4XN
22
100.0
Petersen Disc (Yellow/Red)
69
HALIBUT
1966
Feb
4WJ
20
0.0
Petersen Disc (Yellow/Red)
69
HALIBUT
1966
Feb
4WL
72
28.6
Petersen Disc (Yellow/Red)
69
HALIBUT
1966
Mar
4WJ
31
33.3
Petersen Disc (Yellow/Red)
69
HALIBUT
1966
May
3NC
11
100.0
Petersen Disc (Yellow/Red)
69
HALIBUT
1966
May
3NE
20
0.0
Petersen Disc (Yellow/Red)
69
HALIBUT
1966
May
3OD
60
0.0
Petersen Disc (Yellow/Red)
69
HALIBUT
1966
May
3OE
16
16.3
Petersen Disc (Yellow/Red)
69
HALIBUT
1966
Nov
4WJ
10
0.0
Petersen Disc (Yellow/Red)
69
HALIBUT
1966
Nov
4WL
61
16.7
Petersen Disc (Yellow/Red)
69
HALIBUT
1966
Nov
4XN
10
0.0
Petersen Disc (Yellow/Red)
69

59
Species
Year
Month
NAFO
Area
Number
Released
Number
Recovered
Percent
Recovered
Tags Used
References
HALIBUT
1967
May
4VC
10
0.0
Petersen Disc (English, Yellow)
69
HALIBUT
1967
May
4WJ
41
25.0
Petersen Disc (English, Yellow)
69
HALIBUT
1967
Nov
3NC
21
50.0
Petersen Disc (Yellow/Red)
69
HALIBUT
1967
Nov
3NE
20
0.0
Petersen Disc (Yellow/Red)
69
HALIBUT
1967
Nov
3OD
30
0.0
Petersen Disc (Yellow/Red)
69
HALIBUT
1967
Nov
3OE
10
0.0
Petersen Disc (Yellow/Red)
69
HALIBUT
1967
Nov
3PG
32
66.7
Petersen Disc (Yellow/Red)
69
HALIBUT
1967
Dec
3PD
10
0.0
Petersen Disc (Yellow/Red)
69
HALIBUT
1967
Dec
3PG
10
0.0
Petersen Disc (Yellow/Red)
69
HALIBUT
1968
May
3NC
20
0.0
Petersen Disc (Yellow/Red)
69
HALIBUT
1968
May
3OD
11
100.0
Petersen Disc (Yellow/Red)
69
HALIBUT
1968
May
3OE
30
0.0
Petersen Disc (Yellow/Red)
69
HALIBUT
1968
May
3PD
10
0.0
Petersen Disc (Yellow/Red)
69
HALIBUT
1968
May
3PG
22
100.0
Petersen Disc (Yellow/Red)
69
HALIBUT
1972
Apr
4XO
23
313.0
Petersen Disc (English, Yellow)
69
HALIBUT
1973
Jun
4XR
20
0.0
Petersen Disc (Yellow/Red)
69
HERRING
1973
Nov
4XS
3370
113
3.4
T-Bar Anchor Tag
61,63,66,68,70
HERRING
1973
Dec
4XS
8777
184
2.1
T-Bar Anchor Tag
61,63,66,68,70
HERRING
1974
Jun
4XS
3860
213
5.5
T-Bar Anchor Tag
61,63,65,68,70
HERRING
1974
Jul
4XS
8133
614
7.6
T-Bar Anchor Tag
61,63,65,68,70
HERRING
1974
Aug
4XQ
5978
91
1.5
T-Bar Anchor Tag
61,63,65,68,70
HERRING
1974
Aug
4XR
17960
357
2.0
T-Bar Anchor Tag
61,63,65,68,70
HERRING
1976
Jan
4WD
3000
20.1
T-Bar Anchor Tag
66,68
HERRING
1976
Feb
4WD
12692
30.0
T-Bar Anchor Tag
66,68
HERRING
1976
May
4TF
9849
237
2.4
T-Bar Anchor Tag
66,68
HERRING
1976
Aug
4TN
10822
340
3.1
T-Bar Anchor Tag
66,68
HERRING
1976
Sep
4TM
8501
453
5.3
T-Bar Anchor Tag
64,68
HERRING
1976
Sep
4TN
8649
545
6.3
T-Bar Anchor Tag
64,68
HERRING
1977
Jan
4WD
1025
46
4.5
T-Bar Anchor Tag
66,68,72
HERRING
1977
Jun
4XQ
254
15
5.9
T-Bar Anchor Tag
65,66,68
HERRING
1977
Jul
4XS
6541
525
8.0
T-Bar Anchor Tag
66,68
HERRING
1977
Aug
4XO
15984
512
3.2
T-Bar Anchor Tag
65,66,68
HERRING
1977
Aug
4XR
7917
173
2.2
T-Bar Anchor Tag
65,66,68
HERRING
1977
Aug
4XS
15894
3302
20.8
T-Bar Anchor Tag
66,68
HERRING
1977
Sep
4XO
12321
391
3.2
T-Bar Anchor Tag
65,66,68
HERRING
1977
Sep
4XQ
11044
298
2.7
T-Bar Anchor Tag
65,66,68
HERRING
1977
Sep
4XR
7000
127
1.8
T-Bar Anchor Tag
65,66,68
HERRING
1977
Nov
4VN
588
36
6.1
T-Bar Anchor Tag
58,59,65,66,68,71,72
HERRING
1977
Dec
4VN
2494
117
4.7
T-Bar Anchor Tag
58,59,65,66,68,71,72
HERRING
1978
Jan
4WD
4795
607
12.7
T-Bar Anchor Tag
66,68
HERRING
1978
Feb
4XS
50
36.0
T-Bar Anchor Tag
66,68
HERRING
1978
Mar
4XS
3949
32
0.8
T-Bar Anchor Tag
66,68
HERRING
1978
Apr
4XO
9991
40.0
T-Bar Anchor Tag
66,68
HERRING
1978
Jul
4XR
15097
336
2.2
T-Bar Anchor Tag
66,68
HERRING
1978
Aug
4XS
2375
121
5.1
T-Bar Anchor Tag
66,68
HERRING
1978
Oct
4TG
8000
92
1.2
T-Bar Anchor Tag
66
HERRING
1978
Nov
4VN
3178
169
5.3
T-Bar Anchor Tag
58,59,65,66,68,71
HERRING
1978
Nov
4WD
364
33
9.1
T-Bar Anchor Tag
66,68
HERRING
1978
Dec
4VN
816
35
4.3
T-Bar Anchor Tag
58,59,65,66,68,71

60
Species
Year
Month
NAFO
Area
Number
Released
Number
Recovered
Percent
Recovered
Tags Used
References
HERRING
1978
Dec
4WD
3364
288
8.6
T-Bar Anchor Tag
66,68
HERRING
1979
Jan
4WD
299
25
8.4
T-Bar Anchor Tag
68
HERRING
1979
Mar
4XO
10325
93
0.9
T-Bar Anchor Tag
66,68
HERRING
1979
Jun
4XR
9092
618
6.8
T-Bar Anchor Tag
66,68
HERRING
1979
Sep
4XS
2900
70
2.4
T-Bar Anchor Tag
66,68
HERRING
1979
Oct
4XS
2025
43
2.1
T-Bar Anchor Tag
66,68
HERRING
1979
Dec
4VN
4554
504
11.1
T-Bar Anchor Tag
58,65,66,68,71
HERRING
1980
Jan
4VN
6151
577
9.4
T-Bar Anchor Tag
65,66,68,71
HERRING
1980
Apr
4XM
3639
19
0.5
T-Bar Anchor Tag
66,68
HERRING
1980
May
4WD
7286
132
1.8
T-Bar Anchor Tag
66,68
HERRING
1980
Jun
4XO
10036
136
1.4
T-Bar Anchor Tag
66,68
HERRING
1980
Jul
4XR
1025
40
3.9
T-Bar Anchor Tag
66,68
HERRING
1980
Jul
4XS
3708
417
11.3
T-Bar Anchor Tag
66,68
HERRING
1981
Apr
4VN
2225
37
1.7
T-Bar Anchor Tag
68,71
HERRING
1981
May
4VN
750
40.5
T-Bar Anchor Tag
68,71
HERRING
1981
Jul
4XS
9515
144
1.5
T-Bar Anchor Tag
68
HERRING
1981
Sep
4XS
9290
484
5.2
T-Bar Anchor Tag
68
HERRING
1981
Oct
4TG
10298
32
0.3
T-Bar Anchor Tag
66,68
HERRING
1982
Apr
4WD
7117
17
0.2
T-Bar Anchor Tag
68
MACKEREL
1973
Jul
4XS
173
10.6
T-Bar Anchor Tag
1,62
MACKEREL
1973
Oct
4TJ
196
42.0
T-Bar Anchor Tag
1,62
MACKEREL
1973
Oct
4XM
1765
109
6.2
T-Bar Anchor Tag
1,62
MACKEREL
1974
Jul
4VN
3421
11
0.3
T-Bar Anchor Tag
62
MACKEREL
1974
Sep
4TJ
1626
50.3
T-Bar Anchor Tag
62
MACKEREL
1974
Oct
4TJ
800
50.6
T-Bar Anchor Tag
62
MACKEREL
1974
Oct
4XM
4683
44
0.9
T-Bar Anchor Tag
62
PLAICE
1958
Jun
4TL
320
217
67.8
Petersen Disc (Yellow/Red)
8,25,54,55
PLAICE
1958
Oct
4TK
151
11
7.3
Various
8,26,55
PLAICE
1958
Oct
4TN
180
43
23.9
Various
8,26,55
PLAICE
1959
May
4TF
166
91
54.8
Petersen Disc (Yellow/Red)
8,26,55
PLAICE
1959
May
4TG
139
75
54.0
Petersen Disc (Yellow/Red)
8,26,55
PLAICE
1959
May
4TN
151
60
39.7
Petersen Disc (Yellow/Red)
8,26,55
PLAICE
1959
Jun
4TM
167
124
74.3
Petersen Disc (Yellow/Red)
8,26,55
PLAICE
1959
Aug
4TK
107
12
11.2
Dagger Tag
8,26,55
PLAICE
1959
Aug
4TN
150
62
41.3
Dagger Tag
8,26,55
PLAICE
1960
May
4TF
219
63
28.8
Petersen Disc (Yellow/Red)
8,23,55
PLAICE
1960
May
4TK
209
37
17.7
Petersen Disc (Yellow/Red)
8,23,55
PLAICE
1963
Oct
4TF
64
66.7
Petersen Disc (Yellow/Red)
8,23,55
PLAICE
1963
Oct
4TG
217
79
36.4
Petersen Disc (Yellow/Red)
8,23
PLAICE
1963
Oct
4VN
13
430.8
Petersen Disc (Yellow/Red)
8,23
PLAICE
1966
Jun
4XS
121
28
23.1
Petersen Disc (English, Yellow)
?,8
PLAICE
1966
Jul
4XS
27
414.8
Petersen Disc (English, Yellow)
?,8
PLAICE
1966
Aug
4XS
90
0.0
Petersen Disc (Yellow/Red)
?,8
PLAICE
1966
Oct
4XS
23
14.3
Various
?,8
PLAICE
1966
Nov
4XS
20
15.0
Petersen Disc (English, Yellow)
?,8
PLAICE
1972
Apr
4XO
236
22
9.3
Petersen Disc (English, Yellow)
?,8
PLAICE
1973
Jun
4XR
10
0.0
Petersen Disc (Yellow/Red)
?,8
PLAICE
1973
Jun
4XS
13
215.4
Petersen Disc (Yellow/Red)
?,8
PLAICE
1973
Jul
4XS
12
18.3
Petersen Disc (Yellow/Red)
?,8
PLAICE
1979
Feb
4WK
43
49.3
T-Bar Anchor Tag
?,8
PLAICE
1979
Sep
4TG
2075
200
9.6
Various
?,7,8

61
Species
Year
Month
NAFO
Area
Number
Released
Number
Recovered
Percent
Recovered
Tags Used
References
PLAICE
1979
Sep
4TL
1999
52
2.6
Petersen Disc (English, Yellow)
?,8
PLAICE
1980
Feb
4WK
221
31.4
T-Bar Anchor Tag
?,8
PLAICE
1980
Feb
4XM
844
47
5.6
T-Bar Anchor Tag
?,8
PLAICE
1980
May
4TG
499
41
8.2
Petersen Disc (English, Yellow)
?,8
PLAICE
1980
Jun
4TG
1170
107
9.2
Petersen Disc (English, Yellow)
?,8
PLAICE
1984
Aug
4XS
40
0.0
T-Bar Anchor Tag
POLLOCK
1960
Jul
4XS
999
216
21.6
Petersen Disc (English, Yellow)
8,60
POLLOCK
1963
Aug
5YB
82
25.0
Petersen Disc (English, Yellow)
8POLLOCK
1972
Apr
4XO
10
0.0
Petersen Disc (English, Yellow)
8POLLOCK
1978
Jun
4WD
991
186
18.8
T-Bar Anchor Tag
4,8,49,50,51
POLLOCK
1978
Oct
4WK
28
13.6
T-Bar Anchor Tag
4,8,49,50,51
POLLOCK
1978
Nov
4WJ
20
0.0
Petersen Disc (English, Yellow)
4,8,49,50,51
POLLOCK
1979
May
4WD
48
816.7
T-Bar Anchor Tag
4,8,49,50,51
POLLOCK
1979
Jun
4WD
5622
1420
25.3
T-Bar Anchor Tag
4,8,49,50,51
POLLOCK
1979
Jun
4XO
22
313.6
T-Bar Anchor Tag
4,8,49,50,51
POLLOCK
1979
Jun
4XR
39
923.1
T-Bar Anchor Tag
4,8,49,50,51
POLLOCK
1979
Jul
4XR
2313
282
12.2
T-Bar Anchor Tag
4,8,49,50,51
POLLOCK
1979
Aug
4WK
297
12
4.0
T-Bar Anchor Tag
4,8,49,50,51
POLLOCK
1979
Aug
4XR
657
73
11.1
T-Bar Anchor Tag
4,8,49,50,51
POLLOCK
1979
Oct
4XO
151
00.0
T-Bar Anchor Tag
4,8,49,50,51
POLLOCK
1979
Oct
4XR
348
10.3
T-Bar Anchor Tag
4,8,49,50,51
POLLOCK
1979
Nov
4WK
2112
70
3.3
T-Bar Anchor Tag
4,8,49,50,51
POLLOCK
1979
Dec
4XO
111
21.8
T-Bar Anchor Tag
4,8,49,50,51
POLLOCK
1979
Dec
4XR
36
00.0
T-Bar Anchor Tag
4,8,49,50,51
POLLOCK
1980
Jan
4WK
30
0.0
T-Bar Anchor Tag
4,8,49,50,51
POLLOCK
1980
Jan
4XR
200
00.0
T-Bar Anchor Tag
4,8,49,50,51
POLLOCK
1980
Feb
4WK
197
00.0
T-Bar Anchor Tag
4,8,49,50,51
POLLOCK
1980
Feb
4XM
14
00.0
T-Bar Anchor Tag
4,8,49,50,51
POLLOCK
1980
Mar
4WK
99
00.0
T-Bar Anchor Tag
4,8,49,50,51
POLLOCK
1980
Apr
4WK
138
21.4
T-Bar Anchor Tag
4,8,49,50,51
POLLOCK
1980
May
4WD
3000
544
18.1
T-Bar Anchor Tag
4,8,49,50,51
POLLOCK
1980
May
4WK
1632
37
2.3
T-Bar Anchor Tag
4,8,49,50,51
POLLOCK
1980
Jul
4WK
496
15
3.0
T-Bar Anchor Tag
4,8,49,50,51
POLLOCK
1980
Jul
4XM
53
47.5
T-Bar Anchor Tag
4,8,49,50,51
POLLOCK
1980
Jul
4XR
691
71.0
T-Bar Anchor Tag
4,8,49,50,51
POLLOCK
1980
Aug
4XO
180
84.4
T-Bar Anchor Tag
4,8,49,50,51
POLLOCK
1980
Aug
4XQ
60
0.0
T-Bar Anchor Tag
4,8,49,50,51
POLLOCK
1980
Sep
4XR
1497
22
1.5
T-Bar Anchor Tag
4,8,49,50,51
POLLOCK
1980
Nov
4XO
2496
94
3.8
T-Bar Anchor Tag
4,8,49,50,51
POLLOCK
1980
Dec
4XS
1996
90.5
T-Bar Anchor Tag
4,8,49,50,51
POLLOCK
1981
May
4WD
3013
266
8.8
T-Bar Anchor Tag
4,8,49,50,51
POLLOCK
1981
Aug
4XR
300
51.7
T-Bar Anchor Tag
4,8,49,50,51
POLLOCK
1981
Oct
4XO
3919
1524
38.9
T-Bar Anchor Tag
4,8,49,50,51
POLLOCK
1981
Oct
4XS
800
20.3
T-Bar Anchor Tag
4,8,49,50,51
POLLOCK
1982
May
4WD
3993
244
6.1
T-Bar Anchor Tag
4,8,49,50,51
POLLOCK
1982
May
4XS
3999
182
4.6
T-Bar Anchor Tag
4,8,49,50,51
POLLOCK
1982
Aug
3PN
312
35
11.2
T-Bar Anchor Tag
4,8,49,50,51
POLLOCK
1983
May
4WD
2381
45
1.9
T-Bar Anchor Tag
4,8,49,50,51
POLLOCK
1983
May
4XS
2297
37
1.6
T-Bar Anchor Tag
4,8,49,50,51
POLLOCK
1983
Jun
4WD
2750
110
4.0
T-Bar Anchor Tag
4,8,49,50,51

62
Species
Year
Month
NAFO
Area
Number
Released
Number
Recovered
Percent
Recovered
Tags Used
References
POLLOCK
1983
Jun
4XS
2627
29
1.1
T-Bar Anchor Tag
4,8,49,50,51
POLLOCK
1984
Jun
4XS
3998
221
5.5
T-Bar Anchor Tag
4,8,49,50,51
POLLOCK
1984
Aug
4XS
10
0.0
T-Bar Anchor Tag
4,8,49,50,51
SEA RAVEN
1979
Jan
4WK
10
0.0
T-Bar Anchor Tag
SEA RAVEN
1979
Feb
4WK
20
0.0
T-Bar Anchor Tag
SEA RAVEN
1980
Feb
4XM
17
00.0
T-Bar Anchor Tag
THORNY SKATE
1979
Feb
4WK
12
00.0
T-Bar Anchor Tag
THORNY SKATE
1980
Feb
4WK
10
0.0
T-Bar Anchor Tag
THORNY SKATE
1980
Feb
4XM
38
00.0
T-Bar Anchor Tag
WINTER FLOUNDER
1971
Jun
4XS
10
110.0
Petersen Disc (Yellow/Red)
*WINTER FLOUNDER
1973
Jun
4XS
21
29.5
Petersen Disc (Yellow/Red)
*
WINTER FLOUNDER
1973
Jul
4XS
13
215.4
Petersen Disc (Yellow/Red)
*WINTER FLOUNDER
1979
Jan
4WK
29
13.4
T-Bar Anchor Tag
*WINTER FLOUNDER
1979
Feb
4WK
221
73.2
T-Bar Anchor Tag
*WINTER FLOUNDER
1980
Feb
4WK
96
11.0
T-Bar Anchor Tag
*WINTER FLOUNDER
1980
Feb
4XM
13
215.4
T-Bar Anchor Tag
*WINTER FLOUNDER
1984
Aug
4XS
427
61.4
T-Bar Anchor Tag
*
WINTER FLOUNDER
1985
Jan
4XS
13
00.0
T-Bar Anchor Tag
*WINTER FLOUNDER
1985
Nov
4XS
404
15
3.7
T-Bar Anchor Tag
*WINTER FLOUNDER
1985
Dec
4XS
163
00.0
T-Bar Anchor Tag
*WITCH FLOUNDER
1963
Oct
4TF
13
323.1
Petersen Disc (Yellow/Red)
*,56
WITCH FLOUNDER
1963
Oct
4TG
121
12
9.9
Petersen Disc (Yellow/Red)
*,56
WITCH FLOUNDER
1963
Oct
4VN
190
24
12.6
Petersen Disc (Yellow/Red)
*,56
WITCH FLOUNDER
1964
Jan
4VN
703
11
1.6
Petersen Disc (Yellow/Red)
*,56
WITCH FLOUNDER
1964
Feb
4WD
725
91.2
Petersen Disc (Yellow/Red)
*,56
WITCH FLOUNDER
1964
Oct
4VB
191
21.0
Petersen Disc (Yellow/Red)
*,56
WITCH FLOUNDER
1965
Mar
4VC
204
14
6.9
Petersen Disc (Yellow/Red)
*,12,56
WITCH FLOUNDER
1965
Apr
4WH
491
59
12.0
Petersen Disc (Yellow/Red)
*,12,56
WITCH FLOUNDER
1966
Jul
4XS
11
100.0
Petersen Disc (English,Yellow)
*WITCH FLOUNDER
1972
Apr
4XO
16
00.0
Petersen Disc (English,Yellow)
*WITCH FLOUNDER
1973
Jun
4XR
40
0.0
Petersen Disc (Yellow/Red)
*
WITCH FLOUNDER
1973
Jun
4XS
38
12.6
Petersen Disc (Yellow/Red)
*WITCH FLOUNDER
1973
Jul
4XS
24
00.0
Petersen Disc (Yellow/Red)
WITCH FLOUNDER
1984
Aug
4XS
10
0.0
T-Bar Anchor Tag
WINDOWPANE FLOUNDER
1984
Aug
4XS
28
00.0
T-Bar Anchor Tag
WINTER SKATE
1980
Feb
4XM
12
00.0
T-Bar Anchor Tag
YELLOWTAIL FLOUNDER
1966
Jun
4WE
36
12.8
Petersen Disc (Yellow/Red)
*YELLOWTAIL FLOUNDER
1966
Jun
4WH
57
00.0
Petersen Disc (Yellow/Red)
*YELLOWTAIL FLOUNDER
1966
Jul
4WE
499
51
10.2
Petersen Disc (Yellow/Red)
*YELLOWTAIL FLOUNDER
1966
Jul
4WH
504
29
5.8
Petersen Disc (Yellow/Red)
*
YELLOWTAIL FLOUNDER
1966
Sep
4VC
1408
112
8.0
Petersen Disc (English,Yellow)
*YELLOWTAIL FLOUNDER
1966
Sep
4WG
90
00.0
Petersen Disc (English,Yellow)
*YELLOWTAIL FLOUNDER
1967
May
4WH
40
37.5
Petersen Disc (English,Yellow)
*YELLOWTAIL FLOUNDER
1967
May
4WJ
412
53
12.9
Petersen Disc (English,Yellow)
*YELLOWTAIL FLOUNDER
1972
Apr
4XO
11
100.0
Petersen Disc (English,Yellow)
*YELLOWTAIL FLOUNDER
1979
Jan
4WK
51
20.0
T-Bar Anchor Tag
*
YELLOWTAIL FLOUNDER
1979
Feb
4WK
30
0.0
T-Bar Anchor Tag
*YELLOWTAIL FLOUNDER
1980
Feb
4WK
90
0.0
T-Bar Anchor Tag
*YELLOWTAIL FLOUNDER
1980
Feb
4XM
30
0.0
T-Bar Anchor Tag
*YELLOWTAIL FLOUNDER
1984
Aug
4XS
42
00.0
T-Bar Anchor Tag
YELLOWTAIL FLOUNDER
1985
Nov
4XS
27
00.0
T-Bar Anchor Tag
YELLOWTAIL FLOUNDER
1985
Dec
4XS
47
00.0
T-Bar Anchor Tag

63
Appendix B
Maps of the release locations of the tagging activities described in this document. The
numbers of fish tagged and the month(s) and year of release are given for each release
location. In many cases several discrete releases of close geographic proximity and/or size
range of fish were combined. The shaded areas depicting release locations were created by
drawing freehand polygons around discrete release coordinates documented in the database
that had some association in terms of date or tagging trip. Hence they encompass the
geographic areas of the releases, resulting in various shapes; they are not scaled to represent
the numbers tagged (thus a large polygon represents a dispersed tagging event, not
necessarily a large number of fish tagged).
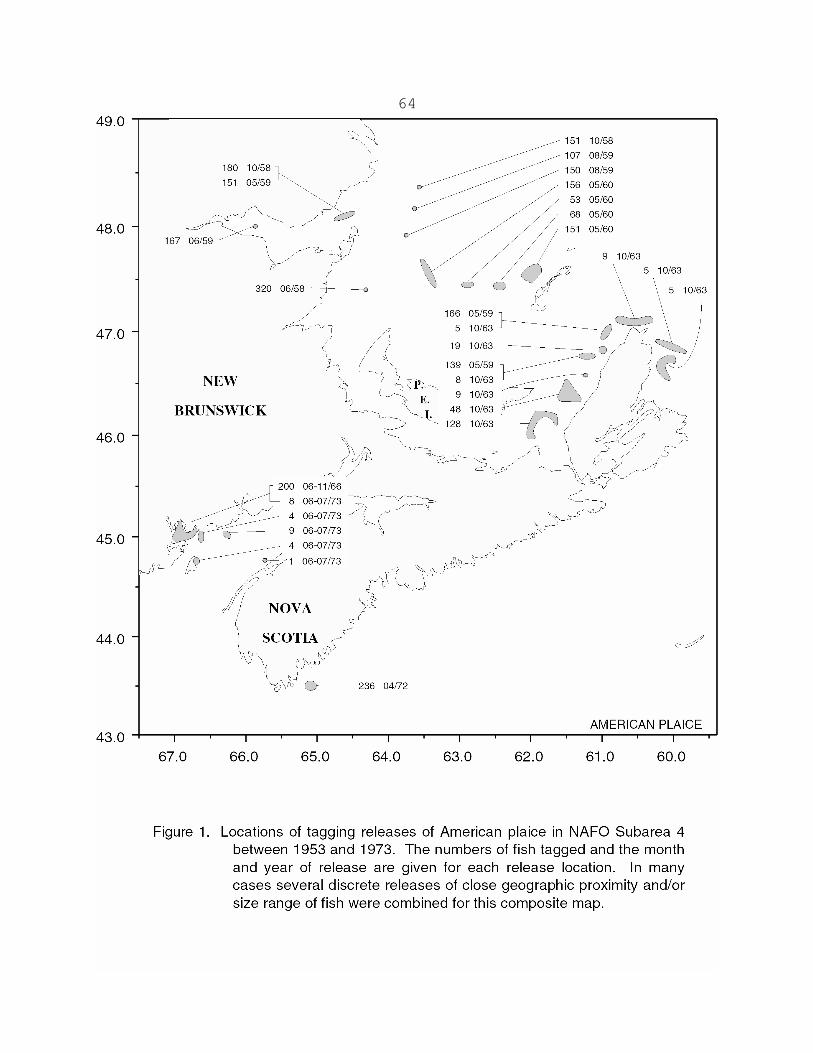
64

65

66

67

68

69

70

71

72

73
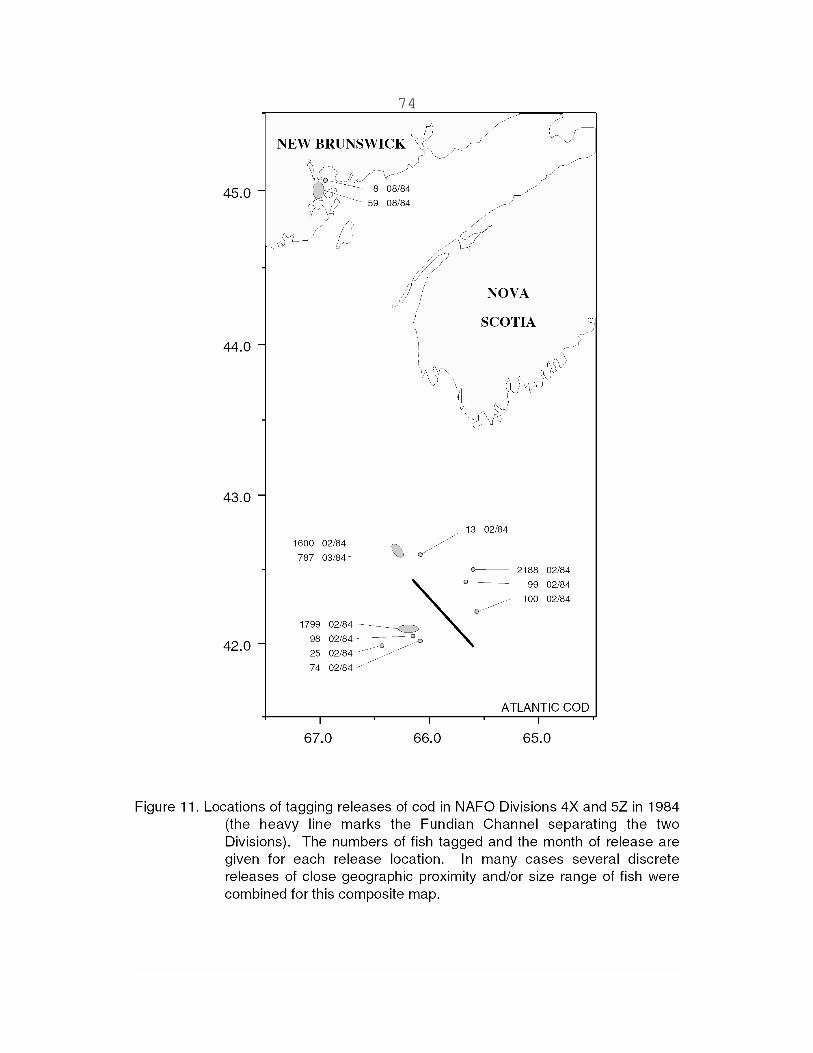
74

75

76

77

78

79

80

81

82

83

84
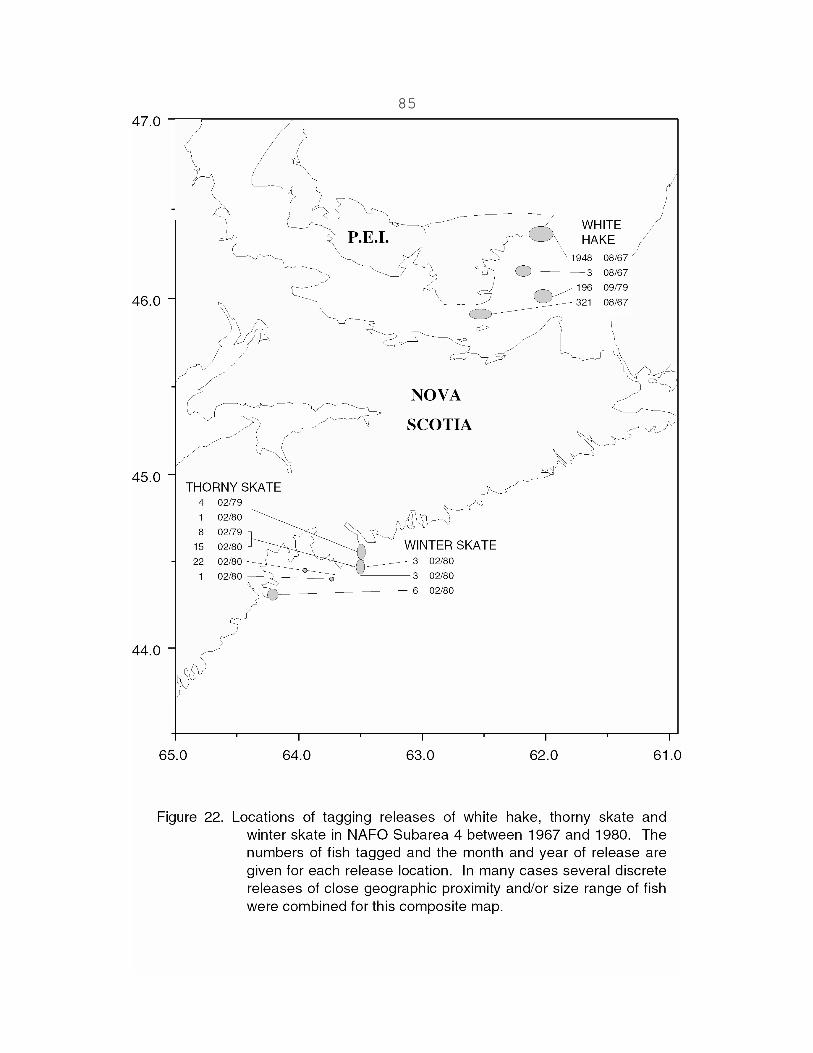
85
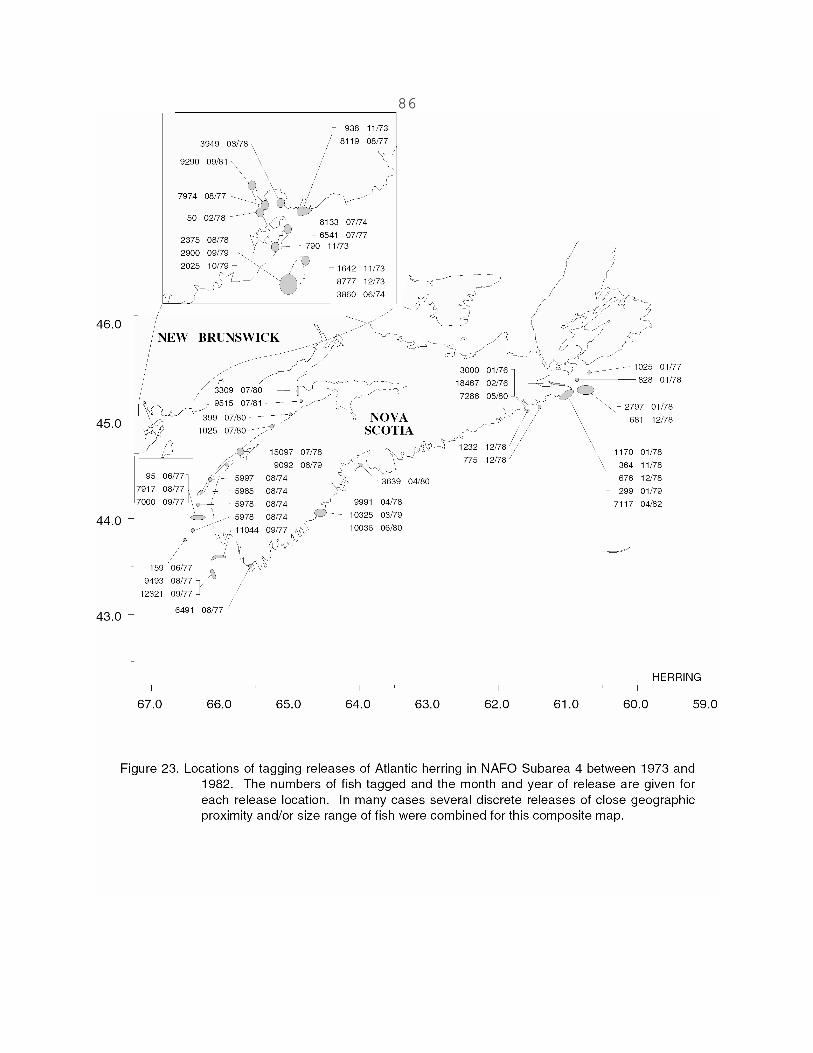
86

87

88
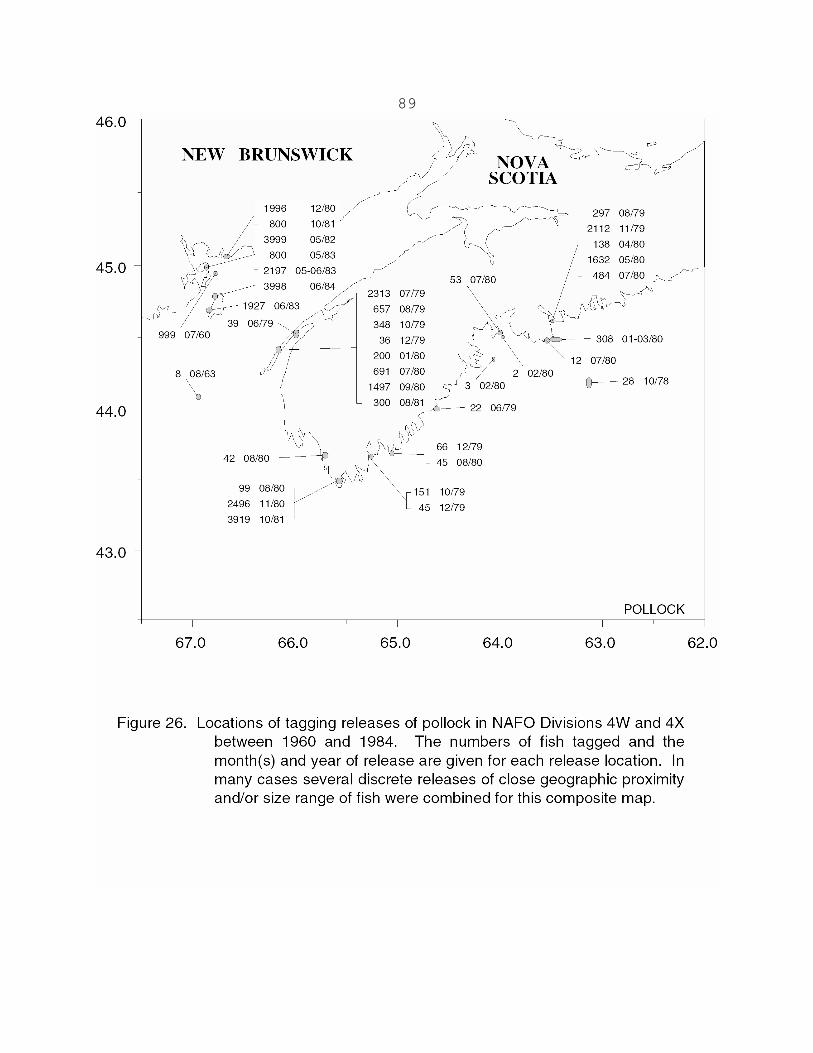
89

90

91

92

93

94

95
Appendix C
Summary of length at release information contained in the database provided as
modal length and 5th and 95th percentile lengths. Individual release lengths are given in the
database. Measurements are fork or total length as appropriate due to the shape of the
caudal fin of the species tagged (forked or rounded). This tabulation complements the
tagging activities presented in Appendix A, but tagging events that are felt to be closely
associated (based on objectives, proximity in timing and location, and similarity in length
composition) have been combined. As well, no summaries are provided for releases that
measured fewer than 100 fish. The months and NAFO areas indicate where grouping has
occurred, and facilitate linking the length data summaries to the more detailed breakdown of
Appendix A. Note that Number Measured will often be less than the corresponding Number
Released of Appendix A due to fish tagged but not measured.

96
Species
Year
Months
NAFO Areas
Number
Measured
5th
Percentile
Mode
95th
Percentile
CATFISH
1963
May-Jun
4XQ,4XR
111
84
90
105
COD
1953
May-O
ct
4XO
1646
43
57
94
COD
1954
Jun-Jul
4VB,4VN
794
50
57
91
COD
1954
Jun-A
ug
4WD,4WK
478
49
52
97
COD
1955
Jun-Sep
4TL,4TM,4TN
3807
48
54
77
COD
1956
May-A
ug
4TF,4TG,4VN
726
46
53
80
COD
1956
May-A
ug
4TK,4TL,4TN
1973
46
60
88
COD
1957
Jul-Aug
4TF
1193
48
70
89
COD
1958
May
4TF
888
52
90
100
COD
1958
Jun
4TL,4TN
1037
32
43
48
COD
1958
Oct
4TL,4TN
721
40
49
54
COD
1959
Mar-Sep
4WF,4WH,4WJ,
4WL,4XN
180
46
59
71
COD
1959
Mar
4VC
425
51
61
94
COD
1959
Aug-Sep
4TN
1957
48
56
79
COD
1960
Mar
4WH,4WJ
499
49
60
77
COD
1960
Feb
4VN
900
48
50
74
COD
1960
Aug-O
ct
4TN
1668
43
54
68
COD
1961
Oct
4SZ
1457
51
58
75
COD
1961
Sep
4TN
1769
44
50
69
COD
1962
Apr
4VN
492
47
50
63
COD
1964
May
4SY,4SZ
860
41
46
66
COD
1964
May
4TK
976
40
44
63
COD
1966
May
4XS
493
35
36
77
COD
1969
Jun
4XN,4XO,4XP
105
48
58
82
COD
1969
Jan
4VN
1005
40
47
59

97
Species
Year
Months
NAFO Areas
Number
Measured
5th
Percentile
Mode
95th
Percentile
COD
1972
Apr
4XO
138
47
54
108
COD
1973
Jun-Jul
4XR,4XS
592
42
76
93
COD
1978
Oct-N
ov
4WE
6008
41
51
60
COD
1979
Jan-Feb
4WK
579
31
52
70
COD
1979
Apr
4VC
4283
40
57
77
COD
1979
Sep
4TG
1989
36
50
100
COD
1979
Sep
4TL
1955
33
41
61
COD
1979
Jun
4XO
694
25
50
60
COD
1979
Jun
4XR
141
27
38
46
COD
1980
May-Jun
4TG
297
33
43
89
COD
1980
Nov-D
ec
4TG
4862
35
48
57
COD
1980
Feb-M
ay
4WK,4XM
904
25
50
69
COD
1980
Sep-O
ct
4VN
5762
36
50
68
COD
1981
Sep
4WF,4WH
2397
34
43
56
COD
1981
Apr
4TG
3532
33
38
58
COD
1981
Apr-May
4VC
4446
38
43
50
COD
1984
Feb-M
ar
4XP
4766
50
66
101
COD
1984
Feb
5ZJ
1988
40
54
95
COD
1985
Jan-D
ec
4XS,4XR,5YB
2322
37
40
74
COD
1985
Feb
4XP
1621
57
80
101
COD
1985
Mar
4XP
4363
52
70
97
COD
1985
Mar
5ZJ
1050
41
72
105
HADDOCK
1953
May-O
ct
4XO
537
41
49
63
HADDOCK
1956
Sep-O
ct
4TG,4TH
995
45
50
58
HADDOCK
1957
Mar-A
pr
4XN,4XO,4XP
1080
44
48
61
HADDOCK
1957
Oct-N
ov
4XS
813
41
50
59
HADDOCK
1957
Dec
4XO
267
43
51
62

98
Species
Year
Months
NAFO Areas
Number
Measured
5th
Percentile
Mode
95th
Percentile
HADDOCK
1959
Mar-Sep
4WJ,4WL,4WH,
4XN
576
43
55
64
HADDOCK
1959
Sep
4WF
147
39
40
54
HADDOCK
1960
Mar
4WH
597
43
54
65
HADDOCK
1963
Nov
4XR
648
46
52
61
HADDOCK
1966
Oct
4XR,4XS
316
37
41
49
HADDOCK
1969
Jun
4XN,4XO,4XP
251
42
50
62
HADDOCK
1971
Mar
4XP
898
52
61
71
HADDOCK
1973
Jun
4XR,4XS
238
43
53
68
HADDOCK
1978
Nov
4WJ,4WL
135
31
34
56
HADDOCK
1980
Feb
4WK,4XM
141
12
17
33
HADDOCK
1982
Jun
4XR
2972
25
33
38
HADDOCK
1983
Mar-A
pr
4XP
716
34
41
68
HADDOCK
1983
Apr
4XN
2831
38
54
68
HADDOCK
1984
Feb-M
ar
4XN,4XP
10862
43
54
66
HADDOCK
1984
Feb-M
ar
5ZJ,5ZM
3188
48
56
73
HADDOCK
1985
Mar-A
pr
4XN,4XP
12175
40
50
63
HADDOCK
1985
Mar
5ZJ
2942
43
58
74
HADDOCK
1985
Jul
4XR
134
36
41
54
HADDOCK
1985
Jul
4XS,5YB
349
40
45
60
WHITE HAKE
1967
Aug
4TG,4TH
2246
48
64
77
WHITE HAKE
1979
Sep
4TG
193
44
55
63
HALIBUT
1962
Feb-M
ar
4VC,4WG
675
45
53
98
HALIBUT
1964
Feb
4VC,4WG
151
41
44
101
PLAICE
1958
Jun
4TL
319
31
41
51
PLAICE
1958
Oct
4TK,4TN
326
22
28
46
PLAICE
1959
May
4TF,4TG
299
27
37
58
PLAICE
1959
May-Jun
4TN,4TM
316
30
36
54

99
Species
Year
Months
NAFO Areas
Number
Measured
5th
Percentile
Mode
95th
Percentile
PLAICE
1959
Aug
4TK,4TN
254
33
42
50
PLAICE
1960
May
4TF,4TK
414
32
35
65
PLAICE
1963
Oct
4TF,4TG,4VN
222
32
36
50
PLAICE
1966
Jun-N
ov
4XS
192
23
31
40
PLAICE
1972
Apr
4XO
235
32
34
59
PLAICE
1979
Sep
4TG
2073
27
34
47
PLAICE
1979
Sep
4TL
1997
27
40
50
PLAICE
1980
Feb
4WK,4XM
1055
15
23
38
PLAICE
1980
May-Jun
4TG
1666
25
31
51
POLLOCK
1960
Jul
4XS
987
61
68
82
POLLOCK
1978
Jun
4WD
980
29
31
38
POLLOCK
1979
May-Jun
4WD
5656
32
39
43
POLLOCK
1979
Aug-N
ov
4WK
2118
14
16
34
POLLOCK
1979
Jun-D
ec
4XO
280
13
14
26
POLLOCK
1979
Jun-A
ug
4XR
648
24
27
38
POLLOCK
1979
Oct-D
ec
4XR
384
16
18
32
POLLOCK
1980
May
4WD
3000
20
20
23
POLLOCK
1980
Jan-M
ay
4WK
1003
16
19
22
POLLOCK
1980
Jan
4XR
198
14
16
17
POLLOCK
1981
May
4WD
3006
25
27
31
POLLOCK
1981
Oct
4XO
3915
17
27
29
POLLOCK
1981
Oct
4XS
182
15
16
22
POLLOCK
1982
May
4WD
3993
21
32
35
POLLOCK
1982
May
4XS
3990
17
20
23
POLLOCK
1983
May-Jun
4WD
5130
22
24
34
POLLOCK
1983
May-Jun
4XS
4921
18
18
21
POLLOCK
1984
Jun
4XS
3998
23
26
32
WIN
TER FLOUNDER
1979
Jan-Feb
4WK
249
26
35
41

100
Species
Year
Months
NAFO Areas
Number
Measured
5th
Percentile
Mode
95th
Percentile
WIN
TER FLOUNDER
1980
Feb
4WK,4XM
106
26
34
42
WIN
TER FLOUNDER
1984
Aug
4XS
427
23
32
41
WIN
TER FLOUNDER
1985
Nov-D
ec
4XS
567
26
30
38
WITCH FLOUNDER
1963
Oct
4TF,4TG
130
30
34
57
WITCH FLOUNDER
1963
Oct
4VN
187
31
37
55
WITCH FLOUNDER
1964
Jan
4VN
701
38
49
59
WITCH FLOUNDER
1964
Oct
4VB
191
40
44
59
WITCH FLOUNDER
1964
Feb
4WD
723
36
43
57
WITCH FLOUNDER
1965
Mar
4VC
203
34
41
56
WITCH FLOUNDER
1965
Apr
4WH
489
34
44
55
YELLOWTAIL
FLOUNDER
1966
Jun-Sep
4WE,4WH
1091
31
32
42
YELLOWTAIL
FLOUNDER
1966
Sep
4WG,4VC
1491
29
33
47
YELLOWTAIL
FLOUNDER
1967
May
4WH,4WJ
451
29
34
45

101
Appendix D
Length frequency samples of juvenile (harbour) pollock tagged between 1978 and 1984, and
of herring tagged between 1973 and 1982. All of the herring and a significant number of the
pollock tagged and released during these tagging events were unmeasured. Hence the sample
length frequency data presented in this appendix are not available in the tagging database.
Both pollock and herring were measured to the nearest centimeter, however the pollock were
subsequently binned to 3 cm increments for brevity. The large number of measured herring
is a result of the tagging project protocol in which herring were tagged from successive
commercial purse seine sets each night of several fishing vessels; only small numbers were
tagged from each set in order to not impede the commercial operation. A length frequency
subsample was taken from each set from which herring were tagged; the length frequencies
were then grouped by time period and unit area for brevity in this report.

102
POLLOCK
4Xs 5Yb 4Wd 4Wk
1960 1963 1978 1978Length JUL AUG JUN OCT
22 2
25 18
28 171
31 501
34 188
37 82
40 17 2
43 1 1
46 4
49 7
52 4 555 4 2
58 30 5
61 73
64 124 1 2
67 188 1
70 212
73 153 2
76 97 2
79 58 2
82 42
85 11
88 3
POLLOCK
4Wd 4Xo 4Xr 4Xr 4Xr 4Wk 4Xo 4Xr 4Wk 4Xo 4Xr
1979 1979 1979 1979 1979 1979 1979 1979 1979 1979 1979Length MAY JUN JUN JUL AUG AUG OCT OCT NOV DEC DEC
10 6 11
13 98 55 2 324 22 516 9 60 186 1053 40 23
19 33 1 21 63 250 42 8
22 150 5 64 2 1 1 12 5
25 65 13 1 338 12 4 7 4
28 17 1 97 59 54 38 30 131 124 4 29 56 43 95
34 959 2 3 1 13 7 83
37 2104 1 14 1 1 15
40 1782 10 1 1 1
43 380 1 2
46 36 1 249 3 1 2
52 2 1
61 1
82 1
85 894 1

103
POLLOCK
4Xr 4Wk 4Xm 4Wk 4Wk 4Wd 4Xo
1980 1980 1980 1980 1980 1980 1980Length JAN JAN FEB MAR MAY MAY AUG
13 79 14 1 2 1 11
16 118 198 3 84 118
19 1 77 7 46 374 199022 2 1 2 80 988
25 1 4 20
28 1 1
37 1
49 1 POLLOCK
4Wd 4Xr 4Xo 4Xs 4Wd 4Xs 4Wd 4Xs 4Xs
1981 1981 1981 1981 1982 1982 1983 1983 1984Length MAY AUG OCT OCT MAY MAY MAY MAY JUN
13 29 31
16 337 104 856 262619 2 157 38 370 2393 144 2098 59
22 4 12 202 7 634 686 1860 192 672
25 1710 53 2131 1 625 52 1017 7 1880
28 1117 29 995 1 714 2 1046 1002
31 158 3 64 1065 796 293
34 15 2 471 204 78
37 100 53 14
40 13 843 1 1
46 1

104
HERRING
4Xs 4Xq 4Xr 4Xs 4Tf 4Tm 4Tn 4Wd
1973 1974 1974 1974 1976 1976 1976 1976Length NOV-DEC AUG AUG JUN-JUL MAY SEP AUG-SEP FEB
10
11 11
12 11
13 32
14 127 64
15 96
16 43 122
17 42 1207 27
18 448 352 201
19 880 55 449 28 873
20 477 55 630 3706
21 202 55 546 106 2698
22 177 55 554 247 746
23 376 543 176 32 451
24 418 49 1027 459 57 72
25 836 329 99 1513 2696 1001 5326 1506 165 607 1269 17 3352 4978 23
27 753 439 1827 644 17 940 3873
28 84 1700 3240 748 75 144 1884
29 42 2194 5279 566 462 101 739
30 42 823 3672 214 1471 133 589
31 110 746 13 2121 20 309
32 629 853 33 667
33 541 489 71 585
34 906 1133 222
35 365 971 5 176
36 523 170
37 90 112
38 59
39 91
40
41
42

105
HERRING
4Wd 4Vn 4Xq 4Xs 4Xo 4Xr
1977 1977 1977 1977 1977 1977Length JAN NOV-DEC JUN-SEP JUL-AUG AUG-SEP AUG-SEP
10 67
11 100
12 67
13
14
15 344
16 1440
17 2599 197
18 2505 197
19 1522 98
20 499
21 735 101
22 38 325 98 56
23 10 113 147 101
24 10 6 38 288 89
25 78 6 670 19726 130 38 723 326 6
27 219 8 143 560 2954 223
28 193 24 1158 993 4857 678
29 125 73 1335 1672 5589 1555
30 42 144 525 1107 2596 1504
31 83 349 581 559 2459 1631
32 47 370 1084 794 2220 2855
33 52 364 1149 656 1662 3735
34 16 370 724 155 439 1578
35 10 439 38 9 128 436
36 5 455 70 14 78
37 5 197 56
38 138 18
39 71 56
40 27
41 6
42

106
HERRING
4Wd 4Xo 4Xr 4Xs 4Tg 4Vn 4Wd
1978 1978 1978 1978 1978 1978 1978-79Length JAN APR JUL AUG OCT NOV-DEC NOV-DEC/78 + JAN/79
10 178 67
11 870 179
12 1015 548
13 1419 2117
14 1577 2125
15 1845 1020
16 1647 1078 40
17 569 1125 24 7
18 189 770 217 14
19 47 785 14 354 21
20 18 617 85 361 9
21 12 102 422 28 241 23
22 41 214 82 85 304 4
23 59 123 157 254 314 14 81
24 95 132 187 339 990 7 45
25 80 47 63 396 1846 43 226 120 144 509 1082 21 17
27 231 46 495 533 21 32
28 693 55 113 588 51 97
29 1093 142 28 376 199 110
30 732 527 14 282 250 187
31 443 734 141 141 200
32 356 644 14 188 153 493
33 272 470 47 267 565
34 171 570 47 363 708
35 119 196 466 747
36 138 30 473 440
37 69 16 690 171
38 33 267 79
39 32 100 17
40 6 74 12
41 1 6
42
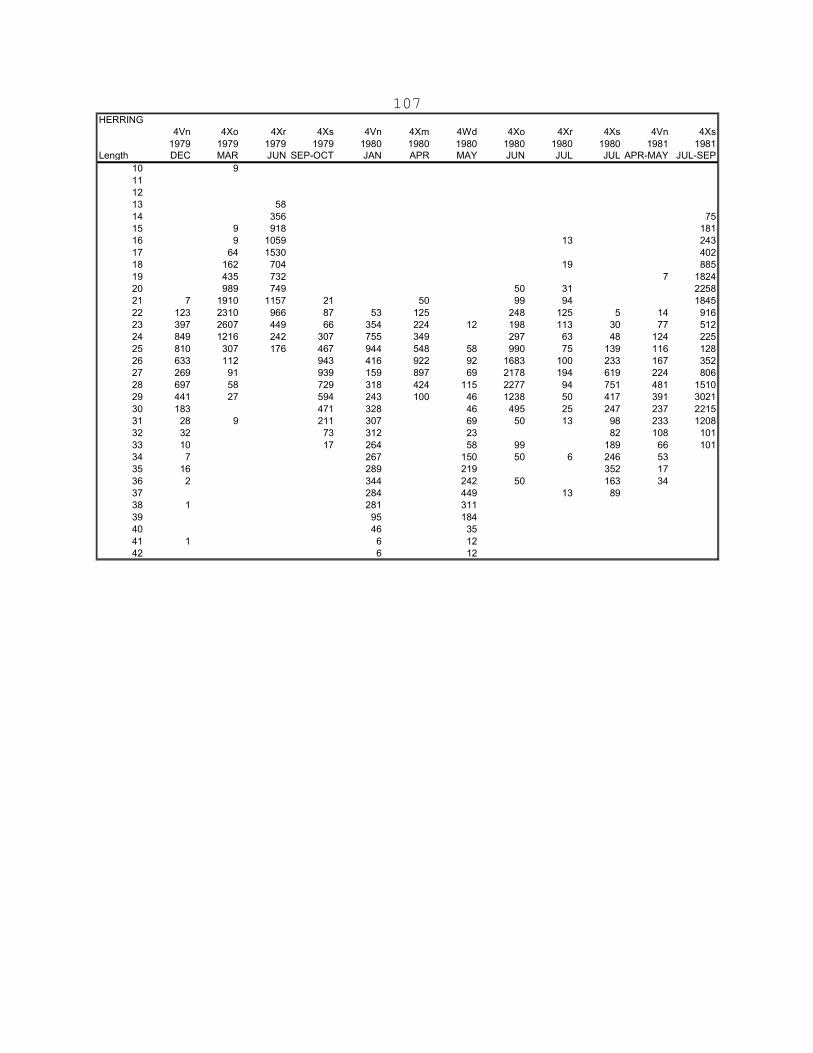
107
HERRING4Vn 4Xo 4Xr 4Xs 4Vn 4Xm 4Wd 4Xo 4Xr 4Xs 4Vn 4Xs
1979 1979 1979 1979 1980 1980 1980 1980 1980 1980 1981 1981Length DEC MAR JUN SEP-OCT JAN APR MAY JUN JUL JUL APR-MAY JUL-SEP
10 9
111213 58
14 356 7515 9 918 18116 9 1059 13 243
17 64 1530 40218 162 704 19 885
19 435 732 7 182420 989 749 50 31 225821 7 1910 1157 21 50 99 94 1845
22 123 2310 966 87 53 125 248 125 5 14 91623 397 2607 449 66 354 224 12 198 113 30 77 51224 849 1216 242 307 755 349 297 63 48 124 225
25 810 307 176 467 944 548 58 990 75 139 116 12826 633 112 943 416 922 92 1683 100 233 167 35227 269 91 939 159 897 69 2178 194 619 224 806
28 697 58 729 318 424 115 2277 94 751 481 151029 441 27 594 243 100 46 1238 50 417 391 3021
30 183 471 328 46 495 25 247 237 221531 28 9 211 307 69 50 13 98 233 120832 32 73 312 23 82 108 101
33 10 17 264 58 99 189 66 10134 7 267 150 50 6 246 5335 16 289 219 352 17
36 2 344 242 50 163 3437 284 449 13 8938 1 281 311
39 95 18440 46 35
41 1 6 1242 6 12

108
109
Appendix E
Current and historical formats of the tagging data described in this document. The historical
formats provide insights into the types of information that were collected in the past relative
to recent or current tagging programs, providing some context for the various tagging
studies. This also gives an appreciation for variables that exist in the current database
design, yet can be expected to have no data from earlier programs. Details associated with
data quality and characteristics are presented in the format descriptions of the original
databases. It is hoped that keeping these descriptions separate reduces potential for
confusion.

110
1953-73 Groundfish Tagging Data Format
Field No.
Column No.
No. of Columns
Items
Code
RELEASE INFORMATION
1 1 1 Vessel Identifier A = A.T. Cameron (1-100) B = A.T. Cameron (101+) D = Dover H = Harengus I = Investigator M = Mallotus P = E.E. Prince
A, B, D, H, I, M, P, blank
2 2-3 2 Cruise Number 01-99, blank
Fields 1 and 2 combined form an alphanumeric code
representing a vessel and sequential cruise number. This field is often blank, usually in association with handlined fish.
3 4-5 2 Release Month 01-12
4 6-7 2 Release Year 53-73
5 8-9 2 Station Number 01-99, blank
6 10-11 2 Set Number 01-99, blank
Fields 5 and 6 rarely recorded.
7 12-15 4 Latitude (DEG/MIN) 00-99/00-59
8 16-19 4 Longitude (DEG/MIN) 00-99/00-59
9 20 1 NAFO Subarea 1-6
10 21 1 Division A-Z
11 22 1 Unit Area A-Z
12 23-25 3 Depth (FM) 000-999

111
1953-73 Groundfish Tagging Data Format
Field No.
Column No.
No. of Columns
Items
Code
13 26-27 2 Method of Capture 01 = otter trawl (36,453 releases) 02 = longline (616 releases) 03 = handline (10,084 releases) 07 = cod trap (838 releases) 10 = other (81 releases)
01-10
14 28-30 3 Species - wolffish - cod - haddock - hake - plaice - pollock - Greenland halibut - winter flounder - witch - yellowtail - halibut
CAT
COD
HAD
HAK
PLA
POL
TUR
WIN
WIT
YEL
HAL
15 31-33 3 Fish Length (CM) 000-999, blank
Rarely blank. Note for plaice the implicit existence
of a decimal place between the last and second-last digits. All other species were measured to whole numbers.
16 34-38 5 Tag Number variable
Unique to each individual fish.

112
1953-73 Groundfish Tagging Data Format
Field No.
Column No.
No. of Columns
Items
Code
17 39-41 3 Tag Type - Engl. disc with flag - Engl. yellow Peterson disc - French yellow Peterson disc - yellow/red disc - Engl. disc with Fr. backing disc - Lea hydrostatic - red & white Peterson disc - strap flag - spaghetti tag - dagger tag
YNF YDN YDF YDR YEF
OLH ORD OSR OSP ODG
18 42-44 3 Type of Attachment - stainless steel wire - stainless steel loop - nylon loop - stainless steel pin - single knot - double knot - operculum - dorsum - double twist wire
SSW SSL ONL SSP OSK ODK OPE DOR DTW

113
1953-73 Groundfish Tagging Data Format
Field No.
Column No.
No. of Columns
Items
Code
The following table summarizes the tags/attachment methods applied:
TAG TYPE ATTACHMENT METHOD NUMBER APPLIED ODG DOR 159 ODG OPE 55 ODG SSW 158 OLH ONL 1206 OLH SSL 493 OLH SSW 2566 ORD SSW 1382 OSP ODK 124 OSP OSK 1674 OSR 382 YDF SSW 3784 YDN SSP 2149 YDN SSW 21933 YDR DTW 198 YDR SSP 462 YDR SSW 6234 YEF SSW 4063 YNF SSP 1050

114
1953-73 Groundfish Tagging Data Format
Field No.
Column No.
No. of Columns
Items
Code
RECOVERY INFORMATION N.B.: Any of the following fields can be blank (all will be
blank if the fish was never recovered). Where recovery data exists at all, any blanks mean unknown or inapplicable.
19 45-46 2 Month of Recovery 00-12
20 37-48 2 Year of Recovery 53-99
21 49-50 2 Method of Capture blank = unknown (1,563 recoveries) 01 = otter trawl (5,877 recoveries) 02 = longline (1,418 recoveries) 03 = handline (862 recoveries) 04 = Danish seine (187 recoveries) 05 = Pair trawl (55 recoveries) 06 = gill net (457 recoveries) 07 = cod trap (40 recoveries) 08 = hook (540 recoveries) 09 = scallop drag (5 recoveries) 10 = other (86 recoveries)
01-10
22 51-54 4 Latitude (DEG/MIN) 00-99/00-59
23 55-58 4 Longitude (DEG/MIN) 00-99/00-59
24 59 1 NAFO Subarea 1-6
25 60 1 NAFO Division A-Z
26 61 1 NAFO Unit Area A-Z

115
1953-73 Groundfish Tagging Data Format
Field No.
Column No.
No. of Columns
Items
Code
27 62-64 3 Depth (FM) 000-999
Recapture depth exists for about 75% of recoveries.
Even half the recoveries without known recapture gears have recapture depth.
28 65-67 3 Length (CM) 000-999
Roughly 30% of the recoveries were measured.
29 68 1 Measured By - unknown (7,537 recoveries) - technician (2,684 recoveries) - other (869 recoveries)
blank 1 2
'Other' is likely to denote a fisherman or plant
worker.
30 69 1 Sex - unknown (9,528 recoveries) - male (684 recoveries) - female (878 recoveries)
blank 1 2
31 70 1 Material for Aged - none (8,660 recoveries) - otolith (2,418 recoveries) - scales (12 recoveries)
Y S
32 71 1 Found By - unknown (1,751 recoveries) - fisherman (7,641 recoveries) - plant operator (1,698 recoveries)
blank 1 2

116
1953-73 Groundfish Tagging Data Format
Field No.
Column No.
No. of Columns
Items
Code
33 72-73 2 Nationality of Boat - unknown (58 recoveries) - Canada (9,773 recoveries) - Denmark (55 recoveries) - France (123 recoveries) - Italy (34 recoveries) - Norway (3 recoveries) - Portugal (286 recoveries) - Poland (4 recoveries) - Spain (316 recoveries) - United Kingdom (19 recoveries) - United States (370 recoveries) - Russia (41 recoveries) - Cuba (1 recovery) - Germany (7 recoveries)
blank CA DE FR IT NO PG PO SP UK US RU CU GE
34 74 1 Where Found - unknown (361 recoveries) - at sea (8,769 recoveries) - at processing plant (1,960 recoveries)
blank 1 2
35 75 1 Sent In By - unknown (491 recoveries) - FRB employee (5,662 recoveries) - Government employee (2,779 recoveries) - industry (174 recoveries) - fisherman (1,984 recoveries)
blank 1 2 3 4
36 76-77 2 Paid By same as nationality of boat

117
1953-73 Groundfish Tagging Data Format
Field No.
Column No.
No. of Columns
Items
Code
37 78 1 Remarks - no remarks - associated comments for record in raw data
1 or blank
blank 1
Remarks ostensibly exist (probably on original transcripts in St. Andrews) for 1,745 recoveries.
38 79-80 2 Age 00-99
Roughly 20% of the recoveries were aged.
NOTE: The original release data, comprising columns 1-44, resided in file HISTREL on EMF0201. The original recovery data, comprising release and recovery columns 1-80, resided in file HISTREC. The recovery file only contained records for which recoveries were obtained.

118
1978-85 Groundfish Tagging Release Data Format
Field
No.
Column
No.
No. of
Columns
Items
Codes
Description
1
1-5
5
TRIP or CRUISE
XXnnn
Left-oriented letter or letters, right-
oriented number
An alphanumeric code representing either a vessel and sequential cruise number, or a
geographic location and sequential trip number. The latter is most commonly
associated with shore-based tagging operations, especially for juvenile pollock.
2
6-11
6
RELEASE DATE
01-31
01-12
01-99
DDMMYY
3
12-14
3
STATION NO.
blank, 001-999 Consecutively assigned if used
4
15-17
3
SET NO.
blank, 001-999 Consecutively assigned if used
Fields 3 and 4 rarely recorded.
5
18-20
3
ICNAF UNIT AREA
1-9
1-9
A-Z
Subarea
Division
Unit Area
6
21-28
8
LOCATION
00-90
00-59
00-90
00-59
Latitude - degrees North
Latitude - minutes North
Longitude - degrees North
Longitude - minutes North

119
1978-85 Groundfish Tagging Release Data Format
Field
No.
Column
No.
No. of
Columns
Items
Codes
Description
7
29-31
3
DEPTH
000-999
Fathoms
8
32-33
2
CAPTURE METHOD
01-12
blank - unknown
01 - otter trawl (96,020 releases)
02 - longline (2,923 releases)
07 - cod trap (26,747 releases)
08 - hook (50 releases)
10 - other (24,214 releases)
11 - weir (180 releases)
12 - angling or dip net (5,561
releases)
Capture method 'other' is mostly associated with improvised trapping techniques for
catching inshore juvenile pollock.
9
34-37
4
SPECIES CODE
0010-0320
0010 - cod
0011 - haddock
0012 - white hake
0016 - pollock
0040 - American plaice
0041 - witch flounder
0042 - yellowtail flounder
0043 - winter flounder
0122 - cunner
0143 - windowpane flounder
0201 - thorny skate
0202 - smooth skate
0203 - little skate

120
1978-85 Groundfish Tagging Release Data Format
Field
No.
Column
No.
No. of
Columns
Items
Codes
Description
0204 - winter skate
0300 - longhorn sculpin
0320 - sea raven
10
38-40
3
LENGTH
000-999
Centimetres - flatfish have assumed
decimal place between cols. 39 and 40
Usually taken with the major exception of juvenile pollock.
11
41-47
7
TAG NUMBER
nnnnnnn or
Xnnnnnn Left-oriented letter if exists, right-
oriented number
Unique to each individual fish.
12
48-50
3
TAG TYPE
OSP
YDN
Spaghetti tag
Peterson disc (English, yellow)
13
51-53
3
ATTACHMENT TYPE
OTB
SSW
T-bar
Stainless steel wire
Mostly spaghetti tags with T-bar anchors (149,848 releases). The English Yellow Petersen
disc attached with stainless steel wire (5,847 releases) was unique to dedicated tag
comparison studies.

121
1978-85 Groundfish Tagging Recoveries Data Format
Field
No.
Column
No.
No. of
Columns
Items
Codes
Description
1
1-5
5
RELEASE TRIP or
CRUISE
XXnnn
Left-oriented letter or letters, right-
oriented number
2
6-9
4
SPECIES CODE
0010-0320
0010 - cod
0011 - haddock
0012 - white hake
0016 - pollock
0040 - American plaice
0041 - witch flounder
0042 - yellowtail flounder
0043 - winter flounder
0122 - cunner
0143 - windowpane flounder
0201 - thorny skate
0202 - smooth skate
0203 - little skate
0204 - winter skate
0300 - longhorn sculpin
0320 - sea raven
3
10-16
7
TAG NUMBER
nnnnnnn or
Xnnnnnn Left-oriented letter if exists, right -
oriented number
4
17-19
3
TAG TYPE
OSP
YDN
Spaghetti tag
Peterson disc (English, yellow)
5
20-25
6
RECAPTURE DATE
01-31
01-12
01-99
DDMMYY

122
1978-85 Groundfish Tagging Recoveries Data Format
Field
No.
Column
No.
No. of
Columns
Items
Codes
Description
blanks where
unknown
6
26-27
2
RECAPTURE
METHOD
01-13, blank blank - unknown (1,049 recoveries)
01 - otter trawl (8,656 recoveries)
02 - longline (1,265 recoveries)
03 - handline (1,132 recoveries)
04 - Danish seine (1,133 recoveries)
05 - pair trawl (1 recovery)
06 - gillnet (521 recoveries)
07 - cod trap (293 recoveries)
08 - hook (2 recoveries)
09 - scallop drag (14 recoveries)
10 - other (1,010 recoveries)
11 - weir (32 recoveries)
12 - angling or dip net (800 recoveries)
13 - pair seiner (10 recoveries)
7
28-35
8
LOCATION
00-90
00-59
00-90
00-59
blanks where
unknown
Latitude - degrees North
Latitude - minutes North
Longitude - degrees North
Longitude - minutes North
8
36-38
3
ICNAF UNIT AREA
1-9
1-9
A-Z
blanks where
unknown
Subarea
Division
Unit Area

123
1978-85 Groundfish Tagging Recoveries Data Format
Field
No.
Column
No.
No. of
Columns
Items
Codes
Description
9
39-41
3
DEPTH
blank-999
Fathoms
Recapture depth exists for about 77% of recoveries.
10
42-44
3
LENGTH
blank-999
Centimetres
Roughly 43% of the recoveries were measured.
11
45
1
MEASURED BY
1 2
blank
Technician (4,003 recoveries)
Other (2,895 recoveries)
Not Measured (9,020 recoveries)
12
46
1
SEX
0 or blank
1 2
Undetermined (15,199 recoveries)
Male (421 recoveries)
Female (298 recoveries)
13
47
1
AGEING MATERIAL
Y
N or blank
S
Otolith (originally "YES" (1,836
recoveries)
None (14,077 recoveries)
Scales (5 recoveries)
14
48
1
FOUND BY
1 2
3 or blank
Fisherman (8,462 recoveries)
Plant operator (6,986 recoveries)
Other (470 recoveries)
15
49-50
2
BOAT
NATIONALITY
blank
CA
FR
NO
PG
RU
UK
Unknown (49 recoveries)
Canada (15,146 recoveries)
France (200 recoveries)
Norway (1 recovery)
Portugal (2 recoveries)
Russia (15 recoveries)
United Kingdom (1 recovery)

124
1978-85 Groundfish Tagging Recoveries Data Format
Field
No.
Column
No.
No. of
Columns
Items
Codes
Description
US
United States (504 recoveries)
16
51
1
WHERE FOUND
1 2
3 or blank
At sea (8,623 recoveries)
At processing plant (6,939 recoveries)
Other (356 recoveries)
17
52
1
SENT IN BY
1 2 3 4
5 or blank
FRB employee (10,928 recoveries)
Government employee (2,664 recoveries)
Industry (360 recoveries)
Fisherman (1,465 recoveries)
Other (501 recoveries)
18
53-54
2
WHO PAID REWARD
blank
CA
FR
UK
US
Unknown
Canada
France
United Kingdom
United States
19
55
1
REMARKS
blank
1
No remarks
Remarks entered
Remarks are known to have once existed for 5,364 recoveries, probably on the
original transcripts, yet this field is blank for every record in the current
database. But note that if the data processing person knew the cruise or trip code
associated with a returned tag at the time of data entry, this was entered as a
remark (and thus would have been deleted when cruise/trip code was incorporated into
the data format).
20
56-57
2
AGE
blank-99
Roughly 10% of the recoveries were aged (essentially just the gadoids).

125
Field specifications were initially derived from appendices 5 and 6 of the
Laboratory Reference Manual "Groundfish Tagging Procedures" (Beanlands and
McGlade, 1982).
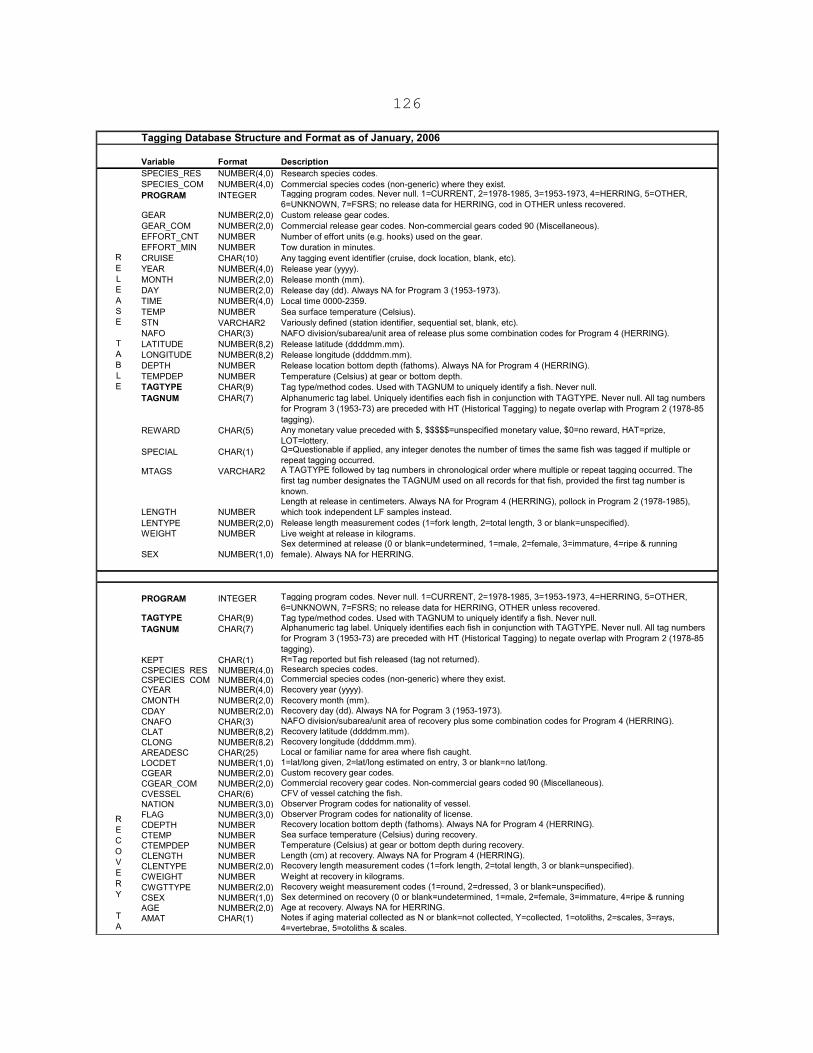
126
Tagging Database Structure and Format as of January, 2006
Variable Format Description
SPECIES_RES NUMBER(4,0) Research species codes.
SPECIES_COM NUMBER(4,0) Commercial species codes (non-generic) where they exist.
PROGRAM INTEGER
GEAR NUMBER(2,0) Custom release gear codes.
GEAR_COM NUMBER(2,0) Commercial release gear codes. Non-commercial gears coded 90 (Miscellaneous).EFFORT_CNT NUMBER Number of effort units (e.g. hooks) used on the gear.EFFORT_MIN NUMBER Tow duration in minutes.
CRUISE CHAR(10) Any tagging event identifier (cruise, dock location, blank, etc).YEAR NUMBER(4,0) Release year (yyyy).
MONTH NUMBER(2,0) Release month (mm).DAY NUMBER(2,0) Release day (dd). Always NA for Program 3 (1953-1973).TIME NUMBER(4,0) Local time 0000-2359.
TEMP NUMBER Sea surface temperature (Celsius).STN VARCHAR2 Variously defined (station identifier, sequential set, blank, etc).NAFO CHAR(3) NAFO division/subarea/unit area of release plus some combination codes for Program 4 (HERRING).
LATITUDE NUMBER(8,2) Release latitude (ddddmm.mm).LONGITUDE NUMBER(8,2) Release longitude (ddddmm.mm).DEPTH NUMBER Release location bottom depth (fathoms). Always NA for Program 4 (HERRING).
TEMPDEP NUMBER Temperature (Celsius) at gear or bottom depth.TAGTYPE CHAR(9) Tag type/method codes. Used with TAGNUM to uniquely identify a fish. Never null.
TAGNUM CHAR(7)
REWARD CHAR(5)
SPECIAL CHAR(1)
MTAGS VARCHAR2
LENGTH NUMBER
LENTYPE NUMBER(2,0) Release length measurement codes (1=fork length, 2=total length, 3 or blank=unspecified).WEIGHT NUMBER Live weight at release in kilograms.
SEX NUMBER(1,0)
PROGRAM INTEGER
TAGTYPE CHAR(9) Tag type/method codes. Used with TAGNUM to uniquely identify a fish. Never null.
TAGNUM CHAR(7)
KEPT CHAR(1)CSPECIES_RES NUMBER(4,0)CSPECIES_COM NUMBER(4,0)CYEAR NUMBER(4,0)CMONTH NUMBER(2,0)
CDAY NUMBER(2,0)CNAFO CHAR(3)CLAT NUMBER(8,2)CLONG NUMBER(8,2)AREADESC CHAR(25)LOCDET NUMBER(1,0)CGEAR NUMBER(2,0)CGEAR_COM NUMBER(2,0)CVESSEL CHAR(6)NATION NUMBER(3,0)FLAG NUMBER(3,0)CDEPTH NUMBERCTEMP NUMBERCTEMPDEP NUMBERCLENGTH NUMBERCLENTYPE NUMBER(2,0)CWEIGHT NUMBERCWGTTYPE NUMBER(2,0)CSEX NUMBER(1,0)AGE NUMBER(2,0)AMAT CHAR(1)
Tagging program codes. Never null. 1=CURRENT, 2=1978-1985, 3=1953-1973, 4=HERRING, 5=OTHER, 6=UNKNOWN, 7=FSRS; no release data for HERRING, cod in OTHER unless recovered.
Alphanumeric tag label. Uniquely identifies each fish in conjunction with TAGTYPE. Never null. All tag numbers for Program 3 (1953-73) are preceded with HT (Historical Tagging) to negate overlap with Program 2 (1978-85
tagging).
Alphanumeric tag label. Uniquely identifies each fish in conjunction with TAGTYPE. Never null. All tag numbers for Program 3 (1953-73) are preceded with HT (Historical Tagging) to negate overlap with Program 2 (1978-85 tagging).
Tagging program codes. Never null. 1=CURRENT, 2=1978-1985, 3=1953-1973, 4=HERRING, 5=OTHER,
6=UNKNOWN, 7=FSRS; no release data for HERRING, OTHER unless recovered.
R
ELE
ASE
TA
BLE
REC
OVE
RY
TA
B
Q=Questionable if applied, any integer denotes the number of times the same fish was tagged if multiple or repeat tagging occurred.A TAGTYPE followed by tag numbers in chronological order where multiple or repeat tagging occurred. The first tag number designates the TAGNUM used on all records for that fish, provided the first tag number is known.
Any monetary value preceded with $, $$$$$=unspecified monetary value, $0=no reward, HAT=prize, LOT=lottery.
Length at release in centimeters. Always NA for Program 4 (HERRING), pollock in Program 2 (1978-1985), which took independent LF samples instead.
Sex determined at release (0 or blank=undetermined, 1=male, 2=female, 3=immature, 4=ripe & running female). Always NA for HERRING.
R=Tag reported but fish released (tag not returned).Research species codes.Commercial species codes (non-generic) where they exist.Recovery year (yyyy).
Recovery month (mm).Recovery day (dd). Always NA for Pogram 3 (1953-1973).NAFO division/subarea/unit area of recovery plus some combination codes for Program 4 (HERRING).Recovery latitude (ddddmm.mm).Recovery longitude (ddddmm.mm).Local or familiar name for area where fish caught.1=lat/long given, 2=lat/long estimated on entry, 3 or blank=no lat/long.Custom recovery gear codes.Commercial recovery gear codes. Non-commercial gears coded 90 (Miscellaneous).CFV of vessel catching the fish.Observer Program codes for nationality of vessel.Observer Program codes for nationality of license.Recovery location bottom depth (fathoms). Always NA for Program 4 (HERRING).Sea surface temperature (Celsius) during recovery.Temperature (Celsius) at gear or bottom depth during recovery.Length (cm) at recovery. Always NA for Program 4 (HERRING).Recovery length measurement codes (1=fork length, 2=total length, 3 or blank=unspecified).
Weight at recovery in kilograms.Recovery weight measurement codes (1=round, 2=dressed, 3 or blank=unspecified).Sex determined on recovery (0 or blank=undetermined, 1=male, 2=female, 3=immature, 4=ripe & running Age at recovery. Always NA for HERRING.Notes if aging material collected as N or blank=not collected, Y=collected, 1=otoliths, 2=scales, 3=rays, 4=vertebrae, 5=otoliths & scales.

127
Herring Tag/Recovery Data Format
Field No.
Column No.
No. of Columns
Definition
1 1-4 4 Release Vessel Code(s); usually one, sometimes two, each 2 characters
2 5-10 6 Release Date (ddmmyy)
3 11-16 6 Release Latitude (degrees, decimal minutes) [ddmmdd]
4 17-22 6 Release Longitude (ddmmdd)
5 23-25 3 Release ISN (RISN); one per release site
The release information is redundant across recoveries
from the same release "group". Unfortunately a given record will only exist for a recovered fish. Hence releases for which there were no recoveries do not formally exist in the data base. The "missing" releases appear to consist of only 4 tagging groups identified by release ISNs 113 (250 fish), 154 (2150 fish), 157 (3625 fish), and 162 (199 fish).
6 26-27 2 Release Area Code; fine scale arbitrarily assigned by Gerry Black; see attached map; see also attached appendix for ICNAF equivalents
7 28-29 2 Release Area Code; arbitrarily grouped from RA1 by Jacques Gagné
8
30-31 2 Release Area Code; pooled via filtering according to fisheries by Rob Stephenson
9 32-36 5 Total Number Released at a Site (per RISN)
10 37-38 2 Release Gear Type Code - 1 - weir (63,741 releases) 2 - purse seine (198,161 releases) 4 - shut-off (stop seine) (9,290 releases) 7 - trap (69,899 releases)
11 39-45 7 Tag Number; unique for every fish

128
Herring Tag/Recovery Data Format
Field No.
Column No.
No. of Columns
Definition
12 46-48 3 Sample ISN; one per release sample
The sample ISN identified subunits of a release group that related to the length-frequency data for the group. Note we had 26 release ISNs for which no sample ISN existed, and we had 48 length frequency ISNs for which no sample ISN existed in the release/recovery data. We also had two cases of the same sample ISN (i.e. same length frequency) being applied to two separate (but consecutive) release ISNs. It is not unusual for certain releases to lack a length frequency (e.g. juvenile tagging), or for one length frequency to be applied across two release groups (tagged in same spot on two days), but the unmatched length frequencies are a concern.
13 49-51 3 Number Measured for Length Frequency
14 52-57 6 Capture Date (ddmmyy)
15 58-59 2 Capture Gear Type Code - 1 - weir (3,432 recoveries) 2 - purse seine (3,834 recoveries) 3 - trap (268 recoveries) 4 - gillnet (182 recoveries) 5 - shut-off (stop seine) (239 recoveries) 6 - pair trawl (187 recoveries) 7 - otter trawl (2 recoveries) 8 - unknown (5,598 recoveries) 9 - midwater trawl (64 recoveries)
16 60-65 6 Capture Latitude (ddmmdd)
17 66-71 6 Capture Longitude (ddmmdd)
18 72-73 2 Recapture Area Code as per RA1
19 74-75 2 Recapture Area Code as per RA2

129
Herring Tag/Recovery Data Format
Field No.
Column No.
No. of Columns
Definition
20 76-77 2 Recapture Area Code as per RA3
Recapture locations were entered by digitization, such
that existence of any location data in a record will imply existence of all location data. Both recapture area and latitude/ longitude, therefore, will either both exist or both be absent in all cases. We suspect that the 245 recaptures with full location data, but an asterisk (*) in Field 22 (data quality code) represent instances of more generalised recovery locations.
21 78-81 4 Number of Days Elapsed Since Released
22 82 1 W = captured less than 2 weeks after release, D = incomplete date field, * = general uncertainty (catch all); can be W, D or incomplete capture latitude/longitude, etc.
23 83 1 Data Processing Code; A = Atlantic, Q = Quebec, S = USA, C = S+A
NOTE: The original data base, as derived from the St. Andrews MINISUS system, was archived as HERDATOLD, with the old format including link variables used by MINISUS.

130
Herring Areas (RA1) With Approximate ICNAF Equivalents
1 2 3 4 5 6 7 8 9 10 11 12 13 14 15 16 17 18 19 20 21 22 23 24 25 26 27 28 29 30
4XS, 4XR 4XS 4XS 4XS 4XR 4XS 4XS 4XS 4XR 4XS 4XR, 4XQ 4XR, 4XQ 4XQ 4XQ 4XQ 4XQ, 4XP 4XO 4XO 4XM 4WK 4WK, 4WH, 4WE, 4WF 4VB, 4VC, 4VD 4WD 4WD 4VB, 4VN 4VN 4VN 4VN 4VN 3PN
31 32 33 34 35 36 37 38 39 40 41 42 43 44 45 46 47 48 49 50 51 52 53 54 55 56 57 58 59 60
4RD 4RC 4RB 4RA 4SW 4SV 4SY 4SX 4SS 4ST 4SZ 4TQ 4TP 4TD 4TN 4TM 4TK 4TF 4TL 4TJ 4TG 4TH 5ZQ 5ZG, 5ZH, 5ZJ, 5ZO, 5ZN, 5ZM 5YE 5YD 5YD 5YC 5YB 5YF

131
Appendix F
List of publications associated with the tagging activities described in this document. The
numeric labels are keys to the ‘References’ column in Appendix A.
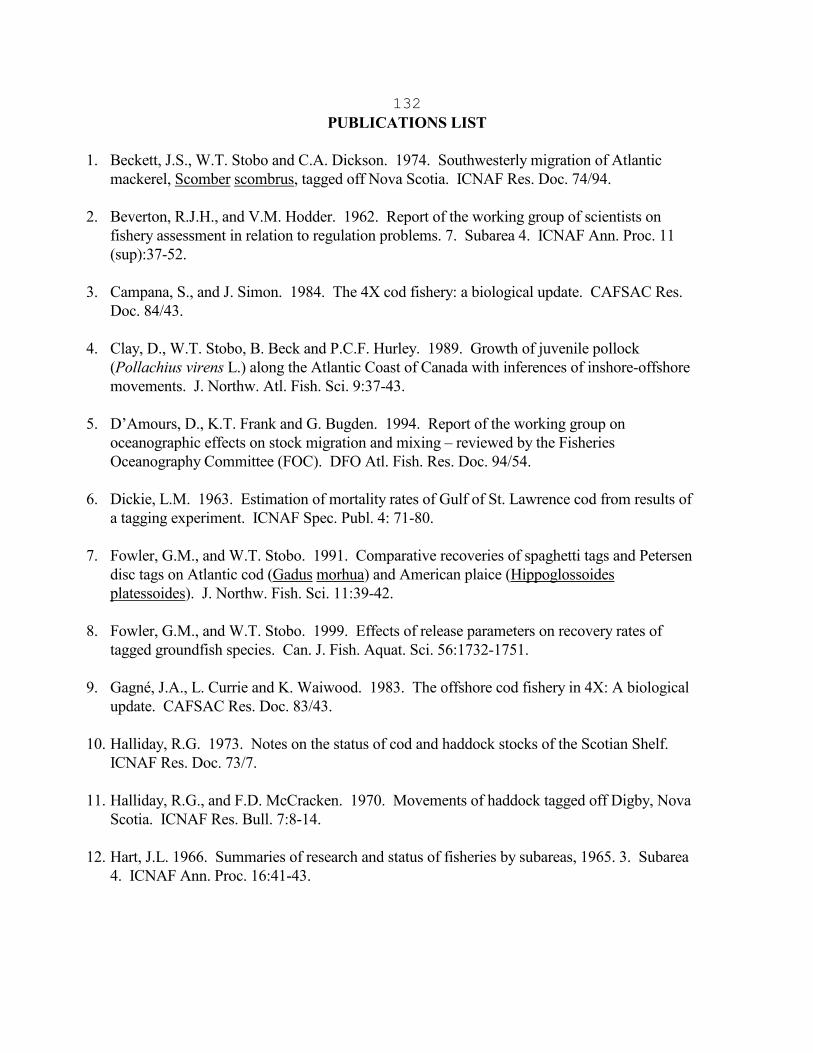
132
PUBLICATIONS LIST
1. Beckett, J.S., W.T. Stobo and C.A. Dickson. 1974. Southwesterly migration of Atlantic
mackerel, Scomber scombrus, tagged off Nova Scotia. ICNAF Res. Doc. 74/94.
2. Beverton, R.J.H., and V.M. Hodder. 1962. Report of the working group of scientists on
fishery assessment in relation to regulation problems. 7. Subarea 4. ICNAF Ann. Proc. 11
(sup):37-52.
3. Campana, S., and J. Simon. 1984. The 4X cod fishery: a biological update. CAFSAC Res.
Doc. 84/43.
4. Clay, D., W.T. Stobo, B. Beck and P.C.F. Hurley. 1989. Growth of juvenile pollock
(Pollachius virens L.) along the Atlantic Coast of Canada with inferences of inshore-offshore
movements. J. Northw. Atl. Fish. Sci. 9:37-43.
5. D’Amours, D., K.T. Frank and G. Bugden. 1994. Report of the working group on
oceanographic effects on stock migration and mixing – reviewed by the Fisheries
Oceanography Committee (FOC). DFO Atl. Fish. Res. Doc. 94/54.
6. Dickie, L.M. 1963. Estimation of mortality rates of Gulf of St. Lawrence cod from results of
a tagging experiment. ICNAF Spec. Publ. 4: 71-80.
7. Fowler, G.M., and W.T. Stobo. 1991. Comparative recoveries of spaghetti tags and Petersen
disc tags on Atlantic cod (Gadus morhua) and American plaice (Hippoglossoides
platessoides). J. Northw. Fish. Sci. 11:39-42.
8. Fowler, G.M., and W.T. Stobo. 1999. Effects of release parameters on recovery rates of
tagged groundfish species. Can. J. Fish. Aquat. Sci. 56:1732-1751.
9. Gagné, J.A., L. Currie and K. Waiwood. 1983. The offshore cod fishery in 4X: A biological
update. CAFSAC Res. Doc. 83/43.
10. Halliday, R.G. 1973. Notes on the status of cod and haddock stocks of the Scotian Shelf. ICNAF Res. Doc. 73/7.
11. Halliday, R.G., and F.D. McCracken. 1970. Movements of haddock tagged off Digby, Nova
Scotia. ICNAF Res. Bull. 7:8-14.
12. Hart, J.L. 1966. Summaries of research and status of fisheries by subareas, 1965. 3. Subarea
4. ICNAF Ann. Proc. 16:41-43.

133
13. Hunt, J.J., and J.D. Neilson. 1993. Is there a separate stock of Atlantic cod in the western side of the Bay of Fundy? North American Journal of Fisheries Management 13(3):421-436.
14. Hunt, J.J., W.T. Stobo and F. Almeida. 1999. Movement of Atlantic cod, Gadus morhua,
tagged in the Gulf of Maine area. Fish. Bull. 97(4):842-860.
15. Jean, Y. 1963. Where do Seven Islands cod come from? Trade News 16(2):6-7.
16. Jean, Y. 1963. First-year returns of cod tagged off Sept-Iles in October, 1961. In: J.L. Hart [director]. Annual Report and Investigators’ Summaries, 1962-63. pp. C17-C20. Fisheries
Research Board of Canada, Biological Station, St. Andrews, N.B.
17. Kohler, A.C. 1963. Use of tagging data in subarea 4 cod growth investigations. ICNAF Spec. Publ. 4: 66-70.
18. Kohler, A.C. 1964. Movements of halibut on the Nova Scotian and Grand Banks. J. Fish.
Res. Bd. Can. 21:837-840.
19. Kohler, A.C. 1975. Recoveries from 1969 cod tagging in ICNAF Divisions 4VN. ICNAF
Res. Doc. 75/91.
20. Kohler, A.C. 1971. Tagging of white hake, Urophycis tenuis Mitchell, in the southern Gulf
of St. Lawrence. ICNAF Res. Bull. 8:21-25.
21. Lambert, T.C. 1993. The timing of the winter migration of 4T cod into 4Vn. DFO Atl. Fish.
Res. Doc. 93/25.
22. Lettaconnoux, R.H. 1963. Summaries of research, 1962, by subarea. 3. Subarea 4. ICNAF
Ann. Proc. 13:35-37.
23. Lettaconnoux, R.H. 1965. Summaries of research and status of fisheries, by subareas for
1964. 3. Subarea 4. ICNAF Ann. Proc. 14:38-40.
24. Martin, W.R. 1958. Canadian research report, 1957. A.2. Subarea 4. ICNAF Ann. Proc. 8,
Part III:22-26.
25. Martin, W.R. 1959. Canadian research report, 1958. B. Subareas 4 and 5. ICNAF Ann.
Proc. 9, Part III:26-31.
26. Martin, W.R. 1960. Canadian research report, 1959. B. Subareas 4 and 5. ICNAF Ann.
Proc. 10, Part III:25-31.

134
27. Martin, W.R. 1961. Canadian research report, 1960. B. Subareas 4 and 5. ICNAF Ann.
Proc. 11, Part III:31-37.
28. Martin, W.R. 1961. Offshore winter cod tagging. In: J.L. Hart [director]. Annual Report and
Investigators’ Summaries, 1960-61. pp. 72-73. Fisheries Research Board of Canada,
Biological Station, St. Andrews, N.B.
29. Martin, W.R. 1962. Returns from 1960 winter cod taggings. In: J.L. Hart [director]. Annual
Report and Investigators’ Summaries, 1961-61. pp. 57-61. Fisheries Research Board of
Canada, Biological Station, St. Andrews, N.B.
30. Martin, W.R., and Y. Jean. 1964. Winter cod tagging off Cape Breton and on offshore Nova
Scotia Banks, 1959-62. J. Fish. Res. Bd. Can. 21:215-238.
31. McCracken, F.D. 1953. Cod and haddock tagging. In: A.W.H. Needler [director]. Report of
the Atlantic Biological Station for 1953. pp. 57-60. Fisheries Research Board of Canada, St.
Andrews, N.B.
32. McCracken, F.D. 1954. Cod and haddock tagging, Lockeport, June-October, 1953. In: J.L.
Hart [director]. Report of the Atlantic Biological Station for 1954. pp. 47-51. Fisheries
Research Board of Canada, St. Andrews, N.B.
33. McCracken, F.D. 1954. Cod and haddock tagging, Lockeport, June-October, 1953;
Louisburg and Canso tagging – June-August, 1954. In: J.L. Hart [director]. Report of the
Atlantic Biological Station for 1954. pp. 50-51. Fisheries Research Board of Canada, St.
Andrews, N.B.
34. McCracken, F.D. 1956. Cod tagging. In: J.L. Hart [director]. Annual Report and
Investigators’ Summaries, 1955-56. pp. 72-75. Fisheries Research Board of Canada,
Biological Station, St. Andrews, N.B.
35. McCracken, F.D. 1956. Cod tagging. In: J.L. Hart [director]. Annual Report and
Investigators’ Summaries, 1956. pp. 56-61. Fisheries Research Board of Canada, Biological
Station, St. Andrews, N.B.
36. McCracken, F.D. 1956. Haddock tagging. In: J.L. Hart [director]. Annual Report and
Investigators’ Summaries, 1956. pp. 50-51. Fisheries Research Board of Canada, Biological
Station, St. Andrews, N.B.
37. McCracken, F.D. 1956. Cod and haddock tagging off Lockeport, N.S. Fish. Res. Bd. Can.,
Prog. Rep. Atl. Cst. Sta., 64:10-15.

135
38. McCracken, F.D. 1957. Results of cod tagging off eastern Nova Scotia. Fish. Res. Bd. Can.,
Prog. Rep. Atl. Cst. Sta., No. 67:6-13.
39. McCracken, F.D. 1958. Cod tagging results. In: J.L. Hart [director]. Annual Report and
Investigators’ Summaries, 1957-58. pp. 64-67. Fisheries Research Board of Canada,
Biological Station, St. Andrews, N.B.
40. McCracken, F.D. 1958. Haddock tagging. In: J.L. Hart [director]. Annual Report and
Investigators’ Summaries, 1957-58. pp. 61-64. Fisheries Research Board of Canada,
Biological Station, St. Andrews, N.B.
41. McCracken, F.D. 1959. Cod tagging off northern New Brunswick in 1955 and 1956. Fish.
Res. Bd Can., Prog. Rep. Atl. Cst. Sta., No. 72:8-19.
42. McCracken, F.D., and C.R. Garnett. 1959. Haddock tagging. In: J.L. Hart [director].
Annual Report and Investigators’ Summaries, 1958-59. pp. 59-61. Fisheries Research Board
of Canada, Biological Station, St. Andrews, N.B.
43. McCracken, F.D. 1960. Studies of haddock in the Passamaquoddy Bay region. J. Fish. Res.
Bd. 17(2):175-180.
44. McCracken, F.D. 1961. Haddock tagging results. In: J.L. Hart [director]. Annual Report
and Investigators’ Summaries, 1960-61. pp. 92-93. Fisheries Research Board of Canada,
Biological Station, St. Andrews, N.B.
45. McCracken, F.D. 1963. Comparison of tags and techniques from recoveries of Subarea 4 cod
tags. ICNAF Spec. Publ. 4:89-100.
46. McCracken, F.D. 1963. Migrations of haddock between the Gulf of St. Lawrence and
offshore Nova Scotian Banks. J. Fish. Res. Bd. 20(3):855-857.
47. McCracken, F.D. 1973. Summaries of research and status of fisheries for subareas and seals,
1972. 4. Subarea 4. ICNAF Ann. Rep. 23:102-105.
48. Myers, R.A., N.J. Barrowman, J.M. Hoenig and Z. Qu. 1996. The collapse of cod in Eastern
Canada: The evidence from tagging data. ICES Journal of Marine Science 53(3):629-640.
49. Neilson, J.D., W.T. Stobo and P. Perley. 2003. Age and growth of Canadian east coast
pollock: comparison of results from otolith examination and mark-recapture studies.
Transactions of the American Fisheries Society 132(3):536-545.
50. Neilson, J.D., P. Perley, E.H. Carruthers, W. Stobo and D. Clark. 2003. Stock structure of
pollock in NAFO div. 4VWX5Zc. CSAS Res. Doc. 2003/45.

136
51. Neilson, J.D., W.T. Stobo and P. Perley. 2006. Pollock (Pollachius virens) stock structure in
the Canadian Maritimes inferred from mark-recapture Studies. ICES Journal of Marine
Science 63:749-765.
52. Paloheimo, J.E. 1958. Determination of natural and fishing mortalities of cod and haddock
from analysis of tag records off western Nova Scotia. J. Fish. Res. Bd. Can. 15:1371-1381.
53. Powles, P.M. 1959. Magdalen Islands cod tagging. In: J.L. Hart [director]. Annual Report
and Investigators’ Summaries, 1958-59. pp. 47-50. Fisheries Research Board of Canada,
Biological Station, St. Andrews, N.B.
54. Powles, P.M. 1959. Plaice studies. In: J.L. Hart [director]. Annual Report and Investigators’
Summaries, 1958-59. pp. 56-58. Fisheries Research Board of Canada, Biological Station, St.
Andrews, N.B.
55. Powles, P.M. 1963. Plaice tagging experiments, 1958-1961, Magdalen Shallows. In: J.L.
Hart [director]. Annual Report and Investigators’ Summaries, 1962-63. pp. C36-C39.
Fisheries Research Board of Canada, Biological Station, St. Andrews, N.B.
56. Powles, P.M. 1965. Greysole and plaice tagging experiments. In: J.L. Hart [director].
Annual Report and Investigators’ Summaries, 1965. pp. CA12-CA15. Fisheries Research
Board of Canada, Biological Station, St. Andrews, N.B.
57. Shackell, N.L., K.T. Frank, W.T. Stobo and D. Brickman. 1995. Cod (Gadus morhua)
growth between 1956 and 1966 compared to growth between 1978 to 1985, on the Scotian
Shelf and adjacent areas. ICES C.M. 1995/P:1.
58. Sinclair, M., W. Stobo and J. Simon. 1980. 1979-1980 4Vn herring assessment. CAFSAC
Res. Doc. 80/50.
59. Sinclair, M., W. Stobo and A. Sinclair. 1979. Status of 4Vn herring fishery 1978-79.
CAFSAC Res. Doc. 79/40.
60. Steele, D.H. 1963. Pollock (Pollachius virens (L.)) in the Bay of Fundy. J. Fish. Res. Bd. 20(5):1261-1314.
61. Stobo, W.T. 1976. Movements of herring tagged in the Bay of Fundy - Update. ICNAF Res.
Doc. 76/VI/48.
62. Stobo, W.T. 1976. Movements of mackerel tagged in Subarea 4. ICNAF Res. Doc.
76/VI/49.

137
63. Stobo, W.T. 1976. Some techniques and procedures used to tag herring in ICNAF Subarea 4.
ICNAF Res. Doc. 76/VI/101.
64. Stobo, W.T. 1978. Gulf of St. Lawrence tagging results: Preliminary analysis. CAFSAC
Working Paper 78/8.
65. Stobo, W.T. 1982. Tagging studies on Scotian Shelf herring. NAFO SCR Doc. 82/IX/108.
66. Stobo, W.T. 1983. Report of the ad hoc working group on herring tagging. NAFO SCS Doc.
83/VI/18.
67. Stobo, W.T., J.A. Gagné and J.J. Maguire. 1982. Preliminary results of cod tagging
experiments in NAFO Subarea 4. CAFSAC Working Paper 82/69.
68. Stobo, W.T., J.A. Moores and J.J. Maguire. 1982. The herring and mackerel resources on the
East Coast of Canada. Can. Tech. Rep. Fish. Aquat. Sci. 1081.
69. Stobo, W.T., J.D. Nielson and P.G. Simpson. 1988. Movements of Atlantic halibut
(Hippoglossus hippoglossus) in the Canadian North Atlantic. Can. J. Fish. Aquat. Sci.
45:484-491.
70. Stobo, W.T., J.S. Scott and J.J. Hunt. 1975. Movements of herring tagged in the Bay of
Fundy. ICNAF Res. Doc. 75/38.
71. Stobo, W.T., and J. Simon. 1982. Biological update for 4VN herring, 1981-82. CAFSAC
Res. Doc. 82/39.
72. Stobo, W.T., and A. Sinclair. 1978. Preliminary herring tagging results in ICNAF Subdiv.
4VWa. CAFSAC Working Paper 78/52.