canadian equities how about now? - ci investments · cambridge global asset management canadian...
TRANSCRIPT

CAMBRIDGE GLOBAL ASSET MANAGEMENT
Canadian Equities – How About Now?
Stephen Groff and Greg Dean

Canada is volatile and concentrated
2006 2007 2008 2009 2010 2011 2012 2013 2014 2015 2016*
Materials
39.8%
Infotech
48.2%
Cons. Stap.
-6.1%
Financials
45.6%
Health
Care
57%
Health
Care
50.4%
Health
Care
24.7%
Health
Care
72.1%
Cons. Stap.
49.1%
Infotech
15.6%
Materials
62.9%
Infotech
27.3%
Materials
30.3%Utes -20.5%
Infotech
44.3%
Materials
36.5%
Telcos
24.9%
Cons. Stap.
22.6%
Cons. Disc.
43%
Infotech
35.1%
Cons.
Stap.
12.4%
Utes 20.8%
Telcos
20.1%
Telcos
19.9%
Telcos
-24.8%
Energy
39.5%
Cons. Disc.
25.3%
Cons.
Stap. 6.8%
Cons. Disc.
22.1%
Industrials
37.5%
Health
Care
30.3%
Telcos
3.6%
Telcos
19.9%
Financials
19.2%
Utes
11.9%
Industrials
-25.1%TSX 35.1%
Telcos
22.4%Utes 6.5%
Financials
17.6%
Infotech
37.3%
Cons. Disc.
29.1%
Cons. Disc.
-1.5%
Energy
18.8%
TSX 17.3%Industrials
10.5%
Materials
-26.5%
Health
Care
34.4%
Utes 18.4%Industrials
4.2%
Industrials
15.3%
Financials
23.7%
Industrials
21.9%
Financials
-1.7%TSX 14.1%
Cons. Disc.
15.7%TSX 9.8%
Health Care
-30.2%
Materials
34.2%TSX 17.6%
Financials
-2.9%
Telcos
11.5%
Cons.
Stap.
23.6%
Utes 16.1% Utes -3.5%Industrials
13.4%
Industrials
14.7%
Energy
8.2%TSX -33%
Industrials
27%
Industrials
16.9%TSX -8.7% TSX 7.2%
Energy
13.6%
Telcos
15.5%TSX -8.3%
Financials
8.7%
Utes 7%Cons. Disc.
4.2%
Energy
-33.9%Utes 19%
Energy
13.3%
Energy
-9.9%Utes 4%
Telcos
13.1%
Financials
13.8%
Industrials
-11.1%
Cons. Stap.
8.1%
Energy
6.1%
Financials
-1.6%
Cons. Disc.
-35.4%
Cons. Disc.
15.1%
Financials
10.5%
Cons. Disc.
-15.5%
Energy
-0.6%TSX 13% TSX 10.6%
Health
Care
-15.6%
Cons. Disc.
5.7%
Cons.
Stap. 5.5%
Cons.
Stap.
-5.3%
Financials
-36.4%
Cons.
Stap. 8.1%
Cons. Stap.
10.3%
Materials
-21.2%
Infotech
-2.9%
Utes
-4.1%
Materials
-2.6%
Materials
-21%
Infotech
3%
Health
Care
0.7%
Health
Care
-24.2%
Infotech
-54.2%
Telcos
6.6%
Infotech
-11.6%
Infotech
-52.5%
Materials
-5.7%
Materials
-29.1%
Energy
-4.8%
Energy
-22.9%
Health
Care
-70.6%
Source: Bloomberg *as at July 31, 2016

Canada is volatile and concentrated
14% 4% 6%
24%
2% 3%
8%
27% 20%
12%
23%
11%
17% 29%
38%
9%
4% 7%
3% 2%
4% 2% 1% 1% 3% 2% 2%
8% 6% 8%
1999 2011 2016
Industrials
Utilities
Health Care
Consumer Staples
ConsumerDiscretionaryFinancials
Materials
Energy
Commodities
50%
Financials 38%
Source: Bloomberg
Tech &
Telecom
38%

From 2011: Key chart that drove our positioning five years ago
Source: Stifel Nicolaus

Today: Key chart that is driving our positioning today
Source: Stifel Nicolaus
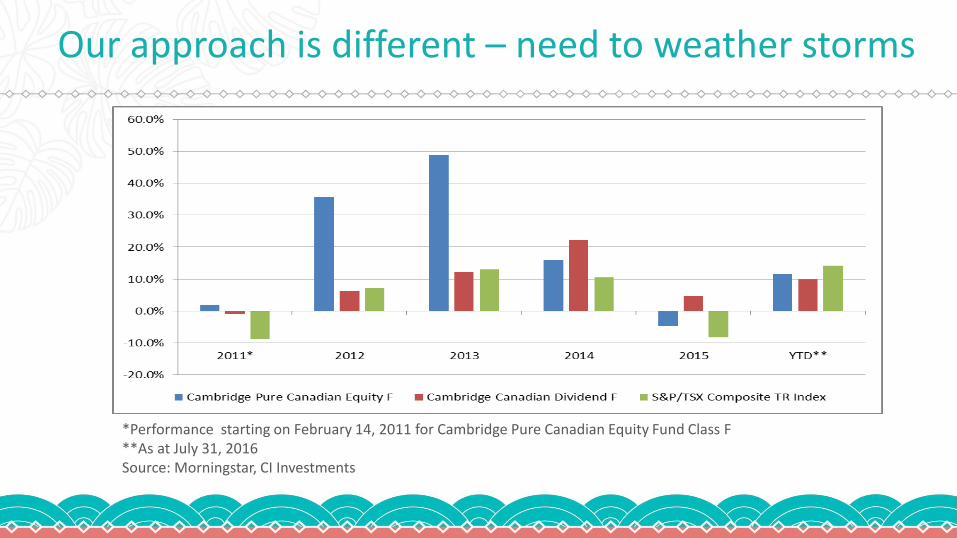
Our approach is different – need to weather storms
*Performance starting on February 14, 2011 for Cambridge Pure Canadian Equity Fund Class F **As at July 31, 2016 Source: Morningstar, CI Investments
The Cambridge philosophy
• ACTIVE management Bottom-up portfolio construction
Experienced, motivated and growing team
Tactical asset allocation (cash is always an option)
• Absolute return, downside focused Primary focus is understanding risks and making sure we get compensated for them
If you invest in good companies the upside takes care of itself
Grow wealth over time by avoiding impairments to capital
• Ownership mentality Significant holders of our funds
Compensation tied to value creation
Disciplined analysis leads to high conviction in our holdings

Performance
As at August 31, 2016 YTD 1 year 3 year 5 year
Cambridge Pure Canadian Equity Fund F 15.5% 9.1% 13.7% 20.8%
Cambridge Canadian Dividend Fund F* 11.1% 11.5% 15.8% 11.0%
S&P/TSX Composite TR Index 14.4% 8.7% 8.1% 5.9%
*Cambridge took over the mandate from Greystone on December 31, 2013 Source: Morningstar, CI Investments

Real active management
Canadian Pure Canadian
Equity
Cambridge Canadian
Dividend TSX Fund A Fund B Fund C
9
Source: Morningstar, CI Investments, TMX, July 31, 2016

Real active management
Active Share MER
Cambridge Pure Canadian Equity Fund F 93% 1.35%
Cambridge Canadian Dividend Fund F 91% 1.33%
S&P/TSX Composite TR Index 0% 0.18%
Fund A 36% 0.93%
Fund B 54% 0.93%
Fund C 38% 0.94%
Source: Morningstar

Core: ATD
Source: Bloomberg

Core: CP
Source: Bloomberg

Core: GIB
Source: Bloomberg
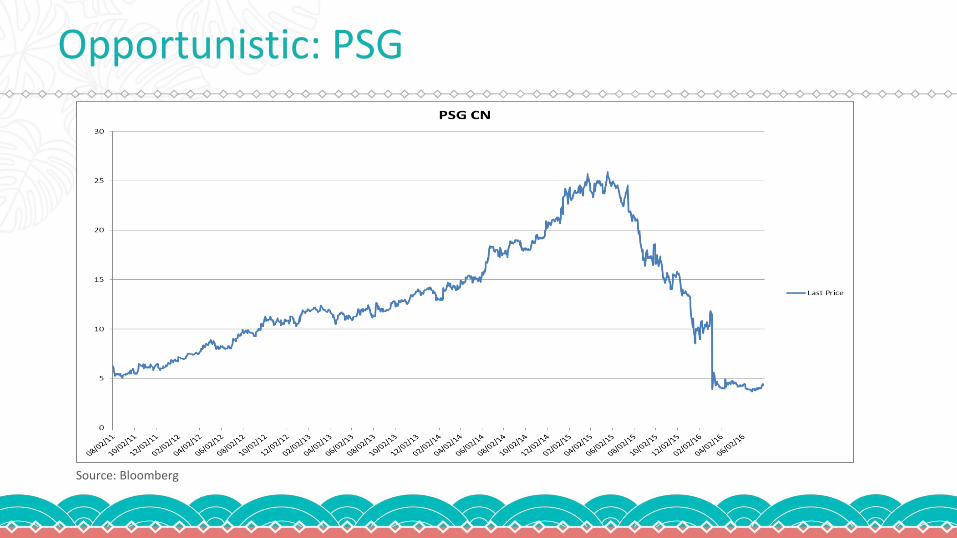
Opportunistic: PSG
Source: Bloomberg

Top positions
Cambridge Canadian Dividend
Top holdings as at August 31, 2016
Extended Stay American Inc. 4.18%
Walgreens Boots Alliance Inc. 4.07%
Stantec Inc. 3.99%
Brookfield Infrastructure Partners LP 3.62%
TransForce Inc. 3.58%
Canadian Pacific Railway Ltd. 3.45%
Keyera Corp. 3.43%
US Bancorp. 3.08%
Finning International Inc. 3.01%
Stella-Jones Inc. 2.98%
Total 35.4%
Source: CI Investments
Cambridge Pure Canadian Equity
Top holdings as at August 31, 2016
Tourmaline Oil Corp. 5.76%
TransForce Inc. 4.52%
Brookfield Infrastructure Partners LP 4.22%
Restaurant Brands International Inc. 3.91%
Sylogist Ltd. 3.44%
Morguard Corp. 3.38%
Computer Sciences Corp. 3.37%
Walgreens Boots Alliance Inc. 3.31%
PrairieSky Royalty Ltd. 3.21%
Finning International Inc. 3.10%
Total 38.2%
15

Cambridge Canadian Dividend Fund
Based on rolling monthly return data. Source: Morningstar, CI Investments
$80,000
$90,000
$100,000
$110,000
$120,000
$130,000
$140,000
$150,000
$160,000
$170,000
$180,0009
/1/1
1
11
/1/1
1
1/1
/12
3/1
/12
5/1
/12
7/1
/12
9/1
/12
11
/1/1
2
1/1
/13
3/1
/13
5/1
/13
7/1
/13
9/1
/13
11
/1/1
3
1/1
/14
3/1
/14
5/1
/14
7/1
/14
9/1
/14
11
/1/1
4
1/1
/15
3/1
/15
5/1
/15
7/1
/15
9/1
/15
11
/1/1
5
1/1
/16
3/1
/16
5/1
/16
7/1
/16
Growth of $100,000 CI Cambridge Canadian Dividend F
Canada Canadian Dividend & Income Equity
S&P/TSX Composite TR
iShares S&P/TSX Cdn Div Aristocrats Comm $132,950
$142,905
$168,273
$142,721
5 years – August 31, 2016 Return Corr. Beta Alpha Std Dev Sharpe Ratio Upside/downside capture
Cambridge Canadian Dividend Fund Cl F 11.0% 0.80 0.61 6.7% 7.3% 1.4 86% 34%
Canada Canadian Dividend & Equity Income 7.2% 0.91 0.71 2.7% 8.1% 0.8 81% 60%
S&P/TSX Composite TR 5.9% 1.00 1.00 0.0% 9.7% 0.5 100% 100%
iShares S&P/TSX Cdn Div Aristocrats Comm 7.4% 0.82 0.71 2.9% 8.4% 0.8 87% 66%

Cambridge Canadian Dividend Fund
Based on rolling monthly return data – 3 year return as at August 31, 2016
Source: Morningstar, CI Investments
$80,000
$90,000
$100,000
$110,000
$120,000
$130,000
$140,000
$150,000
$160,000
$170,000
$180,0009
/1/1
1
11
/1/1
1
1/1
/12
3/1
/12
5/1
/12
7/1
/12
9/1
/12
11
/1/1
2
1/1
/13
3/1
/13
5/1
/13
7/1
/13
9/1
/13
11
/1/1
3
1/1
/14
3/1
/14
5/1
/14
7/1
/14
9/1
/14
11
/1/1
4
1/1
/15
3/1
/15
5/1
/15
7/1
/15
9/1
/15
11
/1/1
5
1/1
/16
3/1
/16
5/1
/16
7/1
/16
Growth of $100,000 CI Cambridge Canadian Dividend F
Canada Canadian Dividend & Income Equity
S&P/TSX Composite TR
iShares S&P/TSX Cdn Div Aristocrats Comm $132,950
$142,905
$168,273
$142,721
Fund 3 Year 2015 2014
Cambridge Canadian Dividend Fund Class F 15.8% 4.7% 22.2%
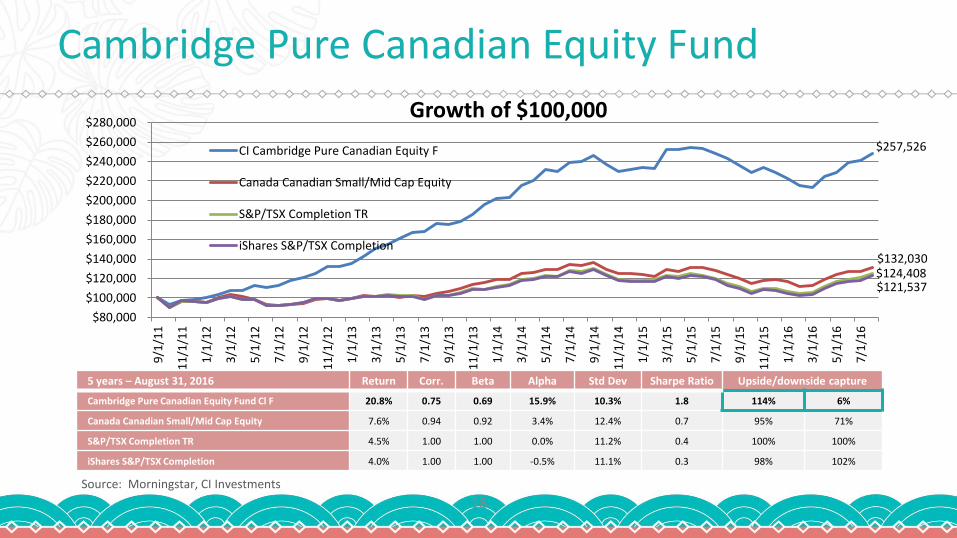
Cambridge Pure Canadian Equity Fund
Source: Morningstar, CI Investments
18
$80,000
$100,000
$120,000
$140,000
$160,000
$180,000
$200,000
$220,000
$240,000
$260,000
$280,000
9/1
/11
11
/1/1
1
1/1
/12
3/1
/12
5/1
/12
7/1
/12
9/1
/12
11
/1/1
2
1/1
/13
3/1
/13
5/1
/13
7/1
/13
9/1
/13
11
/1/1
3
1/1
/14
3/1
/14
5/1
/14
7/1
/14
9/1
/14
11
/1/1
4
1/1
/15
3/1
/15
5/1
/15
7/1
/15
9/1
/15
11
/1/1
5
1/1
/16
3/1
/16
5/1
/16
7/1
/16
Growth of $100,000
CI Cambridge Pure Canadian Equity F
Canada Canadian Small/Mid Cap Equity
S&P/TSX Completion TR
iShares S&P/TSX Completion
$257,526
$121,537 $124,408
5 years – August 31, 2016 Return Corr. Beta Alpha Std Dev Sharpe Ratio Upside/downside capture
Cambridge Pure Canadian Equity Fund Cl F 20.8% 0.75 0.69 15.9% 10.3% 1.8 114% 6%
Canada Canadian Small/Mid Cap Equity 7.6% 0.94 0.92 3.4% 12.4% 0.7 95% 71%
S&P/TSX Completion TR 4.5% 1.00 1.00 0.0% 11.2% 0.4 100% 100%
iShares S&P/TSX Completion 4.0% 1.00 1.00 -0.5% 11.1% 0.3 98% 102%
$132,030

Top 10 holdings – Cambridge Pure Canadian Equity Fund
2013 2014 2015 2016
Source: Management Report of Fund Performance, March 31, 2016

Cambridge communication
Sign up for our blog at
http://blogs.ci.com/cambridge
20

Cambridge Team
21
Alan Radlo Stephen Groff Brandon Snow Greg Dean Robert Swanson Principal &
Senior Portfolio Manager Principal &
Chief Investment Officer Principal &
Portfolio Manager Principal &
Portfolio Manager Principal &
Chief Market Strategist
Danesh Rohinton Analyst
Grant Connor Analyst
Chris Lichtenheldt Analyst
Jordan McNamee Analyst
Kam Marzoughi Analyst
Ian Turnbull Analyst
Tyler Hildebrand Trader
Diane Burke Operations
Authi Seevaratnam Junior Analyst
Joe German VP Business Development
Derek Cangiano Junior Analyst

Performance as at August 31, 2016
Source: Morningstar
Name YTD 1 Yr. 3 Yr. 5 Yr. 10 Yr. Since
Inception Inception
Date
CI Cambridge Asset Alloc Corporate Class F 5.5 6.4 9.7 8.9 N/A 7.3 12/31/07
CI Cambridge Global High Income Fund F 4.3 5.2 8.8 8.6 7.7 10.6 07/27/04
CI Cambridge Canadian Dividend Fund F 11.1 11.5 15.8 11.0 7.4 8.3 06/14/06
CI Cambridge US Dividend Fund F 3.6 8.7 17.1 18.3 7.6 8.4 06/14/06
CI Cambridge Global Dividend Fund F 5.1 8.4 13.3 N/A N/A 12.9 07/31/13
CI Cambridge Canadian Equity Corporate Class F 11.6 11.7 12.7 14.8 N/A 9.7 12/31/07
CI Cambridge American Equity Fund F 2.8 5.9 15.6 15.7 5.4 0.1 07/17/00
CI Cambridge Global Equity Corporate Class F 5.2 5.5 12.0 14.0 N/A 8.5 12/31/07
CI Cambridge Pure Canadian Equity Fund F 15.5 9.1 13.7 20.8 N/A 19.0 02/15/11
CI Cambridge Canadian Growth Companies Fund F 14.0 11.5 13.0 21.4 N/A 19.7 02/15/11
CI Cambridge Growth Companies Corporate Class F 10.3 11.4 N/A N/A N/A 13.5 07/29/14
Canadian Equity Growth Corp Cl W 16.6 15.9 16.5 20.3 N/A 10.2 10/22/07
International Equity Alpha Corp Cl W -0.5 5.5 13.5 13.0 N/A 11.7 06/01/09

Thank You
Commissions, trailing commissions, management fees and expenses may be associated with mutual fund investments. Please read the prospectus before investing. Unless otherwise
indicated and except for returns for periods less than one year, the indicated rates of return are the historical annual compounded total returns including changes in security value. All
performance data assume reinvestment of all distributions or dividends and do not take into account sales, redemption, distribution or optional charges or income taxes payable by any security
holder that would have reduced returns. Mutual funds are not guaranteed, their values change frequently and past performance may not be repeated. This presentation is provided as a
general source of information and should not be considered personal investment advice or an offer or solicitation to buy or sell securities. Every effort has been made to ensure that the
material contained in this commentary is accurate at the time of publication. However, CI Investments Inc. cannot guarantee its accuracy or completeness and accepts no responsibility for any
loss arising from any use of or reliance on the information contained herein. All charts and illustrations in this guide are for illustrative purposes only; they are not intended to predict or project
investment results. This report may contain forward-looking statements about CI funds, future performance, strategies or prospects, and possible future fund action. These statements reflect
the portfolio managers’ current beliefs and are based on information currently available to them. Forward-looking statements are not guarantees of future performance. We caution you not to
place undue reliance on these statements as a number of factors could cause actual events or results to differ materially from those expressed in any forward-looking statement, including
economic, political and market changes and other developments. ®CI Investments, the CI Investments design and Cambridge are registered trademarks of CI Investments Inc. Cambridge
Global Asset Management is a business name of CI Investments Inc. used in connection with its subsidiary, CI Global Investments Inc. Certain portfolio managers of Cambridge Global Asset
Management are registered with CI Investments Inc. Published September 2016.
FOR ADVISOR USE ONLY – NOT FOR DISTRIBUTION TO CLIENTS