canadian emigration to the u.s., 1900–1930. characterizing ... · acterize movers, both english-...
TRANSCRIPT
Canadian Emigration to the U.S., 1900–1930.Characterizing Movers and Stayers, and the
Differential Impact of Immigration Policy on theMobility of French and English Canadians
A paper prepared for meeting of the
Canadian Network for Economic History
Banff Alberta
October 26–28, 2012
Byron Lew† and Bruce Cater
Department of Economics, Trent University
1600 West Bank Drive
Peterborough ON K9J 7B8
Canada†email: [email protected]
Abstract
Canadians moved to the U.S. in large numbers in the late 19th and early 20th
centuries. Canadians also moved to settle the Prairies. We merge Canadian and
U.S. Census microdata files from 1900 through 1931 to generate a sample of the
population of the Canadian-born living in both Canada and the U.S. We quantify
the relative odds of Anglo- and Franco-Canadians moving interprovincially and to
the U.S., and do this for each Census year. This allows us to directly compare the
relative mobility of each group, and to track changes in mobility over time. We note
a shift in the characteristics of French Canadians moving to the U.S. during the 1920s
and explore whether this is due to changes in labour demand or the effect of the
literacy requirement introduced by Congress in 1917.

Introduction
North Americans are a highly mobile people. For someone born in the U.S. in the nine-
teenth or early twentieth century, there was a good chance they would end up living
outside their state of birth. The same was true of Canadians. The likelihood of the
Canadian-born living outside their province of birth through the early twentieth century
was high if the U.S. is included as a possible destination. The border was essentially
open to Canadian citizens through the middle of the twentieth century.
In contrast to their willingness to migrate to the U.S., Canadians were not uniformly
as mobile within their own country. Both English and French-speaking Canadian-born
migrated in large numbers to the United States prior to 1930. Both were highly mobile
populations; and a significant share of the Canadian-born—both English- and French-
speaking—were living in the U.S. by the early twentieth century.1 Where the two pop-
ulations differed, however, was in their propensity to migrate within Canada. French-
speakers were never very keen to move within Canada; and to the extent they did, they
tended not to move very far, settling in regions of Ontario that were near to or bordering
Québec. In contrast, the West was settled mostly by English-speakers and immigrants
from Europe, and by a modest, albeit brief inflow, from the U.S.2
We quantify the relative mobility of the English-speaking and French-speaking Canadian-
born within North America by destination choice of the U.S. or Canada. We examine
the entire population of the Canadian-born by using both the U.S. and Canadian Cen-
suses of population. We are thus able to distinguish movers from non-movers among all
Canadian-born. By pooling the population of all movers and non-movers, we estimate
more precise measures of the propensity of the Canadian-born to migrate. We also char-
1At its peak in 1901, the Canadian-born living in the U.S. amounted to 22% of the Canadian population.The proportion of Franco-Canadians living in the U.S. was 24% of the population of Québec.
2Though an indeterminate share of this flow may have been Canadians returning from the U.S.
1
acterize movers, both English- and French-speaking, by destination choice on a few basic
demographic and human capital characteristics. With the distinguishing characteristics
identified, we can link the changes in migration patterns to both legislative changes to
immigration policy to the U.S., and to changes in labour demand due to the changes in
technology of the early twentieth century.
Language as barrier to migration
Background
Large numbers of both English-speaking and French-speaking Canadian-born moved
to the U.S. prior to the Great Depression, yet French-speakers were much less mobile
within Canada.3 It seems reasonable to assume that French-speakers would have had
fewer opportunities than English-speakers in most North American locations outside
Québec. Yet the language barrier did not seem to impede migration of French-speakers
to the U.S., only within Canada. Particularly during a period a large-scale western mi-
gration in Canada, expected net returns were higher on average for French-speakers in
New England than on the Canadian Prairie (Green, MacKinnon, and Minns, 2005). The
higher net returns to work in New England were due principally to two factors: more
employment opportunities for unskilled labour, and well-established networks of chain
migration.
Demand for unskilled labour in New England was particularly high because of the large
number of textile mills. And not only was demand for unskilled labour higher for male
heads of household, textile production also had the added benefit that women and chil-
3French speakers will generally refer to French speakers born in Québec unless otherwise stated. Theuse of the term ‘English speakers’ will mean ‘non-French speakers’ as it is used to refer to everyone elseother than French-speakers, unless otherwise stated.
2

dren were highly employable. While wages for unskilled labour in textiles were low,
family incomes were supplemented by the work of women and children.
Few other regions on the continent had the same employment opportunities for an en-
tire family outside of agriculture. Industrial employment opportunities for women and
children were few in the Canadian West. But employment opportunities for women and
children in most of the rest of the continent were few as well. English was necessary
to obtain more highly remunerative employment, and literacy was necessary to obtain
information on the changing labour market (Green, MacKinnon, and Minns, 2005, p.
829). In both these criteria, French speakers were at a disadvantage.
But that disadvantage was mitigated in New England because over time, deep and in-
tegrated networks of family and friends had been established, extending from small
communities in Québec, and reaching throughout many communities in New England
(MacKinnon and Parent, 2012). This meant that recent migrants could avail themselves
of assistance to adjust to their new community, and it meant that new and potential mi-
grants could receive information on employment opportunities, thereby mitigating the
language disadvantage.
Beyond the higher net returns, this network of chain migration also meant that parochial
schools with priests from Québec available to teach children French in a French Catholic
environment were readily available (Ramirez, 2001). In contrast, the few French Catholic
communities established in the West were scattered across the region, distant from
Québec, and generally distant from each other too. Culturally this meant that a French-
Canadian family migrating to western Canada would find themselves in a more sparsely
populated French environment compared to those migrating to New England.
3

But at some point in the past, French-Canadian migrants to New England faced the
same situation. While the data are less precise on French-Canadian migration before
1900, it is certain that outmigration from Québec accelerated in the last third of the 19th
century—a period prior to the increase in settlement of western Canada (Lavoie, 1972).
This established a population of French-speakers in New England who maintained ties
with Québec as it was not particularly distant. With the availability of employment
opportunities for several members of the family, and with a migrant population base
established providing the support of family and friends, and linguistic and cultural sup-
port, the net benefit of moving to New England was greater than moving West.
Once the Canadian West was opened for settlement with the establishment of a rail
branch line network, it attracted both the Canadian-born and European immigrants. Yet
Franco-Canadians were well under-represented in this flow. If the benefits of moving to
New England were the availability of employment for family members, then agricultural
employment on the Prairies would have provided that opportunity, as well as the ability
to own one’s own land. Non-English speaking European immigrants were willing to
settle on the Prairies.
While European immigrants were attracted to the Canadian Prairies, comparisons be-
tween French-Canadians and non-English speaking migrants can only be made if the
comparison is robust. Those emigrating from Eastern Europe settled across Canada;
only about a third settled on the Prairies (Green and Green, 1993). As well, of those who
did settle on the Prairies, many had some capital to use to before they were able to gen-
erate a harvest crop with revenues sufficient to live on. European immigrants settling the
Prairies were a subset of European immigrants to North America. Those that chose the
Prairies over other destinations in Canada, and in North America more generally, chose
that particular destination based on both their human and financial capital (Green and
4

Green, 1993). Relatively few French-speakers from Québec would have had the capital
sufficient to start a farm (Green, MacKinnon, and Minns, 2005). Without available labour
markets for women and children to supplement family incomes, migration to Western
Canada was not an option for most. And while relatively fewer French-speaking Cana-
dians settled on the Prairies than did English-speaking Canadians, there were still some
who did, particularly if those identifying themselves as bilingual rather than unilingual
French are included (Lew and Cater, 2012).
Factors influencing Canadian immigration to the U.S.
The dynamic U.S. labour market attracted Canadians. Changes to labour demand and
to immigration policy may have altered the numbers, and influenced the destination
choices of Canadians moving to the U.S.
Changes in U.S. immigration policy may have reduced flows of Canadians (Ramirez,
2001). Until 1917 there were no policy limits on Canadian immigration to the U.S. Im-
migrants could be denied entry if they were sick, or if they were viewed as likely to end
up as public charges. But this was merely a hurdle to be overcome and not a restriction,
as anyone not falling into either category would be admitted.
As part of the Immigration Act of 1917, a literacy test was introduced. The efficacy of
the literacy test itself has been questioned. MacKinnon and Parent (2012, p. 35) suggest
that literacy rates among French-Canadians had increased markedly by the this period
so a literacy test did not pose a barrier.4 Flows of immigrants from non English-speaking
countries of southern and eastern Europe resumed after the War as if uninterrupted.
4They do not discuss whether literacy per se or literacy in English are the same thing.
5

Following the literacy test, the U.S. adopted immigration quotes in 1921, and tightened
their restrictiveness substantially in 1924. The introduction of immigration quotas may
have had several distinct effects on Canadian immigration. The uncertainty over which
countries would be excluded may have induced a rush prior to their first being imple-
mented. Once the law was finalized to cover only European immigration, the reduction
of an unskilled labour supply from Europe could have shifted demand to labour from
Canada.
There were additional factors that may also have reduced French Canadian immigration.
Ramirez (2001) points to increased enforcement of child labour laws in New England as
potentially slowing immigration. Also the bias to technological change was reducing the
demand for the least skilled, particularly for women and children (Moehling, 1999). That
alone would have tended to slow the flow of Franco-Canadians as it would have reduced
family employment opportunities. MacKinnon and Parent (2012, p. 35) conclude that
technological change was most likely the cause of the slowdown of French Canadian
immigration to the New England during the 1920s.
Following MacKinnon and Parent (2012, p. 35), we illustrate the annual immigration
flows from Canada for both French and non-French Canadians. We repeat their method
using the year-of-arrival data in the U.S. Censuses (fig 1).5 These flows show that Cana-
dian immigration to the U.S. actually increased during the 1920s.6 Population totals
from the published census corroborate. The number of Canadian-born in the U.S., illus-
trated in table 1, increased between 1920 and 1930 both for English (non-French) and for
French (Carter et al., 2006, series Ad422–3). The number of French-Canadian immigrants
5MacKinnon and Parent (2012) use the 1900 Census for those arriving before 1896, the 1910 Census forarrivals between 1896 and 1905, the 1920 Census for arrivals between 1906 and 1915, and the 1930 Censusarrivals after 1915.
6MacKinnon and Parent (2012) show a decline in French-Canadian arrivals to New England duringthe 1920s. We find an increase, though they were using a preliminary census sample for 1930, and theiridentification of French-Canadians may differ.
6
to the U.S. fell between 1910 and 1920, possibly due to the literacy test; also possibly due
to the War though the number of non-French immigrants to the U.S. rose that decade as
well, albeit more modestly than in previous decades.
[Figure 1 about here.]
[Table 1 about here.]
The data in table 1 suggest a different conclusion; French-Canadian immigration to the
U.S. resumed during the 1920s. But as it resumed, it was changing in its composition
and destination. There was a modest shifting of destination for French-Canadian immi-
grant arrivals of the 1920s. In the two decades 1890–1910, approximately 80% of French
Canadian immigrants to the U.S. settled in New England. That share fell to 73% over
the decade 1910–1920, and fell again to under 70% over the 1920s, with the difference
made up by a shift to destinations in New York and Michigan. While indirect, this is ad-
ditional evidence that technological change altered labour demand. Increasing literacy
among French Canadians as MacKinnon and Parent (2012) suggest may have enabled
the regional and industrial shifting that this represented. We will provide some more
evidence on this below.
Occupational mix and migrant destination
The very different opportunities to which migrants were attracted is illustrated in fig-
ures 2 and 3. These figures show the distribution of male migrants, both domestic and
to the U.S., between two major occupational categories: farming, and unskilled labour.7
Because the comparison is between Canada and the U.S., the figures show migrant to-
tals regardless of period of arrival, as period of migration is unavailable in the Canadian
Census.
7IPUMS and CCRI use the same occupational coding. Farmers are identified by occupational codes1xx. Unskilled labour is defined by occupational codes 6xx and 9xx (below 975).
7
[Figure 2 about here.]
[Figure 3 about here.]
Migrants did not move to the U.S. to engage in agriculture. Though in the 1900 Cen-
sus, about 25% of English-speaking Canadian immigrants were in agriculture, that pro-
portion declines quite rapidly over the next two decades.8 For Canada as a whole,
French-speaking migrants were more likely than English-speaking migrants to work in
agriculture, though the difference is not quite statistically significant at the 95% level
in 1911 and 1921. But for those moving to the Prairies, the difference is large. For
French-speaking migrants to the Prairies, of which there were relatively few, farming
was overwhelmingly where they ended up, attracting better than 80%. And while the
majority of English-speaking migrants to the Prairies were also in agriculture, it accounts
for about 60% of the total. That illustrates very clearly the limited occupational oppor-
tunities available to French-speakers on the Prairies.
The same general pattern is evident among French-speaking migrants to Ontario, the
choice of most French-speaking interprovincial migrants. Agriculture was the largest
occupational category, and a much greater proportion of French-speaker migrants than
English were in agriculture. But at least before the Great Depression, the share in agri-
culture among French-speaking migrants to Ontario hovered around 50%, even below
in 1911. So only a slight majority of French-speakers moving to Ontario ended up in
agriculture.
In contrast, Canadian immigrants to the U.S. were more likely to be employed as un-
skilled labour. Around 25% of English-speaking Canadian immigrants, and about 50%
of French-speakers were employed as unskilled labour. For English-speakers, the ra-
tios of migrants to the U.S. and to Ontario in unskilled labour are about the same. For8It also is a measure of all migrants, not just recent arrivals. More on this difference below.
8

French-speaking migrants, the distribution of employment as unskilled labour is much
higher in the U.S. than in Canada overall.
Subdividing by region, there is little difference between French and English speakers in
the proportion employed as unskilled labour on the Prairies; the big difference being the
greater share of English-speaking employment in occupations other than agriculture or
unskilled labour. As well, it is not clear that French-speaking migrants to the U.S. were
more likely to be classified as unskilled labour than those moving to Ontario, at least in
1911 and 1921, due to the greater dispersion of the observations at the provincial level.
As timing of move can be identified for Canadian immigrants to the U.S., we show in fig-
ures 4 and 5 the comparison between the occupational distribution of all arrivals against
arrivals for the ten years up to each census year. The patterns of the recent arrivals is bet-
ter illustrative of the trends. Figure 4 does show that a steady 15% of English-speaking
Canadian immigrants chose agriculture, and only about 7.5% of French-speaking Cana-
dian immigrants did. Figure 5 illustratres better the changes in the unskilled labour
share of French-speaking immigrants. Most importantly, the share among the more re-
cent arrivals is considerably higher than for all arrivals, particularly in 1900 and 1910.
Those proportions are definitely larger than the share of unskilled labour among French-
speakers moving to Ontario in this period.
[Figure 4 about here.]
[Figure 5 about here.]
Both series illustrate a decline in the proportion of immigrants in unskilled labour over
time. It is clear that the proportion of French-speaking Canadian immigrants employed
as unskilled labour is lower in 1930 than in 1910 or 1900. It is not clear, however, whether
9
there was any decline from 1920 to 1930. It is also apparent that the share of English-
speaking Canadian immigrants employed as unskilled labour among the recent arrivals
remained unchanged from 1910 through 1930. That may suggest that demand for un-
skilled labour was not declining very rapidly, though this is a very rough measure as the
categories themselves may have evolved with the changes in technology. Though there
was no decline, there was no apparent increase either, so the restrictions on European
immigrants did not seem to have the same draw for Canadian immigrants as it did for
southern black migrants within the U.S. (Collins, 1997).
Estimating the relative mobility of Franco- and Anglo-Canadians,
and characterizing movers
Data and method
We turn to comparing migration rates by language and destination, and to classifying
key characteristics of migrants and the differences by language and destination. The data
used are the microdata files for the Canadian Census, 1901–1931, and the IPUMS U.S.
Census microdata files (Canadian Families Project, 2002; Canadian Century Research In-
frastructure (CCRI), 2009; Ruggles et al., 2010). The 1901 and 1911 Censuses are available
as 5% samples, the 1921 Census as a 4% sample and the 1931 Census as a 3% sample.
The IPUMS U.S. Census microdata files for 1900, 1910, 1920 and 1930 are 5%, 1%, 1%
and 5% samples respectively.
Available data can distinguish among the following choices for the Canadian-born: re-
main in province of birth, move to another province, or move to the U.S. An individual
is considered to have moved interprovincially if, at the time of the census, they are living
10

in a province other than their province of birth as recorded in the Canadian Census.9 The
U.S. Census identifies country of birth, so the sample of the Canadian-born choosing to
move to the U.S. are those living in the U.S. identifying their country of birth as Canada.
The U.S. Census also identifies the year moved, information not available for those who
moved interprovincially.
Given the availability and restrictions of the data, we model two different sets of com-
parisons of movers. We look at the binary choice of those choosing to move to the U.S.
compared to those remaining in Canada regardless of location of birth in Canada and
location at Census date. We also consider the three-choice model of those choosing to
remain in their province of birth, those choosing to move to another province, and those
choosing to move to the U.S. This three-choice model enables differentiation among
those who do move from their province of birth between interprovincial and interna-
tional migrants.
By looking at the binary-choice comparison of those moving to the U.S. and those re-
maining in Canada, the timing of the move can be included as the U.S. Census records
year of move. Therefore for this comparison, we are able to identify those who moved
when they were adults.10 We are also able to characterize movers from non-movers by
decade of move. This allows the tracking of changes in propensity to move and the
characteristics that determine the choice to move from census year to census year. This
addresses the question of whether English-speakers or French-speakers were more likely
to leave Canada. This comparison does not address the question of what characteristics
made interprovincial moves more or less likely.11
9No information is provided on the possible sequence of moves between birth and census date, and noinformation is available on timing of moves.
10We define an adult as 18 or older. As the census provides no information on family status at time ofmove, we do not know for sure that an adult moved independently or with their family, so we keep thedefinition of adult on the high side.
11That binary choice is examined in Lew and Cater (2012)
11

We also look at a three-choice model. We characterize the Canadian-born as selecting
from among three mutually exclusive options: remain in province of birth, move to
another province, or move to the U.S.12 This model highlights the differences between
interprovincial and international migrants. It does come at a cost because the timing of
interprovincial moves are unknown. So in using the three-choice model, we are unable
to distinguish between those who chose to move as adults and those who moved as chil-
dren with their parents. The lack of data on timing of move also reduces the precision
of capturing changes by decade. Our solution is to look at those in the age range 30–39
years. This choice does not eliminate the problem of including those who may have
moved as children, but in looking at changes from decade to decade, it better captures
the changes in the group of of those who would have been 20–29 year olds in the previ-
ous census, those most likely to have moved on their own during the intervening decade
(Rosenbloom and Sundstrom, 2004).
The binary choice of moving to the U.S. is modeled as a (binary) logit
ln Ω(x) = α + β1 age + β2 age2 + γ f emale + µ married
+ γm f emale×married + λ literate + ε
where
Ω(x) =Pr(move = 1|x)Pr(move = 0|x)
.
The three-destination choice is modeled as a multinomial logit
ln Ω(xi) = αi + β1i age + γi f emale + µi married
+ γmi f emale×married + λi literate + ε
12We assume the independence of irrelevant alternatives, which the results suggest are reasonable. Alsomultiple moves cannot be distinguished in these data.
12

where
Ω(x1) =Pr(movei = 1|x)Pr(movei = 3|x)
and
Ω(x2) =Pr(movei = 2|x)Pr(movei = 3|x)
and i ∈ interprovincial, U.S., no move.
We identify French-speakers as follows. There are French-speakers throughout Canada,
though the vast majority live in Québec, with both New Brunswick and Ontario having
non-trivial minority French-speaking populations. The strategy is to identify French-
speakers from Québec as the group most likely to have migrated to the U.S. For the
Canadian Census, French-speakers are identified as those born in Québec who declare
an ability to speak French in the Census regardless of whether they can speak English.
This leaves out the French-speakers from New Brunswick and Ontario, but their moves
are theorized to be motivated by different circumstances.13 As well, the numbers are not
large.
The U.S. Census does not report consistently on province of birth of the Canadian-born,
so we rely on the mother tongue definition, available from 1910.14 For 1900, mother
tongue is not available, but there is more detail than usual on province of birth. In par-
ticular, the 1900 U.S. Census identifies the birthplaces “French Canada” and “English
Canada” covering 85% of the Canadian-born. We include in the definition of non-French
those born in English-majority provinces (fewer than 0.3% of the observations). We leave
out the general category for birthplace of “Canada,” about 15% of observations of the
Canadian-born. While this different treatment of the U.S. 1900 Census sample may in-
13French-speakers living outside Québec likely had different incentives to learn English. The locallabour markets for French-only speakers were much smaller.
14Others, like Green, MacKinnon, and Minns (2005) use an algorithm to identify French names. This ismore important for Census years before mother tongue was recorded beginning with the Census of 1910.
13

troduce error in our measures over time, our results do not suggest major discontinuities
arising therefrom.15 We expect that estimates of overall migration rates will be under-
stated for 1900, and we presume this will affect our estimates for English-speakers more
than for French-speakers.
Binary choice: international movers
The sample used to estimate the binary choice model of international movers is the pop-
ulation of the Canadian-born living in the U.S. and Canada. We have restricted our
sample to those 18–54 years of age. Among those living in the U.S., we further restrict
our sample to those who moved to the U.S. over the decade ending with the census year,
and who moved as adults. Using only decadal movers yields the changes in mobility
from decade to decade. Restricting further the sample to include only those who moved
as adults insures that estimates are for those who chose to move themselves.
Results for the binary choice model are shown in table 2, and various marginal effects are
reported in table 3. Regressions are run separately on French and non-French speakers
for each census year. Note that age is included as the mean age per sample, scaled by a
factor of one-tenth. The coefficients on agem are the increase in the log-odds for each 10
year increase in age from the mean of about 32.5 years for the sample.
[Table 2 about here.]
[Table 3 about here.]15The option for uniformity of identifying French-speakers by last name across both the U.S. and Cana-
dian Census is not possible for the Canadian Censuses 1921 and 1931. Names are stripped out of theseCensus samples for which confidentiality still applies.
14
The average odds ratios of moving to the U.S. compared with remaining in Canada are
reported in the first row of table 3. These indicate the overall average likelihood of a
move to the U.S. For the decades 1891–1900 and 1901–1910, French-speakers were more
likely than English-speakers to move. But then the average odds of moving for French-
speakers drops quite sharply over the period 1911–1920, from 0.08 to 0.03. The average
odds for English-speakers moving also declines but not by as much. So over the decade
1911–1920, French migration rates to the U.S. fell below those of the English. Migration
rates increased over the 1920s for both groups by about the same percentage. The decline
in migration rates was greatest in the World War I decade, and the drop was particularly
large among French-speakers.
Whether the decline in Canadian immigration to the U.S. was driven by the introduc-
tion of the literacy test, can be quickly determined by reference to 1. The number of
adult immigrants to the U.S. does show a drop from 1916 to 1917 to about its lowest
level before the Depression in the year the literacy test requirement went into effect.16
But numbers had been declining since before the beginning of the War. The numbers of
English-speaking immigrants declined as well through the war years, reaching a trough
in 1917. And the decline in English-speaking immigrants to the U.S. was larger, both
absolutely and proportionately, then the decline in French-speaking immigrants. So it
seems unlikely that the literacy test reduced the immigrant flow, although it may have
had a part in changing the composition of the immigrant flow towards those more liter-
ate than had moved to the U.S. in the past.
The regression results characterize the odds of migrating by age, sex, marital status and
literacy. For every census year, the likelihood of moving declines much more rapidly
with age for English-speakers than French-speakers, at least over the first two decades.
16Passed Congress in February; effective as of May 1, 1917.
15

In the second two decades, the effect of age on the likelihood of migration for French-
speakers becomes more pronounced.
In 1900/01, the effect of age has reduced the odds of moving to the U.S. by half for
English-speakers approximately twelve years older than the mean age, while for French-
speakers it takes almost twenty years beyond the mean age for the odds of moving to
fall by half. By 1930/31, though, the odds of moving have fallen by half from their peak
for English-speakers for those eleven years older than the mean, whereas for French-
speakers the same decline is evident for those about thirteen years older than the mean
age. For French-speakers, the age at which the odds of moving to the U.S. has fallen
by half declines from 51 years in 1900 to about 45 years in 1930. There is little change
in the effect of age for French-speakers, or for English-speakers too, between 1900 and
1910. For French-speakers, however, the big increase in the effect of age on the odds of
moving occurs between 1910 and 1920. For English-speakers, while the overall change in
the effect of age on the odds of moving is much more modest, the largest change occurs
between 1920 and 1930. There is almost no change before 1920.
For both English- and French-speakers, the odds of moving for those in their early 20s
also declines over time. The difference between English- and French-speakers is that the
declines come in the first decade for French-speakers, but in the last decade for English-
speakers. In 1900 the odds for a twenty-two year old moving to the U.S. are about 0.82
and 0.76 of the odds of a thirty-two year old for French-speakers and English-speakers
respectively. Those odds decline to about 0.68 and 0.73 respectively in 1910, but remain
about the same in 1920 too. They then fall substantially for English-speakers in 1930,
down to about 0.57 of the odds ratio of a thirty-two year old English-speaker moving.
There is virtually no change for French-speakers.
16
The effect of age becomes increasingly important over the period 1900-1930. For French-
speakers, the larger change is the increased effect of age on reducing the odds of moving
for the older half of the distribution, particularly between 1910 and 1920. There is also
a reduction in the likelihood of younger French-speakers moving and that effect is most
pronounced between 1900 and 1910. For English-speakers, the effect of age on reducing
the mobility of those on the upper end of the distribution is much more modest, while
there is a large decline in the odds of moving for those at the bottom end of the age dis-
tribution between 1900 and 1910. The age distribution of movers does tighten, more at
the upper end for French-speakers. As such, the effect of age points to a role for labour
demand in shifting the makeup of Canadian immigrants to the U.S.
For all decades, for French-speakers, single females are less likely to move to the U.S.
than are single males. The effect is somewhat diminished by 1930, but is still significant.
Marriage increases the odds of French-speaking females moving to the U.S., though mar-
ried French-speaking females are less likely to move than are single French-speaking
males. For French-speaking males, marriage reduces the odds of moving through 1920.
That reverses during the 1920s, when French-speaking males who move to the U.S. are
much more likely to be married.
In contrast, for English-speakers, females are more likely to move to the U.S. compared
to single males over the entire period. Marriage has essentially no effect on the odds of
English-speaking females moving to the U.S. In contrast, the effect of marriage on the
odds of English-speaking males vary over time. In the first decade, 1890–1900, marriage
boosts slightly the odds of moving for males, though not for females. In the 1920s, mar-
riage has a more substantial boost on the odds of moving for English-speaking males
such that married males are more likely to move than females.
17

Prior to the 1920s, marriage had little effect on the odds of English-speakers moving to
the U.S. Marital status didn’t differentiate movers from non-movers among this group.
However, for French-speakers, marriage reduced the odds for males moving and in-
creased the odds for females moving, at least up until the 1920s. During the 1920s,
French-speakers who moved were more likely to be married. Among English-speakers,
male movers during the 1920s were also more likely to be married. The relative decline
in the movement of single males during the 1920s does suggest a change occurring in
the 1920s.
The indicator that distinguishes movement to the U.S. over time and between English
and French is the changing importance of literacy. For English, literacy was a key char-
acteristic of movers, and its effect was increasing every period. As well, literacy was the
largest predictor of movers among English-speakers. The marginal effect of literacy is
reported in table 2, and is graphed in figure 6.
[Figure 6 about here.]
The marginal effect of literacy on the odds of moving for English-speakers ranges from
a low of 0.04 from 1911–1920, to a high of 0.06 from 1921–1930. But there really is no
trend. And for French-speakers too, literacy was also a characteristic of movers. Movers
to the U.S. among the French were less likely to be literate. The marginal effect of liter-
acy was most negative for the decade 1890–1900. It was not quite as negative over the
next two decades. After 1920, the effect of literacy no longer distinguishes movers from
non-movers among French-speakers. While French-speakers who migrated to the U.S.
during the 1920s were not more literate than those that did not, they were no longer
less literate.There was a net increase in the effect of literacy on the odds of moving for
French-speakers into the 1920s.
18

For French-speaking migrants to the U.S., the 1920s represents a period of change for
the composition of those who did move. Literacy no longer distinguished movers from
non-movers. While the marginal effect of literacy for both English- and French-speakers
increased during the decade 1921–1930, for English-speakers the marginal effect of liter-
acy ends up no higher than it had been two decades earlier. So with a relative increase
in the effect of literacy on the odds of moving among French-speakers with no long run
trend apparent among English-speakers, the effect of literacy restrictions may indeed
have had some teeth. But that conclusion should be moderated by the caveat that the
relative mix of employment of English- and French-speakers differed as well, so if there
was a shift in demand for more skilled workers, it would have had a relatively larger
effect on French-speakers who were more likely to be found in unskilled occupations.
And yet there was no obvious shift of French-speakers in the U.S. away from unskilled
labour; the share of employment was statistically the same as it had been in the previous
decade.
Distinguishing between interprovincial and international movers
A comparison between interprovincial and international movers for English and French
migrants is modeled as a multinomial logit. Lacking observations on the timing of
moves interprovincially, these estimates are for 30–39 year olds only. The samples for
these estimates are different from those used above in the binary choice model so a di-
rect comparison of the values of the coefficients is inappropriate. Again, age is included
as the deviation from the mean of age per sample. Because of the narrow age range, the
square of age is not included.17
The results of the three-choice model are reported in 4. Panel A reports results for those
choosing to move interprovincially while panel B reports the estimates for the interna-
17It was not significant when included.
19

tional movers. The hold out category is those that remained in their province of birth.
[Table 4 about here.]
The average odds ratios are calculated from the results and are reported in table 5, first
row of each panel. The values are the odds ratios of moving either interprovincially
or to the U.S. compared to those that remained in their province of birth, and they are
averaged over the sample.
[Table 5 about here.]
The odds for English-speakers moving to the U.S. is quite a bit larger than for migrat-
ing interprovincially, though the difference narrows somewhat over time. In 1900/01,
the odds for English-speakers moving to the U.S. are larger than the odds for moving
interprovincially. Over the next decade the odds increase for an interprovincial move
while barely changing for a move to the U.S. Over the next two decades, the odds of
moving to the U.S. declines while the odds of moving interprovincially remain about the
same, so the difference between the two settles at about 0.05 over the last two decades.
Over the full period, English-speakers are more likely to move to the U.S. than to move
interprovincially, and this includes the period of western settlement.
For French-speakers, the differences in odds ratios for international versus interprovin-
cial movers are much greater, though the difference is driven more by the very low odds
of interprovincial moves. The odds ratios for interprovincial moves range from a low of
0.007 in 1910/11, to a high of 0.02 in 1930/31. The lowest odds ratio values for French
interprovincial movers, ironically, is in the period of most rapid western settlement.
20

The odds for French-speakers moving to the U.S. range from a high of 0.33 in 1900/01 to
a low of 0.18 in 1930/31. At their peak on average one French-speaker born in Québec
moved for every three that remained. That ratio fell somewhat over the period, but
only to a ratio of 1 in 5 by 1930/31. In other words, at its trough, the odds ratio of
an international outmigration from Québec was as high as the peak odds ratio of in-
terprovincial migration for English-speakers. This illustrates very starkly the very high
rate of movement of Québeckers to the U.S., and the very low rate at which they moved
interprovincially, and that includes those moving to Ontario.
Comparing the mobility of English- and French-speakers, the key distinguishing feature
is the difference in odds of interprovincial moves. But equally interesting is the relatively
high rates of migration of English-speakers to the U.S., rates that persist even through
the period of large-scale western settlement. The odds of English-speakers moving to
the U.S. are only 5% less than for French-speakers in 1900/01, the odds are equal by
1920/21, and the odds are actually greater for English-speakers moving to the U.S. by
1930/31, 20% versus 18%. That Anglo-Canadians were drawn to the U.S. as strongly as
were Franco-Canadians is a point worth stressing, though historians like Ramirez (2001)
and Widdis (1998), and economic historians like McInnis (1994)—for a slightly earlier
period—have stressed this.
The effect of age on the odds of migration varies. For English-speakers, interprovincial
migrants are likely to be younger in 1911, but older in the latter two decades. The effect
of age is also greater for English-speakers moving to the U.S., and it increases over the
first three decades, before declining quite substantially by the 1930 Census. This is evi-
dence of change occurring during the 1920s. For French-speakers, age has no differential
effect on interprovincial movers relative to those that didn’t move. For French-speaking
migrants to the U.S., the effect of age varies by census year, positive and significant in
21

the first two years, insignificant in the third, and positive and significant in the fourth.18
For French-speakers, virtually none of the characteristics considered differentiated inter-
provincial movers from non-movers. The only exception is that interprovincial movers
in 1911 were slightly more literate than non-movers, and ever so slightly more literate
than non-movers in 1931. But for French-speaking international movers, literacy did dis-
tinguish movers from non-movers, with movers being less literate than non-movers over
the first three decades. For the decade 1920–1930, literacy had a statistically significant
and positive effect on movers to the U.S. While this shift could reflect an increase in
demand for skilled workers by U.S. employers, the change seems rather abrupt and of
fairly large magnitude, suggesting a role for the change in immigration requirement for
literacy.
For English-speakers, interprovincial movers were more likely to be male. The marginal
effect of female is negative and statistically significant for all years. In particular, the
negative marginal effect of female for singles is large in all years, but largest in 1911
when western settlement was at its peak. This is consistent with the settlement period
favouring males. The marginal effect of female for those married is also negative, but
is not very large and is no longer statistically significant by 1931. The marginal effect
of marital status is not significant in 1901 and 1911, and is statistically significant and
positive in 1921 and 1931.
English-speakers moving to the U.S. were quite different. The marginal effect of female
is negative only for 1900, though it is small and barely significant for both single and
married. It becomes positive and statistically significant for 1921 and 1931, and is even
larger for single females in those two years. While females were less likely to move in-
18Marginal effects not yet available.
22

terprovincially, they became more likely to move to the U.S. in the latter two decades of
the period.
Literacy was an important characteristic of English-speakers who moved, both inter-
provincially and to the U.S. However, the marginal effect of literacy was much larger
for movers to the U.S. than for interprovincial movers. The marginal effect of literacy in
1901 is slightly odd as it is negative for English interprovincial movers, but is simply sta-
tistically insignificant for French interprovincial movers. Lew and Cater (2012) find that
the marginal effect of literacy is positive in 1901, though not large, for English-speaking
interprovincial movers, but that was for a sample that excluded those living in the U.S.
English-speaking migrants moving to the U.S. were considerably more likely to be lit-
erate. As well, they find that no effect of literacy for French-speaking interprovincial
migrants for this entire period. The inclusion of those living in the U.S. in the compari-
son makes those who did move interprovincial appear modestly more literate.
The slightly surprising result is that interprovincial movers, particularly those moving
to the Prairies, would be more literate. But as Green, MacKinnon, and Minns (2005)
argue, literacy was important for gathering information on employment opportunities,
particularly in a region where few migrants would have had deep network linkages. It
is otherwise not surprising to note that English-speaking Canadians moving to the U.S.
were much more likely to be literate. Unlike the French-speaking migrants choosing the
New England mills, Canadians migrating to the U.S. faced considerably more competi-
tion. So for those pursuing higher income occupations, human capital was much more
important.
23

Conclusions
We have illustrated some well-known migration trends, and have quantified them for
comparison. Migration by Canadians to the U.S. was substantial through this period
regardless of language spoken. We note that odds of migration to the U.S. by English-
speakers was even greater than was the odds of their moving interprovincially. In other
words, even during a period of substantial western settlement, the U.S. proved to be a
larger a draw to English-speaking Canadians. We note further that migration to the U.S.
by English-speakers was virtually as large a share of the English-speaking population as
was the French migration to the U.S., in fact even larger during the 1920s.
The relative increase in migration to the U.S. by Anglo-Canadians raises the question as
to why there was an increase in average literacy among migrants from Québec in the
1920s. Part of the explanation may be the introduction of the literacy test as a condition
of admission to the U.S. in 1917. Some evidence supports that hypothesis, though not
conclusively. Another reason may be the shifting nature of labour demand. Migration
from Québec was highly specific in region of destination and industry of choice, and a
decline in the demand for unskilled labour may well have contributed to reduce migra-
tion. Certainly, an increase in literacy rates and a decline in the migration of single males
suggest this, as does the modest shifting of the destination choices of French Canadians
gradually away from New England. As well a tightening of the distribution of the age
composition of migrants also supports this thesis. It is not clear why, if literacy was the
only obstacle, we would observe fewer younger adult migrants as well as fewer older.
Presumably the young are more adaptable to such a change.
The analysis is also illustrative of the origins of the displacement debate. English-
speaking Canadians moved to the U.S. at a rate even greater than they moved West.
And those moving to the U.S. were substantially more literate than average. It is easy to
24

see why there was concern over a brain drain early in the twentieth century in Canada.
Additionally, the sample used includes only those born in Canada, so the literacy dif-
ferential relative to a Canadian population including European immigrants would have
been greater still.
We are not suggesting causation, as promulgators of the displacement thesis certainly
were. In fact, just the opposite. The evidence of an increase in the importance of literacy
for migrants to the U.S. is more suggestive of labour demand from the U.S. drawing in
the Canadian-born. Displacement by less literate immigrants would be more likely to
push out the less literate in Canada, not the more literate. Immigrant labour would be
substituted for the labour of the less skilled Canadian-born thereby lowering wages and
increasing the attractiveness of the U.S. We might even expect the more literate to have
reduced their out-migration due to immigration, as immigrant labour might have even
be complementary to the higher skilled.
Canadians were highly mobile and were willing to move within the entire continent in
pursuit of better opportunities. The Canadian-born had the best of both worlds, they
could choose to remain in Canada and participate in the booming economy of the early
twentieth century. Or they could move to the U.S. to take advantage of a particular
specialized skill that the smaller Canadian market did not value as highly. While our
measure of GDP is, by definition, constrained by borders, the implied per capita GDP of
the Canadian-born must have been particularly high.
25
References
Canadian Century Research Infrastructure (CCRI). 2009. “Census of Population, Canada
(1911–1951).”
Canadian Families Project. 2002. “National Sample of the 1901 Census (Canada).”
Carter, Susan B., Scott Sigmund Gartner, Michael R. Haines, Alan L. Olmstead, Richard
Sutch, and Gavin Wright, editors. 2006. Historical Statistics of the United States. Cam-
bridge University Press, millential edition ed.
Collins, William J. 1997. “When the Tide Turned: Immigration and the Delay of the Great
Black Migration.” Journal of Economic History 57:607–32.
Green, Alan, Mary MacKinnon, and Chris Minns. 2005. “Conspicuous by their Absence:
French Canadians and the Settlement of the Canadian West.” Journal of Economic His-
tory 65 (3):822–49.
Green, Alan G. and David A. Green. 1993. “Balanced Growth and the Geographical
Distribution of European Immigrant Arrivals to Canada, 1900–1912.” Explorations in
Economic History 30:31–59.
Lew, Byron and Bruce Cater. 2012. “The Role of Education and Ethnicity in Interprovin-
cial Migration, 1891–1951.”
MacKinnon, Mary and Daniel Parent. 2012. “Resisting the Melting Pot: The Long Term
Impact of Maintaining Identity For Franco-Americans in New England.” Explorations
in Economic History 49 (1):30–59.
McInnis, Marvin. 1994. Migration and the International Labor Market, 1850–1939, chap.
Immigration and Emigration: Canada in the Late Nineteenth Century. Routledge,
139–55.

Moehling, Carolyn M. 1999. “State Child Labor Laws and the Decline of Child Labor.”
Explorations in Economic History 36 (1):72–106.
Ramirez, Bruno. 2001. Crossign the 49th Parallel: Migration from Canada to the United States,
1900–1930. Ithaca: Cornell University Press.
Rosenbloom, Joshua L. and William A. Sundstrom. 2004. “The Decline and Rise of Inter-
state Migration in the United States: Evidence from the IPUMS, 1850-1990.” Research
in Economic History 22:289–325.
Ruggles, Steven, J. Trent Alexander, Katie Genadek, Ronald Goeken, Matthew B.
Schroeder, and Matthew Sobek. 2010. Integrated Public Use Microdata Series: Version
5.0 [Machine-readable database]. Minneapolis: University of Minnesota.
Widdis, Randy W. 1998. With Scarcely a Ripple: Anglo-Canadian Migration into the United
States and Western Canada, 1880–1920. McGill-Queen’s University Press.

Table 1: Canadian-born in the United States
Total French Other
1890 980,938 302,496 678,4421900 1,179,922 395,126 784,7961910 1,209,717 385,083 824,6341920 1,138,174 307,786 830,3881930 1,310,369 370,852 939,517
Source: Carter et al. (2006).
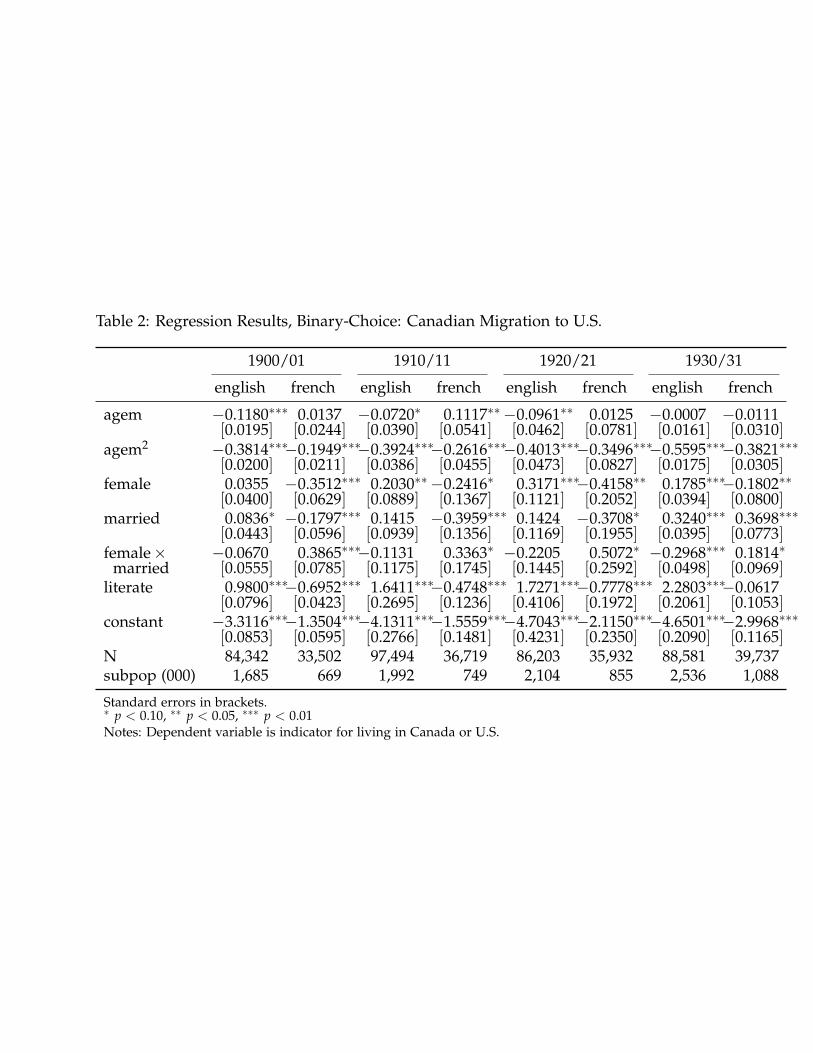
Table 2: Regression Results, Binary-Choice: Canadian Migration to U.S.
1900/01 1910/11 1920/21 1930/31
english french english french english french english french
agem −0.1180∗∗∗ 0.0137 −0.0720∗ 0.1117∗∗−0.0961∗∗ 0.0125 −0.0007 −0.0111[0.0195] [0.0244] [0.0390] [0.0541] [0.0462] [0.0781] [0.0161] [0.0310]
agem2 −0.3814∗∗∗−0.1949∗∗∗−0.3924∗∗∗−0.2616∗∗∗−0.4013∗∗∗−0.3496∗∗∗−0.5595∗∗∗−0.3821∗∗∗[0.0200] [0.0211] [0.0386] [0.0455] [0.0473] [0.0827] [0.0175] [0.0305]
female 0.0355 −0.3512∗∗∗ 0.2030∗∗−0.2416∗ 0.3171∗∗∗−0.4158∗∗ 0.1785∗∗∗−0.1802∗∗[0.0400] [0.0629] [0.0889] [0.1367] [0.1121] [0.2052] [0.0394] [0.0800]
married 0.0836∗ −0.1797∗∗∗ 0.1415 −0.3959∗∗∗ 0.1424 −0.3708∗ 0.3240∗∗∗ 0.3698∗∗∗[0.0443] [0.0596] [0.0939] [0.1356] [0.1169] [0.1955] [0.0395] [0.0773]
female× −0.0670 0.3865∗∗∗−0.1131 0.3363∗ −0.2205 0.5072∗ −0.2968∗∗∗ 0.1814∗married [0.0555] [0.0785] [0.1175] [0.1745] [0.1445] [0.2592] [0.0498] [0.0969]
literate 0.9800∗∗∗−0.6952∗∗∗ 1.6411∗∗∗−0.4748∗∗∗ 1.7271∗∗∗−0.7778∗∗∗ 2.2803∗∗∗−0.0617[0.0796] [0.0423] [0.2695] [0.1236] [0.4106] [0.1972] [0.2061] [0.1053]
constant −3.3116∗∗∗−1.3504∗∗∗−4.1311∗∗∗−1.5559∗∗∗−4.7043∗∗∗−2.1150∗∗∗−4.6501∗∗∗−2.9968∗∗∗[0.0853] [0.0595] [0.2766] [0.1481] [0.4231] [0.2350] [0.2090] [0.1165]
N 84,342 33,502 97,494 36,719 86,203 35,932 88,581 39,737subpop (000) 1,685 669 1,992 749 2,104 855 2,536 1,088
Standard errors in brackets.∗ p < 0.10, ∗∗ p < 0.05, ∗∗∗ p < 0.01Notes: Dependent variable is indicator for living in Canada or U.S.

Table 3: Marginal Effects, Binary Choice: Canadian Migration to U.S.
1900/01 1910/11 1920/21 1930/31
english french english french english french english french
odds ratio 0.0713∗∗∗ 0.1088∗∗∗ 0.0659∗∗∗ 0.0838∗∗∗ 0.0418∗∗∗ 0.0330∗∗∗ 0.0680∗∗∗ 0.0414∗∗∗[0.0010] [0.0020] [0.0019] [0.0036] [0.0015] [0.0020] [0.0008] [0.0009]
literate 0.0466∗∗∗−0.0921∗∗∗ 0.0555∗∗∗−0.0481∗∗∗ 0.0355∗∗∗−0.0355∗∗∗ 0.0626∗∗∗−0.0026[0.0024] [0.0069] [0.0041] [0.0150] [0.0035] [0.0126] [0.0017] [0.0046]
Standard errors in brackets.∗ p < 0.10, ∗∗ p < 0.05, ∗∗∗ p < 0.01

Table 4: Regression Results: Interprovincial and International Migration
1900/01 1910/11 1920/21 1930/31
english french english french english french english french
Panel A: Interprovincial Migrationagem 0.0329 0.2747 −0.1327∗∗−0.3344 0.2246∗∗∗ 0.1255 0.1571∗∗ 0.1410
[0.0692] [0.3185] [0.0537] [0.3985] [0.0542] [0.2477] [0.0650] [0.2292]female −1.1234∗∗∗−0.2356 −1.1136∗∗∗−0.6820 −0.6918∗∗∗ 0.364 −0.5404∗∗∗−0.0193
[0.0885] [0.4064] [0.0668] [0.4479] [0.0657] [0.3164] [0.0792] [0.2695]married −0.2443∗∗∗−0.1806 −0.3053∗∗∗−0.2865 −0.1827∗∗∗ 0.3063 −0.0970∗ 0.0468
[0.0551] [0.3181] [0.0427] [0.3377] [0.0469] [0.2722] [0.0582] [0.2254]female× 0.9453∗∗∗−0.0155 0.9358∗∗∗ 0.7445 0.6104∗∗∗−0.2175 0.4880∗∗∗ 0.1991
married [0.1003] [0.4611] [0.0762] [0.5084] [0.0751] [0.3542] [0.0899] [0.3098]literate 0.0053 0.0433 0.7078∗∗∗ 0.7181 0.7506∗∗∗ 0.0261 0.5005∗∗∗ 0.5881
[0.0756] [0.2531] [0.0817] [0.4858] [0.1002] [0.3099] [0.1259] [0.4050]cons −1.4701∗∗∗−4.0291∗∗∗−1.5761∗∗∗−5.0672∗∗∗−1.6370∗∗∗−4.1640∗∗∗−1.7290∗∗∗−4.2800∗∗∗
[0.0819] [0.3211] [0.0853] [0.5410] [0.1038] [0.3667] [0.1305] [0.4296]
Panel B: International Migrationagem 0.1816∗∗∗ 0.2128∗∗∗ 0.2627∗∗∗ 0.3950∗∗∗ 0.5347∗∗∗ 0.1689 0.1599∗∗∗ 0.2863∗∗∗
[0.0465] [0.0694] [0.0868] [0.1307] [0.0913] [0.1435] [0.0497] [0.0747]female −0.2366∗∗∗−0.6203∗∗∗−0.1217 −0.2420 0.1362 −0.1702 0.1300∗∗−0.0242
[0.0528] [0.0911] [0.0997] [0.1581] [0.1034] [0.1755] [0.0593] [0.0945]married 0.1484∗∗∗−0.2152∗∗∗ 0.1313∗ −0.4383∗∗∗−0.0404 −0.1032 0.0722 0.2280∗∗∗
[0.0414] [0.0671] [0.0778] [0.1228] [0.0870] [0.1380] [0.0489] [0.0757]female× 0.1578∗∗ 0.5586∗∗∗ 0.0758 0.3444∗ −0.0013 0.2801 −0.0861 0.0840
married [0.0613] [0.1009] [0.1148] [0.1795] [0.1200] [0.1974] [0.0678] [0.1058]literate 1.2658∗∗∗−0.2865∗∗∗ 1.4064∗∗∗−0.5208∗∗∗ 2.2142∗∗∗−0.4698∗∗∗ 1.8716∗∗∗ 0.3609∗∗∗
[0.0790] [0.0481] [0.1862] [0.1096] [0.3574] [0.1469] [0.1695] [0.1144]cons −2.0422∗∗∗−0.1957∗∗∗−2.1639∗∗∗−0.0440 −3.1474∗∗∗−0.6757∗∗∗−3.0527∗∗∗−2.0194∗∗∗
[0.0852] [0.0705] [0.1928] [0.1411] [0.3620] [0.1756] [0.1733] [0.1275]
N 29,162 11,712 26,786 10,217 24,640 10,130 27,008 12,826N subpop 579,934 233,020 667,504 259,074 707,711 286,965 725,237 333,014
Standard errors in brackets.∗ p < 0.10, ∗∗ p < 0.05, ∗∗∗ p < 0.01Notes: Dependent variable is indicator for living in province of birth, living in Canada outside provinceof birth, or living in U.S.

Table 5: Marginal Effects on Odds of Interprovincial and International Moves, 1900/01–1930/31
Interprovincial International
English French English French
Panel A: 1900/01odds ratio 0.1007∗∗∗ 0.0094∗∗∗ 0.2824∗∗∗ 0.3347∗∗∗
[0.0018] [0.0009] [0.0026] [0.0044]married 0.0042 −0.0019 0.0418∗∗∗ 0.0090
[0.0038] [0.0024] [0.0058] [0.0108]female −0.0338∗∗∗ −0.0017 −0.0132∗∗ −0.0367∗∗∗
[0.0035] [0.0018] [0.0052] [0.0087]–single −0.0857∗∗∗ −0.0004 −0.0189∗∗ −0.1322∗∗∗
[0.0064] [0.0043] [0.0096] [0.0191]–married −0.0138∗∗∗ −0.0020 −0.0110∗ −0.0130
[0.0042] [0.0020] [0.0062] [0.0098]literate −0.0261∗∗∗ 0.0013 0.1885∗∗∗ −0.0652∗∗∗
[0.0080] [0.0021] [0.0078] [0.0111]
Panel B: 1910/11odds ratio 0.1574∗∗∗ 0.0066∗∗∗ 0.2723∗∗∗ 0.3012∗∗∗
[0.0022] [0.0007] [0.0048] [0.0079]married 0.0002 0.0008 0.0309∗∗∗ −0.0585∗∗∗
[0.0047] [0.0016] [0.0109] [0.0197]female −0.0512∗∗∗ −0.0006 0.0039 0.0059
[0.0043] [0.0014] [0.0096] [0.0157]–single −0.1330∗∗∗ −0.0036 0.0183 −0.0525
[0.0079] [0.0027] [0.0184] [0.0350]–married −0.0211∗∗∗ −0.0002 −0.0014 0.0208
[0.0051] [0.0016] [0.0113] [0.0175]literate 0.0479∗∗∗ 0.0042∗∗∗ 0.1833∗∗∗ −0.1176∗∗∗
[0.0083] [0.0016] [0.0169] [0.0257]
Continued on next page

Table 5: continued
Interprovincial International
English French English French
Panel C: 1920/21odds ratio 0.1854∗∗∗ 0.0168∗∗∗ 0.2310∗∗∗ 0.2331∗∗∗
[0.0025] [0.0012] [0.0046] [0.0072]married 0.0142∗∗∗ 0.0027 −0.0015 0.0053
[0.0055] [0.0026] [0.0106] [0.0175]female −0.0395∗∗∗ 0.0029 0.0334∗∗∗ 0.0081
[0.0049] [0.0024] [0.0091] [0.0145]–single −0.1024∗∗∗ 0.0058 0.0521∗∗∗ −0.0309
[0.0093] [0.0045] [0.0182] [0.0306]–married −0.0183∗∗∗ 0.0021 0.0271∗∗∗ 0.0191
[0.0058] [0.0028] [0.0105] [0.0164]literate 0.0589∗∗∗ 0.0024 0.1994∗∗∗ −0.0927∗∗∗
[0.0114] [0.0045] [0.0138] [0.0314]
Panel D: 1930/31odds ratio 0.1584∗∗∗ 0.0216∗∗∗ 0.2070∗∗∗ 0.1824∗∗∗
[0.0024] [0.0014] [0.0023] [0.0032]married 0.0151∗∗∗ 0.0021 0.0001 0.0378∗∗∗
[0.0054] [0.0031] [0.0054] [0.0072]female −0.0230∗∗∗ 0.0027 0.0155∗∗∗ 0.0058
[0.0048] [0.0028] [0.0045] [0.0064]–single −0.0701∗∗∗ −0.0003 0.0370∗∗∗ −0.0031
[0.0092] [0.0052] [0.0093] [0.0121]–married −0.0086 0.0036 0.0090∗ 0.0085
[0.0056] [0.0033] [0.0052] [0.0074]literate 0.0319∗∗ 0.0089∗ 0.1684∗∗∗ 0.0467∗∗∗
[0.0139] [0.0053] [0.0073] [0.0137]
Standard errors in brackets.∗ p < 0.10, ∗∗ p < 0.05, ∗∗∗ p < 0.01Sources: See text. Dependent variable is indicator for movinginterprovincially, moving to the U.S., or remaining in province ofbirth.

Figure 1: Year of Arrival in U.S., Canadian-born, French and English.

Figure 2: Proportion of Canadian-born Migrants Employed in Agriculture, by Destina-tion, by Language.

Figure 3: Proportion of Canadian-born Migrants Employed as Unskilled Labour, by Des-tination, by Language.
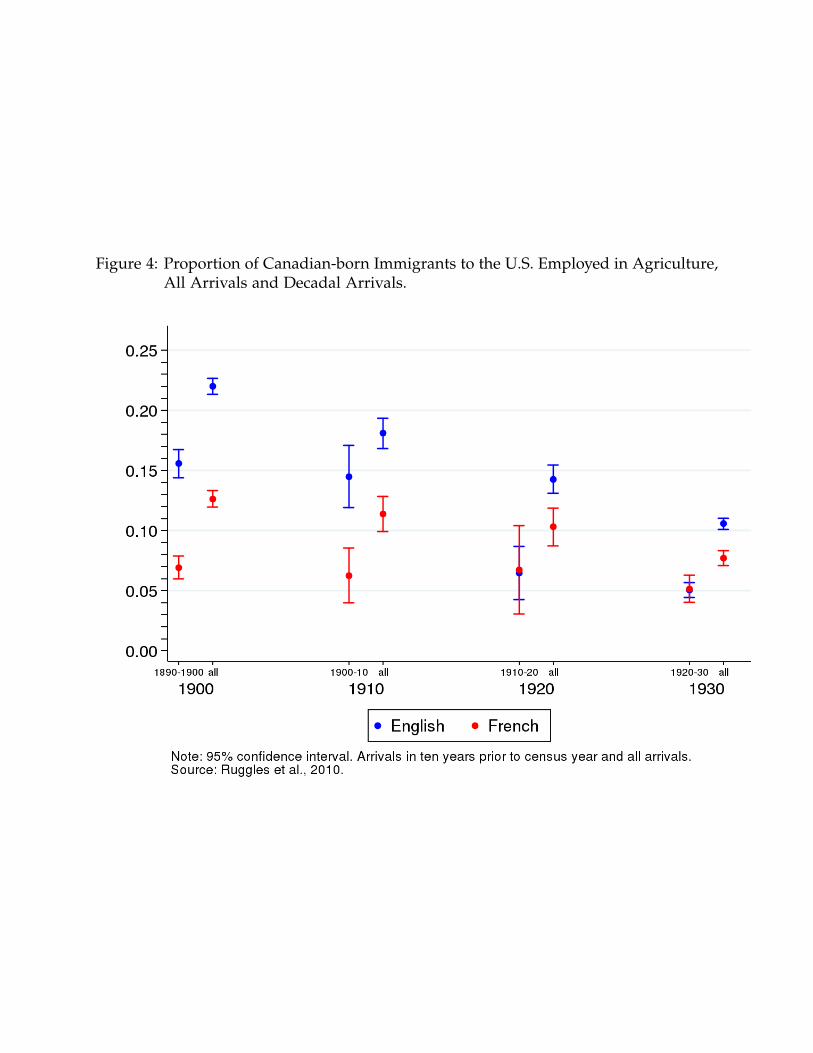
Figure 4: Proportion of Canadian-born Immigrants to the U.S. Employed in Agriculture,All Arrivals and Decadal Arrivals.

Figure 5: Proportion of Canadian-born Immigrants to the U.S. Employed as UnskilledLabour, All Arrivals and Decadal Arrivals.
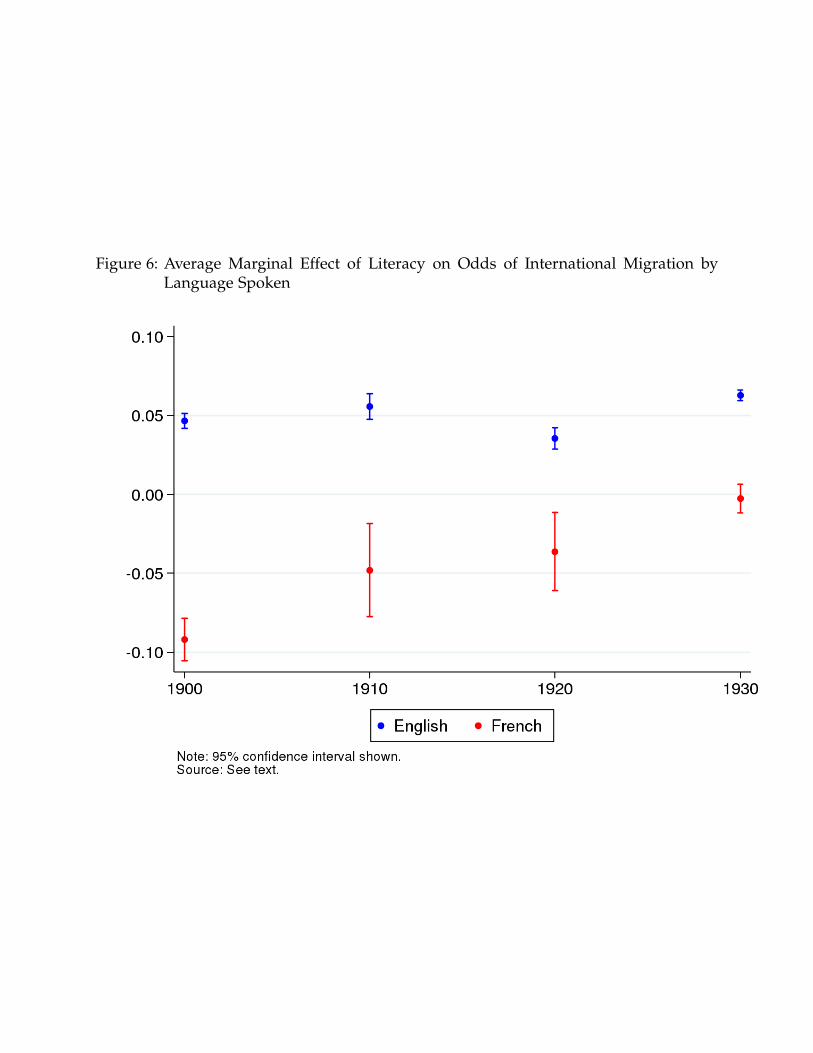
Figure 6: Average Marginal Effect of Literacy on Odds of International Migration byLanguage Spoken