canadian clean power coaltion studies on co2 capture and
TRANSCRIPT

CANADIAN CLEAN POWER COALITION STUDIES ON CO2 CAPTURE AND STORAGE
Report Number PH4/27 March 2004
This document has been prepared for the Executive Committee of the Programme. It is not a publication of the Operating Agent, International Energy Agency or its Secretariat.
i
CANADIAN CLEAN POWER COALITION STUDIES ON CO2 CAPTURE AND STORAGE
OVERVIEW BY THE IEA GREENHOUSE GAS R&D PROGRAMME
Introduction The IEA Greenhouse Gas R&D Programme (IEA GHG) has participated in a series of studies on capture and storage of CO2 through its membership of phase 1 of the Canadian Clean Power Coalition (CCPC). IEA GHG joined the CCPC mainly as a cost-effective way of obtaining information on retrofit of CO2 capture to power plants and the effects of coal rank on the costs of capture. This overview, written by IEA GHG, summarises the main results from the CCPC studies and provides a comparison with other studies carried out by IEA GHG. A longer summary report produced by the CCPC itself is also provided. The CCPC was set up in mid 2001 by seven Canadian utility companies (ATCO Power, EPCOR Utilities, Luscar, Nova Scotia Power, Ontario Power Generation, SaskPower and TransAlta Utilities). Subsequently EPRI joined the coalition, followed by IEA Environmental Projects Ltd, on behalf of IEA GHG and the IEA Clean Coal Centre. Additional financial support was provided by the governments of Canada, Alberta and Saskatchewan. The goals of the CCPC are:
• To secure a future for coal-fired electricity generation within the context of Canada’s multi-fuelled electricity industry.
• To demonstrate that coal-fired electricity generation can effectively address all environmental
issues projected in the future, including CO2.
• To research and develop commercially viable clean coal technology, and thence to construct and operate a full scale demonstration project to remove greenhouse gas and all other emissions of concern by 2010.
Phase 1 of the CCPC consisted of conceptual engineering and feasibility studies to assess technologies and fuels that should be used in the demonstration plants and to identify options for storage of the CO2 from a demonstration plant. Subsequent phases will involve preparation of a business case for the demonstration plant and detailed design and construction of the plant. IEA GHG will withdraw from the CCPC after Phase 1 because the costs of subsequent phases are beyond its financial resources. The detailed reports of studies carried out in Phase 1 of the CCPC are confidential to members of the CCPC. The IEA GHG project team has copies of the reports. They can be made available to members of IEA GHG provided they sign the necessary confidentiality agreements and all of the members of the CCPC give their approval. This summary report contains only non-confidential information.

ii
Study description The studies carried out in Phase 1 of the CCPC are listed in table 1. Table 1 Studies carried out in Phase 1 of the CCPC Subject Contractor
Pre-screening study SFA Pacific
Retrofit technologies for control of non-CO2 emissions Neil and Gunter
Amine scrubbing and oxyfuel combustion Fluor
Gasification Fluor
CO2 storage and utilisation in Western Canada SNC Lavalin
CO2 storage in coal beds in Nova Scotia Geological Survey of Canada The specifications for these studies were defined by the members of the CCPC before IEA GHG joined. Although IEA GHG could not influence the original study specifications it was involved in discussions which helped to determine the course of the studies after they had started, particularly the capture studies carried out by Fluor. The pre-screening study recommended gasification for new greenfield power plants. Gasification may also be preferred for CO2 capture at existing plants but most of the existing equipment would need to be discarded. Amine scrubbing and oxyfuel combustion would enable more of the existing equipment to be retained, which may appeal to some utilities. Based on these conclusions, the CCPC originally intended to evaluate amine scrubbing and oxyfuel technologies mainly for retrofits and to evaluate gasification mainly for greenfield plants. However, during the course of Fluor’s studies it became apparent that retrofits would be less attractive than expected. The later stages of the studies therefore concentrated on greenfield applications for all technologies Plant sites and coal analyses The CCPC study was based on three Canadian power plant sites, each using a different local coal:
• Nova Scotia: bituminous coal • Alberta: sub-bituminous coal • Saskatchewan: lignite
Analyses and costs of these coals are given in table 2, along with those of the Australian bituminous coal used in IEA GHG’s other studies. The CCPC bituminous coal is higher rank than IEA GHG’s standard coal (for example the oxygen and moisture contents are lower) but the CCPC sub-bituminous coal and lignite are substantially lower rank. Similarly, the IEA GHG coal has sulphur and ash contents intermediate between the CCPC bituminous and sub-bituminous coals. The specific energy content per kg of carbon is slightly higher for the IEA coal than the CCPC bituminous coal and hence the specific CO2 emissions are slightly lower. For the three CCPC coals, the energy content per kg C decreases with decreasing coal rank, and hence the specific emissions of CO2 increase.

iii
Table 2 Coal analyses and costs
CCPC IEA GHG
Nova Scotia Bituminous
Alberta Sub-bituminous
Saskatchewan Lignite
Australian Bituminous
Moisture, wt% as-received 5.89 20.00 33.54 9.5
Ash, wt% as-received 7.95 13.93 13.46 12.2
Carbon, wt% dry-ash free 84.66 73.93 74.67 82.5
Hydrogen, wt% dry-ash free 5.99 4.26 4.85 5.6
Oxygen, wt% dry-ash free 5.07 20.51 18.30 9.0
Nitrogen, wt% dry-ash free 1.54 0.91 1.26 1.8
Sulphur, wt% dry-ash free 2.74 0.39 0.92 1.1
LHV, MJ/kg as-received1 28.95 17.81 13.56 25.87
Specific energy content, MJ/kg C 39.68 36.46 34.26 40.05
Cost, US$/GJ (LHV) 1.90 0.48 0.88 1.5
Economic basis The economic analyses in the CCPC study were undertaken using an EPRI model with economic assumptions (rates of return on capital, taxation rates etc.) that are appropriate for power plants in Canada. IEA GHG uses a different economic model and assumptions for its own assessment studies. However, the overall effect of the differences is small, so the main conclusions of the CCPC studies would still apply if IEA GHG’s economic model and assumptions had been used. To demonstrate this, the effects of the differences between the CCPC and IEA GHG economic bases are shown in the appendix to this summary for one type of plant; a bituminous coal IGCC2. The economics in the CCPC’s reports are presented in Canadian dollars. For this IEA GHG overview they have been converted to US dollars, for consistency with IEA GHG’s other reports, using an exchange rate of 1.56 Canadian dollars per US dollar. This is the exchange rate that was used by the contractors to convert equipment costs in US dollars to Canadian dollars at the time the study was carried out.3 The CCPC plants are designed for specific Canadian power plant sites. There are many location specific factors which can affect costs. Costs cannot be precisely converted to other locations, such as the Netherlands coastal location used for IEA GHG’s own studies, using a market exchange rate.
Results and Discussion Evaluation of technologies for control of non-CO2 emissions This study identified foreseeable new regulatory requirements for emissions of substances other than CO2 in Canada and assessed the costs of technologies to achieve these requirements. A wide range of technologies for SOx, NOx, particulate and mercury emission control were assessed. When CO2 is
1 The Lower Heating Values (LHVs) quoted in this overview are calculated from the HHVs using a conversion factor published in the 7th edition of “Technical Data on Fuel” by J.W. Rose and J.R. Cooper, published by the British National Committee of the World Power Conference, for consistency with other IEA GHG reports. This takes into account all hydrogen in the coal, including the moisture. LHV’s contained in the CCPC’s own reports only take into account hydrogen contained in the dry-ash-free coal. 2 Integrated gasification combined cycle 3 The exchange rate at the time this summary was completed in early March 2004 was around 1.35:1.

iv
captured, most other atmospheric emissions are also inevitably avoided, so the study provided a suitable baseline for assessment of the true incremental cost of CO2 capture. Technologies and costs for control of non-CO2 emissions are not described in this summary, as they are outside the scope of the IEA Greenhouse Gas R&D Programme, but information is provided in the summary report produced by the CCPC. CO2 capture retrofit The first stage in the evaluation of amine scrubbing and oxyfuel combustion was a site selection study which compared retrofit of CO2 capture at three existing power plants, with the aim of selecting one plant for a more detailed site optimisation study. The plants were:
• Trenton 6, a 156 MW plant in Nova Scotia, using bituminous coal • Shand, a 272 MW plant in Saskatchewan, using lignite • Genessee 1, a 391 MW plant in Alberta, using sub-bituminous coal
Results of the site selection studies are summarised in the CCPC’s own summary report, which is attached to this overview. The studies showed that the Genessee plant is the most attractive for a capture retrofit as it has the lowest projected costs of CO2 capture and electricity generation and has the greatest potential for utilisation of captured CO2. However, the Shand site, which was the second best option, was selected for the more detailed site optimisation study, because of the ease of obtaining plant design data within the time frame of the study. Although Shand was not the preferred site it would be suitable for a retrofit or new power plant because there is plenty of plot space available and the existing infrastructure was designed with a second plant in mind. The existing Shand power plant is relatively modern, having been commissioned in 1992. The specification for the site selection studies required that there should be no net loss of power sent out due to CO2 capture retrofit. This was achieved by constructing an auxiliary coal fired boiler with CO2 capture. The auxiliary boilers were found to be similar in size to the original power plant boilers. This was considered to be not an attractive option because the auxiliary power plant would have a lower efficiency than a greenfield power plant and less favourable economies of scale and the overall cost of a retrofit would probably be close to that of a greenfield power plant. The study also showed that there are significant opportunities to optimise the efficiency of an amine scrubbing plant by integration with the power plant. This may be more difficult to achieve in a retrofit than in a new plant. In the case of oxyfuel combustion the study showed that air infiltration was a major issue, as it would increase the concentration of inert gases in the CO2 product, which would increase the cost of the product recovery and compression unit. A new power plant could be easily designed to have much lower air infiltration rates than existing plants. The site selection study also confirmed that the energy efficiency penalty for CO2 capture would be substantial. This highlighted the need for the basic power cycle to have as high an efficiency as possible, which could only be achieved in a new plant. For these reasons, members of the CCPC decided that the more detailed site optimisation work should concentrate on greenfield plants for all technologies. An amine scrubbing retrofit at the Shand site was also evaluated but it did not include construction of an auxiliary boiler to offset the reduction in net power output. The evaluation of amine scrubbing in the site selection study did not consider detailed integration between the existing plant and the retrofitted units and was based on Fluor’s original Econamine FGSM process rather than their improved Econamine FG PlusSM process which became available during the course of the study. The heat consumption of the Econamine FG PlusSM process is 21% lower than that of the conventional Econamine FGSM process and the solvent degradation loss is substantially reduced. This is achieved mainly by split flow solvent circulation, improved solvent formulation, better heat integration and vacuum reclaiming of solvent. Heat integration with the vacuum condensate of the steam cycle brings the overall reduction in heat consumption to 32%. The results of the detailed evaluations of retrofit and greenfield plants with amine scrubbing are shown in table 3.

v
Table 3 Comparison of retrofit and greenfield plants with CO2 capture (lignite-fuelled)
The thermal efficiency of the retrofitted Shand lignite-fuelled plant with CO2 capture is significantly lower than that of a greenfield power plant at the same location. This is mainly because the existing Shand power plant has a lower efficiency steam cycle (12.6 MPa, 538/538C steam conditions, compared to 24.2 MPa, 593/593C in the greenfield plant). The capital cost of US$1005/kW shown in table 3 for the retrofit is only the cost of the retrofitted CO2 capture and other emission control equipment and it does not take into account the cost of new generating capacity which would have to be built elsewhere to make-up for the reduction in net power output due to CO2 capture. The overall cost of CO2 capture, in $/tonne of CO2 emissions avoided, is higher in the retrofit plant than the greenfield plant. For this overview, the make-up power for the retrofit plant is assumed to be provided by a new large coal-fired power plant with CO2 capture, such as the greenfield plant shown in table 3. The quantity of CO2 avoided is the emissions of the Shand plant without capture minus the sum of the emissions from the Shand plant with capture and the emissions from the make-up power plant. The costs would depend strongly on the costs and emissions of the plant that provides the make-up power. In the CCPC study the retrofit and greenfield plants were both evaluated with a plant life of 20 years. In practice the operating life of a retrofitted plant is likely to be lower than that of a greenfield plant, so the capital cost of the capture equipment would have to be recovered over a shorter period of time, resulting in a higher cost of capture. A conclusion of this assessment is that where new coal-based generating capacity is needed and there is a need to capture CO2 it will be preferable to install CO2 capture in the new plants rather than in retrofits. CO2 capture at greenfield plants The gasification technology evaluation concentrated from the start on greenfield sites. The first stage was a screening evaluation to select gasification processes for each of the coals. ChevronTexaco, Shell, E-Gas and Noell gasification processes were assessed. ChevronTexaco gasification with water quench of the product gas was selected for bituminous and sub-bituminous coals, as it gave the lowest cost of electricity generation, and Shell gasification with product gas heat recovery was selected for lignite. ChevronTexaco stated that their process was not appropriate for lignite due to lignite’s high inherent moisture content. The cost of electricity in the ChevronTexaco gasifier plant using bituminous coal was about 10% lower than in the comparable Shell gasifier plant. A recent study on IGCC published by IEA GHG (report PH4/19) gave a similar result.
Retrofit Greenfield
Plant performance
Gross power output, MW 304.4 453.5
Boiler auxiliary power consumption, MW 26 21.4
Power loss due to CO2 capture and pollutant control, MW 84.6 121.2
Net power output, MW 193.8 310.9
Thermal efficiency, % (LHV) 25.26 31.80
Costs
Capital cost, US$/kW net output 1005 2826
US$/t CO2 avoided 55.0 36.3

vi
Detailed evaluations were then carried out for bituminous and sub-bituminous coal-fuelled plants based on ChevronTexaco gasifiers and a lignite-fuelled plant based on Shell gasification. The plants were based on 2 GE7FA gas turbines, resulting in net power outputs of around 400 MW. The costs of CO2 emission avoidance were calculated compared to pulverised fuel fired reference plants which used supercritical steam conditions and included FGD4, SCR5, and mercury and particulate removal. Pulverised fuel plants are the type of coal-fired plants that would probably be built in the near future if there were no requirement to abate CO2 emissions. Performance and cost data for the IGCC plants with CO2 capture and the pulverised fuel reference plants are shown in table 4. Detailed evaluations of new lignite fired plants with amine scrubbing and oxyfuel combustion were also carried out. These plants were based on the supercritical steam conditions used in the reference plants. The amine scrubbing plant was based on Fluor’s Econamine FG PlusSM process. The oxyfuel combustion plant was based on a boiler designed for low air infiltration.
Table 4 Greenfield plant evaluation
4 Flue gas desulphurisation 5 Selective catalytic reduction 6 Some of the data in the CCPC reports include carbon emissions that are avoided due to unreacted carbon in ash. CO2 emissions data in this summary are calculated from process stream data in the detailed CCPC reports and the quantities of CO2 emissions avoided take into account only CO2 that is captured as CO2.
Bituminous coal
Sub-bituminous Lignite Lignite Lignite
Reference pulverised fuel plants without CO2 capture
Net power (MW) 424.5 424.5 424.5 424.5 424.5
CO2 emissions (g/kWh) 771 852 883 883 883
Efficiency, % (LHV) 42.94 42.37 43.43 43.43 43.43
Capital cost (US$/kW) 1410 1502 1644 1644 1644
COE (USc/kWh) 4.87 3.73 4.45 4.45 4.45
Plants with CO2 capture
Technology Gasification Gasification Gasification Amine Oxyfuel
Net power (MW) 444.5 436.8 361.1 310.9 373
Efficiency, % (LHV) 32.97 27.71 30.00 31.80 26.69
CO2 captured (%) 87.0 92.0 85.7 95.0 90.0
CO2 emitted, g/kWh 130 102 182 60 145
Capital cost (US$/kW) 1917 2190 2828 2824 3974
COE (USc/kWh) 6.84 6.21 8.39 7.43 9.74
CO2 capture plants compared to pulverised fuel plants
CO2 emissions avoided, g/kWh6 641 750 701 823 738
Efficiency penalty for capture, % 9.97 14.66 13.43 11.63 16.74
Capital cost penalty, US$/kW 507 688 1184 1180 2330
Electricity cost penalty, USc/kWh 1.97 2.48 3.94 2.98 5.29
CO2 avoided cost, US$/t CO2 31 33 56 36 72

vii
The thermal efficiencies of the reference pulverised coal plants are lower for lower rank coals, mainly because of lower boiler efficiencies. The specific emissions of CO2 are higher for lower rank coals because of the lower efficiencies and because the specific carbon contents (kg C/MW of thermal energy) of lower rank fuels are higher, as shown in table 2. The capital costs are also higher for lower rank coals. The cost of electricity generation depends on the fuel cost, which in the Canadian context is lowest for sub-bituminous coal, as shown in table 2. For this reason, the overall cost of generation is lowest for sub-bituminous coal. In general the IGCC plants with CO2 capture show the same trends. An exception is that the lignite-fuelled plant has a higher efficiency than the bituminous coal plant. This is because the lignite plant is based on the Shell gasifier, which uses a dry coal feeding system and a heat recovery boiler, and the other plants use the ChevronTexaco quench gasifier, which uses a water slurry feed system and water quench cooling of the product gas. The specific emissions are lowest in the sub-bituminous coal-fuelled plant for detailed design reasons. The additional cost of generation due to CO2 capture ( c/kWh) and the cost of CO2 emissions avoidance ($/t CO2) are higher for lower rank coals, for example the cost of emission avoidance in the lignite-fuelled plant is twice as high as in the bituminous coal-fuelled plant. For lignite-fuelled plants, the lowest cost CO2 capture option, by a substantial margin, is amine scrubbing, followed by gasification, and the most expensive option is oxyfuel combustion. This is despite the fact that in this study the amine scrubbing plant has the smallest net power output and therefore the least favourable economies of scale. The amine scrubbing plant has further advantages; it has the highest thermal efficiency and the highest percentage CO2 capture. The CO2 capture rate in the amine scrubbing plants is 95%, which is higher than in the other plants and also higher than the 85% assumed in IEA GHG’s own assessment studies. 85% CO2 capture was assessed by the CCPC in a sensitivity study and it was found to increase the cost of CO2 avoided by 2%. The sensitivity of cost to percentage CO2 capture was not assessed for the other technologies but it appears unlikely that a higher percentage CO2 capture would have significantly reduced the specific cost of capture. Although gasification was shown to have a higher cost than amine scrubbing, the technology for lignite gasification is relatively immature and there is significant scope for improvements. Oxyfuel combustion was shown to be the highest cost option but substantial improvements could be made to the design adopted in the CCPC studies. The oxyfuel combustion studies specified that the plants should retain full air firing capability, which resulted in high flow rates through the emission control equipment. Although this gives some operability advantages, it significantly increases costs. The boilers were designed to have an inlet oxygen concentration similar to that of air but pilot scale research has shown that oxyfuel boilers could have an inlet oxygen concentration of about 30%, which would substantially reduce the boiler and recycle gas flowrates, and hence the plant costs. There are also further opportunities to improve the efficiency and costs by optimising the flue gas cooling. Another option which may be advantageous particularly for the Saskatchewan lignite would be cyclone firing, which would greatly reduce the size of the boiler. Cyclone boilers are a proven technology but they have not been used much in recent years because of high NOx emissions. However, this is much less of a concern in oxyfuel combustion. The CCPC study is based on the Canadian coal prices shown in table 2. Coal prices may be different in different countries, leading to different relative costs of generation for different fuels. The sensitivity of electricity cost to coal price is shown in figure 1. Note these costs still include some site-specific costs for each fuel which may not apply in other locations

viii
0.000
2.000
4.000
6.000
8.000
10.000
12.000
0 0.5 1 1.5 2
Coal price, US$/GJ (LHV)
Ele
ctri
city
cos
t, U
Sc/k
Wh
Bituminous PF no captureSub-bituminousPF no captureLignite PF no captureBituminous IGCC captureSub-bituminousIGCC captureLignite IGCC captureLignite amine captureLignite oxyfuel capture
Figure 1 Sensitivity of electricity cost to fuel price Comparison with other IEA GHG studies IEA GHG has not carried out studies based on lignite, so there are no data to compare against the CCPC’s detailed amine scrubbing and oxyfuel combustion plant data. Foster Wheeler recently carried out a study for IEA GHG on IGCC which included bituminous coal-fuelled IGCC plants based on ChevronTexaco gasification. A detailed comparison of that plant and the CCPC bituminous coal IGCC plant are included in the appendix to this overview and the main results are summarised in table A1 in the Appendix. The thermal efficiency is slightly higher in the CCPC study and the capital cost is significantly higher, mainly because of less favourable economies of scale and higher costs for general plant facilities. CO2 storage and utilisation Two studies on CO2 storage and utilisation were carried out:
• A compilation and evaluation of CO2 utilisation and storage options in Western Canada. • An evaluation of the potential to store CO2 in coal deposits in Nova Scotia
The study on Western Canada reviewed all storage and utilisation options and concluded that the only viable options were enhanced oil recovery (EOR), enhanced coal bed methane production (ECBM) and geological storage in depleted oil and gas fields and aquifers. The study concluded that the preferred storage option is EOR. While there do not appear to be any technical obstacles in general to EOR and storage in depleted oil and gas reservoirs and aquifers, there would be many questions for any specific project. ECBM is immature and is unlikely to proceed without significant technical development and pilot scale projects. Major uncertainties include permeability, gas content and CO2 absorption ratios. An EOR project taking CO2 from a 400 MW power station would be one of the largest EOR operations in the world. It was determined that there could be 5 or 6 viable EOR projects in Alberta with sufficient capacity to store CO2 from a commercial scale power plant over a 30 year life. Opportunities in Saskatchewan are much more limited and only one EOR project would be viable. The cumulative investment for an EOR project taking CO2 from a 400 MW power station (2.6 Mt/y) was estimated to be about US$600 million spread over the life of the project. The estimated investment cost for storage in depleted oil and gas reservoirs was about US$30 million. The cost of storage in deep saline aquifers was expected to be of the same order as storage in depleted oil and gas reservoirs, but

ix
probably slightly higher on average due to infrastructure requirements and generally higher initial formation pressures. The CCPC estimated breakeven values for CO2, i.e. the maximum that the storage operator could pay for CO2, based on a 15% economic discount rate, an oil revenue of US$20/barrel and a natural gas revenue of about US$2.7/GJ (LHV). The breakeven values of CO2 were US$27/tonne for EOR, US$6/t for ECBM and minus US$2.5/t for depleted oil and gas reservoirs. The breakeven CO2 cost for EOR based on IEA GHG’s standard 10% discount rate would be US$33/t. These figures do not take into account taxes and royalties. An EOR project would emit CO2 equivalent to about 7-8% of the CO2 delivered, mainly due to on-site gas recompression, although this could probably be reduced by optimising the gas/CO2 separation. This CO2 emission was not taken into account in the assessment. CO2 purity is a critical issue for EOR. Relatively low levels (1-2%) of N2, O2 or CO could potentially have a negative impact on EOR recovery, by increasing the minimum miscibility pressure. O2 could also oxidise the oil making it more viscous and difficult to refine. H2S and SO2 would have the beneficial effect of reducing the minimum miscibility pressure, although a mixture of CO2 and SO2 might cause the deposition of elemental sulphur in a reservoir containing H2S. The study by the Geological Survey of Canada identified that there is significant potential for coalbed methane production and storage of CO2 in the coalfields of Nova Scotia. Further work involving field testing is needed to investigate this potential further.
Expert Reviewers’ Comments The draft reports from the contractors were reviewed by representatives of the CCPC’s members and other funding agencies. Most of the comments were minor and were taken into account in the final reports. However, it was suggested that some of the design assumptions used in the oxyfuel evaluation were excessively conservative, resulting in an unrealistically high cost for that technology. Further work would be needed to assess the implications of these comments. Some inconsistencies in the detailed reports were identified after publication. Where possible these have been corrected in this summary.
Major Conclusions The cost of capturing CO2 in a new coal fired power plant would be lower than in an existing coal-fired power plant retrofitted with CO2 capture. Retrofit would only be attractive if all new coal-fired power plants were being fitted with CO2 capture and there was a need to achieve even greater emission reductions. For lignite-fuelled plants, the costs of electricity generation and CO2 capture are significantly lower for amine scrubbing than for IGCC or oxyfuel combustion. The choice of CO2 capture technology and the cost of capture depend highly upon coal rank. The thermal efficiency and cost penalties for CO2 capture in IGCC are higher for lower rank coals. However, based on Canadian coal prices, a sub-bituminous coal-fuelled plant with CO2 capture would have the lowest cost of electricity generation. Costs of CO2 capture could be reduced by more design optimisation, particularly for oxyfuel combustion. The preferred option for CO2 storage in western Canada is EOR. The breakeven value of CO2 to an EOR operator was estimated to be US$33/tonne, based on IEA GHG’s standard economic assessment criteria.

x
Recommendations The next phase of the CCPC project will aim at the involvement of a broader range of industrial participants and development of a business case for a demonstration plant. Some further technical studies will also be undertaken, including evaluation of co-production of hydrogen and steam, co-use of low rank coal and petroleum residues and production of a combined stream of CO2 and sulphur compounds. It is recommended that IEA GHG should not participate in the next phase of the CCPC. Lessons learned during the CCPC studies should be taken into account in IEA GHG’s own on-going and future studies on CO2 capture and storage.

xi
APPENDIX
Comparison of CCPC and IEA GHG’s evaluations of IGCC plants This appendix compares the results of the CCPC’s evaluation of a bituminous coal-fuelled IGCC and the results of an evaluation of a similar plant, carried out recently for IEA GHG by Foster Wheeler (report PH4/19, May 2003). The plants are both based on ChevronTexaco quench gasifiers and GE FA series gas turbines. In this Appendix the two studies are converted to the same economic basis, as far as possible, and differences between the performance and costs in the two studies are highlighted. The main results of the CCPC and Foster Wheeler assessments are summarised in table A1. In the Foster Wheeler study, the penalty for CO2 capture is calculated by comparing the IGCC plant with capture to a similar plant without capture. In the CCPC study the IGCC with capture is compared to a pulverised fuel boiler-steam cycle plant without capture. Table A1. Overall comparison of CCPC and Foster Wheeler studies CCPC Foster Wheeler
PF plant without capture
IGCC with capture
Capture penalty
IGCC without capture
IGCC with capture
Capture penalty
Net power output, MW 424.5 444.5 826 730
Efficiency, % (LHV) 42.9 33.0 9.9 38.0 31.5 6.5
Capital cost, $/kW 1410 1917 507 1187 1495 308
Electricity cost, c/kWh 4.87 6.84 1.97 4.51 5.58 1.07
CO2 emissions, g/kWh 771 130 833 152
CO2 captured, g/kWh 873 - 851
Cost of CO2 avoidance, $/tCO2 30 16 The efficiencies of the IGCC plants in the two studies are similar but the power output is lower and the capital and operating costs are higher in the CCPC study. Reasons for this are explained in the following sections. Plant performance The performances of the plants are similar apart from their size, as shown in table A2. The overall power output of an IGCC plant is determined mainly by the number and type of gas turbines. Both plants are based on two gas turbines but the turbines in the CCPC plant are smaller. This is because the electricity system in Canada operates at a frequency of 60Hz, compared to 50Hz in Netherlands, and 60Hz turbines have substantially lower power outputs than corresponding 50Hz turbines. Apart from their size, the turbines in the two studies are similar. A greater proportion of the total gross power is generated in the gas turbine in the CCPC plant (66% compared to 58% in the Foster Wheeler plant). This is due to various reasons. In the Foster Wheeler plant, half of the air for the air separation unit (ASU) is compressed in the gas turbine air compressor, which reduces the turbine efficiency, but in the CCPC plant all of the air for the ASU is compressed using electrically driven compressors. In the Foster Wheeler plant the expansion stage of the gas turbine is fully loaded mainly by adding compressed nitrogen from the ASU but in the CCPC plant this is achieved by adding more moisture to the fuel gas and nitrogen feeds in humidifiers. This reduces the amount of heat available for the steam cycle. Another reason for the difference is probably the difference in gasifier performance with the different coals.

xii
The overall auxiliary power consumption as a fraction of the gross power output is very similar in the two plants and the percentage breakdown into the main process areas is also similar, despite the different plant configurations. The lower power consumption of the air compressor in the ASU in the IEA GHG plant is offset mainly by a larger nitrogen compressor power consumption. A significant factor contributing to the lower efficiency in the Foster Wheeler plant is the difference in gasifier performance with the different coals. Gasifier performance data for both studies was provided by ChevronTexaco, the gasifier licensor. Table A2 Detailed performance of IGCC plants with CO2 capture CCPC Foster Wheeler
Plant definition
Coal Canadian bituminous Australian bituminous
Gasifier ChevronTexaco-quench ChevronTexaco-quench
Gas turbines 2 x 7FA (60Hz) 2 x 9FA (50Hz)
Air from GT to ASU, % 0 50
CO2 capture, % 87.0 84.8
CO2 output pressure, MPa 13.89 11
Overall performance MW % gross power MW % gross power
GT power 394.00 66.3 563.4 57.9
ST power 196.49 33.1 398.2 40.9
Expander power 3.76 0.6 11.2 1.2
Gross power 594.25 100.0 972.8 100.0
Auxiliary power consumptions 149.70 25.2 242.5 24.9
Net power 444.55 74.8 730.3 75.1
Auxiliary power consumption
Air separation 77.61 13.1 128.62 13.2
Coal prep /gasification /treating 7.36 1.2 14.54 1.5
Acid gas removal 22.24 3.7 33.04 3.4
Sulphur plant 0.56 0.1 3.56 0.4
CO2 compression 27.44 4.6 38.5 3.9
Power block and miscellaneous 8.70 1.5 13.32 1.4
Cooling water system 5.79 1.0 10.94 1.1

xiii
Capital costs The capital costs of the two plants are summarised in table A3. Table A3 Capital costs (US$/kW) CCPC Foster Wheeler
Coal reception and handling 49 13
Gasification 296 322
Air separation 208 169
Fuel gas treatment, including shift conversion 106 84
Acid gas removal 173 81
Sulphur plant 49 46
CO2 compression 60 34
Power island, inc. feed gas heating/humidification 482 465
General facilities 492 189
Total plant cost (CCPC definition) 1916 1402
Owner’s costs (land, fees, permits etc.) 166 92
Total plant cost (IEA GHG definition) 2092 1495 The total plant costs as quoted in the CCPC and Foster Wheeler studies have a slightly different definition. The cost in the Foster Wheeler study includes some owner’s costs (land, fees and permits) which are included later in the CCPC study. When these costs, as stated in the CCPC report, are added the total specific cost in the Foster Wheeler study is 29% lower than in the CCPC study. Some of this difference is due to economies of scale. If the CCPC plant is scaled to the same size as the Foster Wheeler plant using a cost scale exponent of 0.7, the total plant cost becomes $1802/kW, reducing the cost difference to 17%. Factors which may contribute to this remaining difference are the different locations (Nova Scotia for CCPC, Netherlands for Foster Wheeler/IEA GHG), detailed site conditions, coal analyses, plant configurations, the trade-off between capital cost and efficiency and general uncertainties. The capital cost breakdowns show a substantially higher cost in the CCPC study for general facilities. However, some items that are included in general facilities in the CCPC study are probably included in the process units, particularly the gasification and power island sections, in the Foster Wheeler study. The higher cost of acid gas removal in the CCPC study may be due to the higher percentage CO2 capture in this unit; 99% compared to 90% in the Foster Wheeler study. The Foster Wheeler plant partly compensates for its lower percentage CO2 capture in the acid gas removal unit by having a higher conversion of CO to CO2 in the shift converter. Most of the CO2 emissions from the CCPC plant result from combustion of CO in the gas turbine but in the Foster Wheeler a substantial proportion is un-captured CO2. Electricity generating costs The difference in the cost of electricity generation between the CCPC and Foster Wheeler studies is due to differences in:
• Plant performance • Capital costs • Operating and maintenance costs • Economic assumptions
To eliminate the effects of the economic assumptions, the CCPC costs have been converted as far as possible to the basis specified to Foster Wheeler by IEA GHG. The main technical and economic assumptions used in the two studies are summarised in table A4.

xiv
Table A4 CCPC and IEA GHG economic assumptions CCPC IEA GHG
Location Various Canadian locations Netherlands coastal site
Bituminous coal price, US$/GJ, LHV 1.82hhv 1.5
Plant operating life, years 20 25
Return on equity, % 10% after tax
Return on debt 9.25%
Discount rate After tax cost of money 10%
Costs during construction, %
year 1
year 2
year 3
year 4
3.2
23.8
48.5
24.5
20
45
35
Load factor, % 90 85 An annual capital charge factor can be derived to take into account the effects of discount rate, taxation, interest during construction, start-up costs and working capital. The CCPC and IEA GHG economic assumptions correspond to annual capital charge factors (annual capital-related costs divided by total plant cost including owners costs) of 14.2% and 12.8% respectively. When the higher load factor in the CCPC study (90% compared to 85% in the Foster Wheeler study) is taken into account, the annual capital charge factor per MWh is only 5% higher in the CCPC study. A full breakdown of operation and maintenance (O+M) costs is not included in the CCPC report. Most of the O+M costs in the studies are based on the contractors’ best judgements so it is not appropriate to change them for this comparison. An exception is the insurance and local property taxes, which are assumed to be 2%/year in the Foster Wheeler study and 0.8%/year in the CCPC study. The fixed O+M costs are adjusted to allow for the different load factors in the two studies. The CCPC costs are converted, as far as possible, to the same economic basis as Foster Wheeler’s IGCC study in table A5. The costs are also converted approximately to the same size of plant as in the Foster Wheeler study. After eliminating the effects of economic conventions and plant size, the costs of electricity in the CCPC and Foster Wheeler studies differ by about 5%. Table A5 Conversion of CCPC costs to Foster Wheeler/IEA GHG economic basis CCPC plant
CCPC report IEA GHG
cost basis
Scaled to IEA GHG plant size
Foster Wheeler / IEA GHG plant
Net power output, MW 444.55 444.55 730.3 730.3
Capital cost, US$/kWe 1916 2092 1802 1495
Cost of electricity USc/kWh
Fuel cost 2.08 1.64 1.64 1.72
O+M cost 0.98 1.24 1.12 1.29
Capital charges 3.78 3.61 3.11 2.57
Total 6.84 6.49 5.87 5.58

xv
Conclusions The thermal efficiencies of the bituminous coal IGCC plants in the CCPC study and a study carried out for IEA GHG by Foster Wheeler are similar. Capital costs are lower in the Foster Wheeler study, partly due to better economies of scale. When converted to the same plant size and economic conventions, the difference between costs of electricity generation in the CCPC and Foster Wheeler studies is only about 5%. Overall, the different economic assumptions such as rates of return, plant life and load factor used in the CCPC and Foster Wheeler studies make only a small difference to the costs of electricity.
CRI ConsultingP.O. Box 48273, 40 Midlake Blvd SE, Calgary, AB, Canada, T2X 3E2
CCPC Phase I Final ReportSummary Report on Conceptual Engineering and Feasibility Studies
conducted by the Canadian Clean Power Coalition
Prepared by
CRI Consulting
February 2004

CCPC Phase I Final Report
CRI Consulting Page 2
Acknowledgements
The Canadian Clean Power Coalition wishes to acknowledge the financial contributionsmade by Natural Resources Canada, Alberta Energy Research Institute andSaskatchewan Industry and Resources to the Phase I studies.

CCPC Phase I Final Report
CRI Consulting Page 3
Executive Summary
The Canadian Clean Power Coalition (CCPC) represents power generators and coalsuppliers of over 90% of Canada’s coal-fired power generation. The participants of theCCPC have been concerned about the level of greenhouse gas emissions resulting fromthe operation of their plants. As the challenge of potential climate change impactsbecame clear, coal and coal fired electricity producers began to evaluate strategies fornet emission reduction.
Typically their strategies have evolved to consider several approaches as a means ofextending the use of fossil fuels while meeting net reduction goals, and include thefollowing elements:
• offsets and trading in the short term;• carbon management by capture and storage or use of the carbon dioxide in the
medium term; and• capital stock turnover and for the development of new technology in the longer
term.
These approaches recognize the importance of carbon management as a means ofextending the use of fossil fuels to provide the time required for the development andintroduction of new, less carbon intensive generation technologies in the future.
The participants have become increasingly involved in research projects involving theCO2 issue. Topics include assessing the potential demand for CO2 for Enhanced OilRecovery in Alberta and Saskatchewan, assessing technologies for recovery of CO2from flue gas, investigations of technology options for utilizing CO2, evaluations ofstorage in spent oil & gas reservoirs, aquifers and brines, and reductions of CO2 by co-production of cement and power and by utilizing landfill gas.
A number of the participants held a series of discussions throughout 2000 and 2001 toidentify a joint course of action to ensure that coal and coal fired electricity wouldcontinue to have a place in Canada’s energy supply future, alongside both otherconventional fuels and non-conventional renewable supplies. These discussionsexpanded and culminated in the formation of the CCPC, an association and formalagreement. That formal agreement describes the goals and the specific objectives ofthe CCPC, as well as the financial and non-financial commitments of each participant.
The CCPC Participation Agreement was signed in mid 2001 among ATCO PowerCanada Ltd., EPCOR Utilities Inc., Luscar Limited, Nova Scotia Power Inc., OntarioPower Generation Inc., Saskatchewan Power Corporation, and TransAlta UtilitiesCorporation, with the concept of a private-public partnership to develop technology tomeet the stated goals. Phase I of the project commenced in September 2001.Subsequently, the governments of Alberta, Saskatchewan, and Canada subscribed tosupport the CCPC. In addition, the participation of EPRI (Electric Power ResearchInstitute of Palo Alto, CA) and IEA (International Energy Agency) was solicited andsecured.
The CCPC established a goal to develop projects to demonstrate technology at acommercial utility scale for retrofit to existing plants, or for use in new coal fired powerplants, that would allow all emissions, including CO2, to be controlled to meet allforeseeable new regulatory requirements. The emissions target was to allow a coal-fired

CCPC Phase I Final Report
CRI Consulting Page 4
plant to be as clean as a modern natural gas fired gas turbine plant. The goal was to dothis while maintaining overall efficiency at or above current levels, maintaining costscompetitive with other generation technologies and enabling the CO2 to be captured.
The demonstration projects will consist of the retrofit of an existing plant with newtechnology to be completed by 2007, and the design and construction of a newgreenfield plant by 2010. Phase I of the project comprises the Conceptual Engineeringand Feasibility Studies, undertaken from mid 2001 to mid 2003 and concluding with thissummary report. Phases II and III, the next steps of the project, will relate to the detaileddesign and construction of the retrofit and greenfield plants respectively. This reportsummarizes the Phase I activities, completed in July 2003.
The objective of the conceptual engineering and feasibility studies was to determine themost appropriate technologies for the demonstration projects. The studies identified andevaluated candidate sites, as well as recommending the most suitable sites for thedemonstrations. Implementation plans, preliminary designs and cost estimates were tobe developed for those technologies and sites, recognizing the geographical variability ofcoal: western lignite and sub-bituminous coals, and eastern bituminous coals.
The fundamental principle underlying the goals of the CCPC was to identify a processthat would produce electricity from coal in some fashion and that would also provide arelatively pure stream of CO2 that could be captured, further processed as necessary,and subsequently used or stored.
Work Package 1 was a pre-screening study completed in November 2001 by SFAPacific Inc. that evaluated the latest R&D in process developments suitable forcommercial scale retrofit applications and for greenfield applications, that will meet thedesign goals of the project for control of NOX, SOX, particulates (PM10 and PM2.5),mercury, CO2 and other airborne toxics. This study led to the preliminary selection of thegasification process for greenfield projects, and amine scrubbing and oxyfuelcombustion for retrofit projects. However, SFA Pacific also acknowledged thatgasification could have an application in repowering scenarios. The subsequent workpackages and contracts were developed on the basis of that recommendation.
An engineering study (Work Package 4) was awarded to Neill & Gunter Limited/ADA-ESin April 2002, with deliverables to identify emissions targets for all emissions to meet allforeseeable new regulatory requirements, except CO2, and to evaluate and recommendretrofit technologies and to prepare a cost estimate to control all air emissions, exceptCO2, for a commercial scale retrofit. Emission control targets were to be equal to, orbetter than, a natural gas fired combined cycle (NGCC) plant. The targets were torecognize the regional impact of different coals and geography. The CCPC recognizedthat when one captures CO2, of necessity one also captures virtually all other emissions.Thus, the intention of the CCPC was to establish with some accuracy the cost to captureall emissions except CO2, and by comparing the cost of advanced CO2 capturetechnologies, thereby isolate and identify the true incremental cost to capture CO2. Thetargets so identified would guide subsequent work on CO2 capture technologies.
Neill & Gunter completed this work in October 2002. An estimate of the impact of thesetechnologies on operating and maintenance costs was also provided. Table 1 identifiesthe resulting current and future missions targets. Table 2 identifies the technologies andcosts that would be required to meet the targets. Neill & Gunter’s work confirmed thatthe targets could be met in the relatively near future, with the assumption thattechnological development in near to commercial and emerging emissions abatementtechnologies will continue as they have in the past.

CCPC Phase I Final Report
CRI Consulting Page 5
NOTE: LONOX burners includes neural networks and OFA
Table 1: CURRENT AND TARGET EMISSIONS LEVELSParameter Units Coal Plants NGCC
Fuel Lignite Sub-Bituminous Bituminous Natural GasBoiler Type Wall Fired Tangential Wall Fired HRSG
Primary Targets Target Current Target Current Target Current
NOXg/MWhr
ng/J504.5
-258
504
-219
505
-258
285
SOXg/MWhr
ng/J555
-602
555
-198
554.5
-1462
4.50.7
ParticulatesPM10, PM2.5
g/MWhrng/J
282.5
-30.1
282.4
-15.1
282.8
-25.8
152
Mercury mg/MWhrpg/J
5.50.5
-14
3.50.3
-10
3.00.3
-9 N/A
CO ppmv 40 40 40 45Chloride mg/Nm3 5 5 5 N/A
SO3 ppmv 5 5 5 N/ANH3 ppmv 1 1 1 1
Secondary TargetsVOC mg/Nm3 1 1 1 1
Heavy Metals:Selenium mg/Nm3 6 6 6Arsenic mg/Nm3 6 6 6
Cadmium mg/Nm3 2 2 2 Note: 1) Units based on 3% O2 in flue gas. 2) NOX values expressed as NO2 3) SOX, NOX, PM2.5, Hg based on a 720 hr rolling average.
Table 2: TECHNOLOGIES AND COSTS TO MEET TARGET EMISSIONS LEVELS
Fuel Bituminous Sub-Bituminous Lignite
Option 1 Option 2 Option 3 Option 1 Option 2 Option 1 Option 2
Technology
• LONOXburners
• SCR• Wet
scrubber• AquaNOX
scrubber
• LONOXburners
• SCR• LOTOX
• AirborneFGD
• Wet stack
• Toxecon• AquaNOX
• LONOXburners
• SCR• Marsulex
ActivatedCoke
• COHPAC
• LOTOX
• AirborneFGD
• Wet stack
• LONOXburners
• SCR• Marsulex
ActivatedCoke
• COHPAC
• LOTOX
• AirborneFGD
• Wet stack
Capital Cost($millions) 283.6 365.2 234.8 237.1 274.6 301.7 258.8
Unit Size 165 gross 410 gross 298 gross
Unit Cost($/kW net) 909 1,171 753 717 721 1,110 952
O&M($/MWhr) 6.73 6.57 5.53 9.49 4.19 11.24 6.52

CCPC Phase I Final Report
CRI Consulting Page 6
The Neill & Gunter study confirmed the belief that meeting all emissions requirements,not including any requirements to limit CO2 emissions, would require significant capitaland have a major impact on the operating and maintenance costs of the plants. Thisfact could have a substantial influence on any decisions to capture CO2 emissions.
Two studies (Work Packages 2 and 3) were awarded in 2002 to Fluor Canada toexamine the candidate CO2 abatement technologies (gasification, and amine andoxyfuel) in detail. These studies were completed in July 2003. The design goals for thestudies were:
• No net loss of power output from the plant after retrofit (i.e., additional or selfgeneration required),
• For the oxyfuel case the plant must also be capable of operation in an air firedmode,
• Control and safe disposal of all emissions from the plant, • Capture of the CO2 from the plant and from any auxiliary power generation
required, and • Evaluation of plant integration options and benefits.
It is important to highlight that the first requirement – no net loss of power output –implied that all auxiliary power for the CO2 capture equipment would be required to begenerated on site from additional, coal-fired capacity. Furthermore this would requirethat all emissions from that additional capacity would also have to be captured, includingthe additional CO2.
The deliverable was a report for each technology that evaluated candidate sites for afull-scale demonstration project for each of the three coals, and included conceptualdesigns and cost estimates. An implementation concept for the demonstration projectwas developed for the one preferred site, taking into account the plant’s operationalstatus and the need to minimize plant outages. Table 3 summarizes the results.
*Note to Table 3. Cost of CO2 avoided is defined as the increase in cost of electricity in $/MWhr (evaluated case minusselected base case) divided by the decrease in tonnes of CO2 emitted per MWhrnet (selected base caseminus evaluated case).
Table 3: TECHNICAL AND ECONOMIC COMPARISON OF CO2 ABATEMENT TECHNOLOGIES
Fuel Bituminous Sub-bituminous Lignite Lignite Lignite
Technology Gasification Gasification Gasification Amine Oxyfuel
COE (90%CF) $/MWhr 106.69 96.84 130.85 115.90 152.00
Cost millions $ 1,329 1,492 1,593 1,370 2,313
CO2 Emitted Tonne/MWhr 0.1164 0.1114 0.1822 0.060 0.145
CO2 Captured % 86.4 89.0 85.7 95 90
CO2 Avoided Tonne/MWhr .6546 .7406 .7008 0.823 0.738
Cost CO2 Avoided* $/tonne 46.88 52.20 87.73 56.60 111.96
Capacity MW gross 594.25 629.24 555.35 453.5 629
Economic Capacity MW net 444.55 436.82 361.10 310.9 373
Net Heat Rate KJ/kWhr 11,408 13,806 13,239 12,526 14,882
Unit Cost $/kW net 2,990 3,416 4411.5 4,406 6,200

CCPC Phase I Final Report
CRI Consulting Page 7
Gasification was to be evaluated principally for greenfield applications. Sincegasification was also being considered for the retrofit application, separation ofgreenfield costs was provided to allow a repowering scenario to be developed from thiswork. Alternative sites for the greenfield demonstration were investigated and anassessment of the environmental impact was carried out. Amine scrubbing and oxyfuelwere to be evaluated mainly for retrofit applications, with some effort directed to evaluatethem for greenfield projects.
In doing this work, the CCPC acknowledged that, while there are some slight differencesin the emissions targets for gasification from those used for amine and oxyfuel, these aresmall enough to be considered insignificant.
As the Fluor studies progressed, additional information became available. As a resultthe CCPC Technical Committee requested some changes to the studies’ scope. Theamine and oxyfuel technologies were originally to be purely retrofit technologies, utilizingequipment currently operating in the sample plants. However, it became apparentduring the preliminary site selection phase of the studies that retrofitting thesetechnologies was a greater challenge than previously anticipated, and that bothtechnologies would benefit significantly with new boiler designs and more integration inthe designs. For example, the preliminary work showed that, in order to minimize theauxiliary power requirement for amine scrubbing as much as possible and to provide anyof that auxiliary power as economically and efficiently as possible, integration wasparamount. This then led the study to a supercritical boiler that precludes the use of anexisting boiler and turbine. Similarly, the site selection studies demonstrated that theoxyfuel technology would benefit disproportionately from minimizing boiler infiltration, aswell as the auxiliary power concerns mentioned above, that also led to a supercriticaldesign. During the site selection stage in evaluating gasification, it also becameapparent that it would not be practical to repower with gasification.
Thus, all technologies were ultimately evaluated as greenfield technologies. Thetechnologies might be utilized at the same site as an existing facility, but existingequipment would in all probability be completely retired, and a new plant built on thatsite. The bulk of the work proceeded in this direction, and the above table reflects that.
It should be noted that there could be situations and specific site conditions where thesetechnologies would be utilized as retrofits. There is some information to be derived fromthe reports if a utility had some reason that it wanted to prolong the operating life of aparticular asset, and was willing to accept the attendant penalties in capital and O&Mcosts, or where the application was part of a larger overall CO2 abatement strategy andreplacement power was cheap. However, these are site specific, and the studies couldnot address them.
We note that the studies by Fluor evaluated gasification for all three fuels represented bythe CCPC, but evaluated amine and oxyfuel in detail only for lignite. Early in the study,the CCPC Technical Committee and Fluor agreed that it would be better value toevaluate one fuel in depth for both amine and oxyfuel, than to evaluate all three fuelsmore superficially. This also reflected the fact that it required considerable moreengineering effort to evaluate each case for these more novel technologies than forgasification.
The engineering and construction schedule was estimated in all cases to require aminimum of five years following site selection, assuming capital was committed andavailable. A significant departure from the traditional utility approach would also berequired in the approach to the project execution. Fluor concluded that this would

CCPC Phase I Final Report
CRI Consulting Page 8
require an EPC (engineer, procure, construct) contract, with turnkey responsibilities asthe only way to achieve the five year timeframe. (Note that this would put anydemonstration project at 2008 at the earliest.).
A fourth study (Work Package 5) comprises a compilation and evaluation of CO2utilization and storage options in western Canada that could be used to offset the costsof collecting CO2 from the retrofit and greenfield demonstrations. This study wasawarded to SNC-Lavalin in September 2002 and was completed in July 2003. Thestudy consolidated information on all aspects of CO2 utilization. It created an inventoryand characterization of storage and utilization options developed from a literature andknowledge review. The study also compiled all the factors, on a regional basis, thatimpact various utilization options, including an evaluation of capital and operating costsof each option, acknowledging such conditions as purity, contaminants and pressuresrequired for each option.
SNC-Lavalin reviewed all options to store or utilize CO2. They concluded that most useswould consume trivial amounts compared to the production from a single 300 MW coalfired plant (2.6 million tonnes per year, of a total of 78 million tonnes), and that the onlyviable options were enhanced oil recovery (EOR), enhanced coalbed methane recovery(ECBM), and geological storage, all in western Canada. SNC-Lavalin developedtheoretical values for storage capacity, cost, and consumption rates. Table 4summarizes the findings. However, the study also recognized that all three uses are stillevolving technologies, and while there do not appear to be any technical obstacles toEOR and geological storage, there remain many questions for any specific project.ECBM technology is still immature and projects are unlikely to proceed withoutsignificant technical development and demonstration (pilot) size project.
Table 4: EVALUATION OF CO2 STORAGE AND UTILIZATION OPTIONS
Parameter EOR ECBM DepletedReservoirs Deep Aquifers
Development status Commercial Pilot stage Commercial Commercial
Public Acceptance Issues None Ground water None Possible
Capacity Limit (AB & SK) 6-7 projects None > 50 projects None
Capital Cost (millions $) 900 170 45 Not evaluated
Breakeven Cost ($/tonne) 38 10 (4) Not evaluated
Note that the “breakeven” cost represents the maximum that the storage operator couldpay for the CO2 and achieve a zero NPV at a 15% discount rate. Thus the geologicalstorage options would require the utility to pay $4/t.
SNC-Lavalin concludes that the best option for storage of CO2 from a utility CO2 capturedemonstration project is to an EOR project. Since EOR and ECBM project havesignificant capital expenditures and complex logistics, they further conclude that CCPCshould initiate discussions with owners/operators of potential storage facilities as soonas possible. These discussions should include the uncertainties of reservoirperformance, both for CO2 storage, and for oil or gas production.

CCPC Phase I Final Report
CRI Consulting Page 9
A last study, awarded to Geological Survey of Canada in August 2002, evaluates thepotential of the Nova Scotia coal deposits for sequestering CO2 and producing coal-bedmethane. In particular this work evaluates the Cumberland, Pictou and Sidneycoalfields. It was scheduled for completion in May 2003. However, as of this writing, thereport is incomplete, and the results are not included in this report
In conclusion, it appears that a CO2 capture project is most likely to be a greenfieldproject because CO2 capture technologies are not sufficiently attractive on a retrofitproject. The major technical challenges include
• Gasification of low rank coals,
• Scale up and demonstration of amine scrubbing process enhancements, and
• Demonstration and operation of full scale oxyfuel combustion.
There remain many uncertainties with respect to the siting of a capture project, and thesiting for the storage of CO2. There also remain uncertainties with respect toparticipants, financing, project structure, and government participation. If CCPC is toachieve its objective of having a demonstration project in operation by approximately2010 it must act on these uncertainties immediately.
The set of conclusions that the Technical Committee of the CCPC has adopted as aresult of the work of Phase I are itemized below. The future direction that the CCPC andthe electricity industry might take to address these or any other findings of the Phase 1work packages are being addressed in a forum outside of this report.
• Gasification is still not mature technology for power plant applications.Significant work remains to be undertaken to make this a competitivetechnology, although it is probably the most likely platform for the future iflimits on CO2 emissions are applied. Similarly, oxyfuel is not yet a maturetechnology. Amine scrubbing would appear to be relatively mature, one ofthe lowest cost alternatives, and ready to apply to power plant applications forcapturing CO2. Initiatives are required:
o To explore and develop gasification for low ranked coals to makeit more reliable and cost effective, and
o To answer scale up questions regarding amine scrubbing.
• A demonstration project will require a substantial effort from industry andgovernment if it is to proceed and to succeed. Such a project will requireparticipation from the oil and gas industry - the potential consumers of CO2.A business case must be provided to them to develop their interest - todemonstrate to them what investment will be required of them, and wherethey can expect to obtain returns. In addition, government participation willbe required to ensure that such a project can be financed, to ensure that thenecessary permitting is provided, and to provide a substantial amount of thefunding.

CCPC Phase I Final Report
CRI Consulting Page 10
Table of Contents
1 INTRODUCTION .....................................................................................................11
2 GOALS OF THE PHASE I WORK ..........................................................................13
3 EMISSIONS TARGETS...........................................................................................15
4 OPTIONS FOR CARBON CAPTURE FOR COAL FIRED PLANTS ......................17
4.1 Amine Scrubbing Option ....................................................................................... 18
4.2 Oxyfuel (CO2/O2) Combustion Option.................................................................. 28
4.3 Gasification Option................................................................................................ 345 OPTIONS FOR CO2 USE OR STORAGE...............................................................39
5.1 Western Canada ..................................................................................................... 40
5.2 Ontario ................................................................................................................... 46
5.3 Nova Scotia............................................................................................................ 466 CONCLUSIONS ......................................................................................................46

CCPC Phase I Final Report
CRI Consulting Page 11
1 Introduction
The Canadian Clean Power Coalition (CCPC) represents power generators and coalsuppliers of over 90% of Canada’s coal-fired power generation. Thus, all participantshave a significant interest in coal burning assets. The participants of the CCPC, energycompanies from across Canada, have been concerned about the level of greenhousegas (GHG) emissions resulting from the operation of their plants. As the challenge ofpotential climate change impacts became clear, coal and coal fired electricity producersbegan to evaluate strategies for net emission reduction.
Several utilities began a series of discussions throughout 2000 and 2001 to identify acourse of action to ensure that coal and coal fired electricity would continue to have aplace in Canada’s energy supply future, alongside other conventional fuels and non-conventional renewable supplies. These discussions expanded and culminated in theformation of the CCPC, an association and formal agreement. That agreementdescribes the goals and specific objectives of the CCPC, and the commitments requiredof each participant, both financial and non-financial.
The CCPC Participation Agreement was signed in mid 2001 among ATCO PowerCanada Ltd., EPCOR Utilities Inc., Luscar Limited, Nova Scotia Power Inc., OntarioPower Generation Inc., Saskatchewan Power Corporation, and TransAlta UtilitiesCorporation, with the concept of a private-public partnership to develop technology tomeet those goals. Phase I of the project commenced in September 2001.Subsequently, the governments of Alberta, Saskatchewan, and Canada subscribed tosupport the CCPC. In addition, the participation of EPRI, and IEA was solicited andsubsequently secured. This Participation Agreement identified the work programme tobe carried out, the results of which this report describes.
A pre-screening study (Work Package 1) completed by SFA Pacific Inc. in November2001 evaluated the latest R&D in process developments suitable for commercial scaleretrofit applications and for greenfield applications, that would meet the design goals ofthe project for control of NOX, SOX, particulates (PM10 and PM2.5), mercury, CO2 andother airborne toxics. This study led to the preliminary selection of the gasification forgreenfield projects, and amine scrubbing and oxyfuel combustion for retrofit projects.However, that preliminary report also acknowledged that gasification could have anapplication in repowering scenarios.
Two major studies (Work Packages 2 and 3) were awarded to Fluor Canada in 2002 thatexamined the above technologies (gasification, and amine and oxyfuel) in detail, andthat were completed in July 2003. The design goals for the studies were a) no net lossof power output from the plant after retrofit (i.e., additional or self generation required), b)control and safe disposal of all emissions from the plant, c) capture of the CO2 from theplant and from any auxiliary power generation required, and d) evaluation of plantintegration options and benefits.
Since gasification is also being considered for the retrofit application, separation ofgreenfield costs will be provided to allow a repowering scenario to be developed fromthis work. Alternative sites for the greenfield demonstration will also be investigated andan assessment of the environmental impact will be carried out. Similarly, some efforthas been directed to evaluate amine and oxyfuel for greenfield projects.
The deliverable was a report for each technology that evaluated candidate sites for afull-scale demonstration project for each of the three coals, and included conceptual

CCPC Phase I Final Report
CRI Consulting Page 12
designs and cost estimates. An implementation concept for the demonstration projectwas developed for the one preferred site, taking into account the plant’s operationalstatus and the need to minimize plant outages.
Another study (Work Package 4) was awarded to Neill & Gunter Limited in April 2002,that identified emissions targets for air emissions, and evaluated and recommendedretrofit technologies and preparation of a cost estimate to control all air emissions,except CO2, for a commercial scale retrofit. Emission control targets that were alsoestablished by this study, were to be equal to or better than a natural gas combinedcycle (NGCC) plant. This work was completed in October 2002. The information fromthis study provided the CCPC with a baseline indicative cost against which will becompared the cost to control all emissions, including CO2, that will establish a trueevaluation of the cost to capture CO2 from an existing plant. An estimate of the impactof these technologies on the operating and maintenance costs was also provided.
A fourth study (Work Package 5) comprises a compilation and evaluation of CO2utilization and storage options in western Canada that could be used to offset the costsof collection of CO2 from the retrofit and greenfield demonstrations. This study wasawarded to SNC-Lavalin in September 2002 and was completed in July 2003. Thestudy consolidated information on all aspects of CO2 utilization. It created an inventoryand characterization of storage and utilization options developed from a literature andknowledge review and a subsequent compilation of all the factors, on a regional basis,that impact various utilization options. This included an evaluation of capital andoperating costs of each option, acknowledging such conditions as purity, contaminants,pressures, required for each option.
A last study, awarded to Geological Survey of Canada in August 2002, evaluates thepotential of the Nova Scotia coal deposits for sequestering CO2 and producing coal-bedmethane. In particular this work evaluates the Cumberland, Pictou and Sidneycoalfields. This work was scheduled for completion in May 2003, but as of this writing, itis not complete, and is not included in this summary report
The CCPC commissioned this Phase 1 Final Report to summarize the work producedfrom the various work packages, which comprises a large amount of material and detail.The CCPC anticipated that there would be too much detail in the individual reports for aperson to gain a ready understanding of the work that had gone into the project. Forexample, if CCPC were to interest new investors in the demonstration project, asummary and final report would be required to give that party a full understanding of theproject without disclosing proprietary knowledge. If a person subsequently wanted toevaluate the technologies in detail the individual reports would be made available undera confidentiality agreement. In addition, because the work packages were discretepieces of work performed by different contractors with little reference to one another, itwas felt that a summary report would provide significant value by relating the work of theindividual studies to one another and by showing a comprehensive picture of the entirebody of work. A third purpose for the summary report was to provide an assessment ofthe several technical reports against the original objectives of the CCPC for Phase 1, asit is important for any of the members of the CCPC, be they governmental funders orindustrial participants, to determine if the objectives that were espoused at the inceptionof the CCPC and Phase 1 were met. The final objective of the summary report was tosummarize the recommendations of the various contractors and the author on futuredirections for the CCPC. Prior to the finalization of this report, these last two objectiveswere removed from its scope.

CCPC Phase I Final Report
CRI Consulting Page 13
This report contains the set of significant conclusions that the CCPC TechnicalCommittee has reached from their review of the various Phase 1 reports. This is themost significant component of compiling and summarizing the other reports. The futuredirection that the CCPC and the electricity industry might take to address these or anyother findings of the Phase 1 work packages are being addressed in a forum outside ofthis report.
2 Goals of the Phase I work
Electric utilities recognize that they will be operating in a carbon constrained world, andthat coal and coal fired electricity generation businesses are seriously handicapped inthis new world. Yet all participants have significant interest in coal burning assets. TheCCPC was formed in response to that dilemma, its purpose:
• To secure a future for coal-fired electricity generation within thecontext of Canada’s multi-fuelled electricity industry
• To demonstrate that coal-fired electricity generation caneffectively address all environmental issues projected in thefuture, including CO2
• To research and develop commercially viable clean coaltechnology, and thence to construct and operate a full scaledemonstration project to remove greenhouse gas and all otheremissions of concern from 1) an existing power plant by 2007,and 2) a greenfield power plant by 2010
Phase I work of the CCPC was described as Conceptual Engineering and FeasibilityStudies that would ultimately lead to Engineering and Construction of the demonstrationproject. More specifically, Phase I was to undertake the following:
Retrofit TechnologyThe process feasibility research will study the most appropriate processtechnology for retrofit to existing power plants, how it should be configured, whatthe costs for each option are, and what impact on the plant performance willoccur if the technology were to be used. This would then allow the mostappropriate technology to be selected.
Research will be carried out to evaluate the costs to control all air emissionsexcept CO2 for a commercial scale retrofit to determine and define the bestoptions for CO2 disposal during the demonstration projects and later commercialprojects. The design goals will be: a) control of NOX & SOX; b) control ofparticulates, including PM10 & PM2.5; and c) control of mercury and other airtoxics. Control levels in each case are to be determined based on input from theproject technical committee, with the target being to allow a coal fired plant to beas clean as a modern gas turbine based natural gas fired plant.
Alternative options for handling the CO2 extracted from the commercial scale anddemonstration plants in various parts of Canada will be evaluated. Options

CCPC Phase I Final Report
CRI Consulting Page 14
include Coal-Bed Methane (CBM) in Nova Scotia, sequestration in aquifers inOntario, and Enhanced Oil Recovery (EOR), Coal-Bed Methane (CBM) andsequestration in aquifers in Saskatchewan and Alberta. This work was to becoordinated with other activities in western Canada on EOR and CBM.Measurement and monitoring requirements will be evaluated to ensure thatamounts sequestered can be quantified. CO2 infrastructure requirements to makethese options viable will be evaluated in regard to transportation, temporarystorage, and recycling from EOR or CBM projects.
Candidate sites for a full-scale demonstration project will be evaluated and animplementation concept for the demonstration project developed, taking intoaccount the plant’s operational status and the need to minimize plant outages.
New Plant TechnologyThis task will research the technology options for new plant concepts.Technologies such as supercritical pulverized coal, ultrasupercritical pulverizedcoal, pressurized fluidized bed combustion, integrated gasification combinedcycles, and advanced gasification options will be integrated together with optionsto control all emissions, including CO2, down to low levels. Developingtechnologies, such as the Los Alamos National Laboratory’s hydrogasificationwith CO2 sequestration in serpentine mineral (being developed by the ZeroEmission Coal Alliance, ZECA) will be included, as well as other advancedgasification options.
Based on the results of the previous task, the top two technology options will bedeveloped in more detail to determine the best candidate for the demonstrationplant. Alternative sites for the demonstration will also be investigated and anassessment of the environmental impact will be carried out.
The final report, giving the results of the studies carried out will be preparedusing the results from the previous two tasks. This will recommend thetechnology and site to be used for the demonstration project. Candidate sites fora full-scale demonstration project will be evaluated and an implementationconcept for the demonstration project developed.
The goals of the CCPC in Phase I have largely been met. Technology has beenidentified, or in the case of retrofit, has been confirmed to be currently not available.Implementation plans have been developed, so far as engineering and construction areconcerned. Further, the CCPC has identified specific areas where additional work isrequired because technology is not yet mature. In addition, an inventory of CO2 storageoptions has been compiled and a CO2 sink for a demonstration project has beenidentified. And several potential sites for a demonstration have been identified.
However, what none of the Phase I studies could provide is how the CCPC can makethe transition to Phases II and III, that is, how to enlist interested utilities and otherparties, how to structure the project, how to finance the project, how to enlist a CO2consumer/storage operator, how to enlist governments, and how to structure anygovernment funding. This latter is critical since governments are not interested infunding commercial ventures. They are interested in solving environmental problemsand in developing the appropriate technology. However, because of the large amounts

CCPC Phase I Final Report
CRI Consulting Page 15
of money involved, both industry and governments will have to be creative to create thecorrect financial climate for a demonstration project.
3 Emissions Targets
An engineering study (Work Package 4) was awarded to Neill & Gunter Limited/ADA-ESin April 2002, with deliverables to identify emissions targets for all emissions to meet allforeseeable new regulatory requirements, except CO2, and to evaluate and recommendretrofit technologies and to prepare a cost estimate to control all air emissions, exceptCO2, for a commercial scale retrofit. The targets so identified would guide subsequentwork on CO2 capture technologies. Emission control targets were to be equal to, orbetter than, a natural gas fired combined cycle (NGCC) plant. The targets were torecognize the regional impact of different coals and geography.
Based on a review of background emission trends, existing and emerging controltechnologies, public and regulatory perception, Neill & Gunter anticipated thatforeseeable regulatory requirements will require emission levels from a coal fired powerplant be comparable to a natural gas combined cycle plant (NGCC) with an SCR. Thisconfirmed the validity of the CCPC guidelines for emissions targets. Neill & Gunter alsoexpected that future emission guidelines will be output-based, and not (heat) input basedas has been used in the past. Output based limits provide incentives for more efficientgeneration technology and operations by making efficiency count towards emissionlimits. If these targets can be achieved, and the full fuel life cycle is considered, thenwith the exception of CO2, coal fired power plants will be cleaner than NGCC, becauseof the significant upstream emissions in the extraction, processing and transportation ofnatural gas. The specific emission targets are identified in Table 3.2 below:
Three existing reference plants, each representing a different type of coal, were selectedby the CCPC to be retrofitted with a pollution control system that would be able to meetnew target emissions. The selected reference plants are identified below.
Table 3.1: CCPC reference plants
Reference Plant Coal Boiler Type
Genesee, Alberta Sub-bituminous Alstom, Tangential Firing
Shand, Saskatchewan Lignite B&W, Wall Fired
Trenton, Nova Scotia Bituminous B&W, Wall Fired
Neill & Gunter identified and evaluated over 50 various control options that are eithercommercially available, or currently under development for SOX, NOX, fine particulateand mercury. In addition to this, over 25 emerging multi-pollutant approaches formanaging emissions in innovative and cost effective ways were also identified.

CCPC Phase I Final Report
CRI Consulting Page 16
To identify the most appropriate emission control technologies, a systematic or “DecisionAnalysis” procedure was followed which evaluated the technologies against a list ofcriteria including:
• Removal efficiencies.
• Commercial availability.
• Favorable economics.
• Feasibility of retrofit and commercial development of technology.
• Risk associated with the installation on the overall system.
Each technology was then scored on its relative performance resulting in a comparativepicture of the technologies. The technologies with the highest scores were selected foranalysis relative to the reference plants. From the more than 75 technologies that wereinvestigated at the outset, a total of 12 preferred technologies remained at the end of theDecision Analysis process.
NOTE: LONOX burners includes neural networks and OFA
Table 3.2: CURRENT AND TARGET EMISSIONS LEVELSParameter Units Coal Plants NGCC
Fuel Lignite Sub-Bituminous Bituminous Natural GasBoiler Type Wall Fired Tangential Wall Fired HRSG
Primary Targets Target Current Target Current Target Current
NOXg/MWhr
ng/J504.5
-258
504
-219
505
-258
285
SOXg/MWhr
ng/J555
-602
555
-198
554.5
-1462
4.50.7
ParticulatesPM10, PM2.5
g/MWhrng/J
282.5
-30.1
282.4
-15.1
282.8
-25.8
152
Mercury mg/MWhrpg/J
5.50.5
-14
3.50.3
-10
3.00.3
-9 N/A
CO Ppmv 40 40 40 45Chloride mg/Nm3 5 5 5 N/A
SO3 Ppmv 5 5 5 N/ANH3 Ppmv 1 1 1 1
Secondary TargetsVOC mg/Nm3 1 1 1 1
Heavy Metals:Selenium mg/Nm3 6 6 6Arsenic mg/Nm3 6 6 6
Cadmium mg/Nm3 2 2 2 Note: 1) Units based on 3% O2 in flue gas.
2) NOX values expressed as NO2
3) SOX, NOX, PM2.5, Hg based on a 720 hr rolling average.

CCPC Phase I Final Report
CRI Consulting Page 17
Neill & Gunter developed multi pollutant control options and associated retrofit costs(capital and operating and maintenance) for each reference plant, including identificationof system performance, synergistic effects, lifecycle issues, risk and identification of anyadverse consequences of implementing a particular system. The costs are presented inTable 3.3 below and are based on manufacturers information, Neill & Gunter in housedata base, EPRI Technical assessment guide and USEPA program Coal UtilityEnvironmental Cost (CUE COST).
The Neill & Gunter study confirmed the belief that meeting all emissions requirements,not including any requirements to limit CO2 emissions, would require significant capitaland have a major impact on the operating and maintenance costs of the plants. Thisfact could have a substantial influence on any decisions to capture CO2 emissions.
4 Options for Carbon Capture For Coal Fired Plants
Coal fired power plants are seriously at risk in a carbon constrained world since theyemit large quantities of CO2, larger than any other energy source. In addition, the CO2emitted is relatively impure, being diluted with large amounts of nitrogen, oxygen thathas not been consumed in the combustion process, water vapour that is both a productof combustion and is entrained in the coal, as well as a multitude of other “pollutants”such as SOX, NOX, particulates, etc. In addition, the opportunities to store CO2 generallyrequire that the gas be relatively pure. The challenge, therefore, is to obtain a relativelypure stream of CO2, with which it is feasible to do something.
The Technical Committee of the CCPC directed its attention to this issue, with a study toevaluate the best and most appropriate technologies that would provide a “pure” stream
Table 3.3: TECHNOLOGIES AND COSTS TO MEET TARGET EMISSIONS LEVELS
Fuel Bituminous Sub-Bituminous Lignite
Option 1 Option 2 Option 3 Option 1 Option 2 Option 1 Option 2
Technology
• LONOXburners
• SCR• Wet
scrubber• AquaNOX
scrubber
• LONOXburners
• SCR• LOTOX
• AirborneFGD
• Wet stack
• Toxecon• AquaNOX
• LONOXburners
• SCR• Marsulex
ActivatedCoke
• COHPAC
• LOTOX
• AirborneFGD
• Wet stack
• LONOXburners
• SCR• Marsulex
ActivatedCoke
• COHPAC
• LOTOX
• AirborneFGD
• Wet stack
CapitalCost
($millions)283.6 365.2 234.8 237.1 274.6 301.7 258.8
Unit Size 165 gross 410 gross 298 gross
Unit Cost($/kW net) 909 1,171 753 717 721 1,110 952
O&M($/MWhr) 6.73 6.57 5.53 9.49 4.19 11.24 6.52

CCPC Phase I Final Report
CRI Consulting Page 18
of CO2 from a coal fired plant. SFA Pacific Inc undertook this work, and identified thatfor a greenfield plant, gasification was the only real option. They further identified thatfor a retrofit application, gasification would be appropriate in a repowering scenario,while amine scrubbing and oxyfuel combustion would also be viable alternatives. TheTechnical Committee agreed with the conclusions, but believed that there would bevalue in considering amine scrubbing and oxyfuel for greenfield applications as well.The specifications for the engineering studies were prepared accordingly.
During the contract negotiations with the selected contractors the CCPC agreed that thestudies could be completed in two stages: 1) site selection and 2) site optimization.During the site selection stage the contractor was to develop the technical and designschemes in sufficient detail to identify the most cost effective and otherwise best site fordetailed optimized design.
4.1 Amine Scrubbing Option
Amine scrubbing is a process in which the flue gases from a conventional coal-firedboiler are passed through a large vessel (an absorber tower) and mixed intimately with achemical solution containing an amine, at which time the amine selectively captures(absorbs) the CO2. The amine with the CO2 is pumped to another vessel (CO2 stripper)in which the amine is processed (with large amounts of low quality heat) to release theCO2, thereby producing a pure stream of CO2 for disposal and storage. The cleaned orstripped amine is returned to the absorber tower to capture more CO2. See figure 4.1.
Figure 4.1. Amine Scrubbing Schematic
Flue Gasfrom Plant
CO 2 StripperReboiler
CO 2 to Cleanupand
CompressionCleaned
Flue Gas toAtmosphere
CO 2Stripper
AbsorberTower

CCPC Phase I Final Report
CRI Consulting Page 19
Amines can be tailored to capture any number of specific gases, and the process is wellknown and has been used by the chemical and petrochemical industries for many yearsto process a variety of gases.
Fluor was awarded a contract to evaluate amine scrubbing technology. As mentionedabove, the study proceeded in two stages – 1) a site selection stage and 2) a siteoptimization stage.
Site SelectionThe site selection study evaluated the impacts on performance and cost of removing allemissions including CO2 from three sites having three different coals. The three sitesselected for comparison were:
• Trenton 6, with a 156 MW boiler using bituminous coal
• Shand, with a 272 MW net boiler using lignite coal
• Genesee 1, with a 391 MW net boiler using sub-bituminous coal
Key constraints were set on the study that further set the basis for the comparativeevaluation. These constraints are summarized as follows:
• There was to be no net power import or export. Hence, all additional auxiliarypower requirements would be supplied by a new auxiliary coal-fired boiler locatedat the site.
• All emissions from the auxiliary boiler, including CO2, would have to be controlledto the same level.
• The objective was to achieve the emission level set for NGCC. The targets usedwere those established by Neill & Gunter.
• The conventional Fluor Econamine FGSM amine process is used to remove CO2from the flue gas. A capture rate of 90% is used for all three sites.
During the Site Selection Study, for simplicity no turbine steam extraction or heatintegration was carried out between the existing plant and new CO2 extraction plant.
The technology selection for removal of pollutants such as SOX, NOX, mercury andparticulate was conducted by evaluating over twenty different licensor and vendortechnologies. Licensors and vendors were contacted and their process performanceevaluated with respect to the three different site conditions, boiler operation and coalquality. After evaluation, the same technologies were selected for all sites regardless ofsite conditions, boiler size, boiler operation and coal type. The selected pollutant controltechnology was also evaluated with respect to its compatibility with the downstreamEconamine FGSM process. The final pollutant removal selected technology issummarized below.

CCPC Phase I Final Report
CRI Consulting Page 20
Pollutant Technology SelectionSOX Option A Wet Scrubber with Limestone to produce Gypsum
Option B Wet Scrubber with Ammonia to produce Fertilizer
NOX Option A Burner modification, SNCR followed by LoTOx™Option B Burner modification, SNCR followed by ECO™
Mercury Option A LoTOx™ followed by Wet Scrubber and Wet ESPOption B ECO™ followed by Wet Scrubber and Wet ESP
Particulate Wet Scrubber followed by Wet ESP
Since the two NOX removal technologies are still in the demonstration stage, it wasrecommended that both options be maintained for future evaluation. Both NOX removaltechnologies represent the best available technology that could be commerciallydemonstrated by 2005. With these technologies, the expected emission levels areshown in Table 4.1. These emissions are based on “net power” production, taking intoaccount only the auxiliary power needs for the boiler and turbine. When expressed as“net power with CO2 capture”, the target for retrofit increases by an additional 40%.
TABLE 4.1: Emission Level Comparison of Key Pollutants from Retrofit Plant
Pollutant UnitsCurrent
LevelsExpected
EmissionsN&G
Recommended
NGCC
Expected
SOX g/MWhr (net) 7,346 Nil 55 4.5
NOX g/MWhr (net) 2,243 43 50 28
Particulate g/MWhr (net) 662 22 28 15
Mercury mg/MWhr (net) 43 7.6 5.5 N/A
Some of the key performance and economics numbers calculated for the three sites areshown in Table 4.2.
TABLE 4.2: Key Performance Parameters for Various SitesCriterion Trenton Shand Genesee
Boiler Size (Gross/Net), MW 165/156 298/272 410/381
Annual Capacity Factor, % 81 84.8 96.9
Auxiliary Boiler Load (Gross/Net), MW 124/117 319/291 364/338
Aux. Load as % of Original Boiler Load, % 75 107 89
Total CO2 Production, tonnes/day 5,329 13,081 15,254
Total CO2 Avoided, tonnes/day 2,791 5,563 7,283
Total Installed Cost, million $ 545 1,077 1,254
Plant Installed Cost, $/kW (net plant output) 3,494 3,960 3,291
CO2 Production Cost, $/tonne 70 51 48
Cost of CO2 Avoided, $/tonne 134 121 100
Cost of Electricity, $/MWhr 100 103 80

CCPC Phase I Final Report
CRI Consulting Page 21
The performance data shown in Table 4.2 is for site comparative purposes only andshould not to be compared with the results for the Site Optimization Study. The trend inthe results above can be explained due to the key differences among the sites. Thesedifferences are highlighted qualitatively below.
TrentonAdvantages
• Requires significantly less capital due to smaller size.
Disadvantages
• No nearby EOR site. Coal Bed Methane Recovery is a possibility but notattractive.
• Very congested site.
• High coal cost.
• Has the highest CO2 avoided cost and cost of electricity due to small size.
ShandAdvantages
• Plenty of adjacent plot space available. Existing Shand infrastructure isdesigned with a second future power plant in mind.
• Good site for EOR application.
Disadvantages
• High moisture and ash content result in a high auxiliary power requirement.
• Zero discharge site results in a power and cost penalty.
• Need cooling tower to provide cooling needs.
• High ash disposal cost.
GeneseeAdvantages
• Has the highest boiler plant availability factor.
• Excellent potential site for EOR utilizing CO2.
• Plenty of plot space availability.
• Low coal and ash disposal cost.
• Larger size gives best economy of scale.
The Genesee site was the most attractive to continue with the site optimization, since ithad the lowest $/tonne of CO2 avoided and the lowest cost to generate electricity.However, the Technical Committee selected the Shand site in its place because of the

CCPC Phase I Final Report
CRI Consulting Page 22
ease and availability of obtaining Shand plant design data within the time frame of thestudy.
Site OptimizationAt the conclusion of the site selection stage, it was apparent to the Technical Committeethat its requirements around the supply of auxiliary power to the plant was causingsignificant compromises in the design. Accordingly, the Technical Committee decided atthe site optimization stage to evaluate amine technology as a simple add on piece ofequipment, accepting any loss of boiler production. The Committee also recognized thatto obtain the greatest benefit from amine technology it would be necessary to design athermal plant (boiler, turbine, etc.) with full consideration for the energy requirements ofthe technology – essentially a greenfield design. Therefore, the scope of work for theSite Optimization Study was defined to consider the following two study cases:
• A retrofit demonstration project for SaskPower Shand Plant. In this study, thefeasibility of retrofitting the existing Shand Boiler to capture CO2 by using EconamineFG PLUSSM was evaluated.
• A new greenfield supercritical lignite fired boiler near Shand. In this study, thefeasibility of a new greenfield boiler with CO2 capture using Econamine FG PLUSSM
was evaluated. This case allows comparison with the other technology options ofoxyfuel and coal gasification.
The goal of the site optimization stage was to optimize the design, to take the design toa greater level of detail, and especially energy integration within the plant and with theexisting system to increase the overall plant efficiency.
Retrofit Plant OptimizationThe constraints on the work included the following:
• Auxiliary power for CO2 capture was to be provided from existing boilerproduction and no new boiler is required.
• Maximize heat integration between the amine scrubbing process and the existingsteam turbine system.
• Use Econamine FG PLUSSM technology to get higher efficiency in capturing CO2.
Pollutant removal technology selection, pollutant emission targets and level of pollutantremoval did not change for this stage.
Significant process improvements achieved in this study that would result in improvedeconomic performance are highlighted below:
Existing Plant Integration
• Process steam was extracted from the IP/LP section crossover of the existingturbine. The amount of steam extraction corresponded to 50% of the LP sectionsteam at MCR. Extraction of such level of steam was feasible, but still requires amore detailed evaluation by the turbine manufacturer.
• Condenser condensate from the existing turbine was preheated to 1160C by thewaste heat in the CO2 stripper condenser and boiler flue gases.

CCPC Phase I Final Report
CRI Consulting Page 23
Pollutant Removal
• Flue gas was cooled to an optimum level to reduce power consumption by LoTOx™and downstream blower. In addition, well-proven CHX cooler technology wasutilized to cost effectively recover the heat.
• Utilized Reverse Jet Wet Scrubber to remove SOX down to 8 ppm with a low capitaland operating cost.
• Layered NOX removal technology by a combination of burner modification, low costSNCR and final LoTOx™ or ECO™ process trim.
• Optimized booster blower location.
• Discontinued LIFAC and achieved all flue gas desulphurization via Wet FGDscrubber. This allowed increased limestone utilization and minimizing of fly ashdisposal cost. Existing limestone storage and delivery system were reused.
• Recycled the flue gas condensate into the Wet FGD scrubber.
Econamine FG PLUSSM
• Achieved a 21% reduction in heat rate by the Econamine FG PLUSSM over theconventional Econamine FGSM process by incorporating the following:
o Split-flow technology
o Improved heat recovery from the solvent
o Lower solvent circulation due to improved solvent reformulation andloading
o Added absorber intercooler
o Vacuum reclaiming to reduce solvent degradation loss
• Achieved an additional 11% improvement in heat rate by condenser condensate heatintegration. The final Econamine FG PLUSSM heat rate is reduced from 4070 kJ/kg(1750 BTU/lb) to 2756 kJ/kg (1185 BTU/lb)
• Optimized the level of CO2 capture to 95%.
• Recycled waste streams such as reclaimer waste and spent carbon to the boiler.
• Utilized a single large size train concept throughout.
• Maximized the use of existing Shand offsite infrastructure in the retrofit design.
CO2 Compression
• Used a combination of compression and pumping to reduce 8% of compressionpower consumption.
• Achieved a 50% reduced compressor cost by incorporating single train single-shaftsplit-case compression instead of multiple train integrally geared compression.
• Optimized the selection and location of the CO2 dehydration unit. Glyceroldehydration unit at compressor final stage discharge was found to be the optimum.

CCPC Phase I Final Report
CRI Consulting Page 24
Offsite
• Incorporated water softening within the cooling tower blowdown cycle.
• Reduced energy in water treatment by incorporating reverse osmosis unit rather thanutilizing brine concentrator.
• Integrated existing brine concentration unit blowdown within the new wastewatertreatment unit crystallizer.
The overall retrofit plant performance for the average ambient conditions with 95% CO2capture is summarized below.
TABLE 4.3: Retrofit Plant Performance (95% CO2 Capture)
Boiler Gross Production, average 304.4 MW
Boiler Auxiliary Power Consumption 26 MW
CO2 and Pollutant Capture Auxiliary PowerConsumption 84.6 MW
Total Net Production 193.8 MW
Auxiliary Power Percentage 36.3%
Net Plant Efficiency 22.9%
CO2 Production 6,415 tonnes/day
CO2 Recovery 95%
An analysis of the distribution of this auxiliary power consumption for two cases, one for95% CO2 capture and the other for 85%, showed that the net export of power increasedby 2.5% when CO2 capture is reduced. The amine scrubbing technology offers flexibilityin that both the percent CO2 capture and the amount of flue gas processed can vary toincrease power production during peaking period with no significant impact on the rest ofthe system, especially with no impact on the power production.
The capital cost breakdown for the retrofit cases is shown on the following table.
TABLE 4.4: Capital Costs, Retrofit Cases (millions $)
Pollutant Removal System 86
Econamine FG PLUSSM 113.7
CO2 Compression System 29
Utilities and Offsite 75.1
Total Plant Installed Cost 303.8
Economic analysis for the 95% CO2 capture retrofit case shows a cost of CO2 avoided of$63.3/tonne and a cost of CO2 capture of $53.6/tonne. This is based on assigning$50/MW cost for auxiliary power import and using a 90% plant operating factor. Both

CCPC Phase I Final Report
CRI Consulting Page 25
costs of CO2 avoided and CO2 capture are very sensitive to the cost assigned toimported auxiliary power.
Greenfield Plant OptimizationThe greenfield optimization case is based on designing a new supercritical boiler forlignite fuel. A new air-fired boiler design provided by B&W as part of the oxyfuelcombustion study was taken as the basis. This air-fired unit design is based on grosspower production of 624.5 MW at 24,115 kPa(g) (3,500 psig) and 5930C (1,1000 F)steam temperature with a single reheat. The supercritical boiler had a gross/netefficiency of 42.1/40.1 (HHV). For the amine greenfield case, the size of the boiler wasprorated to 450 MW gross to allow obtaining about a 300 MW net production.
The CO2 capture plant and the pollutant capture plant was prorated from the retrofit casedesign. Similar process design features as discussed under the retrofit section for thepollutant removal and the CO2 capture are used in the greenfield case.
Maintaining the same pollutant removal efficiencies as in the retrofit case, the greenfieldcase shows similar final pollutant levels and recoveries for SOX, NOX, particulates andmercury. The pollutant removal scheme is the same as for the retrofit with the exceptionof NOX removal. For the NOX removal, the boiler is designed with ultra low NOX burners.This was followed by the addition of an SCR unit to remove NOX down to 30 ppm. Thefinal cleanup down to 5 ppm NOX level is done by either the LoTOx™ or the ECO™process.
The overall plant performance for the greenfield base case with 95% CO2 capture issummarized in the following table 4.5. Economics for the greenfield plant with 95% CO2capture is shown in Table 4.6. The EPRI economic model was used in the economicanalysis.
TABLE 4.5: Greenfield Plant Performance
95% CO2 Capture
Boiler Gross Capacity, average 453.5 MW
Boiler Auxiliary Power Consumption 21.4 MW
CO2 and Pollutant Capture Auxiliary PowerConsumption 142.7 MW
Total Net Capacity 310.9 MW
Auxiliary Power Percentage 31.46%
Net Plant Efficiency 28.83%
CO2 Production 8,547 tonnes/day
CO2 Recovery 95%

CCPC Phase I Final Report
CRI Consulting Page 26
Similar to the retrofit case, an analysis of the distribution of this auxiliary powerconsumption for 95% CO2 capture versus 85% capture showed that the net export ofpower increased by 2.5% when CO2 capture is reduced. Also similar to the retrofit case,the amine scrubbing technology offers flexibility in that both the percent CO2 capture andthe amount of flue gas processed can vary to increase power production during peakingperiod with no significant impact on the rest of the system, especially with no impact onthe power production. In addition, that analysis showed that even though the 85% CO2capture reduces the cost of electricity by 5%, it results in a 2% higher cost of CO2avoided. Furthermore, the study found that the economy of scale does reduce the costof electricity and cost of CO2 avoided. An amine plant of 625 MW gross will result in a5% reduction in cost of electricity and a 13% reduction in the cost of CO2 avoidedcompared to the present 450 MW (gross) case.
TABLE 4.6: Cost Summary, Greenfield Plant (95% CO2 Capture)
Capital Cost, millions $
Boiler Plant 998.4
Pollutant Removal System 94.4
Econamine FG PLUSSM 130.4
CO2 Compression System 34.7
Utilities and Offsite 112.4
Total Capital Cost 1,370.4
Total Capital Requirement 1,907
Cost of Electricity, $/MW
Cost of Electricity With CO2 Capture 115.9
Cost of Electricity (no CO2 capture) 69.4
Cost of Avoided Pollutant, $/tonne
Cost/Tonne of CO2 Avoided 56.6
Cost/Tonne of CO2 Captured 40.6
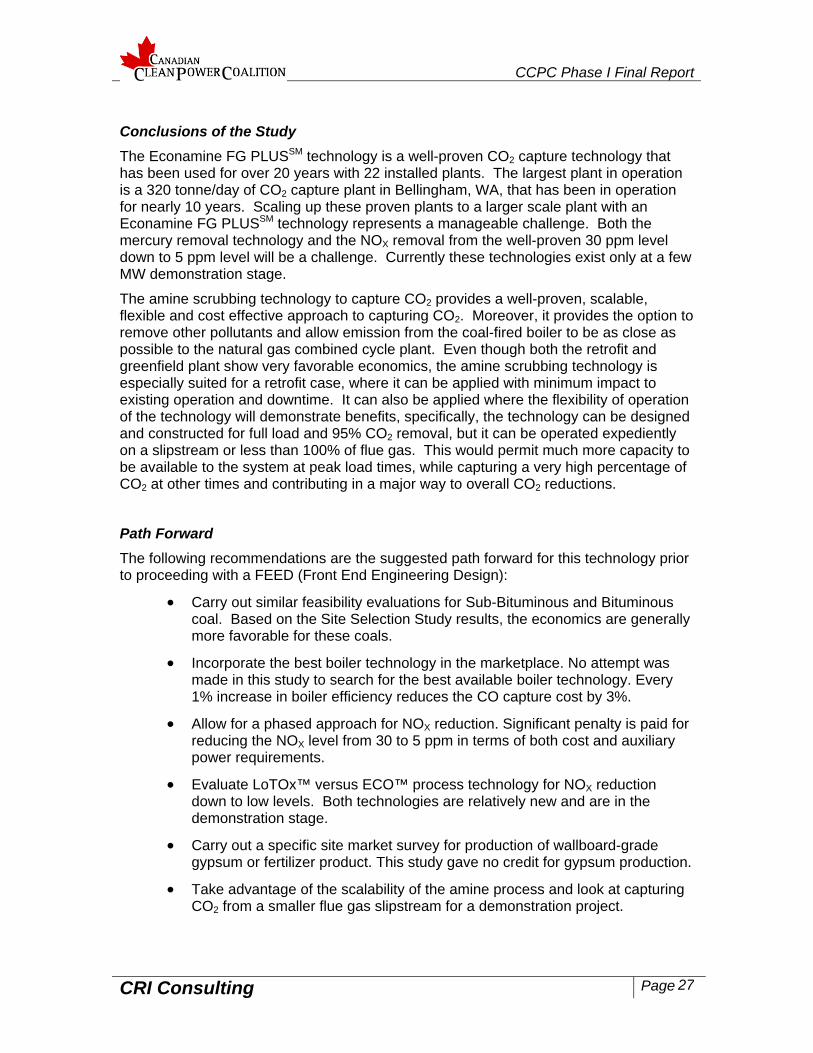
CCPC Phase I Final Report
CRI Consulting Page 27
Conclusions of the StudyThe Econamine FG PLUSSM technology is a well-proven CO2 capture technology thathas been used for over 20 years with 22 installed plants. The largest plant in operationis a 320 tonne/day of CO2 capture plant in Bellingham, WA, that has been in operationfor nearly 10 years. Scaling up these proven plants to a larger scale plant with anEconamine FG PLUSSM technology represents a manageable challenge. Both themercury removal technology and the NOX removal from the well-proven 30 ppm leveldown to 5 ppm level will be a challenge. Currently these technologies exist only at a fewMW demonstration stage.
The amine scrubbing technology to capture CO2 provides a well-proven, scalable,flexible and cost effective approach to capturing CO2. Moreover, it provides the option toremove other pollutants and allow emission from the coal-fired boiler to be as close aspossible to the natural gas combined cycle plant. Even though both the retrofit andgreenfield plant show very favorable economics, the amine scrubbing technology isespecially suited for a retrofit case, where it can be applied with minimum impact toexisting operation and downtime. It can also be applied where the flexibility of operationof the technology will demonstrate benefits, specifically, the technology can be designedand constructed for full load and 95% CO2 removal, but it can be operated expedientlyon a slipstream or less than 100% of flue gas. This would permit much more capacity tobe available to the system at peak load times, while capturing a very high percentage ofCO2 at other times and contributing in a major way to overall CO2 reductions.
Path ForwardThe following recommendations are the suggested path forward for this technology priorto proceeding with a FEED (Front End Engineering Design):
• Carry out similar feasibility evaluations for Sub-Bituminous and Bituminouscoal. Based on the Site Selection Study results, the economics are generallymore favorable for these coals.
• Incorporate the best boiler technology in the marketplace. No attempt wasmade in this study to search for the best available boiler technology. Every1% increase in boiler efficiency reduces the CO capture cost by 3%.
• Allow for a phased approach for NOX reduction. Significant penalty is paid forreducing the NOX level from 30 to 5 ppm in terms of both cost and auxiliarypower requirements.
• Evaluate LoTOx™ versus ECO™ process technology for NOX reductiondown to low levels. Both technologies are relatively new and are in thedemonstration stage.
• Carry out a specific site market survey for production of wallboard-gradegypsum or fertilizer product. This study gave no credit for gypsum production.
• Take advantage of the scalability of the amine process and look at capturingCO2 from a smaller flue gas slipstream for a demonstration project.

CCPC Phase I Final Report
CRI Consulting Page 28
• Have a steam turbine vendor take a detailed look at the mechanical impact ofsteam extraction from the Shand existing turbine.
4.2 Oxyfuel (CO2/O2) Combustion Option
Oxyfuel combustion is a process in which coal is burned in an atmosphere of carbondioxide (CO2) and oxygen (O2), rather than in a conventional atmosphere of air which iscomprised largely of nitrogen (N2) and oxygen (O2). See Figure 4.2. Thus the processreplaces N2 with CO2, and is possible because only oxygen is active in the combustionprocess. The CO2 is obtained from the boiler outlet and is recirculated to the boiler inlet.It is enriched with oxygen from an air separation plant to a level that is suitable for stablecombustion. The process provides a relatively pure stream of CO2, which is cleaned ofother contaminants and purified for sale or storage. Natural Resources Canada hasbeen working with the concept for many years, and has developed a pilot plant. Thetechnology has never been operated at full scale.
Figure 4.2. Oxyfuel Combustion Schematic
Similar to the amine scrubbing option, the study proceeded in two stages, site selectionand site optimization.
Air Nitrogen
Coal
Flue gas~97% CO 2
Boiler
Drier
Water
AirSeparation
Compressor
G
TurbineGenerator
Feed Pump
Oxygen
Flue Gas (~97% CO 2)
Recycle ~75%

CCPC Phase I Final Report
CRI Consulting Page 29
Site SelectionAlso similar to the amine scrubbing case, the site selection study constraints includedthe following:
• Evaluate the impacts on performance and cost of removing all emissionsincluding CO2 from three sites having three different coals. The three sitesselected for comparison were:
o Trenton 6, with a 156 MW boiler using bituminous coalo Shand, with a 272 MW net boiler using lignite coalo Genesee 1, with a 391 MW net boiler using sub-bituminous coal
• No net power import or export. Hence, all additional auxiliary power requirementswould be supplied by a new auxiliary boiler located at the site
• Retain the capability to fire the unit on air at full load
• The objective was to achieve the emission level set for NGCC. The targets usedwere established by Neill & Gunter.
Non CO2 emission removal technology for all three sites comprised a simple wetESP/wet FGD combination. This results from the relatively simple oxyfuel concept. Itwas anticipated in the site selection stage that the oxyfuel technology would require noNOX removal, since there is little NOX produced – combustion occurs in a CO2 richenvironment where CO2 replaces N2, thus, little NOX is produced. Thus, NOX would nothave to be controlled, and the selected wet ESP/wet FGD would control all otheremissions.
Key performance and economic numbers are shown in Table 4.7.
Site Optimization
TABLE 4.7: Key Performance Parameters for Various SitesCriterion Trenton Shand Genesee
Boiler Size (Gross/Net), MW 165/156 298/272 410/381
Annual Capacity Factor, % 81 84.8 96.9
Auxiliary Boiler Load (Gross/Net), MW 122/115 316/288 297/276
Aux. Load as % of Original Boiler Load, % 74 106 72
Total CO2 Production, tonnes/day 5,383 14,183 15,311
Total CO2 Avoided, tonnes/day 2,824 6,008 8,105
Total Installed Cost, million $ 1,120 2,014 1,902
Plant Installed Cost, $/kW (net plant output) 7,179 7,404 4,992
CO2 Production Cost, $/tonne 126 78 66
Cost of CO2 Avoided, $/tonne 240 184 124
Cost of Electricity, $/MWhr 181 170 110

CCPC Phase I Final Report
CRI Consulting Page 30
Following the results of the Site Selection Study, the CCPC selected the Shand site intothe Site Optimization Study. As well, it was decided to change from a retrofit to a newunit scenario for the Shand site in order to allow the boiler to be sized appropriately toeliminate the smaller parasitic power plant. A new unit would also permit the boiler to bedesigned from the outset to minimize air infiltration into the boiler passages by arrangingthe boiler for pressurized operation. It would also allow the selection of a newsupercritical boiler rather than the existing Shand boiler. Since the supercritical boiler ismuch more efficient, the resulting flue gas flow is lower with higher CO2 concentration.
In addition to a more advanced boiler design the infiltration rate set for the boiler systemhas been lowered to 1% resulting in a slightly positive pressure operation. Finally,because of the more efficient supercritical boiler design, the pollutant level in the flue gasfrom the boiler is also lower as compared to that in the Site Selection Study. This hasmajor positive impact on the Product Recovery Train, leading to lower energyconsumption required to recover the CO2 product.
Last, the CCPC also agreed to review the selection of the Air Separation Unit (ASU) inorder to explore improving the efficiency for this process. A target of at least 300 MW(net) was set for the new plant in order to match the rating of the existing unit at thislocation. This sizing also ensured that reasonable economies of scale would beavailable, because lignite fueled power plants are physically much larger than unitsselected for better coals.
While it is understood that the Shand site is water limited, no specific attempt was madeto integrate the considerable heat of condensation available from the water vaporpresent in the flue gas stream, that must be removed - one way or another - from therecovered product stream.
Significant process improvements achieved in this stage of the study that would result inimproved economic performance are highlighted below:
Air Separation Unit
• Incremental capital cost was evaluated at $1,300/KW, allowing more capital to bespent to improve efficiency in operation. This resulted in a reduction of auxiliarypower of 6.9% and reduced cooling water requirements by 27.4%
• Provision of liquid O2 storage will allow the ASU to be turned down to 75% at peakload periods, while maintaining CO2 capture, that in turn will allow increased plantoutput of 20 MW.
Product Recovery Train
• Integration of reboiler heat with the CO2 compressor interstage cooling
• Evaluation of single shaft versus internally geared compressors. Single shaftconfirmed
• Evaluation of different dehydration technologies
Wastewater Treatment
• Selection of Reverse Osmosis for wastewater treatment instead of BrineConcentrator.
The overall plant performance and cost summary is presented in the following tables:
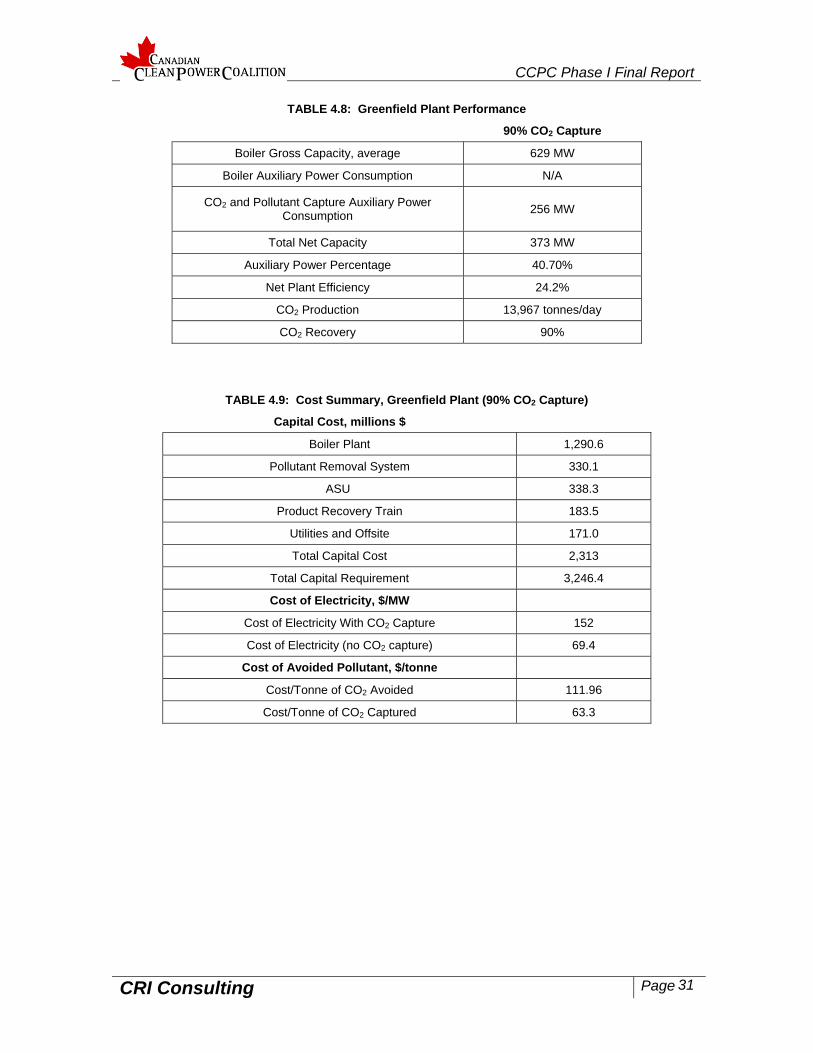
CCPC Phase I Final Report
CRI Consulting Page 31
TABLE 4.8: Greenfield Plant Performance
90% CO2 Capture
Boiler Gross Capacity, average 629 MW
Boiler Auxiliary Power Consumption N/A
CO2 and Pollutant Capture Auxiliary PowerConsumption 256 MW
Total Net Capacity 373 MW
Auxiliary Power Percentage 40.70%
Net Plant Efficiency 24.2%
CO2 Production 13,967 tonnes/day
CO2 Recovery 90%
TABLE 4.9: Cost Summary, Greenfield Plant (90% CO2 Capture)
Capital Cost, millions $
Boiler Plant 1,290.6
Pollutant Removal System 330.1
ASU 338.3
Product Recovery Train 183.5
Utilities and Offsite 171.0
Total Capital Cost 2,313
Total Capital Requirement 3,246.4
Cost of Electricity, $/MW
Cost of Electricity With CO2 Capture 152
Cost of Electricity (no CO2 capture) 69.4
Cost of Avoided Pollutant, $/tonne
Cost/Tonne of CO2 Avoided 111.96
Cost/Tonne of CO2 Captured 63.3

CCPC Phase I Final Report
CRI Consulting Page 32
Conclusions of the StudyThe following is a summary of the results derived from the study:
• Though immature, oxyfuel technology is a viable technology for application toexisting and to new facilities. It provides the attraction of part load operation andtherefore dispatching a unit on a peaking basis. This is a feature that should beexplored and evaluated fully by any utility looking to manage its CO2 emissions whileoptimizing its capital investment and utilization of facilities.
• A new unit presents the most favorable conditions for application of oxy-fuelcombustion for capture of CO2 due to the ability to reduce air infiltration using apressurized furnace.
• Decoupling the ASU, boiler and PRT allows for maximum operational flexibility andintroduces the possibility of power peaking for short periods by using oxygen that hasbeen stored in off-peak periods and/or by venting CO2.
• A demonstration unit at Shand presents an opportunity to capture up to 4 mega-tonnes of CO2 annually in reasonable proximity to emerging sequestrationopportunities.
• The overall capital cost identified for the optimized Shand unit is about $3700 pergross kW installed.
• The cost of electricity produced while capturing the CO2 from the optimized Shandunit is about $150/MWh.
• The cost of CO2 avoided from the optimized Shand unit is about $110 to $115/tonneCO2.
• The requirement to retain the capability for full air firing resulted in significantly highermass flow through the boiler and commensurately larger equipment sizing forpollutant removal and gas cooling in the boiler flue gas exit flow than would berequired for oxyfuel alone. This is an area that could benefit from additional reviewfor specific projects.
• The optimized Shand unit presents little process risk and can be operated at loadsanywhere up to 100% on air.
Path ForwardOxyfuel technology is not yet a mature technology. Many issues remain in how todevelop this technology for production purposes. However, it could provide flexibility byproviding peaking power while maintaining CO2 emissions limits. The study identifiedseveral key areas where significant improvements could be made which could make thisa more competitive alternative. Based on the results of this study, the following is a listof items that should be considered for further evaluation to improve the overall plantefficiency and reduce the total cost:
• Optimize Flue Gas Temperature - As a result of the work in this study it has beenrecognized that insufficient cooling takes place within the wet FGD scrubber to attain

CCPC Phase I Final Report
CRI Consulting Page 33
the desired temperature for the PRT and perhaps the recycle stream. The studiesrecommended that further consideration be given to the use of heat exchangedownstream of the wet FGD scrubber, as well as looking at the potential uses for theheat recovered within this heat exchanger that could have a significant impact on theoverall cycle efficiency during oxy-combustion.
• Optimize Air Heater Balance - The current air heater balance is based on standardair heater design practice. Given the differences in gas composition andtemperatures of the boiler outlet and recirculation gas flows as compared toconventional air firing, the studies concluded that it may be possible to achieve amore optimum air heater design that minimizes the performance penalty associatedwith the higher flue gas temperature leaving the air heaters during oxy-combustion.The study also concluded that other air heater designs should also be considered,including splitting the primary and secondary duties into separate air heaters in orderto provide more opportunity to balance the performance under such widely varyingconditions. The studies recommended that the air heater selection be furtheroptimized in close cooperation with an air heater vendor.
• Optimize Flue Gas Cooling - To accommodate the current temperaturerequirement for the PRT the gas must be cooled beyond what is achieved in the wetFGD absorber. For this study the entire flue gas flow was reduced in temperature ina condensing heat exchanger to achieve 540 C. However, the fans and boiler cyclecould be designed to accommodate the wet FGD outlet temperature that would be abit higher than 680C, and only the stream to the PRT could be cooled. The higherrecirculating gas temperature would result in somewhat larger FD fans with a higherpower required due to the greater gas volume, and it is likely that the boiler efficiencywould be reduced a little. The reduced boiler efficiency would mean increased fueland oxygen consumption but a much smaller condensing heat exchanger. Since theCHX® is a relatively expensive component in the overall plant, this optimizationshould be pursued further to define the optimum economics for this heat exchanger.This optimization could lead to the following improvements:
o Improved cycle efficiency through integration of heat recovery from fluegas moisture condensing duty (may be ideal for Shand site with highmoisture content coal and water restrictions).
o Possibility of eliminating Wet ESP if Condensing Heat Exchangerperformance can be established, saving capital and operating costs.
o Possibility of eliminating SO2 scrubber if performance of PRT andreservoir can be established, saving capital and operating costs.
• Optimize the Firing System - Two types of firing systems can be used for this plant:pulverized coal (PC) or slagging cyclone type burners. B&W’s latest low NOX PCburners with overfire air were assumed for this study. However, additionaldevelopment of the fuel firing system is necessary to both optimize the combustionprocess and confirm the basis for performance predictions. Two recommendationsare provided in that regard: experimental testing of the lignite with DRB-4ZTM burnerperhaps in B&W’s 105.5 GJ/h (100 MMBTU/h) burner test facility and developmentof an oxy-fuel burner to effectively introduce the oxygen into the burner and improveNOX reduction.
The study described the potential benefits of Cyclone burners. This possibility forreducing the furnace size and consequently boiler cost versus the impact on NOX

CCPC Phase I Final Report
CRI Consulting Page 34
emissions should be further investigated, especially because of the fit between thisfiring technique and the particular fluxing characteristics of Saskatchewan lignitewhen fired under oxy-combustion conditions. Because of the specific fouling andslagging characteristics of Saskatchewan lignite, the proposed furnace chambermust be quite large to accommodate firing the fuel in pulverized form while keepingthe furnace wall deposits in dry form for removal through the furnace bottom usingconventional wall mounted sootblowers. A cyclone fired furnace could be muchsmaller since 60 to 70% of the coal ash would be tapped out the bottom of thefurnace in molten form leaving a much smaller amount of ash that passes into theupper part of the furnace chamber and through to the convection pass. This is incontrast to a pulverized coal-fired unit in which 80% of the coal ash typically passesthrough to the convection pass.
The disadvantage of cyclone firing in the past has been the large amount of NOXgenerated by the intensity of mixing and high temperatures experienced within thecyclone burners. Cyclone furnaces built in the 1960’s and 1970’s have not been ableto be converted to low NOX operation using pulverized coal firing and so thistechnology has not seen much development over the last 20 years. Oxyfuelcombustion with flue gas recycle using lignite coals with low melting point ashes isan elegant approach to minimizing the size and therefore cost of the boiler proposedin this study. The study recommends that the CCPC consider a follow on study toidentify the potential cost savings of a cyclone design for Saskatchewan lignite withdue consideration the NOX question, that should not pose a great challenge duringcombustion with oxygen due to the recycling of NO to the flame and the lowavailability of nitrogen within the flame.
4.3 Gasification Option
Coal gasification is the process by which the carbon in coal, in the presence of waterand air, is converted directly to carbon monoxide (CO), carbon dioxide (CO2), andhydrogen (H2). See Figure 4.3. Thus, the process provides a relatively pure stream ofCO2 for disposal. Coal gasification has been used for more than a hundred years and isa technology that is well known by the chemical and petrochemical industries. Thegasification process is marketed today by several technology licensors each of whomhave different proprietary processes.

CCPC Phase I Final Report
CRI Consulting Page 35
Figure 4.3. Coal Gasification Schematic
As with the amine scrubbing and oxyfuel studies, the study for gasification optionsproceeded in two stages. However, in this case the stages were identified as1) technology selection and 2) technology optimization
Technology SelectionA qualitative technology evaluation was initially conducted of the various units that wereconsidered be suitable for incorporation in a gasification-based plant. These technologyoptions were then narrowed down to those that show performance and cost advantageover the alternative technologies, and also are available in the time frame beingconsidered for the demonstration plant. The resulting recommended overall plantconfiguration consists of an oxygen blown Integrated Gasification Combined Cycle(IGCC) plant. Four gasification technologies: E-Gas, Noell, Shell and ChevronTexaco,were analyzed to provide CCPC a basis for selection of the appropriate gasificationtechnology.
The first three gasification processes above were evaluated for all three coals, while theChevronTexaco process was evaluated for the bituminous and sub-bituminous coalsonly. ChevronTexaco stated that they do not consider their process suitable for thelignite feedstock due to its very high inherent moisture content. Each of these oxygenblown gasification units is integrated with a combined cycle consisting of two GeneralElectric 7FA+e gas turbines. The CO contained in the syngas produced by thegasification process is reacted with steam in sour shift reactor(s) to form CO2; 80 to 90percent of the CO2 is then removed along with the sulfur compounds in a Selexol unit.
FuelPreparation Gasifier
Gas Cooling
GasCleaning
ShiftReactor
CO2Extraction
GasTurbine
Waste HeatBoiler
SteamTurbine
CO2 Cleanup& Compression
Air
Coal
Water
Slag Sulphur
CO2 toPipeline
Hydrogen
Flue GasTo
Atmosphere
ElectricPower
ElectricPower
Air Separation
Plant

CCPC Phase I Final Report
CRI Consulting Page 36
The mostly decarbonized clean syngas is fired in the gas turbines. The recovered CO2is compressed to 13800 kPa(g) prior to feeding it to a pipeline. Other effluentsgenerated by the plant are elemental sulfur, low CO2 content flue gas (from thecombined cycle), slag and wastewater.
It is worth noting that Shell and Noell feed the gasifier with dried and pulverized fuel.Low rank coal contains large amounts of moisture, and drying it consumes a significantamount of energy. The thermal efficiency of plants using such fuels can be enhanced bydrying the feedstock under pressure utilizing high pressure nitrogen produced by the airseparation unit (or high pressure syngas). In turn, the effluent gas from the dryer with itsaccompanying moisture is returned to a gas turbine (after the moist gas is preheatedand passed through a particulate filter). In this manner, the large amount of heat utilizedby the drying operation, which tends to limit the overall thermal efficiency of the IGCC,does not become a thermal penalty on the process. The added moisture alsodecreases the NOX emissions from the gas turbine. The net result is a process thatshows a significant improvement in the plant net heat rate for the sub-bituminous coaland the lignite. This was the process evaluated by CCPC.
Selected Overall Plant ConfigurationsThe results of the technology selection stage are summarized in the following table:
Table 4.10: Gasification Technology Selection Results
Fuel Units Bituminous Sub-bituminous Lignite
Technology ChevronTexaco ChevronTexaco Shell
Carbon Recovery % 81.2 85.6 85.7
Efficiency (HHV) % 29.88 25.39 24.03
Capital Cost Millions $CAD 1,774 2,095 2,317
Cost of Electricity $/MWhr 76.5 69.29 86.82
Capacity MWnet 413 428 402
Bituminous CoalThe total plant cost on a dollars per kW basis of the ChevronTexaco case wassignificantly lower than the corresponding Shell and E-Gas cases while its heat rate wassimilar to the Shell case and lower than the E-Gas Case. This resulted in making thecost of electricity the lowest for the ChevronTexaco case, about 10% lower than theShell case and about 20% lower than the E-Gas case. Based on these results, theChevronTexaco gasifier-based plant was selected by CCPC for further optimization andrefinement of performance and cost estimates under the site-specific conditions.
Sub-Bituminous CoalAgain the total plant cost on a dollars per kW basis of the ChevronTexaco case wassignificantly lower than the corresponding Shell and E-Gas cases while its heat rate waslower than both the Shell cases (i.e., with low pressure and high pressure drying) andthe E-Gas Case. This resulted in making the cost of electricity the lowest for the
CCPC Phase I Final Report
CRI Consulting Page 37
ChevronTexaco case, about 20% lower than the Shell and the E-Gas cases. Based onthese results, the ChevronTexaco gasifier-based plant was selected by CCPC for furtheroptimization and refinement of performance and cost estimates under the site-specificconditions.
LigniteThe total plant cost on a dollars per kW basis of the Shell case with the high pressuredrying was significantly lower than the corresponding Shell case with the low pressuredrying as well as the E-Gas case. The heat rate of this Shell case with the high pressuredrying was also significantly better, as much as 10% lower than the Shell case with thelow pressure drying and more than 20% lower than the E-Gas Case. This resulted inmaking the cost of electricity the lowest for the Shell case with the high pressure drying,about 10% lower than the Shell case and about 20% lower than the E-Gas case.
A sensitivity case is also developed for the low pressure Shell case without any airextraction to assess the impact on the cost of electricity if air extraction from the gasturbine is not possible; i.e., without compromising the output of the engine. The cost ofelectricity for the case without air extraction did increase by approximately 10% over thecorresponding case with air extraction. Even when this 10% increase is added to theShell case with high pressure drying, this case still had a substantial advantage in costof electricity over the E-Gas case.
Based on these results, the Shell gasifier-based plant with the high pressure drying wasselected by CCPC for further optimization and refinement of performance and costestimates under the site-specific conditions.
Technology Optimization
Design of the three cases above was then developed to approach a more optimizeddesign under site-specific conditions. Performance and cost estimates were developedin much greater detail in order to provide a basis for CCPC to make the site selection forthe demonstration plant as well as be able to compare the gasification option withalternate CO2 capture options.
Table 3.12 presents the results of the gasification study, with a baseline of aconventional plant utilizing a supercritical boiler, capturing all emissions to extremely lowlevels, except CO2. Plant costs are highly dependent upon the rank of the coal; thehigher the rank, the lower the plant cost. However, the cost of electricity is the lowest forthe sub-bituminous case, primarily due to the cost of the sub-bituminous coal beingsignificantly lower than that of the bituminous coal. The cost of avoided CO2 follows atrend similar to the plant installed costs, being lowest for the bituminous case andhighest for the lignite. The cost of avoided CO2 for the sub-bituminous case however, isonly slightly higher than the bituminous case, primarily due to the cost of electricity forthis case being lower than the bituminous case (the cost of the sub-bituminous coalbeing significantly lower than that of the bituminous coal, as mentioned earlier).Secondary reasons are that that the amount of carbon present in the coal per unit of thecoal contained energy is higher for the sub-bituminous case (i.e., more carbon enters theplant than the other cases per unit of coal energy input to the plant) as well as thepercentage of CO2 captured is higher in the sub-bituminous case.
Table 4.11: Coal Gasification - Major Plant Performance and Cost Parameters

CCPC Phase I Final Report
CRI Consulting Page 38
Coal Bituminous Sub-Bituminous LigniteTechnology Boiler Gasif. Boiler Gasif. Boiler Gasif.
CO2 Captured, % None 86.4 None 89.0 None 85.7Tonne/MWhr 0.7710 0.1164 0.8520 0.1114 0.8830 0.1822
CO2 Emitted ST/MWhr 0.8500 0.1284 0.9393 0.1228 0.9735 0.2009
Tonne/MWhr 0.6546 0.7406 0.7008CO2 Avoided by GasificationPlants ST/MWhr 0.7216 0.8165 0.7726
kJ/kWh 8,758 11,408 9,032 13,806 9,144 13,239Net Heat Rate – HHV
BTU/kWh 8,303 10,815 8,563 13,089 8,669 12,551kJ/kWh 8,429 10,979 8,736 13,354 8,798 12,738
LHVBTU/kWh 7,991 10,408 8,282 12,660 8,341 12,076
% 41.11 31.56 39.86 26.07 39.37 27.19Thermal Efficiency - HHVLHV % 42.71 32.79 41.21 26.96 40.92 28.26
$/MWhr 76.00 106.69 58.19 96.84 69.37 130.85COE @ 90% CF
USD/MWhr 48.72 68.39 37.30 62.08 44.47 83.88$/tonne CO2 46.88 52.20 87.73
Cost of Avoided CO2 USD/ST CO2 27.26 30.35 51.01Capacity (MWnet) 444 437 361
Capital Cost $ millions 1,329 1,493 1,593
Conclusions of the StudyThe reports concluded that from the above results, plant costs are highly dependentupon the rank of the coal; the higher the rank, the lower the plant cost. The cost ofelectricity is the lowest for the sub-bituminous case however, primarily due to the cost ofthe sub-bituminous coal being significantly lower than that of the bituminous coal. Thecost of avoided CO2 follows a trend similar to the plant installed costs, being lowest forthe bituminous case and highest for the lignite. The cost of avoided CO2 for the sub-bituminous case however, is only slightly higher than the bituminous case, primarily dueto the cost of electricity for this case being lower than the bituminous case (the cost ofthe sub-bituminous coal being significantly lower than that of the bituminous coal, asmentioned earlier). Secondary reasons are that that the amount of carbon present perunit of coal, and thus the amount of energy, is higher for the sub-bituminous case (i.e.,more carbon enters the plant than the other cases per unit of coal energy input to theplant) as well as the percentage of CO2 captured is higher in the sub-bituminous case.
Finally, it should be noted that the CO2 emission from these plants that ranges from 0.11to 0.18 tonne/MWhr is significantly lower than that from a natural gas-fired state-of-the-art combined cycle that is about 0.35 tonne/MWhr.
Path ForwardDuring the course of this study, design options were identified that could improve theperformance and the economics of these gasification plants. Thus, these optionsdescribed below should be studied before the FEED package is developed:

CCPC Phase I Final Report
CRI Consulting Page 39
• Evaluate the option of producing a sour CO2 stream, i.e., bulk acid gas removal whileletting the sulfur compounds leave the plant with the CO2. Reduction in both theplant heat rate and cost may be realized. The pipeline will be classified, however asbeing in sour service and the increase in its cost should be taken into account inassessing the overall impact of incorporating this design option. Acceptability of thesour CO2 by the end user as well as the safety issues should be investigated.
• Establish the availability of petroleum coke or bitumen for blending with the lowerrank coals in order to increase the heating value of the feedstock and thus theperformance and cost. Consumption of petroleum coke in this manner on its ownaccord could benefit the environment since its production is expected to grow whilethe consumption may not be able to keep pace with the possibility of having tostockpile this refinery waste. A study to establish the expected improvement in theperformance and cost of the gasification option is required.
• Establish the market for H2 in order to sell a high value by-product providing arevenue stream to offset some of the cost of capturing the CO2. The incrementalcost of producing the H2 is expected to be small, the costs being associated withpurifying a portion of the fuel gas supplied to the gas turbines in a Pressure SwingAdsorption unit. A study to establish the improvement in the performance and cost isrequired. This study may also include an evaluation of 1) transportation of the coalversus constructing and operating a pipeline to deliver the H2 in case a low rank coalis considered and 2) the synergy of gasifying petroleum coke imported from arefinery while exporting the H2 to the refinery and possibly steam.
• Define the basis for developing the FEED package. This activity would encompassthe selection of the final technology for which the FEED package would bedeveloped. Included in this study would be a comparison of the gasification optionwith the amine option for bituminous and sub-bituminous coals, the data generatedby the current studies being useful for making the comparison of the technologyoptions for lignite.
• Have General Electric perform a detailed aero-thermal analysis of the hot gaspathway of the turbine section of the gas turbine in order to truly assess the derate inthe firing temperature and consequently the overall performance of the gas turbine.
5 Options for CO2 use or storage
As part of its mandate, the CCPC needs to find an ultimate disposal or sink for any CO2captured from a power plant. Accordingly it developed a strategy to evaluate the optionsin each geographical area represented by the different types of fuels. This resulted in anobjective to assess storage options in eastern Canada (bituminous), central Canada(bituminous and sub-bituminous), and western Canada (sub-bituminous and lignite).The following is a summary of that work

CCPC Phase I Final Report
CRI Consulting Page 40
5.1 Western Canada The CCPC awarded a contract to SNC-Lavalin (SLI) to evaluate utilization and storageoptions for CO2 produced by coal fired power plants. Specifically the mandate was asfollows:
• Prepare an inventory of CO2 storage options in Alberta and Saskatchewan
• Evaluate key factors for each options
• Priorize the options based on technical and economic success criteria
• Estimate the total storage capacity for each option
• Provide a brief overview of current CO2 storage projects.
SLI evaluated the following options
• Enhanced Oil Recovery (EOR)
• Enhanced Coal Bed Methane Recovery (ECBM)
• Storage in depleted oil and gas reservoirs
• Storage in deep saline aquifers
• Industrial usage and other potential options.
Modeling was to be done on the basis of the output from a 400 MW coal fired powerplant in Alberta, assuming capture of 90% of the CO2. Such a project would have flowsof approximately 2.6 million tonnes per year or a 30 year life storage requirement of 78million tonnes.
Enhanced Oil Recovery
Enhanced Oil Recovery involves the injection of a relatively pure CO2 stream at elevatedpressure into a producing oil field. Under a “miscible” EOR scheme the CO2 dissolvesinto the oil, which both reduces the oil’s viscosity and displaces the oil, increasing oil flowto the producing wells. Significant amounts of CO2 are produced along with the oil andmust be separated from the oil and associated hydrocarbon gas before re-injection intothe reservoir. Figure 5.1 illustrates the process in a highly simplified flow diagram.
SLI reports that EOR is the most advanced and best proven technology for storage orutilization of CO2. EOR projects have been reported in five countries, and total oilproduction from EOR is estimated at about 32,400 m3/d from 76 projects. However, anEOR project designed to store the CO2 from a 400 MW power plant would rank amongthe largest EOR operation in the world. SLI also proposed that an EOR project had thebest chance to offset some of the costs of capturing CO2.

CCPC Phase I Final Report
CRI Consulting Page 41
Figure 5.1. Process Schematic of Enhanced Oil Recovery
SLI worked together with Vikor Energy Inc. to analyze reservoirs and pools for storage.Based on the design CO2 flow rates, they selected the oil pools required to store theCO2, and developed projected rates for oil, gas, and water and recycle CO2, as well asthe wells and the distribution and gathering systems required in the field. In addition,they developed the requirements for delivery of the CO2 to a central hub, processing thehydrocarbon rich production gas, separation of the gas and CO2, and compression of theCO2 for re-injection. Pan Canadian’s Weyburn project consumes about 60% of theannual rates used for this study.
Pools were selected through a screening process that, among other things, includes anassessment of miscibility criteria – the ability of the CO2 to dissolve in the oil. Immisciblefloods have been operated, but the recovery and economics have generally been muchpoorer.
Six pools (modeled in the Swan Hills area) were required to store the design rates ofCO2 over the 30 year project life. Selected key data is summarized below:
• Total CO2 stored was 81 million tonnes
• Total CO2 injected, including recycle was 212 million tonnes
• Oil production was 284 million barrels
• Total gas produced was 530 BCF
• Total Water production was 750,000 e3m3
• Total capital costs were estimated to be in the order of $900 million over theproject life.
• The CO2 was assumed to be sold at $38/tonne, resulting in and EOR projectNPV of $57 million, with oil and gas revenues.
SLI determined that there could be in the order of 5-6 viable EOR projects in Alberta withsufficient capacity to store the CO2 output from a commercial scale power plant over
PrimarySeparation
Gas processing Dehydration Liquids recovery Booster compression Gas separation CO2 recompression
HydrocarbonProducts
Production fromReservoir
CO2 fromPower Plant
Recycle CO2
Crude oil
Water for re-injectionor disposal
Gas stream toplant
CO2 injection

CCPC Phase I Final Report
CRI Consulting Page 42
thirty years, and offer potential significantly offset capture costs. Opportunities inSaskatchewan are much more limited, and SLI’s assessment is that only one projectwould be viable.
SLI determined that issues include miscibility, safety and public awareness. Impurities inthe CO2 include nitrogen, oxygen, CO and H2S, and could all have an impact onmiscibility and therefore on oil production. Further, together with the CO2 itself, theycould present safety and corrosion concerns.
Enhanced Coal Bed Methane RecoveryECBM involves the injection of CO2 at elevated pressure into a coal seam. Coal seamscontain sorbed methane gas, and the injected CO2 will tend to sorb preferentially ontothe coal, releasing the methane, and allowing it to flow to the projection wells (the word“sorb” is used by SLI because it is not well understood whether the methane is absorbedor adsorbed). A benchmark value for CO2 sorption to the coal over methane is 2:1, butsome studies indicate it can be as high as 10:1 or more. Water is normally producedwith the gas, in varying quantity and quality, depending on the coal seam and thelocation. Figure 5.2 provides a simplified illustration of the process.
ECBM is based on the premise that the coal seam is relatively deep, uneconomic tomine, and would not be mined after CO2 injection. Mining of the seam after CO2injection would release the stored CO2 and yield a negative CO2 life cycle debit.
Figure 5.2. Process Schematic of Enhanced Coalbed Methane Recovery
ECBM is a much less mature technology than EOR, with no commercial projects andonly a few pilot demonstrations. SLI worked with Alberta Research Council (ARC) toreview previous studies and publicly available information to select coal reserves thatcould potentially store the CO2 volume that would come from the selected 400 MW plant.The selection was based on the following criteria:
PrimarySeparation
Gas processing Dehydration Liquids recovery Gas separation CO2 recompression Sales gas compression
Sales gas
Production fromCoal Seam
CO2 fromPower Plant
Recycle CO2
Water for re-injectionor disposal
Gas stream toplant
CO2 injection

CCPC Phase I Final Report
CRI Consulting Page 43
• Sufficient coal reserves to sequester the required CO2
• Minimum depth to expect secure geological trapping of the CO2
• Minimum depth to avoid impact on ground water
• Low water saturation
• Reasonable expectation of good permeability, and
• Coal reserve within 150 Km of Edmonton.
The team identified four coal seams:
• Ardley
• Horseshoe Canyon
• Belly River
• Mannville
It is particularly important to note the expectation of good permeability. Permeability iscritical to the success of an ECBM project, and little permeability work has been done onAlberta coal seams. Therefore, there remains a large degree of uncertainty on theassumed values, and therefore on the production rates. Two cases are summarizedbelow in Table 5.1.
SLI chose to model the Ardley case due to significantly lower drilling costs for thesewells, higher initial gas production, less water, and a higher 30 year recovery. Includedin the model were
• CO2 distribution to each well,
• Primary separation in the field and water handling facilities
• Drilling and completion of production, injection and water disposal wells
Table 5.1: Key Production Data Summary
Description Ardley Mannville
Production wells 156 369
Injection wells 132 331
Total gas recovered, BCF 310 722
Initial flow per well, MCF/d 280 250
Peak water flow, m3/d 700 6,000
CO2 absorption ration 4.7 2.1
Gas recovery, BCF/section 2.0 2.0
Thirty year recovery, % 47 30

CCPC Phase I Final Report
CRI Consulting Page 44
• High pressure CO2 supply pipeline
• Dehydration and compression
• Membrane separation of produced gas and CO2
• CO2 compression for recycle
• High pressure sales gas pipeline
Total capital costs were estimated to be in the order of $ 170 million over the project life.SLI’s analysis demonstrated that the breakeven cost for CO2 is about $10/tonne, basedon assumptions of $9/MCF for production gas,
SLI concluded that although technically feasible, and although there appear to be nopractical constraints to the CO2 storage capacity, there is little probability for acommercial ECBM project in Alberta without significant CBM development anddemonstrations. ECBM could present an opportunity to offset CO2 capture cost withpotential revenue over the life of the project in the order of $1.2 billion. However, theuncertainties around permeability, gas content, and CO2 absorption ratios remainpotential stumbling blocks for an ECBM Project, and will need to be resolved before anysuch project can proceed. Thus, they recommend pilot demonstrations.
Storage in Depleted Oil and Gas Reservoirs, and Deep Saline Aquifers (GeologicalStorage)SLI evaluated the technical and economic feasibility of storing CO2, either in depleted oiland gas reservoirs or in deep saline aquifers. Their conclusions included the following:
• There are no technical obstacles to geological storage, and storage of CO2 indepleted oil and gas wells is already being carried out in Alberta as an adjunct toacid gas injection and storage. Total current CO2 injection is estimated at300,000 tonnes per year. Although technically feasible, CO2 storage in aquifersis much less developed with the only large scale demonstrations underway atStatOil’s on-going Saline Aquifer CO2 Storage project in the North Sea.
• There would be no revenue streams from this storage to offset capture andtransportation costs.
• Perceived concerns regarding CO2 storage in aquifers could mobilize publicresistance to this option.
• Disposal charges of about $4/tonne of CO2 would probably be required to make aproject economic for a storage operator.
• The total project capital for one 400 MW plant could be in the order of $45million.
• Practical overall storage capacity available in depleted oil and gas reservoirs is inthe order of 3,500 million tonnes in Alberta, and 200 million tonnes inSaskatchewan – 45 and three commercial power plants respectively.
• There should be no practical limitation to storage in saline aquifers

CCPC Phase I Final Report
CRI Consulting Page 45
• Of significance is that CO2 purity is not a significant issue for geological storage.
Other Options SLI also reviewed the following options for utilization or storage of CO2. SLI concludedthat none of the options were viable, principally based on the volumes involved and thetimeframe considered. The options fell into one of the following categories:
• Sufficient capacity but high technical risk
• Low risk and potentially economically attractive, but very low ultimate capacity
Ocean StorageOcean storage had enormous capacity. Proponents of the technology argue thatsince the ocean already contains large amounts of CO2, and since CO2 in the airis naturally transferred to the oceans, ocean disposal is simply speeding up anatural process.
However, the only demonstration project that has been proposed (by the USDOE in Hawaii) was subject to large environmental protests. Due to theseenvironmental concerns and the technical issues of delivering CO2 more than3000 meters below the surface, there is little probability of such a project meetingwith success.
SLI notes as well that disposal for a western Canadian project would alsointroduce the challenges of delivering CO2 from the interior to a storage site,therefore limiting this option to east of west coast projects. Environmental andpublic acceptance concerns will likely have significant negative impact as well.
Mineral CarbonizationSLI did not consider that mineral carbonization would contribute significantly tothe CO2 storage capacity requirements for at least the short term. Whileintriguing and theoretically possible, the time frame required to resolve the solidshandling issues exceeds considerably the requirements for any CCPCdemonstration project or short or mid term projects.
Industrial Applications SLI reviewed a number of industrial applications including:
• Food and beverage production
• Fertilizer manufacture
• Industrial and welding gases
• Soda ash manufacture
• Water treatment and pulp and paper applications
• Plastics manufacture

CCPC Phase I Final Report
CRI Consulting Page 46
• Fire fighting applications
One attractive feature of some of the above applications is that while they mayrequire higher purity than would normally be produced by a power plant for anEOR project, it appears that the CO2 for these applications can command apremium price. However, the amount of CO2 produced worldwide for the aboveapplications totals about 4,000 tonnes per day, or just over half the amount fromone 400 MW power plant. Therefore most of the uses would be “niche”applications, and would be location specific. Notwithstanding this, it would beworthwhile for CCPC to evaluate if there are any opportunities for such a“premium CO2” product in the vicinity of any demonstration.
5.2 Ontario
The CCPC Technical Committee had intended to include an assessment of storageoptions in Ontario in its work, and had budgeted accordingly. It was intended that thiswork might be carried out by the University of Waterloo. However, the CCPC neversucceeded in agreeing on a mutually agreeable scope of work with the UW, and was notable to secure sufficient funding. Thus, no work took place to evaluate options forOntario, and this summary has nothing to report.
5.3 Nova Scotia
The Geological Survey of Canada was to evaluate the potential of the Nova Scotia coaldeposits for sequestering CO2 and producing coal-bed methane. In particular this workwas to evaluate the Cumberland, Pictou and Sidney coalfields. It was scheduled forcompletion in May 2003. However, as of this writing, that report is incomplete, and theresults are not included in this report
6 Conclusions
After their review of the various reports summarized in this report, the CCPC TechnicalCommittee adopted the following set of conclusions. The future direction that the CCPCand the electricity industry might take to address these or any other findings of thePhase 1 work packages are being addressed in a forum outside of this report.
The CCPC initiated Phase I of the project in 2001 to develop the next generation of coalpower technology, leading to one or more demonstration projects. During Phase I, coal-fired power generation technology options that could control all emissions, includingCO2, were assessed. A number of detailed engineering design studies showed that:
• Technology is commercially available to control conventional air emissions (NOX,SOX, particulates, mercury) from Rankine cycle power plants to levels approachingthat of natural gas power generation.

CCPC Phase I Final Report
CRI Consulting Page 47
• Among the CO2 capture technology options studied, gasification with Alberta sub-bituminous coal provide the lowest cost of electricity. Further improvements in costmay be expected with a fully optimized gasification process for low rank coals.
• However, costs of these technologies are currently high and further work wasidentified as being required to optimize the designs and to develop the newtechnology required to prepare a good business case for proceeding to thedemonstration project.
Specifically, the studies also showed:
• Gasification processes for sub-bituminous coal and lignite are not yet fullycommercial, and require significant development to attain the required availabilitylevels.
• Recent developments of the Econamine amine scrubbing process have achievedsubstantial improvements in energy efficiency. Further refinements are possible andneed to be compared with other processes to optimize the process selection.
• CO2/O2 combustion appears to have limited attraction as a retrofit or new planttechnology due to high capital costs and low net efficiency.
Phase I was aimed at evaluating broad technology options and was not able to provideoptimum designs for the three technology choices.