canada leads the global cannabis paradigm shiftfishn.ca/invest/58341.pdf · resources to invest in...
TRANSCRIPT

May 2018
This report was prepared by an analyst(s) employed by BMO Nesbitt Burns Inc., and who is (are) not registered as a research analyst(s) under FINRA rules. For disclosure statements, including Analyst’s Certification, please refer to pages 50 to 53. 16:00 ET~
This report is intended for Canadian & EU distribution only. Unauthorized reproduction, transmission orpublication without the prior written consent of BMO Capital Markets is strictly prohibited.
Tamy Chen, CFACannabis Analyst BMO Nesbitt Burns Inc.(416) [email protected]
Peter Sklar, CPA, CARetailing/Consumer Analyst BMO Nesbitt Burns Inc.(416) [email protected]
Initiating Aphria and Canopy at Outperform
Canada Leads the Global Cannabis Paradigm Shift

Table of Contents
Initiating BMO Cannabis Coverage ................................................................................................................... 2
Executive Summary .......................................................................................................................................... 4
Legal Environment Favours Canadian LPs ........................................................................................................ 6
Initial Recreational Market Outlook ................................................................................................................. 7
Current Medical Market in Canada: Opaque .................................................................................................. 13
Near-Term International Medical Opportunity: Germany ............................................................................. 15
Long-Term Industry Outlook ........................................................................................................................... 16
Company Snapshot: Our Current Coverage Universe ..................................................................................... 24
Company Coverage: Aphria ............................................................................................................................ 25
Company Coverage: Canopy ........................................................................................................................... 35
Comparable Companies - Cannabis ................................................................................................................ 46
Comparable Companies – Alcohol & Tobacco ................................................................................................ 47
Glossary ........................................................................................................................................................... 48
Cannabis | Page 1 May 28, 2018This
repo
rt is
inte
nded
for C
anad
ian
& EU
dis
tribu
tion
only
. Una
utho
rized
repr
oduc
tion,
tran
smis
sion
or p
ublic
atio
n w
ithou
t the
prio
r writ
ten
cons
ent o
f BM
O Ca
pita
l Mar
kets
is s
trict
ly p
rohi
bite
d.

Initiating BMO Cannabis Coverage
Aphria: We are initiating coverage of Aphria (APH-TSX) with an Outperform rating.
First Mover Advantage: We believe Aphria will be one of the few licensed producers (LPs) with sufficient
product to supply the initial recreational demand and we believe such a “first mover” advantage should
enable the company to quickly capture significant share and generate attractive unit economics in an
undersupplied market.
Leading Low-Cost Producer: We believe Aphria could emerge as a leading low-cost cannabis producer
given the significant commercial-scale greenhouse cultivation expertise held by the management team,
and the infrastructure and greenhouse culture that is inherent in the Leamington, Ontario community.
Scale Is Critical to Long-Term Growth: We believe Aphria’s scale will facilitate meaningful investment in
long-term growth opportunities such as brand development, value-add format manufacturing, the
gradual legalization of international medical markets, and advanced pharmaceutical applications.
Valuation: Our target price of $17 is based on a projected enterprise value that is about 17x our Base
Case fiscal 2020 EBITDA estimate. We note that our Base Case fiscal 2020 EBITDA estimate assumes that
Aphria’s facility expansions are only at 65% of full ramp potential versus management’s expectation
that the facilities will be close to 100% ramp by that time. If these facilities were to reach full ramp by
fiscal 2020 and Aphria experiences firmer selling prices, our implied target multiple would be in the
high-single-digit range. See Aphria company section for details.
Canopy: We are initiating coverage of Canopy (WEED-TSX) with an Outperform rating.
First Mover Advantage: We believe Canopy will be one of the few LPs with sufficient product to supply
the initial recreational demand and we believe such a “first mover” advantage should enable the
company to quickly capture significant share and generate attractive unit economics in an undersupplied
market.
Head Start in International: We consider the company’s current international operations to be more
advanced versus most other players, and Canopy appears to be laying the groundwork in markets where
medical is not yet legalized, but may soon be. The approach to develop cultivation in “hub” regions like
Denmark for export to Germany and eventually Australia for export to the Asia-Pacific region provides
the company longer-term access to these markets.
Long-Term Global Branded Leader: Canopy could emerge as a leader over the long term given that the
company’s scale will facilitate meaningful investment in long-term growth opportunities such as brand
development, value-add format manufacturing, the gradual legalization of international medical
markets, and advanced pharmaceutical applications. We believe Canopy’s strategic alliance with
Constellation Brands (STZ-NYSE; US$216.81; Outperform rated by Amit Sharma, BMO Capital Markets
Corp.) could prove to be a significant advantage as the industry evolves into value-add formats, and
particularly, into cannabis-infused beverages.
Valuation: Our target price of $45 is based on a projected enterprise value that is about 20x our Base
Case fiscal 2020 EBITDA estimate. Our target multiple reflects our view that Canopy has a relative head
start in brand development and international expansion, and could emerge as a leading global-branded
company in the long term. We note that our Base Case fiscal 2020 EBITDA estimate assumes that
Canopy’s facility expansions are only at 65% of full ramp potential versus management’s expectation
that the facilities will be close to 100% ramp by that time. If these facilities were to reach full ramp by
fiscal 2020 and Canopy experiences firmer selling prices, our implied target multiple would be 11x. See
Canopy company section for details.
Cannabis | Page 2 May 28, 2018This
repo
rt is
inte
nded
for C
anad
ian
& EU
dis
tribu
tion
only
. Una
utho
rized
repr
oduc
tion,
tran
smis
sion
or p
ublic
atio
n w
ithou
t the
prio
r writ
ten
cons
ent o
f BM
O Ca
pita
l Mar
kets
is s
trict
ly p
rohi
bite
d.

Relative Positioning
• Potential to gain “first
mover” advantage in
initial recreational
market
• Scale should facilitate
meaningful investment
in long-term
opportunities
• Could emerge as a large,
branded player
• Strategic alliance with
Constellation Brands could prove
to be a significant advantage as
the industry evolves into value-
add formats
• Current international operations
appear more advanced versus
other LPs; strategy to develop
cultivation hubs abroad for
international export could
provide longer-term market
access
• Could emerge as a leading low-
cost contract cultivator
• Continues to establish strategic
relationships in international
markets, but appears slightly
behind compared to Canopy
• Supply agreement with
Shoppers Drug Mart broadens
medical distribution reach
• Pressure on the stock following
controversy with Nuuvera
acquisition, resulting in lower
valuation vs. other LPs and
provides better return
opportunity
Source: BMO Capital Markets.
Canopy Growth Aphria
Cannabis | Page 3 May 28, 2018This
repo
rt is
inte
nded
for C
anad
ian
& EU
dis
tribu
tion
only
. Una
utho
rized
repr
oduc
tion,
tran
smis
sion
or p
ublic
atio
n w
ithou
t the
prio
r writ
ten
cons
ent o
f BM
O Ca
pita
l Mar
kets
is s
trict
ly p
rohi
bite
d.

Executive Summary
Near-Term Outlook
First Mover Advantage for Larger LPs: Initially, demand/supply dynamics will favour the larger
LPs. Anticipated demand from the initial recreational market in Canada is expected to
considerably exceed industry production as only a handful of the larger LPs will have sufficient
cannabis output at that time to meaningfully fill the distribution channels. As a result, this “first
mover” advantage should enable the larger LPs to benefit from the favourable pricing
dynamics expected in an initially undersupplied market. See Exhibit 3.
In addition, this “first mover” advantage should enable the larger LPs to initially dominate
retail shelf space in the recreational market, which would provide a head start for brand
development.
Value-Add Formats Will Mitigate Dried Flower Price Compression: We anticipate in year two of
our forecast that supply will begin to catch up to demand, which will result in some pricing
pressure on dried flower. However, our Base Case projections anticipate that in year two,
federal regulators will begin legalizing value-add product formats, which should carry much
higher pricing on a grams-equivalent basis and mitigate the pricing pressure that arises in
dried flower (see Exhibits 3 and 4).
Our Base Case forecast assumes that the industry growth rate for medical patient acquisition
slows when the recreational market is legalized. Some existing medical patients, and potential
future patients, could prefer the recreational market when legalized. However, this may be
more than offset if more employers begin to include medicinal cannabis under insurance
coverage plans.
Near-Term International Opportunity Favours Larger LPs: For the international export
opportunity, we expect that only a handful of the larger LPs will be able to secure the licensing
and certification requirements, and develop the necessary distribution infrastructure in those
regions.
Longer-Term Outlook
Supply Catches Up in Year Two of Recreational Legalization: We project that dried flower supply
will begin to catch up with demand in year two, and potentially exceed demand in the third or
fourth year following recreational legalization in Canada.
It is not clear if this projected supply/demand imbalance will weigh on the cannabis prices
realized by the LPs as there will be the opportunity to export increasing volumes of medical
cannabis to international markets, and the introduction of additional value-add product formats
should provide higher pricing to compensate for price compression in dried flower.
Evolution Into Either Branded Players or Low-Cost Cultivators: As dried flower prices continue to
settle, we believe the Canadian market will rationalize into a handful of larger, branded
players and a handful of low-cost contract cultivators. Beyond the branded companies and low-
cost contract growers, it is not clear to us how the many other LPs, outside of niche brands,
will survive under this pricing environment.
Cannabis | Page 4 May 28, 2018This
repo
rt is
inte
nded
for C
anad
ian
& EU
dis
tribu
tion
only
. Una
utho
rized
repr
oduc
tion,
tran
smis
sion
or p
ublic
atio
n w
ithou
t the
prio
r writ
ten
cons
ent o
f BM
O Ca
pita
l Mar
kets
is s
trict
ly p
rohi
bite
d.

Near-Term International Export Opportunity Is Temporary: We believe the current international
opportunity for Canadian LPs, which is the ability to export products into other markets at
favourable economics, will prove to be transitory. As a result, we believe the long-term global
opportunity for Canadian LPs is developing intellectual property and brands.
Long-Term Medical Market Opportunity in Pharmaceutical Applications: We believe the
distribution model for medical cannabis in Canada will eventually expand beyond the current
channel of direct-to-patient. In addition, we consider that Canadian LPs could eventually be in
a position to make efficacy claims that are supported by clinical trials. At that point, medical
cannabis could qualify for a Drug Identification Number, which we believe would be a
significant catalyst to accelerate growth of the medical market.
Scale Is Critical to Long-Term Growth: Over the long term, we anticipate that only a handful of
LPs will be attributed a premium valuation. These long-term industry leaders will be those that
capture sizable shares of the near-term recreational market, and possess the scale and
resources to invest in the long-term opportunities such as brand development, value-add
format manufacturing, the gradual legalization of international medical markets, and advanced
pharmaceutical applications.
It is also possible that these LPs could ultimately be acquired by large CPG players in the
beverage and tobacco industries or pharmaceutical companies given the potential disruption
cannabis-infused products could present.
The Blue Sky Scenario Beyond Our Forecasts: An additional long-term upside would be if other
jurisdictions consider recreational legalization, and we understand that Malta is currently
drafting legislation to legalize recreational use. If Malta establishes and implements a
framework legalizing the recreational market, we believe this could set a precedent that
encourages potential recreational legalization in other European countries. Under such a
scenario, Canadian LPs would have to establish cultivation in those markets in order to
participate as UN treaties prevent international trade of cannabis for non-medical purposes.
Cannabis | Page 5 May 28, 2018This
repo
rt is
inte
nded
for C
anad
ian
& EU
dis
tribu
tion
only
. Una
utho
rized
repr
oduc
tion,
tran
smis
sion
or p
ublic
atio
n w
ithou
t the
prio
r writ
ten
cons
ent o
f BM
O Ca
pita
l Mar
kets
is s
trict
ly p
rohi
bite
d.
Legal Environment Favours Canadian LPs
In Canada, medical cannabis was legalized in 2001, following court decisions, with the Marihuana
Medical Access Regulations (MMAR). Under this framework, approved individuals could grow cannabis or
appoint a designated person to grow for them. The MMAR framework was replaced by the Marihuana
for Medical Purposes Regulation (MMPR), which only permitted Health Canada approved commercial
licensed producers (LPs) to grow cannabis. Following a court ruling in 2016, the MMPR was replaced by
the Access to Cannabis for Medical Purposes Regulation (ACMPR), which is the current regulation
governing Canada’s medical market. The ACMPR framework allows patients to either purchase medical
cannabis from LPs or grow a limited amount on their own.
Following the election of the Trudeau government in 2015 and the report of the McLellan Task Force on
Legalization in December 2016, Bill C-45 was drafted as the proposed regulatory framework to legalize
recreational cannabis. On June 7, 2018, the Senate is scheduled to hold a final vote on Bill C-45.
However, there are a number of issues that could delay legalization. Provincial governments will receive
a period of eight to twelve weeks following the effective date of Bill C-45 in order to secure supply and
establish retail locations. In addition, some members of the Senate are recommending the federal
government delay Bill C-45 for up to a year to address concerns related to Indigenous communities,
although Prime Minister Trudeau has indicated that there will be no delay. We believe it is unlikely that
the recreational market will be legalized before the fall.
In the U.S., cannabis is considered by the federal government as a Schedule 1 narcotic, although several
states have legalized medical and recreational use. This federal-state conflict exists, in part, as a result
of the Ogden and Cole memoranda issued by the U.S. Department of Justice during the Obama
administration that deprioritized enforcement of the U.S. federal cannabis prohibition in certain
instances. These memoranda were rescinded pursuant to a memorandum issued by Attorney General
Jeff Sessions on January 4, 2018. As a result of the federal status of cannabis, U.S. cannabis companies in
legalized states are unable to supply international markets.
The international flow of cannabis, which is considered a controlled substance, is governed by three
United Nations treaties, and only permitted for medical purposes by countries with a legal federal
framework. Several countries have legalized medical cannabis, including Germany, Denmark,
Netherlands, Italy, and Australia, and more countries are expected to progress towards medical
legalization over the next several years. However, we note that Canada is the only developed country
with a comprehensive regulatory framework, permitting both medical consumption and domestic
cultivation. The lack of domestic production in many countries with legalized medical use has created
the opportunity for Canadian LPs to supply international markets.
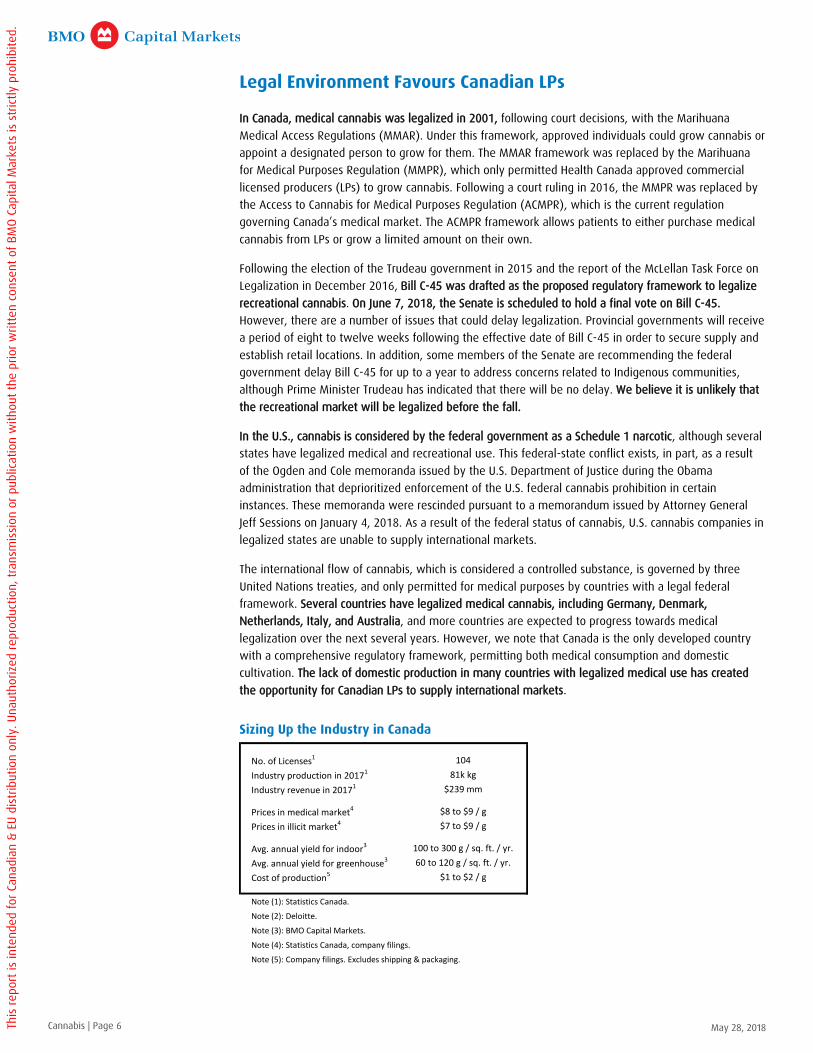
Sizing Up the Industry in Canada
No. of Licenses1 104
Industry production in 20171 81k kg
Industry revenue in 20171 $239 mm
Prices in medical market4 $8 to $9 / g
Prices in illicit market4 $7 to $9 / g
Avg. annual yield for indoor3 100 to 300 g / sq. ft. / yr.
Avg. annual yield for greenhouse3 60 to 120 g / sq. ft. / yr.
Cost of production5 $1 to $2 / g
Note (1): Statistics Canada.
Note (2): Deloitte.
Note (3): BMO Capital Markets.
Note (4): Statistics Canada, company filings.
Note (5): Company filings. Excludes shipping & packaging.
Cannabis | Page 6 May 28, 2018This
repo
rt is
inte
nded
for C
anad
ian
& EU
dis
tribu
tion
only
. Una
utho
rized
repr
oduc
tion,
tran
smis
sion
or p
ublic
atio
n w
ithou
t the
prio
r writ
ten
cons
ent o
f BM
O Ca
pita
l Mar
kets
is s
trict
ly p
rohi
bite
d.
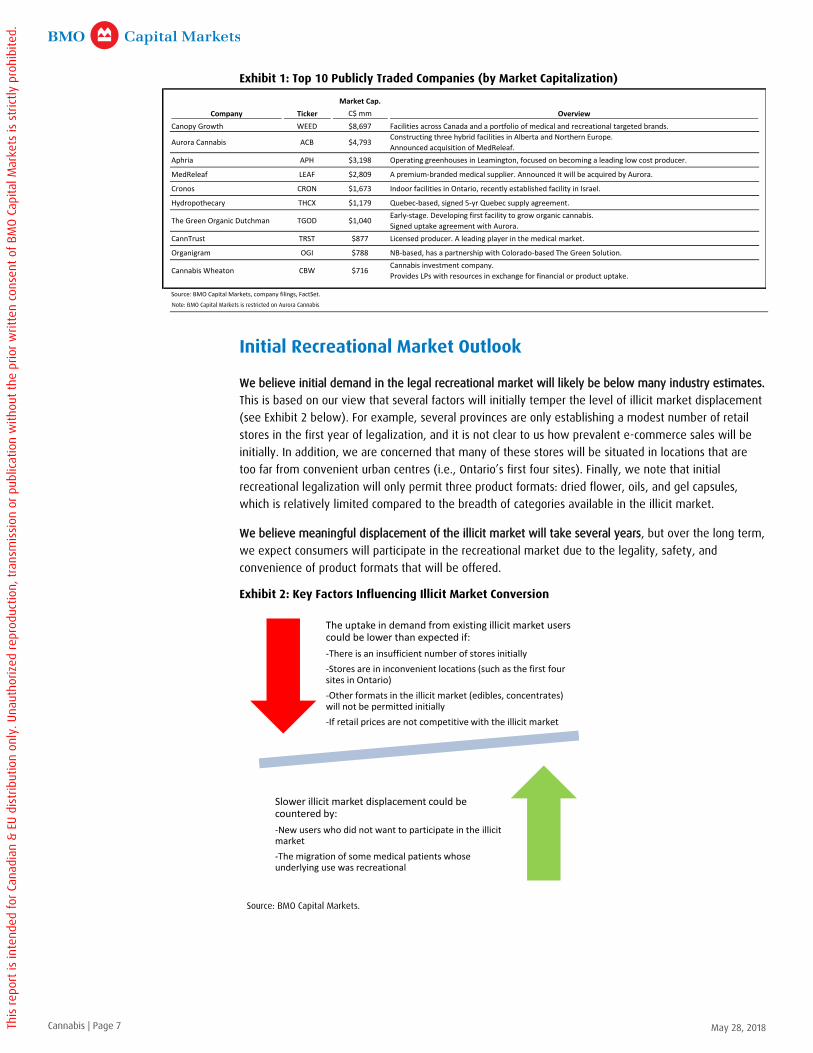
Exhibit 1: Top 10 Publicly Traded Companies (by Market Capitalization)
Note: BMO Capital Markets is restricted on Aurora Cannabis
Initial Recreational Market Outlook
We believe initial demand in the legal recreational market will likely be below many industry estimates.
This is based on our view that several factors will initially temper the level of illicit market displacement
(see Exhibit 2 below). For example, several provinces are only establishing a modest number of retail
stores in the first year of legalization, and it is not clear to us how prevalent e-commerce sales will be
initially. In addition, we are concerned that many of these stores will be situated in locations that are
too far from convenient urban centres (i.e., Ontario’s first four sites). Finally, we note that initial
recreational legalization will only permit three product formats: dried flower, oils, and gel capsules,
which is relatively limited compared to the breadth of categories available in the illicit market.
We believe meaningful displacement of the illicit market will take several years, but over the long term,
we expect consumers will participate in the recreational market due to the legality, safety, and
convenience of product formats that will be offered.
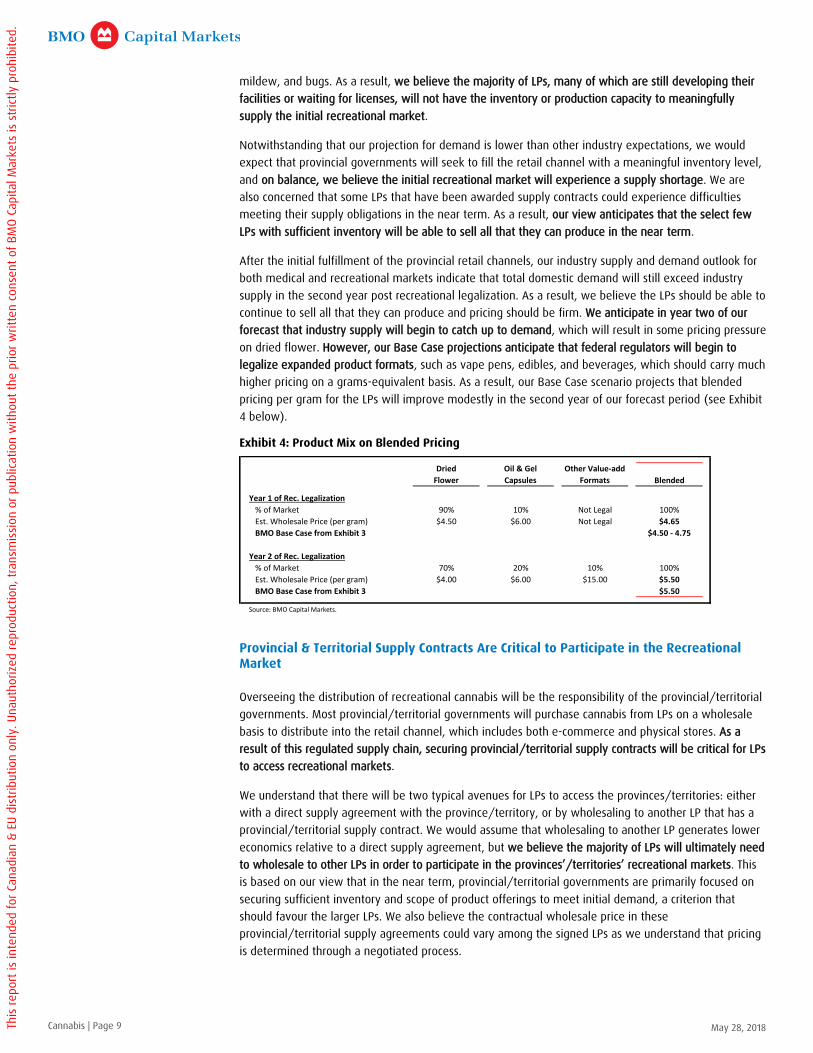
Exhibit 2: Key Factors Influencing Illicit Market Conversion
Source: BMO Capital Markets.
Company Ticker
Market Cap.
C$ mm Overview
Canopy Growth WEED $8,697 Facilities across Canada and a portfolio of medical and recreational targeted brands.
Aurora Cannabis ACB $4,793Constructing three hybrid facilities in Alberta and Northern Europe.
Announced acquisition of MedReleaf.
Aphria APH $3,198 Operating greenhouses in Leamington, focused on becoming a leading low cost producer.
MedReleaf LEAF $2,809 A premium-branded medical supplier. Announced it will be acquired by Aurora.
Cronos CRON $1,673 Indoor facilities in Ontario, recently established facility in Israel.
Hydropothecary THCX $1,179 Quebec-based, signed 5-yr Quebec supply agreement.
The Green Organic Dutchman TGOD $1,040Early-stage. Developing first facility to grow organic cannabis.
Signed uptake agreement with Aurora.
CannTrust TRST $877 Licensed producer. A leading player in the medical market.
Organigram OGI $788 NB-based, has a partnership with Colorado-based The Green Solution.
Cannabis Wheaton CBW $716Cannabis investment company.
Provides LPs with resources in exchange for financial or product uptake.
Source: BMO Capital Markets, company filings, FactSet.
The uptake in demand from existing illicit market users could be lower than expected if:
-There is an insufficient number of stores initially
-Stores are in inconvenient locations (such as the first four sites in Ontario)
-Other formats in the illicit market (edibles, concentrates) will not be permitted initially
-If retail prices are not competitive with the illicit market
Slower illicit market displacement could be countered by:
-New users who did not want to participate in the illicit market
-The migration of some medical patients whose underlying use was recreational
Cannabis | Page 7 May 28, 2018This
repo
rt is
inte
nded
for C
anad
ian
& EU
dis
tribu
tion
only
. Una
utho
rized
repr
oduc
tion,
tran
smis
sion
or p
ublic
atio
n w
ithou
t the
prio
r writ
ten
cons
ent o
f BM
O Ca
pita
l Mar
kets
is s
trict
ly p
rohi
bite
d.

We have developed three forecast scenarios for initial recreational market demand: Base, Upside, and
Downside cases. Our demand forecast is based on detailed assumptions and demographic data
regarding the size of the illicit market by province (as provided by StatsCan). For year one of recreational
legalization, our Base, Upside, and Downside scenarios assume 40%, 50%, and 20% illicit market
displacement to the legal market, respectively. In year two, our Base, Upside, and Downside scenarios
assume 60%, 80%, and 35% illicit market displacement, respectively. We have made assumptions
regarding the frequency of cannabis occasions and typical per-occasion cannabis consumption levels
based on a number of factors, including the type of user (existing illicit market user versus new
participant) and the scenario we are considering (Base, Upside, and Downside). For example, in year
two of recreational legalization, for a user displaced from the illicit market, we are assuming two and a
half occasions per week and one gram per occasion on average. See Exhibit 3 below.
Exhibit 3: BMO’s Forecast of Initial Recreational & Ongoing Medical Demand
Note: BMO Capital Markets is restricted on Aurora Cannabis
Despite Our Conservative Demand Outlook, We Still Expect a Supply Shortage in the Near Term
We note there is significant execution risk across the industry as LPs have never cultivated cannabis on a
mass commercial scale. We understand that all the phases of the cultivation process cannot be initiated
in a new facility at the same time and that there is a natural ramp schedule that will take at least a
number of months before the entire facility is up and running. In addition, based on our recent visits to
most of the larger Canadian LPs’ facilities, we have determined that ramping an indoor or greenhouse
(see Glossary for definitions) cultivation facility is a highly sophisticated process. Areas of complexity
include securing the genetics and appropriate soils and fertilizers, developing a suitable nutrient and
water delivery system, establishing a robust climate (heat, lighting, humidity, carbon dioxide, etc.) to
optimize the plant’s development, and processing the plant materials post-harvest (drying, trimming, oil
extraction). At the same time, these environments are highly susceptible to contamination from mould,
Year 1 of Rec. Legalization Year 2 of Rec. Legalization
Base Upside Downside Base Upside Downside
Medical Market in Canada
# of Patients 325,000 350,000 250,000 375,000 390,000 300,000
Avg. Grams per Patient per yr. 240 240 240 240 240 240
Annual Demand (kg) 78,000 84,000 60,000 90,000 93,600 72,000
vs. Current
# of Patients 269,502
Volume Sold in Apr. to Dec. 2017 (kg) 41,280
Recreational Market in Canada
Est. Illicit Market Users in Canada (mm) 5.6 5.6 5.6 5.6 5.6 5.6
Illicit Market Displacement140% 50% 20% 60% 80% 35%
Est. New Market Participants in Canada (mm) 0.8 1.4 0.3 1.4 2.0 0.8
Total Participants in Legal Market (mm) 3.1 4.2 1.4 4.8 6.5 2.8
Annual Demand (kg)2259,402 477,278 95,456 477,278 749,085 185,247
Vs. Deloitte Forecast (kg) 600,000
Vs. Govt of Canada Forecast (kg) 378,000 to 1,000,000
Total Canadian Demand (kg) 337,402 561,278 155,456 567,278 842,685 257,247
BMO's Production Outlook - Base Case
"Big Three" (kg)3~125,000 ~540,000
We believe the other 100+ LPs will contribute minimal production in year one and a modest amount in year two.
Pricing Scenarios
Oversupply of Dried Flower? No No No No No Yes
More Product Formats Legal? No No No Yes Yes No
New Formats Share of Market Modest Modest None
Flower + Oil Share of Market Majority Majority All
Net Effect on Pricing from Year 1 - - -
Blended Wholesale Price for LPs ($/g)4$4.50 - 4.75 $5.00 $4.00 - 4.40 $5.50 $6.00 $4.00 - 4.40
Source: BMO Capital Markets.
Note (1): The percentage of the illicit market that will transition to the legal market.
Note (2): See section immediately preceding this chart for details regarding usage assumptions for participants.
Note (3): Aphria, Aurora and Canopy. Assumes MedReleaf is acquired by Aurora.
Note (4): See Exhibit 4 following.
Cannabis | Page 8 May 28, 2018This
repo
rt is
inte
nded
for C
anad
ian
& EU
dis
tribu
tion
only
. Una
utho
rized
repr
oduc
tion,
tran
smis
sion
or p
ublic
atio
n w
ithou
t the
prio
r writ
ten
cons
ent o
f BM
O Ca
pita
l Mar
kets
is s
trict
ly p
rohi
bite
d.
mildew, and bugs. As a result, we believe the majority of LPs, many of which are still developing their
facilities or waiting for licenses, will not have the inventory or production capacity to meaningfully
supply the initial recreational market.
Notwithstanding that our projection for demand is lower than other industry expectations, we would
expect that provincial governments will seek to fill the retail channel with a meaningful inventory level,
and on balance, we believe the initial recreational market will experience a supply shortage. We are
also concerned that some LPs that have been awarded supply contracts could experience difficulties
meeting their supply obligations in the near term. As a result, our view anticipates that the select few
LPs with sufficient inventory will be able to sell all that they can produce in the near term.
After the initial fulfillment of the provincial retail channels, our industry supply and demand outlook for
both medical and recreational markets indicate that total domestic demand will still exceed industry
supply in the second year post recreational legalization. As a result, we believe the LPs should be able to
continue to sell all that they can produce and pricing should be firm. We anticipate in year two of our
forecast that industry supply will begin to catch up to demand, which will result in some pricing pressure
on dried flower. However, our Base Case projections anticipate that federal regulators will begin to
legalize expanded product formats, such as vape pens, edibles, and beverages, which should carry much
higher pricing on a grams-equivalent basis. As a result, our Base Case scenario projects that blended
pricing per gram for the LPs will improve modestly in the second year of our forecast period (see Exhibit
4 below).
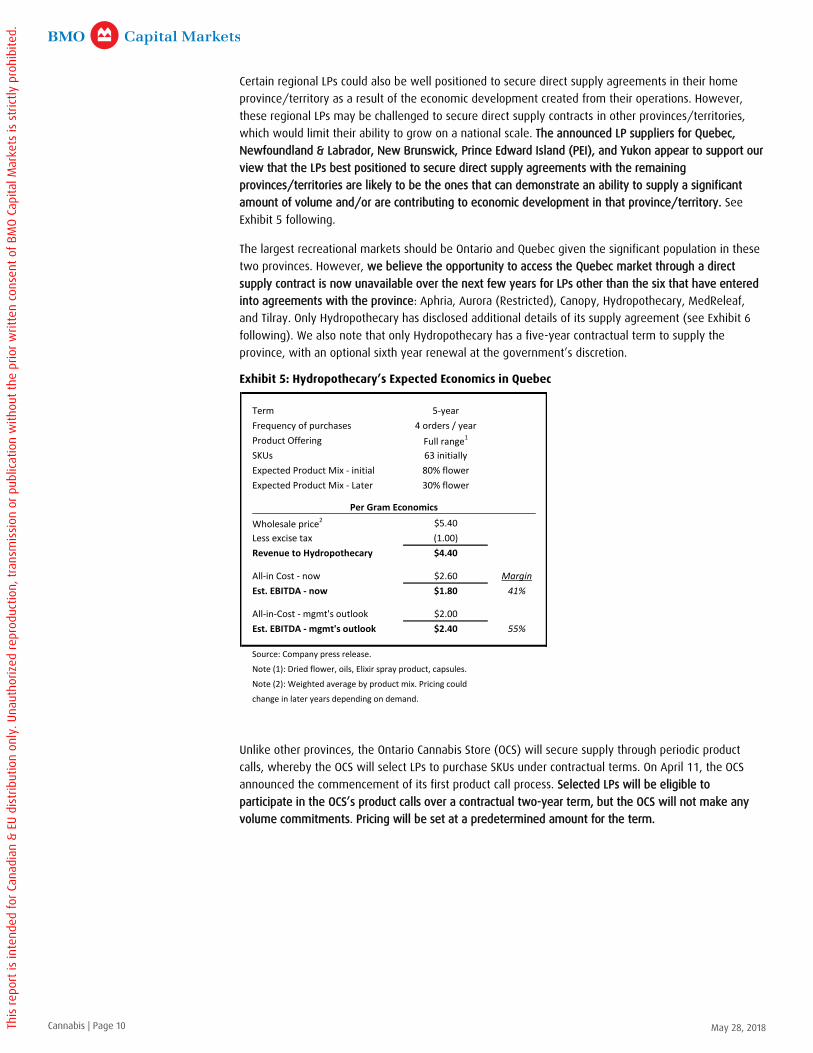
Exhibit 4: Product Mix on Blended Pricing
Provincial & Territorial Supply Contracts Are Critical to Participate in the Recreational Market
Overseeing the distribution of recreational cannabis will be the responsibility of the provincial/territorial
governments. Most provincial/territorial governments will purchase cannabis from LPs on a wholesale
basis to distribute into the retail channel, which includes both e-commerce and physical stores. As a
result of this regulated supply chain, securing provincial/territorial supply contracts will be critical for LPs
to access recreational markets.
We understand that there will be two typical avenues for LPs to access the provinces/territories: either
with a direct supply agreement with the province/territory, or by wholesaling to another LP that has a
provincial/territorial supply contract. We would assume that wholesaling to another LP generates lower
economics relative to a direct supply agreement, but we believe the majority of LPs will ultimately need
to wholesale to other LPs in order to participate in the provinces’/territories’ recreational markets. This
is based on our view that in the near term, provincial/territorial governments are primarily focused on
securing sufficient inventory and scope of product offerings to meet initial demand, a criterion that
should favour the larger LPs. We also believe the contractual wholesale price in these
provincial/territorial supply agreements could vary among the signed LPs as we understand that pricing
is determined through a negotiated process.
Dried
Flower
Oil & Gel
Capsules
Other Value-add
Formats Blended
Year 1 of Rec. Legalization
% of Market 90% 10% Not Legal 100%
Est. Wholesale Price (per gram) $4.50 $6.00 Not Legal $4.65
BMO Base Case from Exhibit 3 $4.50 - 4.75
Year 2 of Rec. Legalization
% of Market 70% 20% 10% 100%
Est. Wholesale Price (per gram) $4.00 $6.00 $15.00 $5.50
BMO Base Case from Exhibit 3 $5.50
Source: BMO Capital Markets.
Cannabis | Page 9 May 28, 2018This
repo
rt is
inte
nded
for C
anad
ian
& EU
dis
tribu
tion
only
. Una
utho
rized
repr
oduc
tion,
tran
smis
sion
or p
ublic
atio
n w
ithou
t the
prio
r writ
ten
cons
ent o
f BM
O Ca
pita
l Mar
kets
is s
trict
ly p
rohi
bite
d.
Certain regional LPs could also be well positioned to secure direct supply agreements in their home
province/territory as a result of the economic development created from their operations. However,
these regional LPs may be challenged to secure direct supply contracts in other provinces/territories,
which would limit their ability to grow on a national scale. The announced LP suppliers for Quebec,
Newfoundland & Labrador, New Brunswick, Prince Edward Island (PEI), and Yukon appear to support our
view that the LPs best positioned to secure direct supply agreements with the remaining
provinces/territories are likely to be the ones that can demonstrate an ability to supply a significant
amount of volume and/or are contributing to economic development in that province/territory. See
Exhibit 5 following.
The largest recreational markets should be Ontario and Quebec given the significant population in these
two provinces. However, we believe the opportunity to access the Quebec market through a direct
supply contract is now unavailable over the next few years for LPs other than the six that have entered
into agreements with the province: Aphria, Aurora (Restricted), Canopy, Hydropothecary, MedReleaf,
and Tilray. Only Hydropothecary has disclosed additional details of its supply agreement (see Exhibit 6
following). We also note that only Hydropothecary has a five-year contractual term to supply the
province, with an optional sixth year renewal at the government’s discretion.
Exhibit 5: Hydropothecary’s Expected Economics in Quebec
Unlike other provinces, the Ontario Cannabis Store (OCS) will secure supply through periodic product
calls, whereby the OCS will select LPs to purchase SKUs under contractual terms. On April 11, the OCS
announced the commencement of its first product call process. Selected LPs will be eligible to
participate in the OCS’s product calls over a contractual two-year term, but the OCS will not make any
volume commitments. Pricing will be set at a predetermined amount for the term.
Term 5-year
Frequency of purchases 4 orders / year
Product Offering Full range1
SKUs 63 initially
Expected Product Mix - initial 80% flower
Expected Product Mix - Later 30% flower
Per Gram Economics
Wholesale price2 $5.40
Less excise tax (1.00)
Revenue to Hydropothecary $4.40
All-in Cost - now $2.60 Margin
Est. EBITDA - now $1.80 41%
All-in-Cost - mgmt's outlook $2.00
Est. EBITDA - mgmt's outlook $2.40 55%
Source: Company press release.
Note (1): Dried flower, oils, Elixir spray product, capsules.
Note (2): Weighted average by product mix. Pricing could
change in later years depending on demand.
Cannabis | Page 10 May 28, 2018This
repo
rt is
inte
nded
for C
anad
ian
& EU
dis
tribu
tion
only
. Una
utho
rized
repr
oduc
tion,
tran
smis
sion
or p
ublic
atio
n w
ithou
t the
prio
r writ
ten
cons
ent o
f BM
O Ca
pita
l Mar
kets
is s
trict
ly p
rohi
bite
d.

Exhibit 6: Supply Chain for Recreational Market by Province/Territory
Source: Government websites. Note: BMO Capital Markets is restricted on Aurora Cannabis
Distribution
Announced Suppliers
Retail
Online
Stores
New Brunswick Nova Scotia PEI Yukon North West Nunavut
Govt (NB Liquor) Govt (NSLC) Govt (PEI LCC) Govt. Govt. Only NWTLC. No info yet.
Aphria, Canopy,
Hydropothecary,
Organigram (NB-based),
Zenabis (NB-based)
None announced
Canada's Island Garden
(PEI-based), Canopy,
Organigram
Canopy, Tilray None announced None announced
Govt. Govt. Govt. Govt. Govt. Will have online platform.
Govt. All 20 initial
locations have been
announced.
Govt. Allow co-location
with alcohol. 9 sites in
urban hubs announced.
More stores possible in
future.
Govt. 4 sites only.
At least 1 govt-run
location. May allow
private.
Govt. Initially inside
existing liquor stores.
Stand-alone stores are
possible in the future.
Govt and private. No
physical stores expected
in 2018.
British Columbia Alberta Manitoba Saskatchewan Ontario Quebec Newfoundland
Distribution Govt (BC LDB) Govt (AGLC) Govt (LGA)Private. Regulated by
govt (SLGA).
Govt (OCS) via product
calls.Govt (SAQ)
Private. LPs will sell
directly to stores.
Announced Suppliers None announced None announced None announced None announcedFirst product call
process under way
Aphria, Aurora, Canopy,
Hydropothecary (QC-
based), MedReleaf,
Tilray
Canopy
Retail
Online Govt. Govt. Private. Private.Govt. Partnered with
Shopify.Govt. Govt.
Stores
Govt and private.
Unlimited private
licenses.
Private. 250 licenses
expected in the first
year.
Private.
Private. Licenses issued
lottery-style. Only 51
licenses in 32
municipalities, which can
opt-out (5 have).
Govt. 150 stores by
2020. 40 openings in
2018, 40 in 2019.
Announced first 4
locations.
Govt. Initially 15 stores.Private. Announced 41
licenses.
Cannabis | Page 11 May 28, 2018This
repo
rt is
inte
nded
for C
anad
ian
& EU
dis
tribu
tion
only
. Una
utho
rized
repr
oduc
tion,
tran
smis
sion
or p
ublic
atio
n w
ithou
t the
prio
r writ
ten
cons
ent o
f BM
O Ca
pita
l Mar
kets
is s
trict
ly p
rohi
bite
d.
Read-Throughs From Quebec and Ontario Supply Arrangements
In the near term, we believe the retail price (pre-HST) for dried flower will generally range
between $7 and $9 per gram and the wholesale price to LPs will range between $4 and $5 per
gram.
We believe the provinces will need to make several significant adjustments over the near term
in the quantity and type of products they purchase as they develop a better understanding of
consumer preferences as a result of actual point-of-sale purchases. This presents a risk to LPs if
demand for their product SKUs is materially lower than anticipated.
Who Will Win in the Near Term? Will Branding Help?
Heading into the recreational market, we note that the strategy being adopted by most LPs is to
establish brands through “lifestyle” associations to experiences such as the outdoors, health and
wellness, music, art, or to specific celebrities. There is a view among LPs that branding, particularly if
communicated to consumers before legalization, will create brand recognition and encourage in-store
purchase when the market is legal.
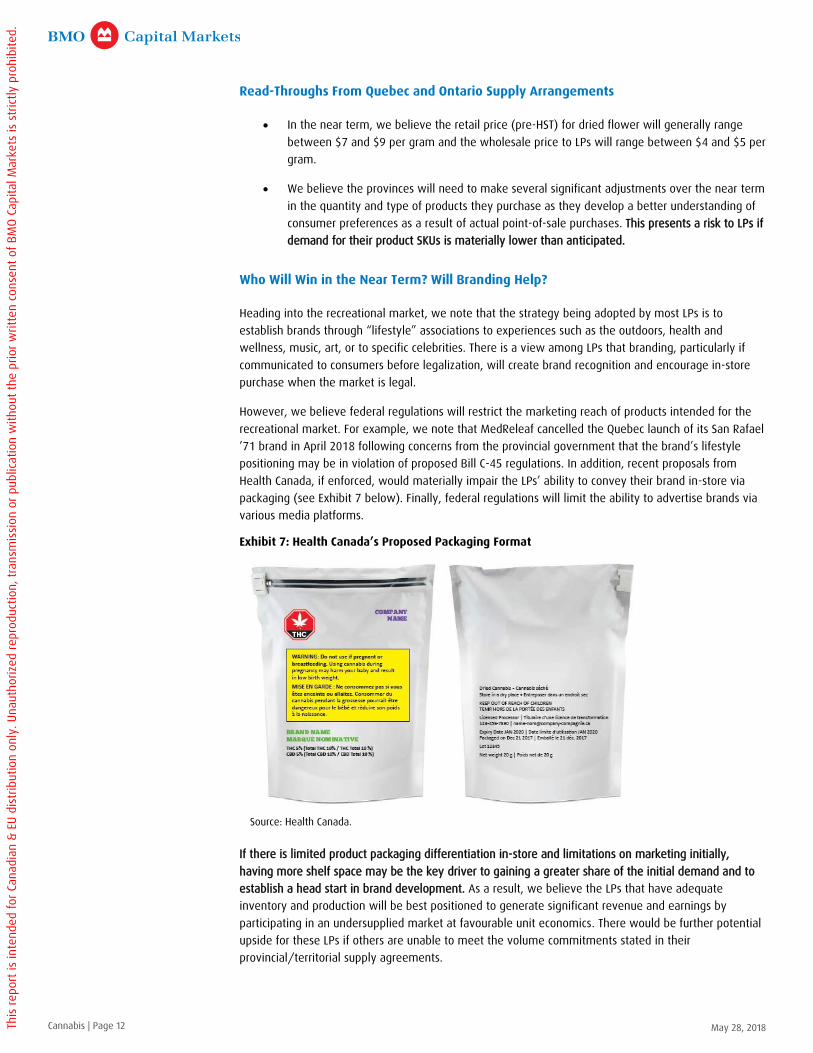
However, we believe federal regulations will restrict the marketing reach of products intended for the
recreational market. For example, we note that MedReleaf cancelled the Quebec launch of its San Rafael
’71 brand in April 2018 following concerns from the provincial government that the brand’s lifestyle
positioning may be in violation of proposed Bill C-45 regulations. In addition, recent proposals from
Health Canada, if enforced, would materially impair the LPs’ ability to convey their brand in-store via
packaging (see Exhibit 7 below). Finally, federal regulations will limit the ability to advertise brands via
various media platforms.
Exhibit 7: Health Canada’s Proposed Packaging Format
If there is limited product packaging differentiation in-store and limitations on marketing initially,
having more shelf space may be the key driver to gaining a greater share of the initial demand and to
establish a head start in brand development. As a result, we believe the LPs that have adequate
inventory and production will be best positioned to generate significant revenue and earnings by
participating in an undersupplied market at favourable unit economics. There would be further potential
upside for these LPs if others are unable to meet the volume commitments stated in their
provincial/territorial supply agreements.
Source: Health Canada.
Cannabis | Page 12 May 28, 2018This
repo
rt is
inte
nded
for C
anad
ian
& EU
dis
tribu
tion
only
. Una
utho
rized
repr
oduc
tion,
tran
smis
sion
or p
ublic
atio
n w
ithou
t the
prio
r writ
ten
cons
ent o
f BM
O Ca
pita
l Mar
kets
is s
trict
ly p
rohi
bite
d.

It is also likely that restrictions on marketing and packaging could cause a large portion of consumers to
simply seek the highest-potency strains (i.e., high in THC and/or CBD). In this scenario, LPs with more
product offerings in high-potency strains could be better positioned to capture more demand. If
Canadian consumers focus on specific strains, the recreational market will be comparable to Colorado,
where dried flower branding is at the strain level and differentiation is based on qualities of that strain,
including efficacy, potency, and consistency. We note that popular strains in those states are able to
command premium pricing. If differentiation in the Canadian recreational market is based on strains, it
could undermine the branding strategies of many LPs.
On the other hand, there is a view that strain-level branding is unique to Colorado due to the state’s
fragmented landscape of regional producers specializing in specific strains and regulations that facilitate
a “deli-style” retail environment. Dried flower is not pre-packaged and instead, is placed in containers
for customers to purchase, much like a deli counter. In Washington, where dried flower is pre-packaged,
there are company-level brands, similar to ones being developed by Canadian LPs. As well, we believe
strain-level branding will become less relevant as value-add products with cannabis extracts, such as
vape pens and consumables, are introduced.
Branding Power May Be Limited In-Store; Can Budtenders Bridge the Gap?
While brands could develop consumer awareness and influence in-store purchasing, we believe
branding power may be limited if it is not communicated or promoted by the in-store sales staff (also
known as budtenders). When we visited cannabis dispensaries in Denver and LA, we found that
budtenders play a crucial role in consumer education and product recommendations, which are based on
personal experiences and third-party user feedback.
Specific to Canada, where packaging designs could be limited and consumers may be focused on specific
strains, it would be the budtender’s role to differentiate the products, and in particular, highlight the
variances of otherwise genetically similar strains grown by different LPs. We note that several LPs could
be cultivating the same strain for the recreational market and while the strain’s core genetic profile is
the same, qualities such as potency, efficacy, and consistency may differ as a result of the particularly
environment it is grown in (also known as the plant’s phenotype).
We are concerned that initially, budtenders may not have sufficient knowledge to effectively
communicate the differences between products and segment them based on perceived quality. In
addition, we believe there is a risk that provinces/territories could limit the channels in which LPs can
establish partnerships with the sales staff. For example, we understand that Ontario’s regulations will
prohibit budtenders from making brand recommendations, although they will be permitted to provide
factual information about the product such as the terpene profile and potency level. As a result of the
restrictive regulations on marketing, branding, and budtenders, we believe the initial successful LPs will
be companies with sufficient products to fill the retail channel and maximize shelf space.
Current Medical Market in Canada: Opaque
According to Statistics Canada, there are currently 269,500 registered medical cannabis patients in the
country. A widely disclosed metric by LPs is the number of patients they have onboarded as there is a
perception that the number of patients registered with an LP is indicative of the company’s share of the
Canadian medical market. However, we believe this metric alone is a misleading measure for market
share as patients can register with more than one LP, a patient may be registered with the LP but not
actively ordering products, or a LP could have fewer registered patients but higher average consumption
per patient. In addition, we believe there is currently no standardized definition of an “active” patient.
Cannabis | Page 13 May 28, 2018This
repo
rt is
inte
nded
for C
anad
ian
& EU
dis
tribu
tion
only
. Una
utho
rized
repr
oduc
tion,
tran
smis
sion
or p
ublic
atio
n w
ithou
t the
prio
r writ
ten
cons
ent o
f BM
O Ca
pita
l Mar
kets
is s
trict
ly p
rohi
bite
d.

As a result, we believe it is important to consider the volume sold, reported revenues, number of
registered patients, and implied average consumption per patient (see Exhibit 8 below).
Exhibit 8: Key Publicly Traded Players in the Canadian Medical Cannabis Market
Note: BMO Capital Markets is restricted on Aurora Cannabis
We find the current Canadian medical market to be opaque with respect to patient acquisition and
churn. Physicians can either directly prescribe their patients for medical cannabis or refer them to a
cannabis clinic. In the former, the physician will prescribe a specific dosage, and can also provide product
recommendations. Alternatively, the physician can refer the patient to a cannabis clinic where the
patient can access further information about which products would be most suitable for their needs.
We understand that both prescribing physicians and cannabis clinics are typically receiving “education
fees” from LPs. This may prove to be an inappropriate payment that will eventually be addressed by
medical regulators. The challenge in assessing the prevalence of this fee is the lack of disclosure,
including the amount typically charged by clinics and physicians. Our view is that since cannabis is closer
to an alternative natural health product than a pharmaceutical drug and has no clinical trials, the primary
channel for LPs to acquire patients is to encourage physicians through strategic partnerships and
cannabis clinics. As a result, we believe these education fees likely represent significant patient
acquisition costs for LPs and we have heard anecdotally that they can represent about 15% of the LP’s
selling price.
We also consider churn to be a key metric in assessing the competitive dynamics of the medical market.
However, there is a lack of disclosure by LPs on this measure and any approximation is challenged by
the continued growth in the overall Canadian medical market. Based on our understanding of the
industry, we believe churn could be quite high as cannabis products have a wide range of efficacy
depending on the individual, and it is likely that patients are trialing numerous LPs’ products to
determine the best one(s) for their needs.
Supply & Demand in the Medical Market When Recreational Is Legal
We believe there could be some material changes in both the level of supply and demand in the
medical market when the recreational market is legalized. Some existing patients, and potential future
patients, could prefer the recreational market given that the latter provides relatively easier access to
cannabis than the medical prescription process. However, this may be more than offset if more
employers begin to include medicinal cannabis under insurance coverage plans. In addition, medical
expenses are tax deductible above a certain threshold. Overall, our Base Case forecast assumes that the
industry growth rate for medical patient acquisition slows when the recreational market is legalized. On
the supply side, we believe there will likely be a tighter market for medical cannabis in the near term as
we expect that most LPs will prioritize their inventory to gain a share of the recreational market.
Last Quarter Last Quarter
Volume Sold
(kg)
Share of
Volume # Patients
Share of
Patients
Grams per
patient
Avg. Selling
Price ($ / g)
Canada 15,616 269,502 58
Canopy 2,330 15% 69,919 26% 33 $8.30
Aurora 1,353 9% 45,776 17% 30 $7.99
MedReleaf 1,263 8% n.a. n.a. $8.64
Aphria1~1,000 6% ~40,000 15% 25 $8.30
CannTrust 982 6% 40,000 15% 25 $7.63
Source: Company filings.
Note (1): Excludes wholesale to other LPs.
Cannabis | Page 14 May 28, 2018This
repo
rt is
inte
nded
for C
anad
ian
& EU
dis
tribu
tion
only
. Una
utho
rized
repr
oduc
tion,
tran
smis
sion
or p
ublic
atio
n w
ithou
t the
prio
r writ
ten
cons
ent o
f BM
O Ca
pita
l Mar
kets
is s
trict
ly p
rohi
bite
d.

Near-Term International Medical Opportunity: Germany
There is considerable focus on the international opportunity for Canadian LPs as the country’s tenured
federal medical framework, expected national legalization of the recreational market, large number of
LPs with cultivation experience, and access to capital markets puts Canada at the forefront of the global
cannabis opportunity.
In the near term, we believe Germany’s medical market is the primary international opportunity for the
Canadian LPs due to its medical legalization, size of population, and a favourable insurance coverage
outlook. In a recent report by Prohibition Partners, a cannabis-focused market intelligence firm, the
long-term German medical cannabis market opportunity was estimated at €10 billion.
We understand that prior to medical legalization there were only about 1,000 German citizens with
permission to use cannabis for serious medical conditions. Since medical legalization in 2017, the
country’s three large insurance companies disclosed that there have been 20,000 medical cannabis
claims, of which 13,000 were approved for reimbursement. In addition to these claims, there are also
private cannabis prescriptions where the patient covers the expense. We understand that German law
requires health insurance coverage for medical cannabis, although we have heard that the associated
paperwork is onerous and often a grounds for a patient to not qualify for coverage.
Germany’s current medical cannabis framework does not permit domestic cultivation. As a result, the
country relies on imports to meet demand. Initially, Germany imported exclusively from a Dutch
producer called Bedrocan, but a few Canadian LPs are now focusing on the country. Canadian LPs must
wholesale their exports to the pharmacy distributors as only pharmacies are permitted to dispense
medical cannabis prescriptions. Currently, retail and wholesale prices (the price shared by distributors
and Canadian LPs) in Germany can be as high as $25 and $15 per gram, respectively, due to the supply
shortage from a lack of domestic cultivation and prior administrative issues that delayed international
companies from being able to import into the country. As a result, Canadian LPs exporting into Germany
are receiving much higher wholesale prices than they are receiving in the Canadian medical market. See
Exhibit 9 below for LPs that have secured the licenses, Good Manufacturing Process (GMP) certification
and distribution partners, and are either already or will begin exporting into Germany.
Exhibit 9: Current Players in the German Medical Market
Note: BMO Capital Markets is restricted on Aurora Cannabis
Canadian LPs
Dutch LP
Distributors
Dutch Government
GmbH
Source: Company filings. Note: Aphria is awaiting GMP certification.
Paesel + Lorei
Aurora
Tilray
CannaMedical
Pedanios
MedReleaf
Maricann
SpektrumCannabisCanopy Growth
Cronos Group Pohl Boskamp
Maricann GmbH
Noweda
Bedrocan
Cannabis | Page 15 May 28, 2018This
repo
rt is
inte
nded
for C
anad
ian
& EU
dis
tribu
tion
only
. Una
utho
rized
repr
oduc
tion,
tran
smis
sion
or p
ublic
atio
n w
ithou
t the
prio
r writ
ten
cons
ent o
f BM
O Ca
pita
l Mar
kets
is s
trict
ly p
rohi
bite
d.
Asterisks Behind the German Opportunity
Notwithstanding these favourable dynamics, we believe the German market opportunity for Canadian
LPs should be evaluated carefully. We expect only a handful of the larger LPs will be able to secure the
licensing and certifications requirements, and develop the necessary distribution infrastructure in the
country. Canadian LPs need an export license from Health Canada, be GMP-certified, and have a
distributor partner to supply the fragmented German pharmacy landscape.
We note that achieving GMP certification is a significant undertaking for an LP. In addition, there are
varying forms of the GMP standards, some of which may not be recognized in certain jurisdictions. We
believe the challenges associated with GMP certification represent a significant hurdle in terms of capital
and other investments for the smaller LPs to meet.
We also understand that unlike the Canadian medical market, cannabis producers and distributors are
not permitted to communicate directly with patients and education fees are prohibited. In Germany, the
prescribing doctor has sole discretion in selecting the LP for the patient, and pharmacies cannot
substitute for another producer’s product when dispensing the prescription. As a result, we consider the
focus by some Canadian LPs on the number of German pharmacies their distributor partner has
relationships with is somewhat misleading as these distributors can supply to any German pharmacy,
and it is the doctor who ultimately determines which LP’s product will be prescribed. We believe
establishing relationships with doctors is critical in order to become a meaningful player in the German
medical market, and such an investment presents another hurdle for the smaller LPs. We understand
that there are about 100,000 doctors and 27,000 pharmacies in Germany.
Finally, it appears that favourable economics from German sales have yet to materially contribute to
earnings for the participating Canadian LPs. Current exports into the German medical market only
represent a modest portion of sales for the handful of Canadian LPs that are able to sell products there.
Long-Term Industry Outlook
Oversupply Expected in the Long Term but Impact on Pricing for LPs Is Uncertain
Based on our outlook for industry demand in Exhibit 3 and our forecast for production output by the Big
Three LPs, which we believe will represent the majority of industry supply, we project that supply will
catch up with demand in year two and potentially begin to significantly exceed demand likely in the
third or fourth year following recreational legalization. It is not clear if this projected supply/demand
imbalance will weigh on the cannabis prices realized by the LPs as by then there will be the opportunity
to export increasing volumes to international markets, such as Germany, and the introduction of
additional product formats (such as vape pens, edibles, and beverages) should provide higher pricing
and margins per gram equivalent to compensate for price compression in dried flower.
The analysis in Exhibit 10 following outlines our view that in the long term, the Canadian market will
shift from a supply shortage to significant oversupply of dried flower as Canadian LPs complete their
facility build-outs. Exhibit 10 highlights that just the production capacity currently being developed by
the Big Three LPs will account for eight million of the estimated 11 million square feet of production
space required to satisfy total Canadian demand. We note that the eight million square feet does not
consider the facility expansions of the other LPs, many of which we understand are also undertaking
significant facility developments.
Cannabis | Page 16 May 28, 2018This
repo
rt is
inte
nded
for C
anad
ian
& EU
dis
tribu
tion
only
. Una
utho
rized
repr
oduc
tion,
tran
smis
sion
or p
ublic
atio
n w
ithou
t the
prio
r writ
ten
cons
ent o
f BM
O Ca
pita
l Mar
kets
is s
trict
ly p
rohi
bite
d.
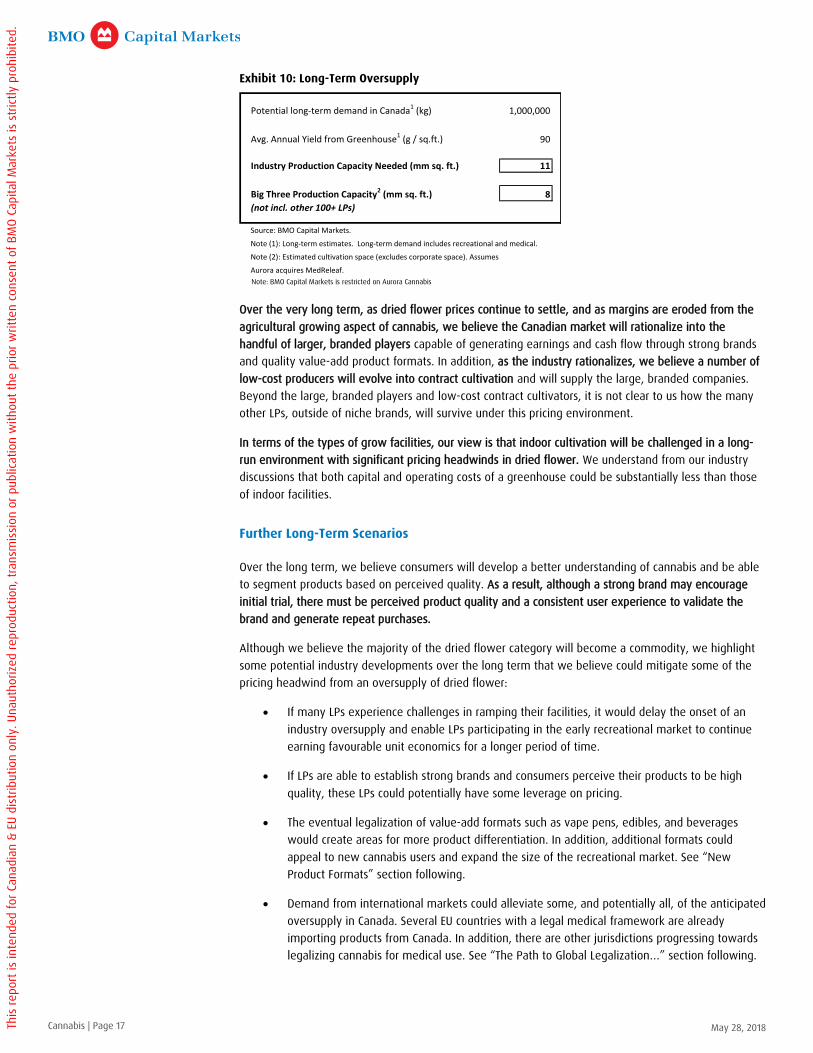
Exhibit 10: Long-Term Oversupply
Note: BMO Capital Markets is restricted on Aurora Cannabis
Over the very long term, as dried flower prices continue to settle, and as margins are eroded from the
agricultural growing aspect of cannabis, we believe the Canadian market will rationalize into the
handful of larger, branded players capable of generating earnings and cash flow through strong brands
and quality value-add product formats. In addition, as the industry rationalizes, we believe a number of
low-cost producers will evolve into contract cultivation and will supply the large, branded companies.
Beyond the large, branded players and low-cost contract cultivators, it is not clear to us how the many
other LPs, outside of niche brands, will survive under this pricing environment.
In terms of the types of grow facilities, our view is that indoor cultivation will be challenged in a long-
run environment with significant pricing headwinds in dried flower. We understand from our industry
discussions that both capital and operating costs of a greenhouse could be substantially less than those
of indoor facilities.
Further Long-Term Scenarios
Over the long term, we believe consumers will develop a better understanding of cannabis and be able
to segment products based on perceived quality. As a result, although a strong brand may encourage
initial trial, there must be perceived product quality and a consistent user experience to validate the
brand and generate repeat purchases.
Although we believe the majority of the dried flower category will become a commodity, we highlight
some potential industry developments over the long term that we believe could mitigate some of the
pricing headwind from an oversupply of dried flower:
If many LPs experience challenges in ramping their facilities, it would delay the onset of an
industry oversupply and enable LPs participating in the early recreational market to continue
earning favourable unit economics for a longer period of time.
If LPs are able to establish strong brands and consumers perceive their products to be high
quality, these LPs could potentially have some leverage on pricing.
The eventual legalization of value-add formats such as vape pens, edibles, and beverages
would create areas for more product differentiation. In addition, additional formats could
appeal to new cannabis users and expand the size of the recreational market. See “New
Product Formats” section following.
Demand from international markets could alleviate some, and potentially all, of the anticipated
oversupply in Canada. Several EU countries with a legal medical framework are already
importing products from Canada. In addition, there are other jurisdictions progressing towards
legalizing cannabis for medical use. See “The Path to Global Legalization…” section following.
Potential long-term demand in Canada1 (kg) 1,000,000
Avg. Annual Yield from Greenhouse1 (g / sq.ft.) 90
Industry Production Capacity Needed (mm sq. ft.) 11
Big Three Production Capacity2 (mm sq. ft.) 8
(not incl. other 100+ LPs)
Source: BMO Capital Markets.
Note (1): Long-term estimates. Long-term demand includes recreational and medical.
Note (2): Estimated cultivation space (excludes corporate space). Assumes
Aurora acquires MedReleaf.
Cannabis | Page 17 May 28, 2018This
repo
rt is
inte
nded
for C
anad
ian
& EU
dis
tribu
tion
only
. Una
utho
rized
repr
oduc
tion,
tran
smis
sion
or p
ublic
atio
n w
ithou
t the
prio
r writ
ten
cons
ent o
f BM
O Ca
pita
l Mar
kets
is s
trict
ly p
rohi
bite
d.
New Product Formats
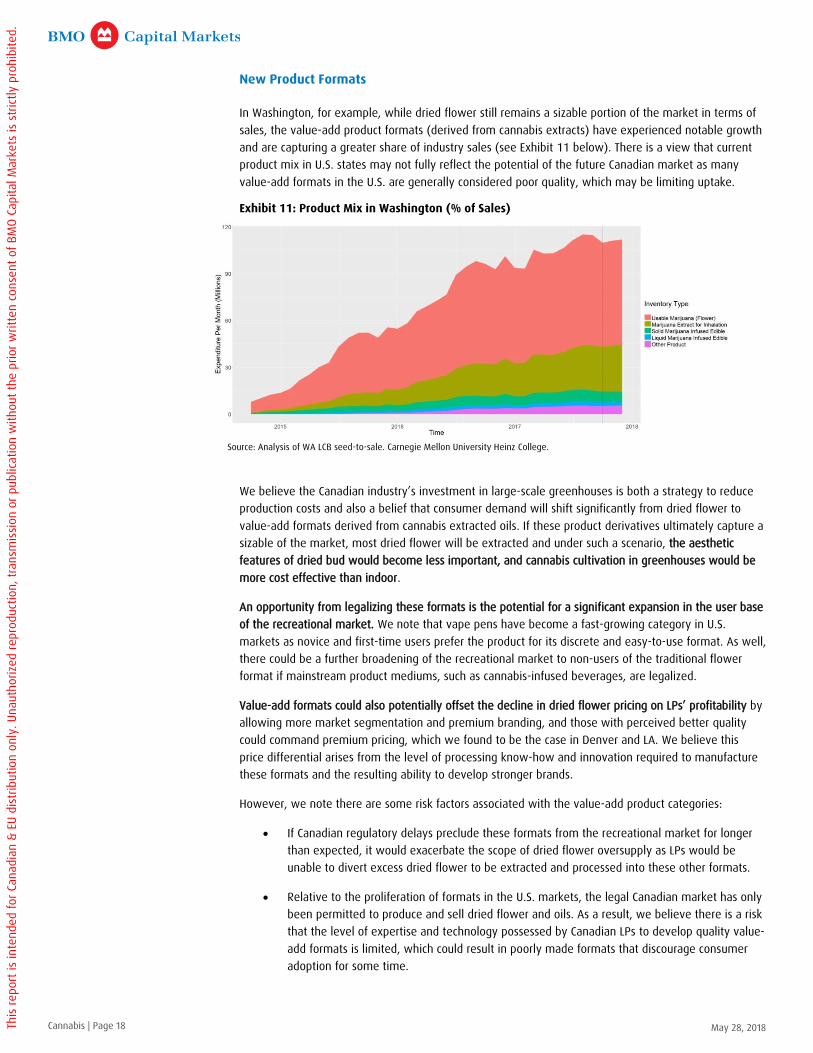
In Washington, for example, while dried flower still remains a sizable portion of the market in terms of
sales, the value-add product formats (derived from cannabis extracts) have experienced notable growth
and are capturing a greater share of industry sales (see Exhibit 11 below). There is a view that current
product mix in U.S. states may not fully reflect the potential of the future Canadian market as many
value-add formats in the U.S. are generally considered poor quality, which may be limiting uptake.
Exhibit 11: Product Mix in Washington (% of Sales)
We believe the Canadian industry’s investment in large-scale greenhouses is both a strategy to reduce
production costs and also a belief that consumer demand will shift significantly from dried flower to
value-add formats derived from cannabis extracted oils. If these product derivatives ultimately capture a
sizable of the market, most dried flower will be extracted and under such a scenario, the aesthetic
features of dried bud would become less important, and cannabis cultivation in greenhouses would be
more cost effective than indoor.
An opportunity from legalizing these formats is the potential for a significant expansion in the user base
of the recreational market. We note that vape pens have become a fast-growing category in U.S.
markets as novice and first-time users prefer the product for its discrete and easy-to-use format. As well,
there could be a further broadening of the recreational market to non-users of the traditional flower
format if mainstream product mediums, such as cannabis-infused beverages, are legalized.
Value-add formats could also potentially offset the decline in dried flower pricing on LPs’ profitability by
allowing more market segmentation and premium branding, and those with perceived better quality
could command premium pricing, which we found to be the case in Denver and LA. We believe this
price differential arises from the level of processing know-how and innovation required to manufacture
these formats and the resulting ability to develop stronger brands.
However, we note there are some risk factors associated with the value-add product categories:
If Canadian regulatory delays preclude these formats from the recreational market for longer
than expected, it would exacerbate the scope of dried flower oversupply as LPs would be
unable to divert excess dried flower to be extracted and processed into these other formats.
Relative to the proliferation of formats in the U.S. markets, the legal Canadian market has only
been permitted to produce and sell dried flower and oils. As a result, we believe there is a risk
that the level of expertise and technology possessed by Canadian LPs to develop quality value-
add formats is limited, which could result in poorly made formats that discourage consumer
adoption for some time.
Source: Analysis of WA LCB seed-to-sale. Carnegie Mellon University Heinz College.
Cannabis | Page 18 May 28, 2018This
repo
rt is
inte
nded
for C
anad
ian
& EU
dis
tribu
tion
only
. Una
utho
rized
repr
oduc
tion,
tran
smis
sion
or p
ublic
atio
n w
ithou
t the
prio
r writ
ten
cons
ent o
f BM
O Ca
pita
l Mar
kets
is s
trict
ly p
rohi
bite
d.

We observed in Denver and LA that packaging was a key branding tool for companies to
differentiate their value-add product formats. We believe Health Canada’s proposals, if
enforced, would materially impair Canadian LPs’ ability to communicate their branding and
their products’ features to consumers.
The Path to Global Legalization and Potential Impact for Canada
Currently, the international flow of controlled substances is governed by three United Nations treaties:
the Single Convention on Narcotic Drugs, the Convention on Psychotropic Substances, and the
Convention against Illicit Traffic in Narcotic Drugs and Psychotropic Substances. As a result of these
treaties, international trade of cannabis is only permitted for medical purposes and countries must have
a legal federal framework in order to participate. Countries that legalize recreational use must satisfy
demand with domestic production.
Although the pace for global legalization is unclear, there is a view that medical legalization will
continue to take place across various jurisdictions, particularly in the European Union. Some industry
forecasts have sized the global cannabis market opportunity at about $55 billion by 2025. We
understand that in addition to Germany, other European countries with a legalized medical framework
implemented are Denmark, Italy, the Netherlands, and Poland. However, only a few European countries
such as Denmark and the Netherlands have permitted domestic production and exporting under certain
circumstances. Outside of Europe, we note that Israel has a significant history in cannabis research and
cultivation, but the Israeli government has not yet permitted exports from the country.
We believe the current international opportunity for Canadian LPs, which is the ability to export products
into other markets at favourable economics, will prove to be transitory. Over the medium term,
countries where Canadian LPs are currently exporting to could establish domestic cultivation. We note
that Germany recently undertook a tender process to issue cultivation licenses and we understand that a
number of Canadian LPs were involved in the process. However, on March 28, a German court
temporarily halted the process. In the interim, Canadian LPs can continue to export products into the
German medical market without the potential for displacement from domestic production. However, a
negative read-through from the German court ruling is that a new tender process could favour German
companies over Canadian LPs. If a new tender process results in most or all of the licenses being
awarded to German LPs, we believe there could still be an opportunity for Canadian LPs as strategic
partners given that German companies would have limited experience in cannabis cultivation and
processing. This partnership approach may become the avenue in which Canadian LPs participate in the
growth of domestic production in international markets given their significant expertise in cultivation,
processing, etc.
Over the long term, we believe there will be countries with favourable climates and lower wage rates
(such as Colombia, Jamaica, and Israel) that emerge as the low-cost growers of dried flower for medical
export. The potential for Israel to become a competitor to Canada in the international export market
could be a near-term risk if the Israeli government permits exports from the country. As a result, we
believe the long-term global opportunity for Canadian LPs is developing intellectual property in areas
such as the development of new strains through genetic modification, cannabinoid isolation and
formulation for advanced medical applications, and new technological innovations for value-add
formats. As well, the current environment is providing Canadian LPs with the unique opportunity to
develop the first global brands.
Although there are several state-level medical and recreational markets, the classification of cannabis as
a Schedule 1 drug by the U.S. federal government confines the operations of U.S. cannabis companies
within their state. As a result, U.S. cannabis companies lack scale and are restricted from participating in
international markets, all of which have created a favourable competitive environment for Canadian LPs.
We believe there would be significant disruption to Canadian LPs if the U.S. legalizes cannabis on a
Cannabis | Page 19 May 28, 2018This
repo
rt is
inte
nded
for C
anad
ian
& EU
dis
tribu
tion
only
. Una
utho
rized
repr
oduc
tion,
tran
smis
sion
or p
ublic
atio
n w
ithou
t the
prio
r writ
ten
cons
ent o
f BM
O Ca
pita
l Mar
kets
is s
trict
ly p
rohi
bite
d.
federal level. Such a scenario would see increased competition to supply international markets. In
addition, we believe this scenario would exacerbate Canada’s domestic oversupply issue and LP margins
would erode further if Canada was to permit imports of dried flower from the U.S., where wholesale
prices are as low as $2 per gram.
Finally, we note that our discussion only considers the global medical market. The additional long-term
upside would be if other jurisdictions consider recreational legalization and we understand that Malta is
currently drafting legislation to legalize recreational use. If Malta establishes and implements a
framework legalizing the recreational market, we believe this could set a precedent that encourages
potential recreational legalization in other European countries. Should other countries legalize
recreational cannabis, Canadian LPs must establish cultivation in those markets in order to participate as
suppliers as the UN treaties prevent international trade of cannabis for non-medical purposes.
Evolution of the Canadian Medical Market
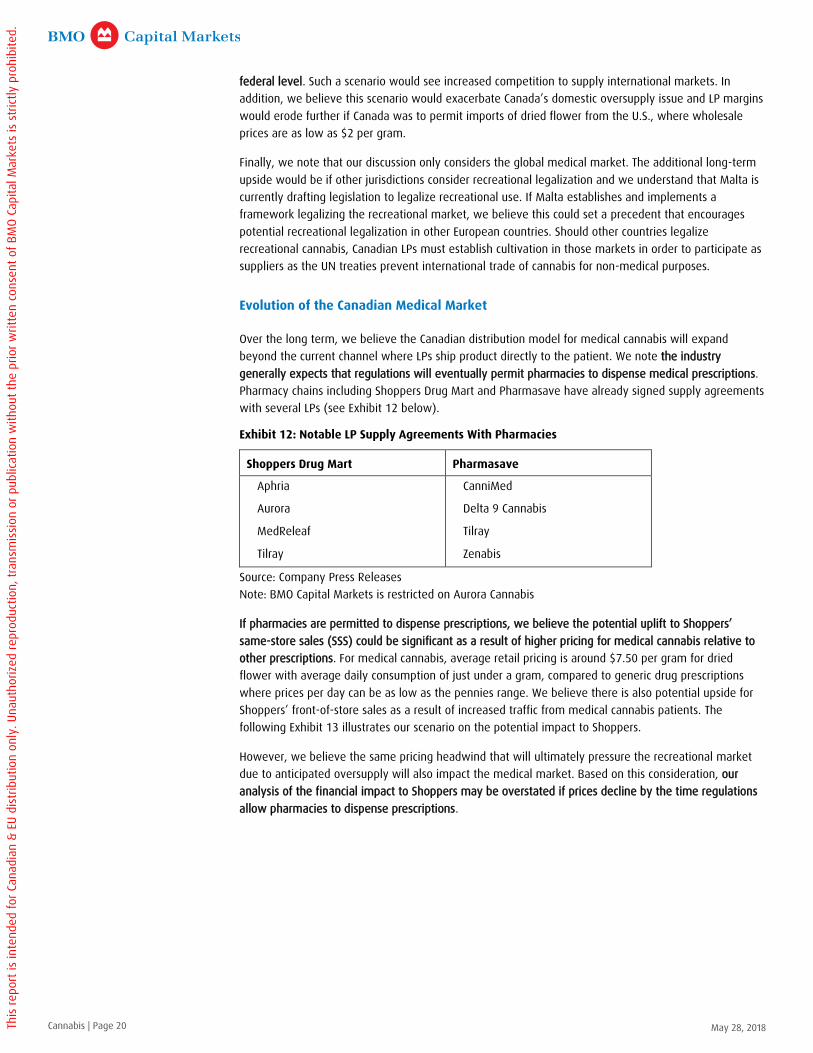
Over the long term, we believe the Canadian distribution model for medical cannabis will expand
beyond the current channel where LPs ship product directly to the patient. We note the industry
generally expects that regulations will eventually permit pharmacies to dispense medical prescriptions.
Pharmacy chains including Shoppers Drug Mart and Pharmasave have already signed supply agreements
with several LPs (see Exhibit 12 below).
Exhibit 12: Notable LP Supply Agreements With Pharmacies
Shoppers Drug Mart Pharmasave
Aphria
Aurora
MedReleaf
Tilray
CanniMed
Delta 9 Cannabis
Tilray
Zenabis
Source: Company Press Releases
Note: BMO Capital Markets is restricted on Aurora Cannabis
If pharmacies are permitted to dispense prescriptions, we believe the potential uplift to Shoppers’
same-store sales (SSS) could be significant as a result of higher pricing for medical cannabis relative to
other prescriptions. For medical cannabis, average retail pricing is around $7.50 per gram for dried
flower with average daily consumption of just under a gram, compared to generic drug prescriptions
where prices per day can be as low as the pennies range. We believe there is also potential upside for
Shoppers’ front-of-store sales as a result of increased traffic from medical cannabis patients. The
following Exhibit 13 illustrates our scenario on the potential impact to Shoppers.
However, we believe the same pricing headwind that will ultimately pressure the recreational market
due to anticipated oversupply will also impact the medical market. Based on this consideration, our
analysis of the financial impact to Shoppers may be overstated if prices decline by the time regulations
allow pharmacies to dispense prescriptions.
Cannabis | Page 20 May 28, 2018This
repo
rt is
inte
nded
for C
anad
ian
& EU
dis
tribu
tion
only
. Una
utho
rized
repr
oduc
tion,
tran
smis
sion
or p
ublic
atio
n w
ithou
t the
prio
r writ
ten
cons
ent o
f BM
O Ca
pita
l Mar
kets
is s
trict
ly p
rohi
bite
d.
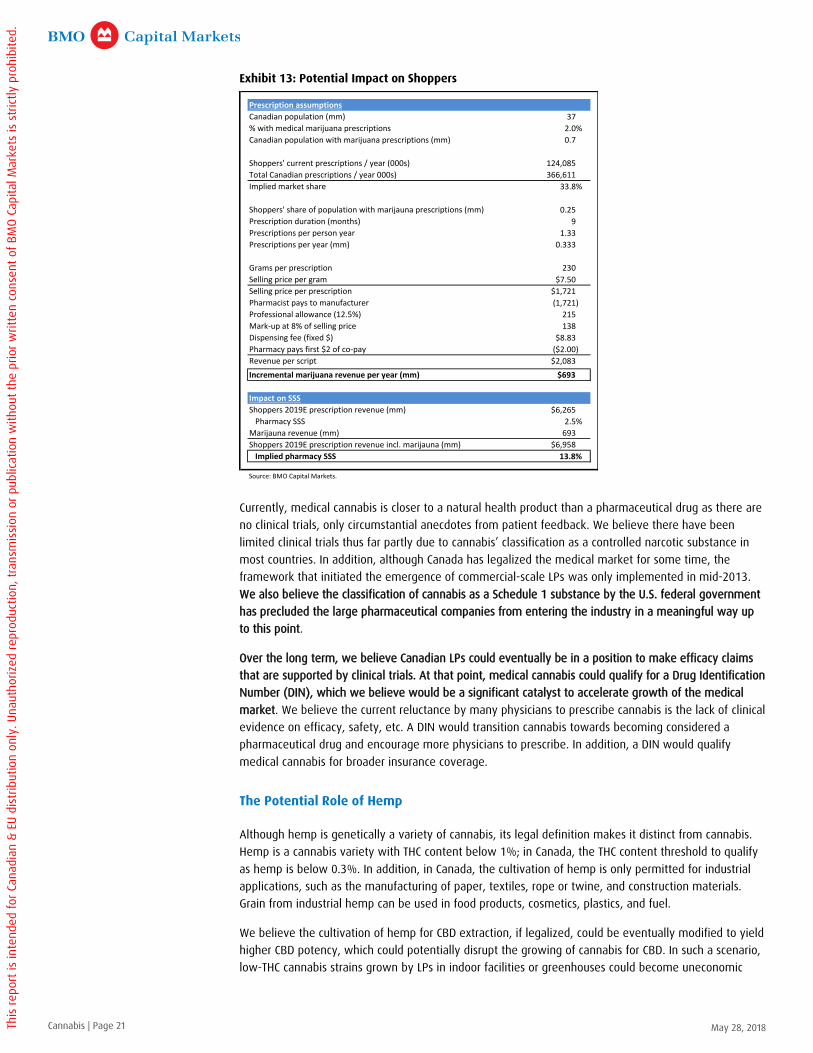
Exhibit 13: Potential Impact on Shoppers
Currently, medical cannabis is closer to a natural health product than a pharmaceutical drug as there are
no clinical trials, only circumstantial anecdotes from patient feedback. We believe there have been
limited clinical trials thus far partly due to cannabis’ classification as a controlled narcotic substance in
most countries. In addition, although Canada has legalized the medical market for some time, the
framework that initiated the emergence of commercial-scale LPs was only implemented in mid-2013.
We also believe the classification of cannabis as a Schedule 1 substance by the U.S. federal government
has precluded the large pharmaceutical companies from entering the industry in a meaningful way up
to this point.
Over the long term, we believe Canadian LPs could eventually be in a position to make efficacy claims
that are supported by clinical trials. At that point, medical cannabis could qualify for a Drug Identification
Number (DIN), which we believe would be a significant catalyst to accelerate growth of the medical
market. We believe the current reluctance by many physicians to prescribe cannabis is the lack of clinical
evidence on efficacy, safety, etc. A DIN would transition cannabis towards becoming considered a
pharmaceutical drug and encourage more physicians to prescribe. In addition, a DIN would qualify
medical cannabis for broader insurance coverage.
The Potential Role of Hemp
Although hemp is genetically a variety of cannabis, its legal definition makes it distinct from cannabis.
Hemp is a cannabis variety with THC content below 1%; in Canada, the THC content threshold to qualify
as hemp is below 0.3%. In addition, in Canada, the cultivation of hemp is only permitted for industrial
applications, such as the manufacturing of paper, textiles, rope or twine, and construction materials.
Grain from industrial hemp can be used in food products, cosmetics, plastics, and fuel.
We believe the cultivation of hemp for CBD extraction, if legalized, could be eventually modified to yield
higher CBD potency, which could potentially disrupt the growing of cannabis for CBD. In such a scenario,
low-THC cannabis strains grown by LPs in indoor facilities or greenhouses could become uneconomic
Prescription assumptions
Canadian population (mm) 37
% with medical marijuana prescriptions 2.0%
Canadian population with marijuana prescriptions (mm) 0.7
Shoppers' current prescriptions / year (000s) 124,085
Total Canadian prescriptions / year 000s) 366,611
Implied market share 33.8%
Shoppers' share of population with marijauna prescriptions (mm) 0.25
Prescription duration (months) 9
Prescriptions per person year 1.33
Prescriptions per year (mm) 0.333
Grams per prescription 230
Selling price per gram $7.50
Selling price per prescription $1,721
Pharmacist pays to manufacturer (1,721)
Professional allowance (12.5%) 215
Mark-up at 8% of selling price 138
Dispensing fee (fixed $) $8.83
Pharmacy pays first $2 of co-pay ($2.00)
Revenue per script $2,083
Incremental marijuana revenue per year (mm) $693
Impact on SSS
Shoppers 2019E prescription revenue (mm) $6,265
Pharmacy SSS 2.5%
Marijauna revenue (mm) 693
Shoppers 2019E prescription revenue incl. marijauna (mm) $6,958
Implied pharmacy SSS 13.8%
Source: BMO Capital Markets.
Cannabis | Page 21 May 28, 2018This
repo
rt is
inte
nded
for C
anad
ian
& EU
dis
tribu
tion
only
. Una
utho
rized
repr
oduc
tion,
tran
smis
sion
or p
ublic
atio
n w
ithou
t the
prio
r writ
ten
cons
ent o
f BM
O Ca
pita
l Mar
kets
is s
trict
ly p
rohi
bite
d.

given the cost advantage of hemp, which can be grown outdoors at a materially lower cost.
Furthermore, if hemp cultivation for CBD extraction is legalized, we believe the products from this
channel could fall under the natural health product category. Such an opportunity could attract a
company like Jamieson Wellness (JWEL-TSX; $24.05; Outperform) into the space, whether as a producer
of such products or as a strategic partner to a LP, given the company’s leading position in the Canadian
natural health industry. However, the potential for disruption in CBD extracted from hemp may be
limited as we understand that current CBD yields from hemp are modest, which if unchanged over the
long term, would limit the scope of cannabis strains that could be displaced by the extraction of CBD
from hemp.
Evolution of Canadian LPs’ Business Model
Currently, the LP medical business model is vertically integrated from cultivation to direct-to-consumer
sale. The recreational business model will also be relatively integrated from cultivation to wholesale,
and in some provinces, LPs will also be able to own and operate retail stores.
Over the long term, we believe cannabis cultivation will become a low-margin, commoditized part of
the supply chain and will be taken up by agriculturalists. Furthermore, if cannabis is legalized on a
global basis, we would expect that there will be other countries emerging as the low-cost cultivator of
dried flower. As a result, we believe many Canadian LPs will exit the cultivation business over time.
However, it is unclear to us what the exit strategy would be as these companies have made significant
capital investments into their large cultivation facilities.
Canadian LPs have a unique opportunity to become global leaders in this evolution due to the
comprehensive legal framework for both medical and recreational cannabis in Canada, and due to LPs’
access to funding in Canadian capital markets.
We believe the Canadian LP business model will eventually evolve to focus on intellectual property and
branding. The areas for intellectual property development could include the technology and expertise in
manufacturing value-add formats, pharmaceutical innovation that could be patented and/or receive a
DIN, and genetic modification to create custom cannabinoid formulations and new strains with better
efficacy to address specific needs and ailments (see Exhibit 14).
Exhibit 14: Potential Transformation of the LP Business Model in the Long Term
Licensed Producer
Present Long-term
Extraction
Wholesale & Retail
Cultivation
Cultivation FarmingLicensed Producer
IntellectualProperty
Value-add format manufacturing
Pharmaceuticals Formulation & genetic modification
Branding
Source: BMO Capital Markets.
Cannabis | Page 22 May 28, 2018This
repo
rt is
inte
nded
for C
anad
ian
& EU
dis
tribu
tion
only
. Una
utho
rized
repr
oduc
tion,
tran
smis
sion
or p
ublic
atio
n w
ithou
t the
prio
r writ
ten
cons
ent o
f BM
O Ca
pita
l Mar
kets
is s
trict
ly p
rohi
bite
d.

It is also possible that the larger, branded LP companies could ultimately be acquired by large CPG
players in the beverage and tobacco industries, or pharmaceutical companies given the potential
disruption cannabis-extracted products could present for these legacy sectors.
Assessing Valuations: Are We in a Bubble?
We believe current valuations in the industry reflect three key expectations:
That the Canadian recreational market is a sizable and untapped market.
Constellation Brands’ investment in Canopy established a view that there will be significant
upside when new product formats, such as beverages, are developed and legalized and
displace incumbent industries, such as the alcohol sector. These value-add products should
have higher price points and offer the possibility of much higher margins.
That there will be a rapid legalization of medical cannabis across numerous countries and
Canadian LPs will be able to fulfill this demand through exported products.
In the near to medium term, we believe valuation multiples among the LPs could potentially expand as
all the provinces/territories announce their supply chains, LPs ramp to fill the distribution channels, and
the level of legal demand emerges. Over the long term, we anticipate that only a handful of companies
will be attributed a premium valuation. These long-term industry leaders will be the companies that win
the initial supply agreements and capture sizable shares of the near-term recreational market, and
possess the scale and resources to invest in brand development and value-add format manufacturing
and also capitalize on the gradual legalization of international medical markets.
Track Record of LPs’ Management Teams
The legalization of medical and recreational cannabis in Canada has created a new industry with many
unprecedented developments. The sizable opportunities in the industry, such as the gradual legalization
of international medical markets and a sizable domestic adult-use market, have attracted a large
number of entrepreneurs. We note that there is a wide range of background experiences among the
founders and CEOs of these LPs, from former illicit market operators, financial professionals, and small
businessmen to serial technology entrepreneurs. The entrepreneurial track records for some of the
management teams have been uneven. Although there is inherently a degree of volatility in managing
entrepreneurial ventures, we believe management track record will be a key aspect for investors to
consider when assessing the level of execution risk for these companies.
Cannabis | Page 23 May 28, 2018This
repo
rt is
inte
nded
for C
anad
ian
& EU
dis
tribu
tion
only
. Una
utho
rized
repr
oduc
tion,
tran
smis
sion
or p
ublic
atio
n w
ithou
t the
prio
r writ
ten
cons
ent o
f BM
O Ca
pita
l Mar
kets
is s
trict
ly p
rohi
bite
d.

Company Snapshot: Our Current Coverage Universe
Exhibit 15 below outlines the key metrics in which to assess LPs. However, we add the caveat that
several of the KPIs, particularly cost of production, are not as meaningful at this stage as the LPs are not
yet at scale. In addition, we note that most LPs have grown primarily in indoor facilities and are just
beginning to build out and ramp their greenhouses.
Exhibit 15: Benchmarking Analysis
Aphria3
Canopy
Production Capacity1sq. ft.
Currently Fully Ramped 126,000 560,000
Total Capacity In Future 2,055,000 3,961,600
Components of COGS - Last Q $ / g
Cash Cost to Produce Dried Cannabis2$0.96 $1.03
Depreciation Related to Cultivation $0.33 In D&A expense
Packaging
Packaging, Fulfillment $0.26
Packaging, Fulfillment, Shipping $1.50
What's in Sales & Marketing expense? Shipping None
Medical Market Share
# of Registered Patients 40,000 69,919
Last Q Volume Sold3kg 1,000 2,330
Last Q Per Patient Use g / patient 25 33
Last Q Industry Volume kg 15,616 15,616
Share of Market by Volume3% 6% 15%
Last Q Cannabis Sales3$ mm ~$8,300 $19,340
Last Q Avg. Selling Price3$ / g $8.30 $8.30
Distribution Agreements
Provinces signed so far QC, NBQC, NB, Nfld,
PEI, Yukon
Pharmacies signed so far Shoppers None
Source: BMO Capital Markets, company filings.
Note (1): BMO's estimate of total cultivation space. Excludes non-cultivation space.
Note (2): Cash cost from cultivation to trimming and drying into bulk dried flower form.
Note (3): Excludes wholesale to other LPs.
Cannabis | Page 24 May 28, 2018This
repo
rt is
inte
nded
for C
anad
ian
& EU
dis
tribu
tion
only
. Una
utho
rized
repr
oduc
tion,
tran
smis
sion
or p
ublic
atio
n w
ithou
t the
prio
r writ
ten
cons
ent o
f BM
O Ca
pita
l Mar
kets
is s
trict
ly p
rohi
bite
d.

Company Coverage: Aphria
Our Investment Thesis
We are initiating coverage of Aphria with an Outperform rating.
Near-term market leader in recreational market: In an industry where restrictive marketing and
packaging regulations may significantly limit product differentiation, we believe the key near-term
success factor for LPs will be to secure in-store shelf space for their products. However, based on our
visits to most of the larger Canadian LPs’ facilities, where many are still under construction or waiting for
licenses, we are concerned that the majority of companies will not have the inventory or production
capacity to meaningfully participate in the near-term market. Following our recent visit to the Aphria
One facility in Leamington, Ontario, we believe the company will be one of the few LPs with sufficient
product to supply the initial recreational demand and we believe such a “first mover” advantage should
enable the company to quickly capture significant share and generate attractive unit economics in an
undersupplied market.
Potential to be a leading low-cost producer: In the long term, we believe cannabis cultivation will
become a commoditized activity. We note that the majority of LPs intend to counter this through brand
development and/or an expectation that they will be the low-cost producer. Our view is that most LPs
will not be able to generate sustainable margins from cultivation at scale, but we believe Aphria could
emerge as a leading low-cost cannabis producer given the significant commercial-scale greenhouse
cultivation expertise held by the management team and the infrastructure and greenhouse culture that
is inherent in the Leamington, Ontario community. Following our recent visit to the company’s
Leamington facility, we were impressed with the level of innovation and know-how behind the
construction and design of the greenhouse, as well as the cultivation best practices being implemented.
Potential upside through participation in long-term opportunities: We believe Aphria could emerge as an
industry leader over the long term based on our view that the company’s scale will facilitate meaningful
investment in areas such as brand development, value-add formats, and the gradual legalization of
international medical markets.
Current valuation relative to peers: As a result of the perceived issues associated with Aphria’s recent
acquisition of Nuuvera, we believe there has been pressure on Aphria’s stock, resulting in a lower
valuation relative to many of the other larger LPs, and thus, provides the opportunity for a better
potential return. A further discussion of the Nuuvera transaction is found later in this report.
Our target price of $17 is based on a projected enterprise value that is about 17x our Base Case fiscal
2020 EBITDA estimate. We believe the forward multiple of 17x is appropriate based on a number of
considerations:
This is within the valuation range attributed to Canadian consumer discretionary stocks, with
Dollarama (DOL-TSX; $150.91; Market Perform) at the high end.
We note that our Base Case fiscal 2020 EBITDA estimate assumes that Aphria’s facility
expansions are only at 65% of full ramp potential versus management’s expectation that the
facilities will be close to 100% capacity by that time. In our Upside Case, we assume that the
facilities achieve 75% of full ramp and Aphria experiences firmer selling prices, and based on
that scenario, our $17 target price would represent a multiple of 12x our Upside fiscal 2020
EBITDA estimate. If the Upside scenario were to unfold, our implied target multiple would
generally be towards the lower end of the valuation range for Canadian consumer stocks.
Cannabis | Page 25 May 28, 2018This
repo
rt is
inte
nded
for C
anad
ian
& EU
dis
tribu
tion
only
. Una
utho
rized
repr
oduc
tion,
tran
smis
sion
or p
ublic
atio
n w
ithou
t the
prio
r writ
ten
cons
ent o
f BM
O Ca
pita
l Mar
kets
is s
trict
ly p
rohi
bite
d.
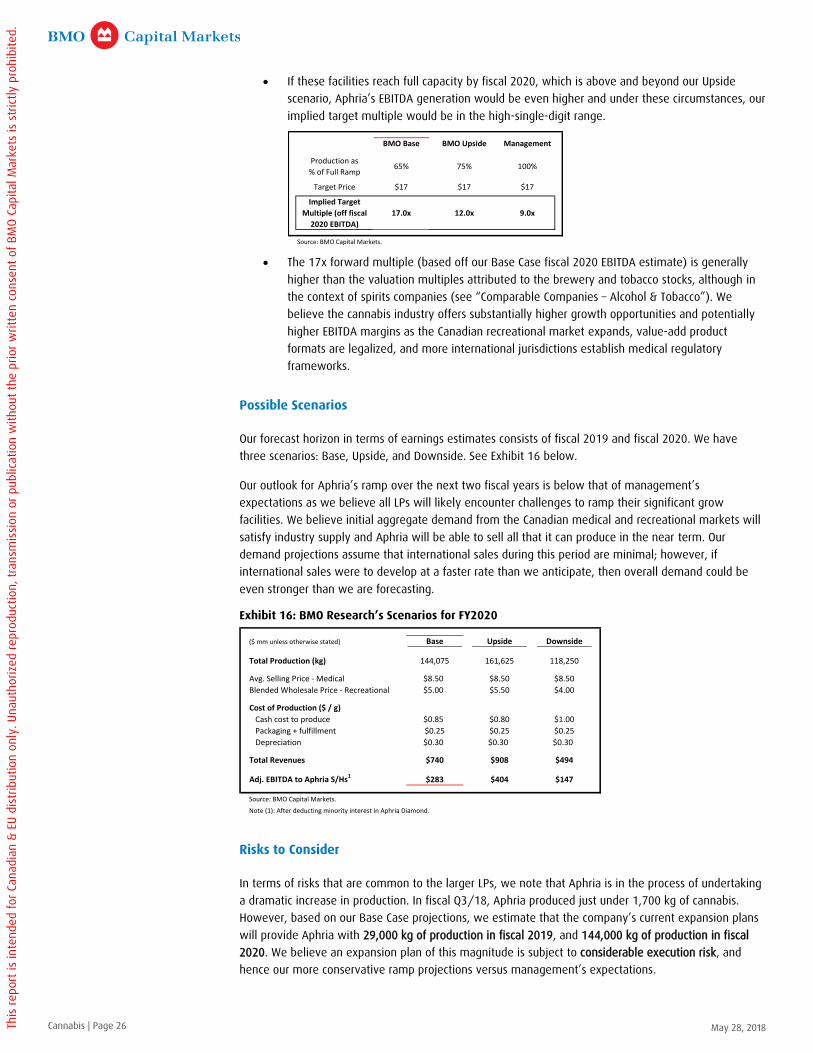
If these facilities reach full capacity by fiscal 2020, which is above and beyond our Upside
scenario, Aphria’s EBITDA generation would be even higher and under these circumstances, our
implied target multiple would be in the high-single-digit range.
The 17x forward multiple (based off our Base Case fiscal 2020 EBITDA estimate) is generally
higher than the valuation multiples attributed to the brewery and tobacco stocks, although in
the context of spirits companies (see “Comparable Companies – Alcohol & Tobacco”). We
believe the cannabis industry offers substantially higher growth opportunities and potentially
higher EBITDA margins as the Canadian recreational market expands, value-add product
formats are legalized, and more international jurisdictions establish medical regulatory
frameworks.
Possible Scenarios
Our forecast horizon in terms of earnings estimates consists of fiscal 2019 and fiscal 2020. We have
three scenarios: Base, Upside, and Downside. See Exhibit 16 below.
Our outlook for Aphria’s ramp over the next two fiscal years is below that of management’s
expectations as we believe all LPs will likely encounter challenges to ramp their significant grow
facilities. We believe initial aggregate demand from the Canadian medical and recreational markets will
satisfy industry supply and Aphria will be able to sell all that it can produce in the near term. Our
demand projections assume that international sales during this period are minimal; however, if
international sales were to develop at a faster rate than we anticipate, then overall demand could be
even stronger than we are forecasting.
Exhibit 16: BMO Research’s Scenarios for FY2020
Risks to Consider
In terms of risks that are common to the larger LPs, we note that Aphria is in the process of undertaking
a dramatic increase in production. In fiscal Q3/18, Aphria produced just under 1,700 kg of cannabis.
However, based on our Base Case projections, we estimate that the company’s current expansion plans
will provide Aphria with 29,000 kg of production in fiscal 2019, and 144,000 kg of production in fiscal
2020. We believe an expansion plan of this magnitude is subject to considerable execution risk, and
hence our more conservative ramp projections versus management’s expectations.
BMO Base BMO Upside Management
Production as
% of Full Ramp65% 75% 100%
Target Price $17 $17 $17
Implied Target
Multiple (off fiscal
2020 EBITDA)
17.0x 12.0x 9.0x
Source: BMO Capital Markets.
($ mm unless otherwise stated) Base Upside Downside
Total Production (kg) 144,075 161,625 118,250
Avg. Selling Price - Medical $8.50 $8.50 $8.50
Blended Wholesale Price - Recreational $5.00 $5.50 $4.00
Cost of Production ($ / g)
Cash cost to produce $0.85 $0.80 $1.00
Packaging + fulfillment $0.25 $0.25 $0.25
Depreciation $0.30 $0.30 $0.30
Total Revenues $740 $908 $494
Adj. EBITDA to Aphria S/Hs1
$283 $404 $147
Source: BMO Capital Markets.
Note (1): After deducting minority interest in Aphria Diamond.
Cannabis | Page 26 May 28, 2018This
repo
rt is
inte
nded
for C
anad
ian
& EU
dis
tribu
tion
only
. Una
utho
rized
repr
oduc
tion,
tran
smis
sion
or p
ublic
atio
n w
ithou
t the
prio
r writ
ten
cons
ent o
f BM
O Ca
pita
l Mar
kets
is s
trict
ly p
rohi
bite
d.

In addition, many LPs are establishing brands for the recreational market. At this time, the LPs (including
Aphria) have only provided limited details surrounding their brand development and marketing
strategies. In addition, we note that there is a strong possibility of significant regulatory restrictions on
the scope of marketing and branding activities that can be undertaken by the LPs. As a result, it is
difficult for us to assess which brands, including those of Aphria’s, will ultimately emerge with adequate
market share.
Overview of Aphria
Aphria is a Canadian-based licensed cannabis producer with two operational facilities in Ontario and
British Columbia. The company is currently expanding both facilities. In addition, the company has a
strategic relationship with Double Diamond Farms, a Leamington-based greenhouse grower, to operate
a 1.3mm sq. ft. greenhouse. See Exhibit 17 below.
Exhibit 17: Current and Future Production Facilities
International Operations
Exhibit 18: Overview of International Operations
Current Annual Production Future Annual Production
Facility Location Type
Total Size1
(sq. ft.)
Est. Annual
Production2
(kg)
Total Size1
(sq. ft.)
Base Case
Production in
FY20202 (kg)
Long-term
Potential Annual
Production2 (kg)
Aphria One Ontario Greenhouse 100,000 10,000 1,000,000 65,750 85,000
Aphria Diamond Ontario Greenhouse 1,300,000 71,825 110,500
Broken Coast B.C. Indoor 26,000 2,600 100,000 6,500 10,000
Source: Company filings, BMO Capital Markets.
Note (1): Total space includes both cultivation rooms and other space (such as offices, processing and shipping areas).
Note (2): BMO Capital Markets estimates for base case scenario.
Aphria's Presence
Country Legal Status of Cannabis
Corporate
Entity
Import &
Distribute
Strategic
Investment
Domestic
Production R&D Overview of Operations
Argentina Legal medical
Joint exclusivity on a supply agreement with an
Argentinan pharmaceutical importer and
distributor.
33% investment in Althea, a licensed Australian
medical producer. Althea intends to import
product from Aphria until construction of its
facility is complete.
Supply agreement with Medlab Clinical. First
Aphria shipment in October 2017. Medlab intends
to use the product for trials on oncology patients.
Supply agreement with an undisclosed company
that will conduct clinical trials focused on animal
health.
Colombia Legal medical Exclusive supply agreement with Colcanna SAS, a
pharmaceutical importer and distributor.
Germany Legal medical
Nuuvera: supply agreement to export 1,200 kg to
CC Pharma GmbH, a pharmaceutical distributor.
25% stake in Berlin-based Schöneberg Hospital.
Italy Legal medical Nuuvera: holds one of seven import licenses.
Lesotho Legal medical Nuuvera: supply agreement with Verve Dynamics
for THC and CBD isolates.
Malta Legal medical Acquired ASG Pharma, a GMP-certified lab that
will be a production hub for Europe.
Spain Limited legal medical
Majority interest in a licensed, GMP-certified
laboratory in Alicante.
Also a 30% stake in CAFINA to purchase cannabis
and hemp for CBD extraction.
United Kingdom Controlled substance Agreement to import pharma-grade CBD isolate
(up to 30kg / month).
Source: Company filings.
Legal medicalAustralia
Cannabis | Page 27 May 28, 2018This
repo
rt is
inte
nded
for C
anad
ian
& EU
dis
tribu
tion
only
. Una
utho
rized
repr
oduc
tion,
tran
smis
sion
or p
ublic
atio
n w
ithou
t the
prio
r writ
ten
cons
ent o
f BM
O Ca
pita
l Mar
kets
is s
trict
ly p
rohi
bite
d.
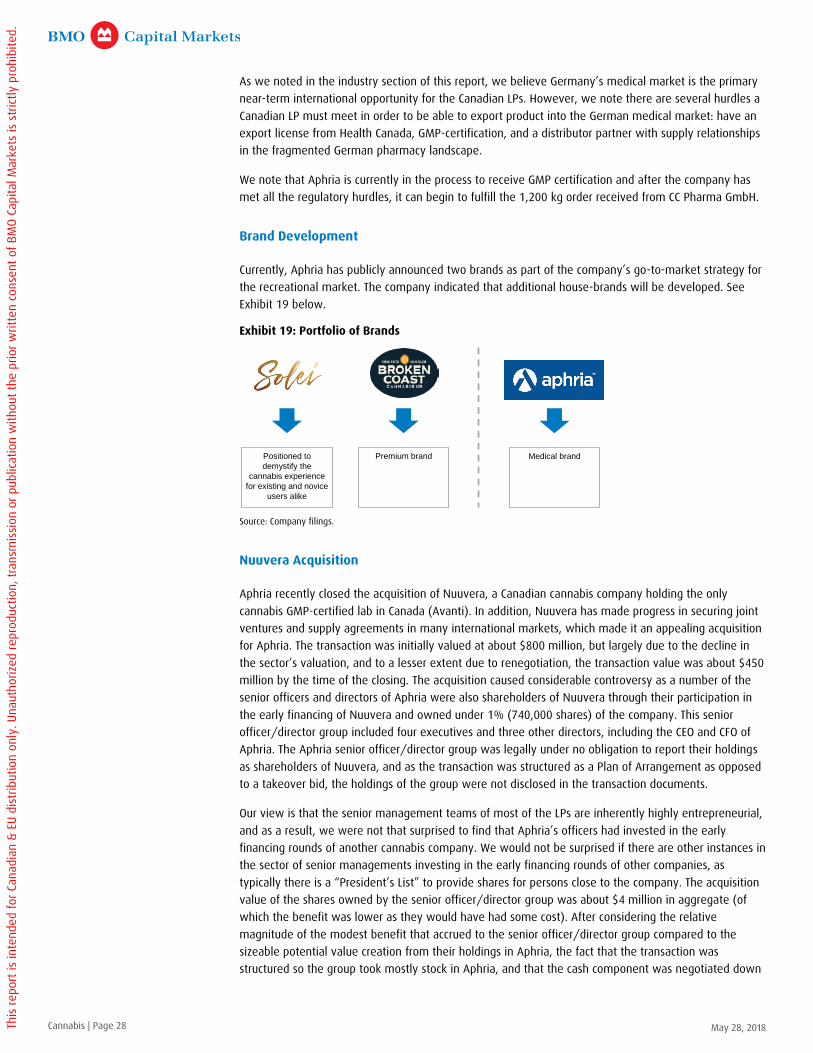
As we noted in the industry section of this report, we believe Germany’s medical market is the primary
near-term international opportunity for the Canadian LPs. However, we note there are several hurdles a
Canadian LP must meet in order to be able to export product into the German medical market: have an
export license from Health Canada, GMP-certification, and a distributor partner with supply relationships
in the fragmented German pharmacy landscape.
We note that Aphria is currently in the process to receive GMP certification and after the company has
met all the regulatory hurdles, it can begin to fulfill the 1,200 kg order received from CC Pharma GmbH.
Brand Development
Currently, Aphria has publicly announced two brands as part of the company’s go-to-market strategy for
the recreational market. The company indicated that additional house-brands will be developed. See
Exhibit 19 below.
Exhibit 19: Portfolio of Brands
Source: Company filings.
Nuuvera Acquisition
Aphria recently closed the acquisition of Nuuvera, a Canadian cannabis company holding the only
cannabis GMP-certified lab in Canada (Avanti). In addition, Nuuvera has made progress in securing joint
ventures and supply agreements in many international markets, which made it an appealing acquisition
for Aphria. The transaction was initially valued at about $800 million, but largely due to the decline in
the sector’s valuation, and to a lesser extent due to renegotiation, the transaction value was about $450
million by the time of the closing. The acquisition caused considerable controversy as a number of the
senior officers and directors of Aphria were also shareholders of Nuuvera through their participation in
the early financing of Nuuvera and owned under 1% (740,000 shares) of the company. This senior
officer/director group included four executives and three other directors, including the CEO and CFO of
Aphria. The Aphria senior officer/director group was legally under no obligation to report their holdings
as shareholders of Nuuvera, and as the transaction was structured as a Plan of Arrangement as opposed
to a takeover bid, the holdings of the group were not disclosed in the transaction documents.
Our view is that the senior management teams of most of the LPs are inherently highly entrepreneurial,
and as a result, we were not that surprised to find that Aphria’s officers had invested in the early
financing rounds of another cannabis company. We would not be surprised if there are other instances in
the sector of senior managements investing in the early financing rounds of other companies, as
typically there is a “President’s List” to provide shares for persons close to the company. The acquisition
value of the shares owned by the senior officer/director group was about $4 million in aggregate (of
which the benefit was lower as they would have had some cost). After considering the relative
magnitude of the modest benefit that accrued to the senior officer/director group compared to the
sizeable potential value creation from their holdings in Aphria, the fact that the transaction was
structured so the group took mostly stock in Aphria, and that the cash component was negotiated down
Positioned to
demystify the
cannabis experience
for existing and novice
users alike
Premium brand Medical brand
Cannabis | Page 28 May 28, 2018This
repo
rt is
inte
nded
for C
anad
ian
& EU
dis
tribu
tion
only
. Una
utho
rized
repr
oduc
tion,
tran
smis
sion
or p
ublic
atio
n w
ithou
t the
prio
r writ
ten
cons
ent o
f BM
O Ca
pita
l Mar
kets
is s
trict
ly p
rohi
bite
d.

from $1.00 to $0.62 per Nuuvera share, we do not believe that the Aphria group’s intention with respect
to the Nuuvera acquisition was contrary to the best interest of the company. However, we believe the
group did not fully appreciate the potential level of sensitivity that could be directed towards these
developments.
Other Notable Strategic Investments
Exhibit 20: Overview of Select Strategic Investments
Current Operations and KPIs: Medical Only
Given that the recreational market in Canada remains an illicit industry, Aphria’s current operations to-
date only serves the medical end market in Canada. We note that Aphria’s reported volume sold and
revenues include the wholesale of product to other LPs. See Exhibit 21 below.
Exhibit 21: Aphria KPIs
Aphria DiamondJoint venture between Aphria (51%) and Double Diamond (49%).
Construction of 1.3mm sq. ft. greenhouse.
HIKU Brands
(HIKU-CNSX)
7.5% (just under 10% diluted) interest. Aphria is listed as a preferred
supplier to HIKU.
Althea Company
33% interest. Althea is an Australian licensed medical producer.
Althea will import from Aphria until construction of its facility is
complete.
Tetra Bio-Pharma
(TBP-CSE)
Under 10% interest. Joint distribution of medical cannabis to the
Maritimes and Quebec; Aprhia will supply cannabis to Tetra for
packaging and formulation at Tetra's New Brunswick facility. Tetra is
also conducting clinical trials.
Resolve Digital
Under 10% interest. Resolve is developing a medical device system
that delivers a metered dosage of cannabis oil or bud through a pre-
package single use Smartpod.
Green Acre Capital
Cumulative investment by Aphria: $1.2mm (total commitment of
$2mm). Green Acre Capital is a private investment fund focused on
the Canadian cannabis sector.
Source: Company filings.
KPI FQ1/17 FQ2/17 FQ3/17 FQ4/17 FQ1/18 FQ2/18 FQ3/18
Market Share
Registered Patients - Canada 269,502
Registered Patients - Aphria ~40,000
Market Share by Patients 15%
Volume Sold - Canada (kg) 15,616
Volume Sold - Aphria (kg)1
585 639 653 738 852 1,237 1,428
Market Share by Volume 9%
Sales KPIs for Aphria
Total Sales ($ 000s)1
$4,376 $5,227 $5,119 $5,718 $6,120 $8,504 $10,267
Cost KPIs for Aphria ($/g)
Cash Cost to Produce Dried Cannabis $1.23 $1.26 $1.73 $1.11 $0.95 $1.45 $0.96
Packaging & Fulfillment Cost $0.14 $0.17 $0.14 $0.20 $0.20 $0.27 $0.26
Depreciation $0.43 $0.36 $0.36 $0.36 $0.46 $0.40 $0.33
Shipping cost is included in Sales & Marketing expenses.
Source: Statistics Canada, company filings.
Note (1): Includes wholesale to other LPs.
Cannabis | Page 29 May 28, 2018This
repo
rt is
inte
nded
for C
anad
ian
& EU
dis
tribu
tion
only
. Una
utho
rized
repr
oduc
tion,
tran
smis
sion
or p
ublic
atio
n w
ithou
t the
prio
r writ
ten
cons
ent o
f BM
O Ca
pita
l Mar
kets
is s
trict
ly p
rohi
bite
d.

Gearing Up for the Recreational Market
Despite the uncertainty on the date of initial legalization, provincial/territorial governments have
already begun to establish their supply chains. Most provincial/territorial governments will purchase
cannabis from LPs on a wholesale basis to distribute into the retail channel. As a result of this regulated
supply chain, securing provincial/territorial supply contracts will be critical for LPs to access recreational
markets. See Exhibit 5 in the industry section of this report for more details on each
province’s/territory’s supply chain model.
At this point, Quebec, Newfoundland & Labrador, New Brunswick, Prince Edward Island (PEI), and Yukon
have publicly announced LP suppliers. So far, Aphria has announced a supply agreement with Quebec
and New Brunswick for the recreational markets and with Shoppers Drug Mart in anticipation that future
regulations will permit pharmacies to dispense medical cannabis prescriptions. In addition, Aphria
announced that Great North Distributors (GND) will be the company’s exclusive manufacturer’s
representative for the recreational market. GND is a subsidiary of Southern Glazer, which is North
America’s largest wine and spirits distributor. See Exhibit 22 below.
Exhibit 22: Aphria’s Recreational Go-to-Market Strategy by Province
Company History and Recent Developments
Aphria’s wholly owned subsidiary, Pure Natures Wellness (PNW), which operates the Leamington
greenhouse facility (Aphria One), is licensed to produce and sell medical cannabis under the ACMPR
regulatory framework. PNW received its cultivation and sales licenses in November 2014, followed by a
sales license for cannabis extracts (i.e., oil) in August 2016. In March 2017, Aphria shares were listed on
the TSX. See Exhibit 23 below for recent notable developments.
Quebec
1 of 6 LPs
signed
3-year term
Max 12,000
kg / yr
TBD
TBD
TBD
TBD
Source: Company filings.
TBD
TBD
New Brunswick
1 of 5 LPs signed
2,500 kg
TBD
TBD
TBD
TBD
Cannabis | Page 30 May 28, 2018This
repo
rt is
inte
nded
for C
anad
ian
& EU
dis
tribu
tion
only
. Una
utho
rized
repr
oduc
tion,
tran
smis
sion
or p
ublic
atio
n w
ithou
t the
prio
r writ
ten
cons
ent o
f BM
O Ca
pita
l Mar
kets
is s
trict
ly p
rohi
bite
d.

Exhibit 23: Recent Notable Developments
CEO Profile: Vic Neufeld
Vic Neufeld was appointed CEO of Aphria in June 2014. Prior to this, Mr. Neufeld was CEO of Jamieson
Laboratories (now Jamieson Wellness) from 1993 to 2014. During his tenure as CEO, Jamieson increased
sales from $20 million to over $250 million, grew its market share from 7% to 25% and established its
brand across 44 countries. Mr. Neufeld was also previously a Partner with Ernst & Young. He holds a
Bachelor’s degree in Economics from Western University and an Honours degree in business and an MBA
from the University of Windsor.
The two founders of Aphria, Cole Cacciavillani and John Cervini, have had long careers in the agricultural
and greenhouse industry.
January 2018
Announces
acquisition of
Nuuvera
February 2018
Quebec
April 2018
Appoints Chief
Commercial Officer,
Chief Legal Officer
and governance
policies
Supply or Retail
Agreements
International
Expansion
Facility
Development
M&A / Strategic
Investments
January 2018
Announces Aphria
Diamond joint
venture
January 2018
Broken Coast facility
acquisition
March 2018
Signs jointly
exclusive supply
agreement with
Argentinian importer
January 2018
New Brunswick
March 2018
Acquires ASG
Pharma, a GMP lab
in Malta
February 2018
Signs offtake
agreement with
Verve Dynamics, a
licensed producer in
Lesotho
Source: Company filings.
May 2018
Signs exclusive
supply agreement
with Colcanna SAS,
a Colombia importer
and distributor
May 2018
Announces 25%
investment in Berlin-
based Schöneberg
Hospital
May 2018
Signed exclusive
agreement with
Great North
Distributors
Cannabis | Page 31 May 28, 2018This
repo
rt is
inte
nded
for C
anad
ian
& EU
dis
tribu
tion
only
. Una
utho
rized
repr
oduc
tion,
tran
smis
sion
or p
ublic
atio
n w
ithou
t the
prio
r writ
ten
cons
ent o
f BM
O Ca
pita
l Mar
kets
is s
trict
ly p
rohi
bite
d.

Income Statement
Aphria Inc.Income Statement for the Fiscal Year ended May 31
(amounts in C$000's except per share)
Est Est Est
2016 2017 2018 2019 2020
Old COGS reporting New COGS reporting
Revenue $8,434 $20,438 $34,482 $148,440 $740,063
Cost of goods sold, net 1,861 3,599
Amortization 590 986
Inventory production costs 8,356 41,735 202,505
Gross Margin before fair value changes 5,982 70.9% 15,854 77.6% 26,126 75.8% 106,705 71.9% 537,558 72.6%
Unrealized (gain) on changes in fair value of bio assets 5 (1,444) (11,482) - -
Inventory expensed to cost of sales 7,250 - -
Reported Gross margin 5,977 70.9% 17,298 84.6% 30,358 88.0% 106,705 71.9% 537,558 72.6%
General + administrative 2,425 28.8% 4,678 22.9% 10,502 30.5% 50,000 33.7% 80,000 10.8%
Selling, marketing + promotion 3,598 42.7% 6,664 32.6% 12,758 37.0% 90,000 60.6% 140,000 18.9%
Research + development 220 2.6% 492 2.4% 430 1.2% 5,000 3.4% 10,000 1.4%
EBITDA (267) nmf 5,463 26.7% 6,668 19.3% (38,295) -25.8% 307,558 41.6%
Adj. EBITDA attributable to Aphria shareholders1
(41,039) 282,958
0.0%
Amortization 362 4.3% 956 4.7% 2,070 6.0% 22,500 15.2% 35,000 4.7%
Impairment of intangible asset 3,500 - - -
Share-based compensation 462 2,399 16,668 32,000 35,000
Operating income (1,091) nmf (1,392) nmf (12,070) -35.0% (92,795) -62.5% 237,558 32.1%
Other (income) expenses (289) (4,996) (42,847) - -
Finance expense (income), net (728) (1,533) 8,000 13,500
Earnings before tax (802) nmf 4,332 nmf 32,310 93.7% (100,795) -67.9% 224,058 30.3%
Incom tax expense (recovery) (1,200) 134 8,139 - 56,014
Net income 398 nmf 4,198 nmf 24,171 70.1% (100,795) -67.9% 168,043 22.7%
Non-controlling interest - 1,176 10,600
Net income attributable to Aphria shareholders 24,171 70.1% (101,971) -68.7% 157,443 21.3%
Earnings per share
- Basic 0.01$ 0.04$ 0.18$ (0.40)$ 0.62$
- Diluted 0.01$ 0.04$ 0.17$ (0.38)$ 0.59$
Weighted average shares outstanding - basic 58,443 104,341 157,168 255,910 255,910
Weighted average shares outstanding - diluted 58,443 111,428 164,776 268,707 268,707
Source: Company filings, BMO Capital Markets.
Note (1): Excludes fair value changes in biological assets and non-recurring expenses. Backs out non-controlling interest.
Cannabis | Page 32 May 28, 2018This
repo
rt is
inte
nded
for C
anad
ian
& EU
dis
tribu
tion
only
. Una
utho
rized
repr
oduc
tion,
tran
smis
sion
or p
ublic
atio
n w
ithou
t the
prio
r writ
ten
cons
ent o
f BM
O Ca
pita
l Mar
kets
is s
trict
ly p
rohi
bite
d.

Cash Flow Statement
Aphria Inc.Cash Flow Statement for the Fiscal Year ended May 31
(amounts in C$000's except per share)
Est Est Est
2016 2017 2018 2019 2020
Net income (loss) after income taxes $398 $4,198 $24,171 ($100,795) $168,043
Income tax expense (recovery) (1,200) 134
Change in fair value of biological assets 5 (5,005)
Depreciation and amortization 952 1,942 2,070 22,500 35,000
Gain on sale of capital assets (7) (11)
Disposition and usage of bearer plants 67
Impairment of intangible assets 3,500
Accrued interest on convertible note advanced to debtors (34)
Profit from equity accounted investee (210)
Amortization of finance fees on long-term debt 5
Gain on marketable securities (209)
Share-based compensation 462 2,399 16,668 32,000 35,000
Unrealized gain on long-term investments (6,312)
Realized loss on long-term investments 2,741
Consulting revenue (512)
Change in non-cash working capital (1,598) 2,633 (4,488) (26,500) (33,000)
Net cash from operating activities (988) 5,326 38,421 (72,795) 205,043
Share capital issued, net of cash issuance costs 10,315 204,408 195,661 - -
Share capital issued on warrants exercised 6,065 23,039
Share capital issued on stock options exercised 975
Advances from related parties 1,140 388
Repayment of amounts due to related parties (1,140) (852)
Proceeds from long-term debt, net of finance fees 32,825 - 300,000 -
Repayment of long-term debt (644) - - -
Net cash from financing activities 16,380 260,139 195,661 300,000 -
Issuance of promissory notes receivable (200) -
Repayment of promissory notes receivable 232 568
Investment in capital assets (4,426) (66,416) (200,000) (200,000) (200,000)
Business acquisitions (55,697) - -
Proceeds from disposal of capital assets 37 33
Investment in intangible assets, net of shares issued (54) (1,306)
Convertible note advanced to debtors (1,500)
Purchase of equity investments (25,366)
Investment in marketable securities (109,269)
Proceeds from disposal of marketable securities 22,131
Investment in long-term investments (1,560) (28,097)
Proceeds from divestiture of long-term investments 7,196
Net cash from investing activities (5,971) (202,027) (255,697) (200,000) (200,000)
Net cash inflow (outflow) 9,421 63,438 (21,615) 27,205 5,043
Cash and cash equivalents, beginning 7,052 16,473 79,910 58,296 85,501
Cash and cash equivalents, end 16,473 79,910 58,296 85,501 90,544
Source: Company filings, BMO Capital Markets.
Cannabis | Page 33 May 28, 2018This
repo
rt is
inte
nded
for C
anad
ian
& EU
dis
tribu
tion
only
. Una
utho
rized
repr
oduc
tion,
tran
smis
sion
or p
ublic
atio
n w
ithou
t the
prio
r writ
ten
cons
ent o
f BM
O Ca
pita
l Mar
kets
is s
trict
ly p
rohi
bite
d.

Balance Sheet
Aphria Inc.Balance Sheet for the Fiscal Year ended May 31
(amounts in C$000's except per share)
Est Est Est
2016 2017 2018 2019 2020
Assets
Cash and equivalents $16,473 $79,910 $58,296 $85,501 $90,544
Marketable securities - 87,347 87,347 87,347 87,347
Accounts receivable 1,779 826 5,000 40,000 100,000
Other receivables 127 4,512 4,512 4,512 4,512
Inventory 2,089 3,887 3,887 3,887 3,887
Biological assets 698 1,363 1,363 1,363 1,363
Prepaid assets 160 1,060 1,500 2,000 10,000
Due from DFMMJ Investments - 464 464 464 464
Promissory notes receivable 568 -
Current assets 21,893 179,367 162,367 225,072 298,116
Capital assets 7,309 72,500 270,430 447,930 612,930
Intangible assets 4,318 1,891 1,891 1,891 1,891
Convertible note receivable 1,361 1,361 1,361 1,361
Embedded derivative 173 173 173 173
Interest in equity accounted investee 28,376 28,376 28,376 28,376
Long-term investments 1,560 27,788 27,788 27,788 27,788
Deferred tax asset 3,315 3,315 3,315 3,315
Goodwill 1,200 1,200 1,200 1,200 1,200
Other 634,758 634,758 634,758
Total Assets 36,280 315,970 1,131,659 1,371,864 1,609,907
Liabilities
Accounts payable and accrued liabilities 1,266 5,873 6,000 15,000 50,000
Deferred gain from equity accounted investee - 2,800 2,800 2,800 2,800
Current portion of promissory note payable - 878 878 878 878
Current portion of long-term debt - 765 765 765 765
Current liabilities 1,266 10,316 10,443 19,443 54,443
Promissory note payable - 366 366 366 366
Long-term debt - 31,420 31,420 331,420 331,420
Total Liabilities 1,266 42,102 42,228 351,228 386,228
Shareholders' Equity
Share capital 40,917 274,317 1,049,039 1,049,039 1,049,039
Warrants 694 445 445 445 445
Share-based payment reserve 1,724 3,230 3,230 3,230 3,230
Deficit (8,321) (4,123) 36,716 (32,079) 170,965
Total Equity 35,013 273,869 1,089,431 1,020,636 1,223,679
36,280 315,970 1,131,659 1,371,864 1,609,907
Source: Company filings, BMO Capital Markets.
Cannabis | Page 34 May 28, 2018This
repo
rt is
inte
nded
for C
anad
ian
& EU
dis
tribu
tion
only
. Una
utho
rized
repr
oduc
tion,
tran
smis
sion
or p
ublic
atio
n w
ithou
t the
prio
r writ
ten
cons
ent o
f BM
O Ca
pita
l Mar
kets
is s
trict
ly p
rohi
bite
d.

Company Coverage: Canopy
Our Investment Thesis
We are initiating coverage of Canopy Growth (Canopy) with an Outperform rating.
Near-term market leader in recreational market: In an industry where restrictive marketing and
packaging regulations may significantly limit product differentiation, we believe the key near-term
success factor for LPs will be to secure in-store shelf space for their products. However, based on our
visits to most of the larger Canadian LPs’ facilities, where many are still under construction or waiting for
licenses, we are concerned that the majority of companies will not have the inventory or production
capacity to meaningfully participate in the near-term market. We believe Canopy will be one of the few
LPs with sufficient product to supply the initial recreational demand and we believe such a “first mover”
advantage should enable the company to quickly capture significant share and generate attractive unit
economics in an undersupplied market.
Well positioned for international opportunity: We believe Canopy could be well-positioned to supply
emerging medical markets outside of Canada. We consider the company’s current international
operations to be more advanced versus most other players and Canopy appears to be laying the
groundwork in markets where medical is not yet legalized, but may soon be. In addition, the approach
to develop cultivation in “hub” regions like Denmark for export to Germany and eventually Australia for
export to the Asia-Pacific region provides the company longer-term access to these markets.
Long-term global-branded leader: We believe Canopy could emerge as a leader over the long term
given that the company’s scale will facilitate meaningful investment in areas such as brand
development, value-add formats, advanced pharmaceutical applications, and the gradual legalization of
international medical markets. We believe Canopy’s strategic alliance with Constellation Brands could
prove to be a significant advantage as the industry evolves into value-add formats, and in this particular
case, into cannabis-infused beverages.
Our target price of $45 is based on a projected enterprise value that is about 20x our Base Case fiscal
2020 EBITDA estimate. We believe the forward multiple of 20x is appropriate based on a number of
considerations:
This is within the valuation range attributed to Canadian consumer discretionary stocks, with
Dollarama at the high end.
We note that our Base Case fiscal 2020 EBITDA estimate assumes that Canopy’s facility
expansions are only at 65% of full ramp potential versus management’s expectation that the
facilities will be close to 100% capacity by that time. In our Upside Case, we assume that the
facilities achieve 75% of full ramp and Canopy experiences firmer selling prices, and based on
that scenario, our $45 target price would represent a multiple of 14.5x our Upside fiscal 2020
EBITDA estimate. If the Upside scenario were to unfold, our implied target price would
generally be in the mid-range for Canadian consumer stocks.
If these facilities reach full capacity by fiscal 2020, which is above and beyond our Upside
scenario, Canopy’s EBITDA generation would be even higher and under these circumstances,
our implied target multiple would be 11x.
BMO Base BMO Upside Management
Production as
% of Full Ramp65% 75% 100%
Target Price $45 $45 $45
Implied Target
Multiple (off fiscal
2020 EBITDA)
20.0x 14.5x 11.0x
Source: BMO Capital Markets.
Cannabis | Page 35 May 28, 2018This
repo
rt is
inte
nded
for C
anad
ian
& EU
dis
tribu
tion
only
. Una
utho
rized
repr
oduc
tion,
tran
smis
sion
or p
ublic
atio
n w
ithou
t the
prio
r writ
ten
cons
ent o
f BM
O Ca
pita
l Mar
kets
is s
trict
ly p
rohi
bite
d.
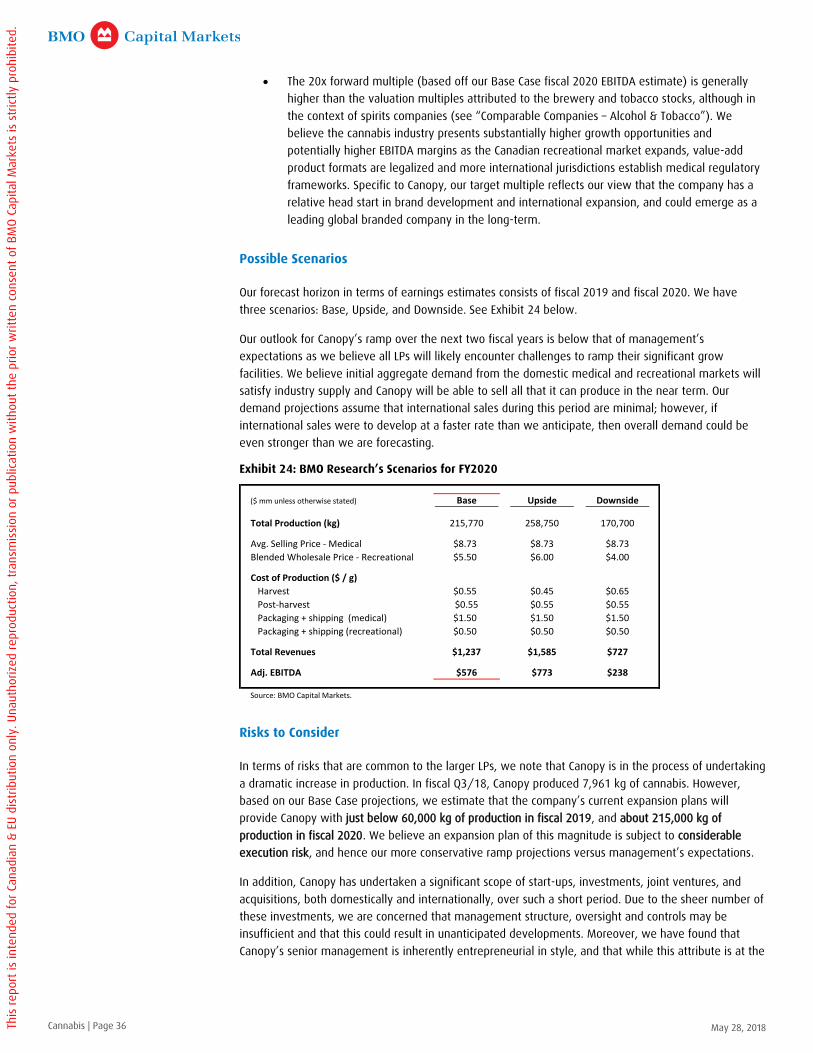
The 20x forward multiple (based off our Base Case fiscal 2020 EBITDA estimate) is generally
higher than the valuation multiples attributed to the brewery and tobacco stocks, although in
the context of spirits companies (see “Comparable Companies – Alcohol & Tobacco”). We
believe the cannabis industry presents substantially higher growth opportunities and
potentially higher EBITDA margins as the Canadian recreational market expands, value-add
product formats are legalized and more international jurisdictions establish medical regulatory
frameworks. Specific to Canopy, our target multiple reflects our view that the company has a
relative head start in brand development and international expansion, and could emerge as a
leading global branded company in the long-term.
Possible Scenarios
Our forecast horizon in terms of earnings estimates consists of fiscal 2019 and fiscal 2020. We have
three scenarios: Base, Upside, and Downside. See Exhibit 24 below.
Our outlook for Canopy’s ramp over the next two fiscal years is below that of management’s
expectations as we believe all LPs will likely encounter challenges to ramp their significant grow
facilities. We believe initial aggregate demand from the domestic medical and recreational markets will
satisfy industry supply and Canopy will be able to sell all that it can produce in the near term. Our
demand projections assume that international sales during this period are minimal; however, if
international sales were to develop at a faster rate than we anticipate, then overall demand could be
even stronger than we are forecasting.
Exhibit 24: BMO Research’s Scenarios for FY2020
Risks to Consider
In terms of risks that are common to the larger LPs, we note that Canopy is in the process of undertaking
a dramatic increase in production. In fiscal Q3/18, Canopy produced 7,961 kg of cannabis. However,
based on our Base Case projections, we estimate that the company’s current expansion plans will
provide Canopy with just below 60,000 kg of production in fiscal 2019, and about 215,000 kg of
production in fiscal 2020. We believe an expansion plan of this magnitude is subject to considerable
execution risk, and hence our more conservative ramp projections versus management’s expectations.
In addition, Canopy has undertaken a significant scope of start-ups, investments, joint ventures, and
acquisitions, both domestically and internationally, over such a short period. Due to the sheer number of
these investments, we are concerned that management structure, oversight and controls may be
insufficient and that this could result in unanticipated developments. Moreover, we have found that
Canopy’s senior management is inherently entrepreneurial in style, and that while this attribute is at the
($ mm unless otherwise stated) Base Upside Downside
Total Production (kg) 215,770 258,750 170,700
Avg. Selling Price - Medical $8.73 $8.73 $8.73
Blended Wholesale Price - Recreational $5.50 $6.00 $4.00
Cost of Production ($ / g)
Harvest $0.55 $0.45 $0.65
Post-harvest $0.55 $0.55 $0.55
Packaging + shipping (medical) $1.50 $1.50 $1.50
Packaging + shipping (recreational) $0.50 $0.50 $0.50
Total Revenues $1,237 $1,585 $727
Adj. EBITDA $576 $773 $238
Source: BMO Capital Markets.
Cannabis | Page 36 May 28, 2018This
repo
rt is
inte
nded
for C
anad
ian
& EU
dis
tribu
tion
only
. Una
utho
rized
repr
oduc
tion,
tran
smis
sion
or p
ublic
atio
n w
ithou
t the
prio
r writ
ten
cons
ent o
f BM
O Ca
pita
l Mar
kets
is s
trict
ly p
rohi
bite
d.

core of the company’s impressive development and success to date, a shift in corporate culture will be
necessary as Canopy grows and matures into a true multi-national company.
Finally, many LPs are establishing brands for the recreational market. At this time, the LPs (including
Canopy) have only provided limited details surrounding their brand development and marketing
strategies. In addition, we note that there is a high possibility of significant regulatory restrictions on the
scope of marketing and branding activities that can be undertaken by the LPs. As a result, it is difficult
for us to assess which brands, including those of Canopy’s, will ultimately emerge with adequate market
share.
Overview of Canopy
Canopy is a Canadian-based licensed cannabis producer with seven operational cultivation facilities in
Ontario, Quebec, and Saskatchewan. The company is currently in the process of expanding production
capacity in both existing and new facilities. See Exhibit 25 below.
Exhibit 25: Current and Future Production Facilities
Current Annual Production Future Annual Production
Facility Type
Total Size1
(sq. ft.)
Est. Annual
Production2
(kg)
Total Size1
(sq. ft.)
Base Case
Production in
FY20202 (kg)
Long-term
Potential Annual
Production2 (kg)
Smiths Falls, ON Indoor 168,000 9,360 450,000 15,600 24,300
Mirabel, QC Greenhouse 700,000 24,570 37,800
Niagara, ON Greenhouse 350,000 8,400 1,000,000 17,200 37,200
BC Tweed - Aldergrove4Greenhouse 1,300,000 58,500 91,000
BC Tweed - Delta4Greenhouse 1,700,000 78,000 119,000
Denmark Greenhouse 430,000 0 16,000
Newfoundland Indoor 150,000 3,000 12,000
Bowmanville, ON Indoor 75,000 6,750
Yorkton, SK Indoor 60,000 5,400
Scarborough, ON Indoor 50,000 4,500
Creemore, ON3Indoor 15,000 1,350
St. Lucien, QC Indoor 10,000 900
Source: Company filings, BMO Capital Markets.
Note (1): Total space includes both cultivation rooms and other space (such as offices, processing and shipping areas).
Note (2): BMO Capital Markets estimates from base case scenario.
Note (3): Facility is 40% owned by Canopy. Canopy has an off-take arrangement for between 75%-100% of production.
Note (4): Canopy announced that it will acquire the remaining 33% stake that it currently does not own. Expected closing in late-July 2018.
Same as current
Cannabis | Page 37 May 28, 2018This
repo
rt is
inte
nded
for C
anad
ian
& EU
dis
tribu
tion
only
. Una
utho
rized
repr
oduc
tion,
tran
smis
sion
or p
ublic
atio
n w
ithou
t the
prio
r writ
ten
cons
ent o
f BM
O Ca
pita
l Mar
kets
is s
trict
ly p
rohi
bite
d.

International Operations
Exhibit 26: Overview of International Operations
As we noted in the industry section of this report, we believe Germany’s medical market is the primary
near-term international opportunity for the Canadian LPs. However, we note there are several hurdles a
Canadian LP must meet in order to be able to export product into the German medical market: have an
export license from Health Canada, GMP-certification, and a distributor partner with supply relationships
in the fragmented German pharmacy landscape.
We understand that Canopy is one of a select number of LPs currently participating as a supplier to the
German medical market. The company announced it received approvals to export to Germany in July
2016, but we believe inventory constraints and regulatory delays in Germany has so far resulted in only
a modest amount of product being exported there. In fiscal Q3/18 ended December 2017, Canopy
shipped 78 kg (or 1% of total volume sold) to Germany.
Canopy's Presence
Country Legal Status of Cannabis
Corporate
Entity
Import &
Distribute
Domestic
Production R&D Overview of Operations
Australia Legal medical Soon
Launch of Spectrum Australia. Will establish a
facility in the State of Victoria for cultivation and
research. The facility is expected to supply other
regions in Asia Pacific.
Brazil Legal medical
Partnership with Brazil company Entourage to
develop cannabis-based pharma products and
launch a clinical research plan.
Chile Legal medicalOperating as Spectrum. Partnership with a
Chilean medical cannabis company.
Czech Republic Legal medical
Acquired Annabis Medical, which will be renamed
to Spectrum Czech. Canopy will import products
for sale in Czech pharmacies.
Denmark Legal medical, domestic production Soon
Operating as Spectrum. Will export production to
the rest of Europe. 430k sq. ft. greenhouse under
development.
Germany Legal medical
Acquired MedCann GmbH to form Spektrum, a
German-based pharmaceutical distributor. Import
products for distribution to pharmacies. Also has
a GMP certified facility in Germany.
Italy Legal medical
JamaicaLegal medical. Decriminalized
recreational.Soon
Operating as Tweed. Licensed for production.
Greenhouse facility development underway.
Poland Legal medical
Spain Limited legal medical
Strategic partnership with Alcaliber SA. Canopy
has transferred 1,500 cannabis genetics to
Alcaliber.
Source: Company filings.
Cannabis | Page 38 May 28, 2018This
repo
rt is
inte
nded
for C
anad
ian
& EU
dis
tribu
tion
only
. Una
utho
rized
repr
oduc
tion,
tran
smis
sion
or p
ublic
atio
n w
ithou
t the
prio
r writ
ten
cons
ent o
f BM
O Ca
pita
l Mar
kets
is s
trict
ly p
rohi
bite
d.
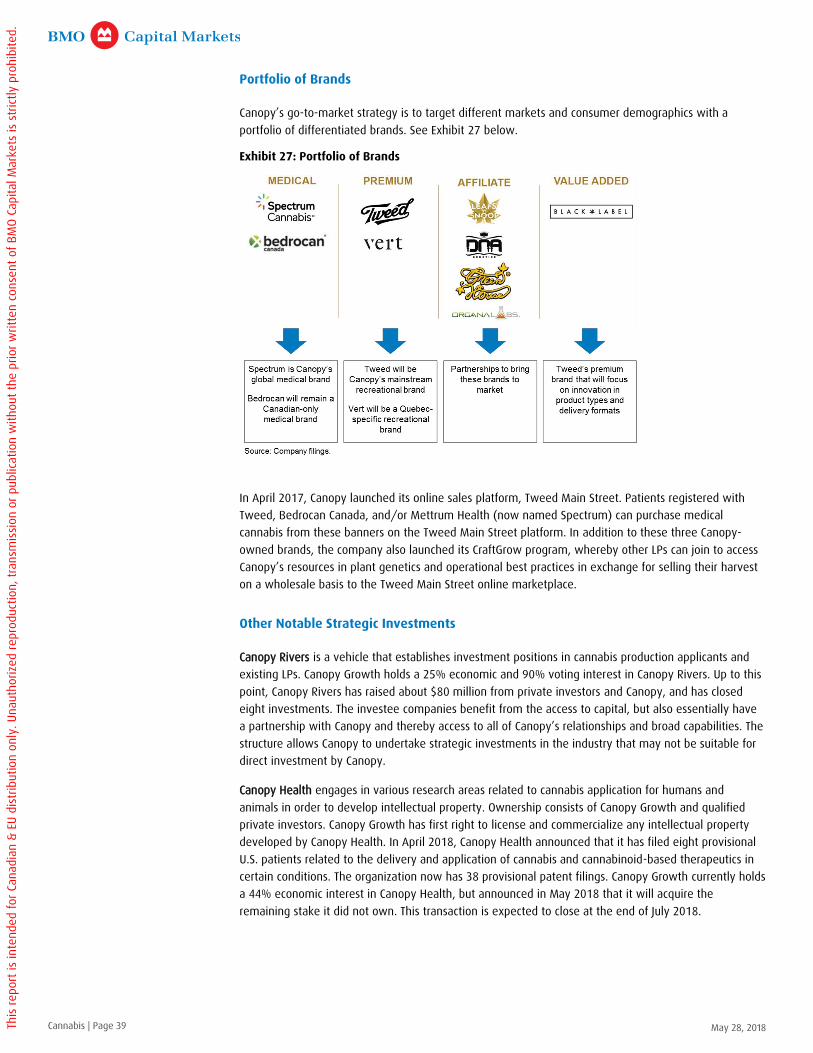
Portfolio of Brands
Canopy’s go-to-market strategy is to target different markets and consumer demographics with a
portfolio of differentiated brands. See Exhibit 27 below.
Exhibit 27: Portfolio of Brands
In April 2017, Canopy launched its online sales platform, Tweed Main Street. Patients registered with
Tweed, Bedrocan Canada, and/or Mettrum Health (now named Spectrum) can purchase medical
cannabis from these banners on the Tweed Main Street platform. In addition to these three Canopy-
owned brands, the company also launched its CraftGrow program, whereby other LPs can join to access
Canopy’s resources in plant genetics and operational best practices in exchange for selling their harvest
on a wholesale basis to the Tweed Main Street online marketplace.
Other Notable Strategic Investments
Canopy Rivers is a vehicle that establishes investment positions in cannabis production applicants and
existing LPs. Canopy Growth holds a 25% economic and 90% voting interest in Canopy Rivers. Up to this
point, Canopy Rivers has raised about $80 million from private investors and Canopy, and has closed
eight investments. The investee companies benefit from the access to capital, but also essentially have
a partnership with Canopy and thereby access to all of Canopy’s relationships and broad capabilities. The
structure allows Canopy to undertake strategic investments in the industry that may not be suitable for
direct investment by Canopy.
Canopy Health engages in various research areas related to cannabis application for humans and
animals in order to develop intellectual property. Ownership consists of Canopy Growth and qualified
private investors. Canopy Growth has first right to license and commercialize any intellectual property
developed by Canopy Health. In April 2018, Canopy Health announced that it has filed eight provisional
U.S. patients related to the delivery and application of cannabis and cannabinoid-based therapeutics in
certain conditions. The organization now has 38 provisional patent filings. Canopy Growth currently holds
a 44% economic interest in Canopy Health, but announced in May 2018 that it will acquire the
remaining stake it did not own. This transaction is expected to close at the end of July 2018.
Cannabis | Page 39 May 28, 2018This
repo
rt is
inte
nded
for C
anad
ian
& EU
dis
tribu
tion
only
. Una
utho
rized
repr
oduc
tion,
tran
smis
sion
or p
ublic
atio
n w
ithou
t the
prio
r writ
ten
cons
ent o
f BM
O Ca
pita
l Mar
kets
is s
trict
ly p
rohi
bite
d.

Current Operations and KPIs: Medical Only
Given that the recreational market in Canada remains an illicit industry, Canopy’s current operations to
date only serve the medical market, primarily in Canada. See Exhibit 28 below.
Exhibit 28: Canopy KPIs
Gearing Up for the Recreational Market
Despite the uncertainty on the date of initial legalization, provincial/territorial governments have
already begun to establish their supply chains. Most provincial/territorial governments will purchase
cannabis from LPs on a wholesale basis to distribute into the retail channel. As a result of this regulated
supply chain, securing provincial/territorial supply contracts will be critical for LPs to access recreational
markets. See Exhibit 4 in the industry section of this report for more details on each
province’s/territory’s supply chain model.
At this point, only Quebec, Newfoundland & Labrador, New Brunswick, Prince Edward Island (PEI), and
Yukon have publicly announced LP suppliers. We note that Canopy has secured supply agreements with
all four provinces and one territory. In addition, the company has secured licenses to operate retail
stores in Newfoundland and Manitoba. See Exhibit 29 below.
KPI FQ1/17 FQ2/17 FQ3/17 FQ4/17 FQ1/18 FQ2/18 FQ3/18
Market Share
Registered Patients - Canada 201,398 235,621 269,502
Registered Patients - Canopy 16,699 24,477 29,294 55,601 59,163 63,513 69,919
Market Share by Patients 29% 27% 26%
Volume Sold - Canada (kg) 12,090 13,574 15,616
Volume Sold - Canopy (kg) 984 1,169 1,245 1,740 1,830 2,020 2,330
Market Share by Volume 15% 15% 15%
Implied gram per patient - Canada 60 58 58
Implied gram per patient - Canopy 59 48 43 31 31 32 33
Sales KPIs for Canopy
Medical Cannabis Sales ($ 000s) $6,979 $8,197 $9,163 $13,976 $14,568 $16,140 $19,340
Avg. Selling Price ($/g) $7.09 $7.01 $7.36 $8.03 $7.96 $7.99 $8.30
Sales Mix - % Dried Flower 94% 86% 86% 78% 81% 82% 77%
Sales Mix - % Oils & Gel Capsules 6% 14% 14% 22% 19% 18% 23%
Cost KPIs for Canopy ($/g) F2017 not comparable to F2018 due to restatements
Cash Harvest Cost $1.10 $0.99 $0.87 $0.86 $0.76 $0.72 $0.59
Cash Post-harvest Cost $0.54 $0.71 $0.54 $0.60 $0.51 $0.53 $0.44
Shipping, Fulfillment & Packaging $1.01 $1.01 $1.17 $1.44 $1.50 $1.48 $1.50
Depreciation related to cultivation is included in overall depreciation expense.
Source: Statistics Canada, company filings.
Cannabis | Page 40 May 28, 2018This
repo
rt is
inte
nded
for C
anad
ian
& EU
dis
tribu
tion
only
. Una
utho
rized
repr
oduc
tion,
tran
smis
sion
or p
ublic
atio
n w
ithou
t the
prio
r writ
ten
cons
ent o
f BM
O Ca
pita
l Mar
kets
is s
trict
ly p
rohi
bite
d.
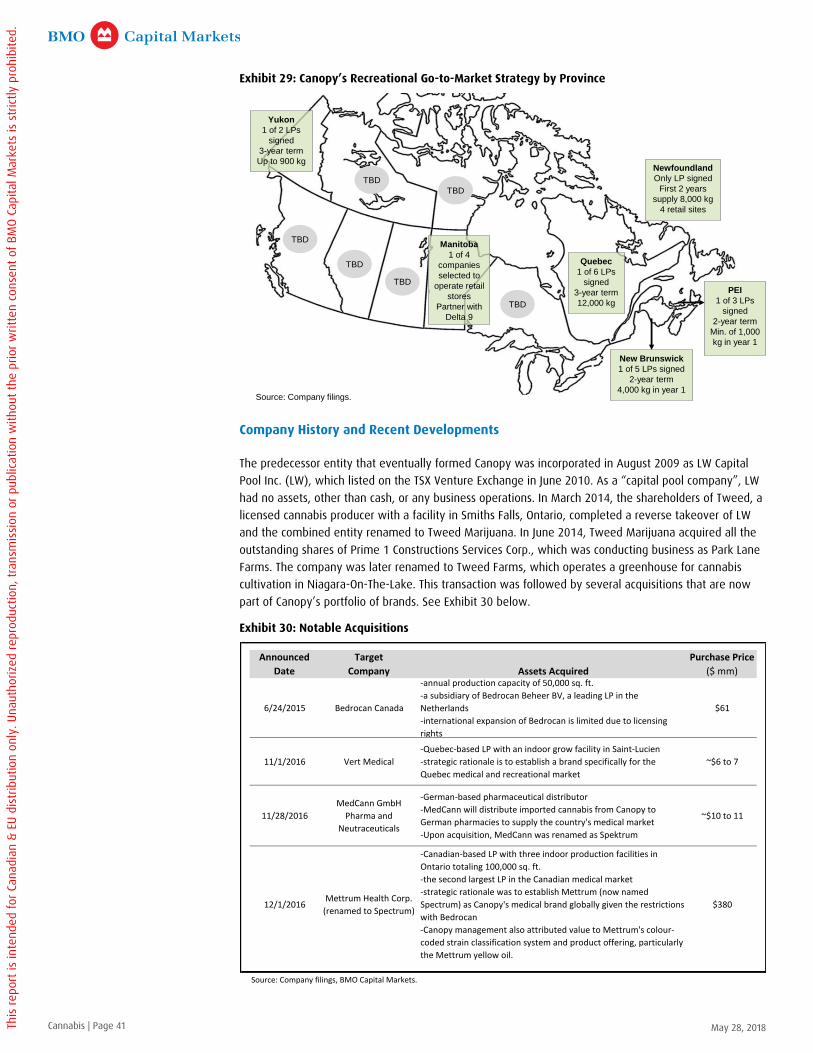
Exhibit 29: Canopy’s Recreational Go-to-Market Strategy by Province
Company History and Recent Developments
The predecessor entity that eventually formed Canopy was incorporated in August 2009 as LW Capital
Pool Inc. (LW), which listed on the TSX Venture Exchange in June 2010. As a “capital pool company”, LW
had no assets, other than cash, or any business operations. In March 2014, the shareholders of Tweed, a
licensed cannabis producer with a facility in Smiths Falls, Ontario, completed a reverse takeover of LW
and the combined entity renamed to Tweed Marijuana. In June 2014, Tweed Marijuana acquired all the
outstanding shares of Prime 1 Constructions Services Corp., which was conducting business as Park Lane
Farms. The company was later renamed to Tweed Farms, which operates a greenhouse for cannabis
cultivation in Niagara-On-The-Lake. This transaction was followed by several acquisitions that are now
part of Canopy’s portfolio of brands. See Exhibit 30 below.
Exhibit 30: Notable Acquisitions
Quebec
1 of 6 LPs
signed
3-year term
12,000 kg
Yukon
1 of 2 LPs
signed
3-year term
Up to 900 kgNewfoundland
Only LP signed
First 2 years
supply 8,000 kg
4 retail sites
New Brunswick
1 of 5 LPs signed
2-year term
4,000 kg in year 1
PEI
1 of 3 LPs
signed
2-year term
Min. of 1,000
kg in year 1
TBD
TBD
TBD
TBD
TBD
TBD
Source: Company filings.
Manitoba
1 of 4
companies
selected to
operate retail
stores
Partner with
Delta 9
Announced
Date
Target
Company Assets Acquired
Purchase Price
($ mm)
6/24/2015 Bedrocan Canada
-annual production capacity of 50,000 sq. ft.
-a subsidiary of Bedrocan Beheer BV, a leading LP in the
Netherlands
-international expansion of Bedrocan is limited due to licensing
rights
$61
11/1/2016 Vert Medical
-Quebec-based LP with an indoor grow facility in Saint-Lucien
-strategic rationale is to establish a brand specifically for the
Quebec medical and recreational market
~$6 to 7
11/28/2016
MedCann GmbH
Pharma and
Neutraceuticals
-German-based pharmaceutical distributor
-MedCann will distribute imported cannabis from Canopy to
German pharmacies to supply the country's medical market
-Upon acquisition, MedCann was renamed as Spektrum
~$10 to 11
12/1/2016Mettrum Health Corp.
(renamed to Spectrum)
-Canadian-based LP with three indoor production facilities in
Ontario totaling 100,000 sq. ft.
-the second largest LP in the Canadian medical market
-strategic rationale was to establish Mettrum (now named
Spectrum) as Canopy's medical brand globally given the restrictions
with Bedrocan
-Canopy management also attributed value to Mettrum's colour-
coded strain classification system and product offering, particularly
the Mettrum yellow oil.
$380
Source: Company filings, BMO Capital Markets.
Cannabis | Page 41 May 28, 2018This
repo
rt is
inte
nded
for C
anad
ian
& EU
dis
tribu
tion
only
. Una
utho
rized
repr
oduc
tion,
tran
smis
sion
or p
ublic
atio
n w
ithou
t the
prio
r writ
ten
cons
ent o
f BM
O Ca
pita
l Mar
kets
is s
trict
ly p
rohi
bite
d.
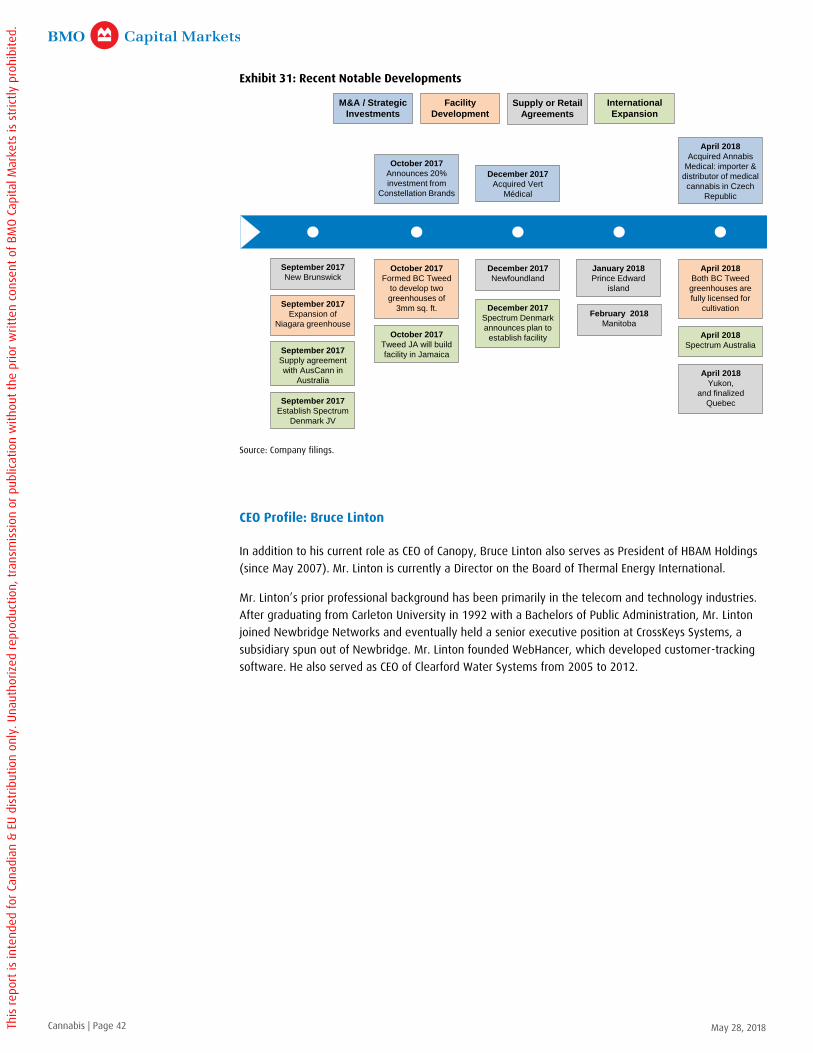
Exhibit 31: Recent Notable Developments
Source: Company filings.
CEO Profile: Bruce Linton
In addition to his current role as CEO of Canopy, Bruce Linton also serves as President of HBAM Holdings
(since May 2007). Mr. Linton is currently a Director on the Board of Thermal Energy International.
Mr. Linton’s prior professional background has been primarily in the telecom and technology industries.
After graduating from Carleton University in 1992 with a Bachelors of Public Administration, Mr. Linton
joined Newbridge Networks and eventually held a senior executive position at CrossKeys Systems, a
subsidiary spun out of Newbridge. Mr. Linton founded WebHancer, which developed customer-tracking
software. He also served as CEO of Clearford Water Systems from 2005 to 2012.
April 2018
Acquired Annabis
Medical: importer &
distributor of medical
cannabis in Czech
Republic
February 2018
Manitoba
April 2018
Yukon,
and finalized
Quebec
April 2018
Spectrum Australia
April 2018
Both BC Tweed
greenhouses are
fully licensed for
cultivation
Supply or Retail
Agreements
International
Expansion
Facility
Development
M&A / Strategic
Investments
December 2017
Newfoundland
October 2017
Announces 20%
investment from
Constellation Brands
December 2017
Acquired Vert
Médical
October 2017
Formed BC Tweed
to develop two
greenhouses of
3mm sq. ft. December 2017
Spectrum Denmark
announces plan to
establish facilityOctober 2017
Tweed JA will build
facility in Jamaica
September 2017
New Brunswick
September 2017
Expansion of
Niagara greenhouse
September 2017
Supply agreement
with AusCann in
Australia
September 2017
Establish Spectrum
Denmark JV
January 2018
Prince Edward
island
Cannabis | Page 42 May 28, 2018This
repo
rt is
inte
nded
for C
anad
ian
& EU
dis
tribu
tion
only
. Una
utho
rized
repr
oduc
tion,
tran
smis
sion
or p
ublic
atio
n w
ithou
t the
prio
r writ
ten
cons
ent o
f BM
O Ca
pita
l Mar
kets
is s
trict
ly p
rohi
bite
d.
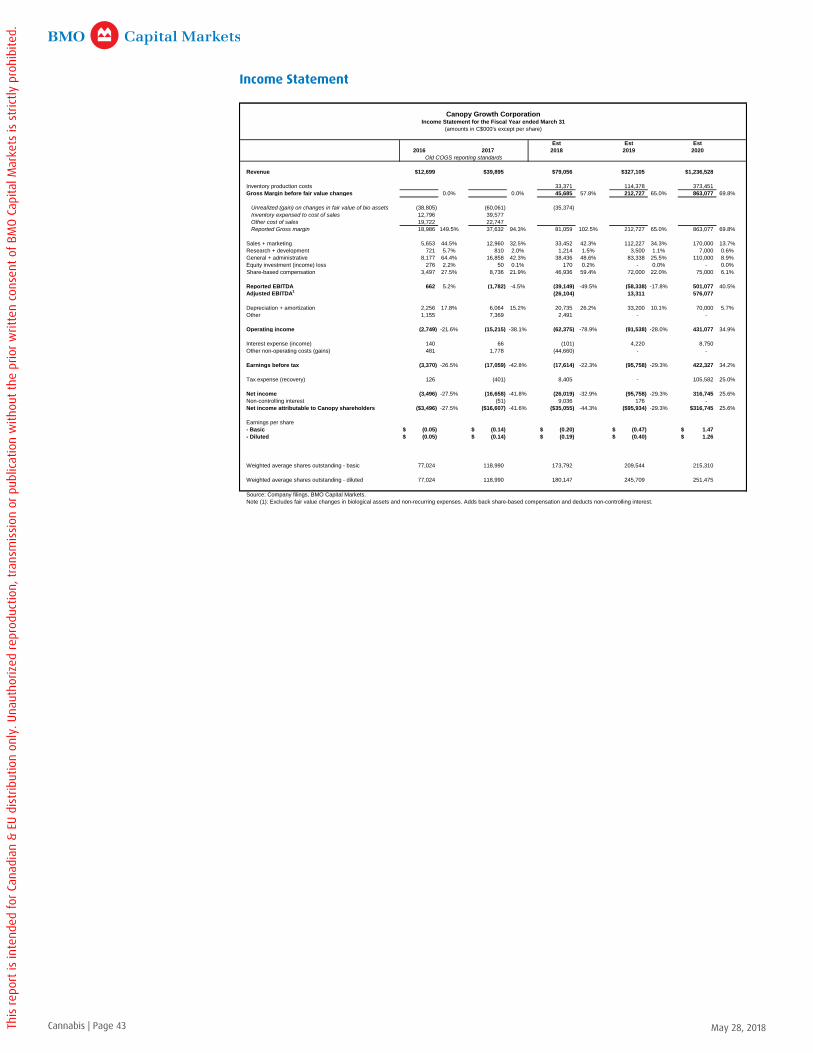
Income Statement
Canopy Growth CorporationIncome Statement for the Fiscal Year ended March 31
(amounts in C$000's except per share)
Est Est Est
2016 2017 2018 2019 2020
Old COGS reporting standards
Revenue $12,699 $39,895 $79,056 $327,105 $1,236,528
Inventory production costs 33,371 114,378 373,451
Gross Margin before fair value changes 0.0% 0.0% 45,685 57.8% 212,727 65.0% 863,077 69.8%
Unrealized (gain) on changes in fair value of bio assets (38,805) (60,061) (35,374)
Inventory expensed to cost of sales 12,796 39,577
Other cost of sales 19,722 22,747
Reported Gross margin 18,986 149.5% 37,632 94.3% 81,059 102.5% 212,727 65.0% 863,077 69.8%
Sales + marketing 5,653 44.5% 12,960 32.5% 33,452 42.3% 112,227 34.3% 170,000 13.7%
Research + development 721 5.7% 810 2.0% 1,214 1.5% 3,500 1.1% 7,000 0.6%
General + administrative 8,177 64.4% 16,858 42.3% 38,436 48.6% 83,338 25.5% 110,000 8.9%
Equity investment (income) loss 276 2.2% 50 0.1% 170 0.2% - 0.0% - 0.0%
Share-based compensation 3,497 27.5% 8,736 21.9% 46,936 59.4% 72,000 22.0% 75,000 6.1%
Reported EBITDA 662 5.2% (1,782) -4.5% (39,149) -49.5% (58,338) -17.8% 501,077 40.5%
Adjusted EBITDA1
(26,104) 13,311 576,077
Depreciation + amortization 2,256 17.8% 6,064 15.2% 20,735 26.2% 33,200 10.1% 70,000 5.7%
Other 1,155 7,369 2,491 - -
Operating income (2,749) -21.6% (15,215) -38.1% (62,375) -78.9% (91,538) -28.0% 431,077 34.9%
Interest expense (income) 140 66 (101) 4,220 8,750
Other non-operating costs (gains) 481 1,778 (44,660) - -
Earnings before tax (3,370) -26.5% (17,059) -42.8% (17,614) -22.3% (95,758) -29.3% 422,327 34.2%
Tax expense (recovery) 126 (401) 8,405 - 105,582 25.0%
Net income (3,496) -27.5% (16,658) -41.8% (26,019) -32.9% (95,758) -29.3% 316,745 25.6%
Non-controlling interest (51) 9,036 176 -
Net income attributable to Canopy shareholders ($3,496) -27.5% ($16,607) -41.6% ($35,055) -44.3% ($95,934) -29.3% $316,745 25.6%
Earnings per share
- Basic (0.05)$ (0.14)$ (0.20)$ (0.47)$ 1.47$
- Diluted (0.05)$ (0.14)$ (0.19)$ (0.40)$ 1.26$
Weighted average shares outstanding - basic 77,024 118,990 173,792 209,544 215,310
Weighted average shares outstanding - diluted 77,024 118,990 180,147 245,709 251,475
Source: Company filings, BMO Capital Markets.
Note (1): Excludes fair value changes in biological assets and non-recurring expenses. Adds back share-based compensation and deducts non-controlling interest.
Cannabis | Page 43 May 28, 2018This
repo
rt is
inte
nded
for C
anad
ian
& EU
dis
tribu
tion
only
. Una
utho
rized
repr
oduc
tion,
tran
smis
sion
or p
ublic
atio
n w
ithou
t the
prio
r writ
ten
cons
ent o
f BM
O Ca
pita
l Mar
kets
is s
trict
ly p
rohi
bite
d.

Cash Flow Statement
Canopy Growth CorporationCash Flow Statement for the Fiscal Year ended March 31
(amounts in C$000's except per share)
Est Est Est
2016 2017 2018 2019 2020
Net income (loss) after income taxes ($3,496) ($16,658) (26,019) (95,758) 316,745
Depreciation and amortization 2,256 6,064 20,735 33,200 70,000
Share of loss (gain) in equity investment 276 50
Unrealized (gain) on change in fair value of bio assets (38,805)$ (60,061) (35,374)$
Net changes in inventory and biological assets 20,063 34,761
Share-based compensation 3,678 10,043 46,936 72,000 75,000
Non-cash acquisition costs 1,333
Loss on disposal of property, plant and equipment 661
Income tax (recovery) expense 126 (401)
Increase in fair value of acquisition consideration related liabilities 481 1,193
Changes in non-cash operating working capital items 1,544 (4,078) (4,836) (25,000) (36,000)
Other 350
Net cash from operating activities (13,527) (27,093) 1,442 (15,558) 425,745
Purchases of property, plant and equipment (12,196) (29,391) (130,000) (400,000) (300,000)
Purchases of intangible assets (141)
Purchase of acquisitions 1,054 11,193 - (1,000) -
Proceeds on disposals of property and equipment 37
Purchases of restricted investment (236) (300)
Net cash from investing activities (11,378) (18,602) (130,000) (401,000) (300,000)
Proceeds from issuance of common shares 14,376 130,276 269,990 - -
Proceeds from exercise of stock options 319 6,961
Proceeds from exercise of warrants 7,703 126
Payment of share issue costs (1,642) (8,066)
Issuance of long-term debt 3,500 - 175,000 -
Increase in capital lease obligations 260
Repayment of long-term debt (1,900) (959) - - -
Net cash from financing activities 18,856 132,098 269,990 175,000 -
Net cash inflow (outflow) (6,049) 86,403 141,432 (241,558) 125,745
Cash and cash equivalents, beginning 21,446 15,397 101,800 243,232 1,674
Cash and cash equivalents, end 15,397 101,800 243,232 1,674 127,419
Source: Company filings, BMO Capital Markets.
Cannabis | Page 44 May 28, 2018This
repo
rt is
inte
nded
for C
anad
ian
& EU
dis
tribu
tion
only
. Una
utho
rized
repr
oduc
tion,
tran
smis
sion
or p
ublic
atio
n w
ithou
t the
prio
r writ
ten
cons
ent o
f BM
O Ca
pita
l Mar
kets
is s
trict
ly p
rohi
bite
d.

Balance Sheet
Canopy Growth CorporationBalance Sheet for the Fiscal Year ended March 31
(amounts in C$000's except per share)
Est Est Est
2016 2017 2018 2019 2020
Assets
Cash and equivalents $15,397 $101,800 $243,232 $1,674 $127,419
Restricted short-term investments 550 550 550 550
Accounts receivable 1,486 5,815 7,000 50,000 100,000
Biological assets 5,321 13,643 49,017 49,017 49,017
Inventory 22,153 45,981 45,981 45,981 45,981
Prepaid expenses and other assets 489 3,735 4,000 4,000 10,000
Assets held for sale 6,180 6,180 6,180 6,180
Current assets 44,846 177,704 355,960 157,402 339,147
Property, plant and equipment 44,984 96,270 205,535 572,335 802,335
Intangible assets 31,861 162,263 162,263 162,263 162,263
Goodwill 20,886 241,371 241,371 241,371 241,371
Other 804 - - 1,000 1,000
Total Assets 143,381 677,608 965,129 1,134,371 1,546,116
Liabilities
Accounts payable and accrued liabilities 6,107 15,386 12,000 30,000 50,000
Deferred revenue 533 588 588 588 588
Current portion of long-term debt 553 1,691 1,691 1,691 1,691
Current liabilities 7,193 17,665 14,279 32,279 52,279
Acquisition consideration related liabilities 1,258 - - - -
Long-term debt 3,469 8,639 8,639 183,639 183,639
Deferred tax liability 7,413 35,798 35,798 35,798 35,798
Other long-term liabilities 243 766 766 766 766
Total Liabilities 19,576 62,868 59,482 252,482 272,482
Shareholders' Equity
Share capital 131,080 621,541 891,531 891,531 891,531
Share-based reserve 5,804 23,415 23,415 23,415 23,415
Warrants 676 - - - -
Accumulated other comprehensive loss - 198 198 198 198
Retained Earnings (Deficit) (13,775) (30,382) (18,501) (42,259) 349,486
Non-controlling interest - (32) 9,004 9,004 9,004
Total Equity 123,785 614,740 905,647 881,889 1,273,634
143,361 677,608 965,129 1,134,371 1,546,116
Source: Company filings, BMO Capital Markets.
Cannabis | Page 45 May 28, 2018This
repo
rt is
inte
nded
for C
anad
ian
& EU
dis
tribu
tion
only
. Una
utho
rized
repr
oduc
tion,
tran
smis
sion
or p
ublic
atio
n w
ithou
t the
prio
r writ
ten
cons
ent o
f BM
O Ca
pita
l Mar
kets
is s
trict
ly p
rohi
bite
d.

Comparable Companies - Cannabis
Tamy Chen, CFA (416) 359-5501
Peter Sklar, CPA, CA (416) 359-5188
Cannabis Coverage
Market Fiscal Current EV / Recent Quarter # of
Share Price 52-Week Cap. EV Year Revenue EBITDA Selling Price Cash COP (2)
Volume Sold Registered
Company Rating (1) 25-May-18 High Low (C$ mm) End FY2019E FY2020E FY2019E FY2020E (C$ / gram) (C$ / gram) (kg) Patients
Canopy Growth Corporation (3) OP $35.00 $44.00 - $6.58 $8,697 $8,275 31-Mar 25.3x 6.7x 621.7x 14.4x $8.30 $1.03 2,330 69,919
Aurora Cannabis (4) $8.02 $15.20 - $1.90 $4,793 $5,002 30-Jun 41.0x 5.8x nmf 13.9x $7.99 $1.53 1,353 45,776
Aphria (3) OP $11.90 $24.75 - $4.55 $3,198 $3,173 31-May 21.4x 4.4x nmf 11.2x $8.30 $0.95 1,428 40,000
Medreleaf Corp. $24.51 $31.25 - $6.81 $2,809 $2,572 31-Mar 19.0x 6.8x 76.0x 18.3x $8.64 $1.83 1,263 n.a.
Cronos Group $7.76 $14.83 - $1.58 $1,673 $1,670 31-Dec 11.4x 5.4x 34.4x 16.1x n.a. n.c. n.a. n.a.
Hydropothecary Corporation $5.17 $5.42 - $0.75 $1,179 $1,033 31-Jul 9.6x 3.5x 45.3x 9.0x $8.99 $0.97 132 n.a.
The Green Organic Dutchman $4.12 $4.25 - $3.50 $1,040 $880 31-Dec nmf nmf nmf nmf n.a. n.a. n.a. n.a.
CannTrust Holdings $8.57 $10.58 - $5.86 $877 $780 31-Dec 3.9x 2.8x 10.9x 6.8x $7.63 n.c. 982 40,000
OrganiGram Holdings $4.88 $5.68 - $1.81 $788 $738 31-Aug 6.7x 3.4x 22.6x 9.9x n.c. n.c. 348 12,957
Cannabis Wheaton $1.39 $2.97 - $0.68 $716 $602 31-Dec 3.6x 1.1x 19.6x 3.3x n.a. n.a. n.a. n.a.
Supreme Cannabis Company $1.77 $3.49 - $0.23 $594 $563 30-Jun 6.8x 3.8x 28.3x 10.3x n.a. n.a. n.a. n.a.
Emerald Health Therapeutics $4.21 $9.68 - $1.03 $557 $512 31-Dec nmf nmf nmf nmf n.a. n.a. n.a. n.a.
HIKU Brands $1.50 $4.82 - $0.55 $526 $521 31-Mar 38.2x 6.8x nmf 31.3x n.a. n.a. n.a. n.a.
Namaste Technologies $1.47 $1.75 - $0.04 $411 $359 31-Aug nmf nmf nmf nmf n.a. n.a. n.a. n.a.
Newstrike Resources $0.67 $3.30 - $0.18 $358 $321 31-Dec nmf nmf nmf nmf n.a. n.a. n.a. n.a.
Notes:
Not reflective of entire industry. This comp sheet only includes companies with a fully-diluted market capitalization value above $400 million.
N.a. = not available / disclosed. N.c. = figure disclosed by company is not comparable to other players.
(1) Stock Rating System: OP – Outperform; Mkt – Market Perform; Und. – Underperform; R – Restricted.
(2) Cash cost of production up to the point before packaging and fulfillment.
(3) Forward estimates are BMO Capital Markets.
(4) Metrics do not reflect announced acquisition of MedReleaf.
Source: Company filings, BMO Capital Markets Inc., FactSet.
BMO Capital Markets is restricted on Aurora Cannabis
Cannabis | Page 46 May 28, 2018This
repo
rt is
inte
nded
for C
anad
ian
& EU
dis
tribu
tion
only
. Una
utho
rized
repr
oduc
tion,
tran
smis
sion
or p
ublic
atio
n w
ithou
t the
prio
r writ
ten
cons
ent o
f BM
O Ca
pita
l Mar
kets
is s
trict
ly p
rohi
bite
d.

(all in USD '000s) Share Market Enterprise EV / EBITDA Sales Gross Margin (%) EBITDA Margin (%) Selling & Marketing Margin (%)
Company name Price (US$) Cap. Value 2018E 2019E 2017A 2018E 2017A 2018E 2017A 2018E
Breweries
Large cap
Ambev SA $5.51 $86,500 $84,634 13.5x 12.0x $15,003 $14,163 60.0% 63.4% 41.4% 44.2%
Anheuser-Busch InBev SA/NV $95.00 183,693 295,593 12.5x 11.7x 56,444 57,145 59.4% 64.5% 39.2% 41.4%
Diageo plc Sponsored ADR $146.34 91,938 104,496 18.1x 17.0x 15,343 16,664 46.5% 62.3% 33.9% 34.6%
Molson Coors Brewing Company Class B $61.43 13,232 24,336 9.6x 9.5x 11,003 11,019 40.1% 41.3% 22.8% 22.9%
Heineken NV $102.14 58,240 75,376 11.7x 11.0x 24,688 26,429 43.7% 42.2% 26.0% 24.4%
Carlsberg A/S Class B $113.07 17,231 20,992 10.0x 9.6x 9,372 9,496 48.8% 50.1% 23.8% 22.2%
Large-cap average 12.6x 11.8x 49.8% 54.0% 31.2% 31.6%
Mid-cap
Compania Cervecerias Unidas S.A. $13.27 $4,905 $5,173 8.4x 8.4x $2,617 $2,841 53.0% 53.2% 21.0% 21.6%
Embotelladora Andina S.A. Sponsored ADR Pfd Class A $23.49 1,853 2,820 5.0x 4.6x 2,847 3,039 42.2% NA 19.3% 18.4%
Mid-cap average 6.7x 6.5x 47.6% 53.2% 20.1% 20.0%
Small-cap
Boston Beer Company, Inc. Class A $240.05 $2,790 $2,724 16.2x 15.2x $863 $915 52.1% 53.2% 19.4% 18.4%
Craft Brew Alliance $19.35 374 406 18.6x 16.4x 207 214 31.5% 33.6% 7.9% 10.2%
Small-cap average 17.4x 15.8x 41.8% 43.4% 13.7% 14.3%
Tobacco
Large cap
British American Tobacco p.l.c. $51.51 $118,140 $179,884 11.9x 11.2x $26,066 $33,431 58.9% NA 45.4% 45.0%
Altria Group Inc $55.63 105,767 118,449 12.1x 11.4x 19,494 19,631 61.3% 61.6% 50.7% 50.0%
Philip Morris International Inc. $80.34 124,786 152,534 11.4x 10.6x 28,688 31,371 63.3% 63.0% 43.2% 42.5%
Imperial Brands PLC $36.68 35,029 51,675 10.1x 9.8x 19,355 11,393 34.7% 73.5% 27.1% 45.0%
Large-cap average 11.4x 10.7x 54.6% 66.0% 41.6% 45.6%
Mid-cap
Vector Group Ltd. $19.25 $2,587 $3,435 13.2x 11.8x $1,807 $1,868 32.1% 34.5% 14.2% 13.9%
Mid-cap average 13.2x 11.8x 32.1% 34.5% 14.2% 13.9%
Small-cap
Schweitzer-Mauduit International, Inc. $43.95 $1,350 $1,927 9.0x 8.6x $983 $1,052 28.8% 28.9% 20.4% 20.4%
Small-cap average 9.0x 8.6x 28.8% 28.9% 20.4% 20.4%
Spirits/Wine
Large cap
Constellation Brands, Inc. Class A $216.81 $40,971 $51,084 16.5x 15.1x $7,586 $8,145 50.4% 51.4% 36.5% 38.0%
Brown-Forman Corporation Class A $55.09 26,440 28,250 22.5x 20.9x NA 3,477 NA 67.8% NA 36.1%
Pernod Ricard SA $169.69 44,807 53,959 17.7x 16.8x 9,822 10,531 62.2% 62.2% 31.8% 28.9%
Large-cap average 18.9x 17.6x 56.3% 60.5% 34.1% 34.3%
Mid-cap
Vina Concha Y Toro S.A. Sponsored ADR $43.00 $1,606 $1,980 13.3x 10.9x $991 $1,062 35.7% 37.9% 13.1% 14.0%
Andrew Peller Limited Class A $13.98 $601 $768 14.7x NA NA $303 NA 40.9% NA 17.3%
Corby Spirit and Wine Limited Class A $15.69 $447 $389 12.0x 11.9x $108 $113 63.9% NA 31.6% 28.8%
Mid-cap average 13.3x 11.4x 49.8% 39.4% 22.3% 20.0%
Small-Cap
Castle Brands Inc. $1.24 $205 $244 26.3x 21.7x NA $100 NA 41.5% NA 9.3%
Truett-Hurst, Inc. Class A $1.37 6 16 NA NA 22 NA 33.5% NA NA NA
Willamette Valley Vineyards, Inc. $8.34 $41 4,465 NA NA $21 NA 61.8% NA NA NA
Small-cap average 26.3x 21.7x 47.7% 41.5% NA 9.3%
Source: FactSet.
Comparable Companies – Alcohol & Tobacco
Cannabis | Page 47 May 28, 2018This
repo
rt is
inte
nded
for C
anad
ian
& EU
dis
tribu
tion
only
. Una
utho
rized
repr
oduc
tion,
tran
smis
sion
or p
ublic
atio
n w
ithou
t the
prio
r writ
ten
cons
ent o
f BM
O Ca
pita
l Mar
kets
is s
trict
ly p
rohi
bite
d.

Glossary
Term Definition
ACMPR Access to Cannabis for Medical Purposes Regulation. Replaced the MMPR and is the current regulatory framework that oversees the legal medical cannabis market in Canada. Allows both Health Canada licensed commercial producers and approved individuals to grow. The amount that can be grown by an individual is limited.
Bill C-45 Federal legislation outlining the framework for legalizing recreational cannabis in Canada.
Cannabinoids Distinct active chemical compounds found in the cannabis plant. There are over 100 different cannabinoids that have varying effects on the human body’s receptors. The two primary cannabinoids are THC and CBD.
CBD Cannabidiol. One of the two primary cannabinoids found in the cannabis plant. Does not cause psychoactive effects. Associated with medical benefits (i.e., anti-inflammatory) and is used to treat various conditions including arthritis, diabetes, chronic pain, etc.
Cloning Involves taking a clipping off a mother plant, and planting it in a separate pot to grow its own roots. The clone then develops into a fully grown cannabis plant for harvest.
Drying Following the flowering stage, the plant is subject to a period of drying to remove all moisture and maximize its concentration of cannabinoids.
Edibles A type of value-add format. Consumables that are infused with cannabis, such as cookies, brownies, chocolates, and beverages.
Extraction A process to extract the cannabinoids and terpenes from parts of the cannabis plant into a liquid form. The two most common methods are supercritical CO2 extraction and ethanol extraction.
Flowering The third stage of the cultivation process following vegetation where the clone plant matures, developing flowers/buds with trichomes on them.
Genetics The cannabis strain’s genetic makeup (also called a genotype) that gives its effects, flavours, potency, and growth characteristics. Acts as a blueprint for the growth and development of the plant, but it is also highly influenced by its environment (see “Phenotype”).
GMP Good Manufacturing Process. A system to ensure that consistent standards are being applied to a specific process. There are various GMP standards that may only be recognized by certain jurisdictions.
Greenhouse facility A cannabis cultivation facility with a glass roof that utilizes the sun but typically contains supplemental lighting. Typically have lower capital and operating costs versus an indoor facility, but the environment cannot be as strictly controlled as an indoor facility.
Hemp A variety of cannabis that are dominant-sativa species. Produces smaller flowers, or buds. Very low in THC concentration.
Indoor facility A fully engineered and constructed building (including a roof) for cannabis cultivation. Typically have higher capital and operating costs versus a greenhouse facility. The climate can be more strictly controlled and therefore can result in higher yield and quality flower. The cultivation process is completely dependent on artificial lighting.
Indica One of the principal cannabis species. The species can be distinguished by their plant structures and leaves. The indica plant is typically shorter and bushier than sativa.
LP Health Canada licensed producer of cannabis. Typically refers to commercial producers.
Cannabis | Page 48 May 28, 2018This
repo
rt is
inte
nded
for C
anad
ian
& EU
dis
tribu
tion
only
. Una
utho
rized
repr
oduc
tion,
tran
smis
sion
or p
ublic
atio
n w
ithou
t the
prio
r writ
ten
cons
ent o
f BM
O Ca
pita
l Mar
kets
is s
trict
ly p
rohi
bite
d.

MMAR Medical Marijuana Access Regulations. Initial regulatory framework that legalized the medical cannabis market in Canada in 2001. Allowed approved individuals to grow cannabis, or appoint a designated person to grow for several individuals.
MMPR Marihuana for Medical Purposes Registration. Replaced the MMAR. Only permitted Health Canada licensed commercial producers to grow cannabis.
Mother Plant A plant that is used to make new cannabis plants through a cloning process. See “Cloning”.
Oil A liquid substance extracted from the cannabis plant which is then combined with a medium such as sunflower oil for consumption.
Phenotype The traits of the cannabis plant that the environment pulls out from the plant’s genetics. This means the same genetic being cultivated in two different facilities could yield materially different traits.
Propagation The first stage of the cultivation process following cloning where the new clone plant establishes its roots.
Sativa One of the principal cannabis species. The species can be distinguished by their plant structures and leaves. The sativa plant is generally tall, thin, and wispy.
Strain (or Hybrid) A hybrid mix of the plant species (sativa, indica), developed either through selective breeding or naturally occurring in the wild.
Terpenes Organic compounds in the cannabis plant. Gives the plant a unique smell profile.
THC Tetrahydrocannabinol. One of the two primary cannabinoids in the cannabis plant. Provides the psychoactive effect attributed to cannabis.
THC Concentrates A type of value-add format. Comes in various shapes, sizes, and forms. Contains a very high concentration of THC. Within this format category, forms of these include wax, shatter, kief, and hash.
Trichomes Crystalline or hair-like components found on the flowers of the unpollinated female cannabis plant that contain the cannabinoids, terpenes, and other compounds. Trichomes grow all over the cannabis plant, but are in highest concentration on the flowers or buds.
Value-add Formats Formats containing cannabis beyond dried flower and oils, such as vape pens, edibles, and concentrates.
Vape pen A form of consuming cannabis. Vape pens contain a cartridge that is pre-filled with cannabis oil. A battery-powered element inside the pen heats the oil into a vapour that can be inhaled.
Vegetation The second stage of the cultivation process following propagation where the clone plant experiences rapid growth. Plants at this stage are subject to a specific environment of light and nutrients to maximize the plant’s yield of unpollinated female flower buds, which has the highest concentration of cannabinoids.
Cannabis | Page 49 May 28, 2018This
repo
rt is
inte
nded
for C
anad
ian
& EU
dis
tribu
tion
only
. Una
utho
rized
repr
oduc
tion,
tran
smis
sion
or p
ublic
atio
n w
ithou
t the
prio
r writ
ten
cons
ent o
f BM
O Ca
pita
l Mar
kets
is s
trict
ly p
rohi
bite
d.

Jul 2015 Oct 2015 Jan 2016 Apr 2016 Jul 2016 Oct 2016 Jan 2017 Apr 2017 Jul 2017 Oct 2017 Jan 2018 Apr 2018
C$25
C$20
C$15
C$10
C$5
C$0
Aphria Rat ing History as of 05 /26 /2018Aphria Rat ing History as of 05 /26 /2018
Closing Price Target Price
Outperform (OP); Market Perform (Mkt ); Underperform (Und); Speculat ive (S); Suspended (Spd); Not Rated (NR); Rest ricted (R)
Source: FactSet , BMO Capital Markets
Jul 2015 Oct 2015 Jan 2016 Apr 2016 Jul 2016 Oct 2016 Jan 2017 Apr 2017 Jul 2017 Oct 2017 Jan 2018 Apr 2018
C$50
C$40
C$30
C$20
C$10
C$0
Canopy Growth Rat ing History as of 05 /26 /2018Canopy Growth Rat ing History as of 05 /26 /2018
Closing Price Target Price
Outperform (OP); Market Perform (Mkt ); Underperform (Und); Speculat ive (S); Suspended (Spd); Not Rated (NR); Rest ricted (R)
Source: FactSet , BMO Capital Markets
IMPORTANT DISCLOSURES
Analyst's Certification
We, Peter Sklar and Tamy Chen, hereby certify that the views expressed in this report accurately reflect our personal views about thesubject securities or issuers. We also certify that no part of my compensation was, is, or will be, directly or indirectly, related to the specificrecommendations or views expressed in this report.
Analysts who prepared this report are compensated based upon (among other factors) the overall profitability of BMO Capital Markets andtheir affiliates, which includes the overall profitability of investment banking services. Compensation for research is based on effectiveness ingenerating new ideas and in communication of ideas to clients, performance of recommendations, accuracy of earnings estimates, and serviceto clients.
Analysts employed by BMO Nesbitt Burns Inc. and/or BMO Capital Markets Limited are not registered as research analysts with FINRA. Theseanalysts may not be associated persons of BMO Capital Markets Corp. and therefore may not be subject to the FINRA Rule 2241 restrictions oncommunications with a subject company, public appearances and trading securities held by a research analyst account.
Company Specific Disclosures
Disclosure 1: BMO Capital Markets has undertaken an underwriting liability with respect to Canopy Growth within the past 12 months.
Disclosure 2: BMO Capital Markets has provided investment banking services with respect to Canopy Growth within the past 12 months.
Disclosure 3: BMO Capital Markets has managed or co-managed a public offering of securities with respect to Canopy Growth within the past12 months.
Disclosure 4: BMO Capital Markets or an affiliate has received compensation for investment banking services from Canopy Growth within thepast 12 months.
Disclosure 6A: Canopy Growth is a client (or was a client) of BMO Nesbitt Burns Inc., BMO Capital Markets Corp., BMO Capital Markets Limitedor an affiliate within the past 12 months: A) Investment Banking Services
Cannabis | Page 50 May 28, 2018

Disclosure 16: A research analyst has extensively viewed the material operations of Aphria and Canopy Growth.
Disclosure 18: A redacted draft of this report was previously shown to Canopy Growth (for fact checking purposes) and changes were made tothe report before publication.
Methodology and Risks to Target Price/Valuation for Aphria (APH-TSX)
Methodology: EV / EBITDA
Risks: Key risks include: the recreational cannabis industry in Canada is an emerging sector with limited and unreliable market forecasts ofdemand and other consumer trends, any adverse regulatory changes could impair the company's business model in the Canadian medicaland/or recreational markets, the company's operating history is limited, reliance on key management including Vic Neufeld (CEO) and its twofounders, Cole and John, any increase in key input costs such as utilities or labour, risks inherent in the agriculture business, product liabilityand risk of recalls, risks related to international operations (including but not limited to regulatory, economic and social volatility in thoseforeign markets).
Methodology and Risks to Target Price/Valuation for Canopy Growth (WEED-TSX)
Methodology: EV / EBITDA
Risks: Key risks include: the recreational cannabis industry in Canada is an emerging sector with limited and unreliable market forecasts ofdemand and other consumer trends, any adverse regulatory changes could impair the company's business model in the Canadian medicaland/or recreational markets, the company's operating history is limited (incorporated in 2010 and began conducting business in 2013), relianceon key management including Bruce Linton (CEO), any increase in key input costs such as utilities or labour, risks inherent in the agriculturebusiness, product liability and risk of recalls, risks related to international operations (including but not limited to regulatory, economic andsocial volatility in those foreign markets).
Distribution of Ratings (May 27, 2018)
Rating category BMO rating BMOCM USUniverse*
BMOCM US IBClients**
BMOCM US IBClients***
BMOCMUniverse****
BMOCM IBClients*****
StarMineUniverse
Buy Outperform 48.8% 18.7% 52.6% 50.2% 54.6% 55.3%
Hold Market Perform 48.9% 16.1% 45.4% 47.5% 44.2% 39.7%
Sell Underperform 2.3% 15.4% 2.1% 2.4% 1.2% 5.0%
* Reflects rating distribution of all companies covered by BMO Capital Markets Corp. equity research analysts.** Reflects rating distribution of all companies from which BMO Capital Markets Corp. has received compensation for Investment Banking servicesas percentage within ratings category.*** Reflects rating distribution of all companies from which BMO Capital Markets Corp. has received compensation for Investment Bankingservices as percentage of Investment Banking clients.**** Reflects rating distribution of all companies covered by BMO Capital Markets equity research analysts.***** Reflects rating distribution of all companies from which BMO Capital Markets has received compensation for Investment Banking servicesas percentage of Investment Banking clients.
Other Important Disclosures
For Important Disclosures on the stocks discussed in this report, please go to http://researchglobal.bmocapitalmarkets.com/Public/Company_Disclosure_Public.aspx or write to Editorial Department, BMO Capital Markets, 3 Times Square, New York, NY 10036 or EditorialDepartment, BMO Capital Markets, 1 First Canadian Place, Toronto, Ontario, M5X 1H3.
Dissemination of Research
Dissemination of BMO Capital Markets Equity Research is available via our website https://research-ca.bmocapitalmarkets.com/Public/Secure/Login.aspx? ReturnUrl=/Member/Home/ResearchHome.aspx. Institutional clients may also receive our research via Thomson Reuters, Bloomberg,FactSet, and Capital IQ. Research reports and other commentary are required to be simultaneously disseminated internally and externally to ourclients. Research coverage of licensed cannabis producers is made available only to Canadian and EU-based BMO Nesbitt Burns Inc./BMO CapitalMarkets Limited clients solely via email distribution.
~ Research distribution and approval times are provided on the cover of each report. Times are approximations as system and distributionprocesses are not exact and can vary based on the sender and recipients’ services. Unless otherwise noted, times are Eastern Standard andwhen two times are provided, the approval time precedes the distribution time.
BMO Capital Markets may use proprietary models in the preparation of reports. Material information about such models may be obtained bycontacting the research analyst directly. There is no planned frequency of updates to this report.
General Disclaimer
"BMO Capital Markets" is a trade name used by the BMO Investment Banking Group, which includes the wholesale arm of Bank of Montreal andits subsidiaries BMO Nesbitt Burns Inc., BMO Capital Markets Limited in the U.K. and BMO Capital Markets Corp. in the U.S. BMO Nesbitt Burns
Cannabis | Page 51 May 28, 2018

Inc., BMO Capital Markets Limited and BMO Capital Markets Corp are affiliates. Bank of Montreal or its subsidiaries ("BMO Financial Group") haslending arrangements with, or provide other remunerated services to, many issuers covered by BMO Capital Markets. The opinions, estimatesand projections contained in this report are those of BMO Capital Markets as of the date of this report and are subject to change without notice.BMO Capital Markets endeavours to ensure that the contents have been compiled or derived from sources that we believe are reliable andcontain information and opinions that are accurate and complete. However, BMO Capital Markets makes no representation or warranty, expressor implied, in respect thereof, takes no responsibility for any errors and omissions contained herein and accepts no liability whatsoever for anyloss arising from any use of, or reliance on, this report or its contents. Information may be available to BMO Capital Markets or its affiliates thatis not reflected in this report. The information in this report is not intended to be used as the primary basis of investment decisions, and becauseof individual client objectives, should not be construed as advice designed to meet the particular investment needs of any investor. Nothingherein constitutes any investment, legal, tax or other advice nor is it to be relied on in any investment or decision. If you are in doubt about anyof the contents of this document, the reader should obtain independent professional advice. This material is for information purposes only andis not an offer to sell or the solicitation of an offer to buy any security. BMO Capital Markets or its affiliates will buy from or sell to customersthe securities of issuers mentioned in this report on a principal basis. BMO Capital Markets or its affiliates, officers, directors or employees havea long or short position in many of the securities discussed herein, related securities or in options, futures or other derivative instruments basedthereon. The reader should assume that BMO Capital Markets or its affiliates may have a conflict of interest and should not rely solely on thisreport in evaluating whether or not to buy or sell securities of issuers discussed herein.
Additional Matters
To Canadian Residents: BMO Nesbitt Burns Inc. furnishes this report to Canadian residents and accepts responsibility for the contents hereinsubject to the terms set out above. Any Canadian person wishing to effect transactions in any of the securities included in this report shoulddo so through BMO Nesbitt Burns Inc.
The following applies if this research was prepared in whole or in part by Andrew Breichmanas, Colin Hamilton, Sanam Nourbakhsh, AlexanderPearce, David Round or Edward Sterck: This research is not prepared subject to Canadian disclosure requirements. This research is prepared byBMO Capital Markets Limited and subject to the regulations of the Financial Conduct Authority (FCA) in the United Kingdom. FCA regulationsrequire that a firm providing research disclose its ownership interest in the issuer that is the subject of the research if it and its affiliates own5% or more of the equity of the issuer. Canadian regulations require that a firm providing research disclose its ownership interest in the issuerthat is the subject of the research if it and its affiliates own 1% or more of the equity of the issuer that is the subject of the research. ThereforeBMO Capital Markets Limited will disclose its and its affiliates' ownership interest in the subject issuer only if such ownership exceeds 5% ofthe equity of the issuer.
To E.U. Residents: In an E.U. Member State this document is issued and distributed by BMO Capital Markets Limited which is authorised andregulated in the UK and operates in the E.U. on a passported basis. This document is only intended for Eligible Counterparties or ProfessionalClients, as defined in Annex II to “Markets in Financial Instruments Directive” 2014/65/EU (“MiFID II”).
Singapore: This disclaimer applies to research reports distributed by the Private Banking unit of Bank of Montreal, Singapore Branch ("BMO SG"),an exempt financial adviser under the Financial Advisers Act (Cap. 110) of Singapore ("FAA") only. This research report is prepared by BMO CapitalMarkets and distributed by BMO SG pursuant to an arrangement under regulation 32C of the Financial Advisers Regulations of Singapore. Thisresearch report is distributed by BMO SG solely to persons who qualify as accredited investors as defined in the FAA only, and is not intendedfor and may not be circulated to the general public. This report and any information contained in this report shall not be disclosed to any otherperson. If you are not an accredited investor, please disregard this report. BMO SG does not accept legal responsibility for the contents of thereport. Recipients should contact BMO SG at 65-6535 2323 for matters arising from, or in connection with the report.
To U.S. Residents: BMO Capital Markets Corp. furnishes this report to U.S. residents and accepts responsibility for the contents herein, except tothe extent that it refers to securities of Bank of Montreal. Any U.S. person wishing to effect transactions in any security discussed herein shoulddo so through BMO Capital Markets Corp.
To U.K. Residents: In the UK this document is published by BMO Capital Markets Limited which is authorised and regulated by the Financial ConductAuthority. The contents hereof are intended solely for the use of, and may only be issued or passed on to, (I) persons who have professionalexperience in matters relating to investments falling within Article 19(5) of the Financial Services and Markets Act 2000 (Financial Promotion)Order 2005 (the "Order") or (II) high net worth entities falling within Article 49(2)(a) to (d) of the Order (all such persons together referred to as"relevant persons"). The contents hereof are not intended for the use of and may not be issued or passed on to retail clients.
These documents are provided to you on the express understanding that they must be held in complete confidence and not republished,retransmitted, distributed, disclosed, or otherwise made available, in whole or in part, directly or indirectly, in hard or soft copy, through anymeans, to any person, except with the prior written consent of BMO Capital Markets.
Click here for data vendor disclosures when referenced within a BMO Capital Markets research document.
Cannabis | Page 52 May 28, 2018

ADDITIONAL INFORMATION IS AVAILABLE UPON REQUESTBMO Financial Group (NYSE, TSX: BMO) is an integrated financial services provider offering a range of retail banking, wealth management, and investment and corporate
banking products. BMO serves Canadian retail clients through BMO Bank of Montreal and BMO Nesbitt Burns. In the United States, personal and commercial bankingclients are served by BMO Harris Bank N.A., (Member FDIC). Investment and corporate banking services are provided in Canada and the US through BMO Capital Markets.
BMO Capital Markets is a trade name used by BMO Financial Group for the wholesale banking businesses of Bank of Montreal, BMO Harris Bank N.A, (Member FDIC), BMOIreland Plc, and Bank of Montreal (China) Co. Ltd. and the institutional broker dealer businesses of BMO Capital Markets Corp. (Member SIPC) in the U.S., BMO Nesbitt Burns
Inc. (Member Canadian Investor Protection Fund) in Canada, Europe, and Asia, BMO Capital Markets Limited in Europe and Australia and BMO Advisors Private Limited in India.
® Registered trademark of Bank of Montreal in the United States, Canada and elsewhere.TM Trademark Bank of Montreal
©COPYRIGHT 2018 BMO CAPITAL MARKETS CORP.
A member of Cannabis | Page 53 May 28, 2018

REAL ESTATE
REITs (Canada)Jenny Ma, CFA 416-359-4955Troy MacLean, CFA 416-359-8366
REITs (US)John P. Kim 212-885-4115R. Jeremy Metz 212-885-4053
INFORMATION TECHNOLOGY
IT Services & SoftwareKeith Bachman, CFA 212-885-4010
Communications EquipmentTim Long 212-885-4101
Information Technology Thanos Moschopoulos, CFA 416-359-5428
Semiconductors Ambrish Srivastava, Ph.D. 415-591-2116
Telecom/Media/CableTim Casey, CFA 416-359-4860
Media and InternetDaniel Salmon 212-885-4029
UTILITIES
Electric Utilities & Independent PowerBen Pham, CFA 416-359-4061
US Pipelines & MLPsDanilo Juvane, CFA 713-518-1267
MACRO
Investment StrategyBrian G. Belski 212-885-4151 416-359-5761
EconomicsDouglas Porter, CFA 416-359-4887Michael Gregory, CFA 312-845-5025 416-359-4747Earl Sweet 416-359-4407
Quantitative/TechnicalMark Steele 416-359-4641Herbert Sun 416-359-6704
Exchange Traded FundsJin Li 416-359-7689
SPECIAL PROJECTS
Special ProjectsKimberly Berman 416-359-5611
CONSUMER DISCRETIONARY
Retailing/ConsumerPeter Sklar, CPA, CA 416-359-5188
CannabisTamy Chen, CFA 416-359-5501Peter Sklar, CPA, CA 416-359-5188
RestaurantsAndrew Strelzik 212-885-4015
Toys & LeisureGerrick L. Johnson 212-883-5192
Auto PartsPeter Sklar, CPA, CA 416-359-5188
EducationJeffrey M. Silber 212-885-4063
Special SituationsStephen MacLeod, CFA 416-359-8069Jonathan Lamers, CFA 416-359-5253
CONSUMER STAPLES
Food RetailKelly Bania 212-885-4162
Food & Ag ProductsKenneth B. Zaslow, CFA 212-885-4017
Food & BeverageAmit Sharma, CFA 212-885-4132
Personal Care & Household ProductsShannon Coyne, CFA 404-926-1591
HEALTHCARE
BiotechnologyDo Kim 212-885-4091Matthew Luchini 212-885-4119
Managed Care/FacilitiesMatthew Borsch, CFA 212-885-4094
Medical TechnologyJoanne K. Wuensch 212-883-5115
PharmaceuticalsAlex Arfaei 212-885-4033Gary Nachman 212-883-5113
FINANCIALS
Canadian BanksSohrab Movahedi 416-359-7157
US Large Cap Banks & Specialty FinanceJames Fotheringham 212-885-4180
US BanksLana Chan 212-885-4109
Insurance/Diversified Financials (Canada)Tom MacKinnon, FSA, FCIA 416-359-4629
Diversified Financials (Canada)Nik Priebe, CFA 416-359-4293
ENERGY
Oil & Gas – IntegratedsRandy Ollenberger 403-515-1502
Oil & Gas – E&PJared Dziuba, CFA 403-515-3672 Phillip Jungwirth, CFA 303-436-1127Ray Kwan, P.Eng. 403-515-1501Dan McSpirit 303-436-1117Mike Murphy, P.Geol. 403-515-1540David Round +44 (0)20 7664 8052
Oil & Gas – Oilfield ServicesDaniel Boyd, CFA 713-547-0812Mike Mazar, CPA, CA, CFA 403-515-1538
MATERIALS
Commodity StrategyColin Hamilton +44 (0)20 7664 8172
Base Metals & MiningDavid Gagliano, CFA 212-885-4013Alexander Pearce +44 (0)20 7246 5435Edward Sterck +44 (0)20 7246 5421Alex Terentiew 416-359-6319
Precious Metals & MineralsAndrew Breichmanas, P.Eng. +44 (0)20 7246 5430Andrew Kaip, P. Geo. 416-359-7224Andrew Mikitchook, P.Eng., CFA 416-359-5782Sanam Nourbakhsh +44 (0)20 7664 8091Brian Quast, P. Eng., JD 416-359-6824Ryan Thompson, CFA 416-359-6814
Fertilizers & Chemicals Joel Jackson, P.Eng., CFA 416-359-4250
US Chemicals John McNulty, CFA 212-885-4031
Packaging & Forest ProductsMark Wilde, Ph.D. 212-883-5102Ketan Mamtora 212-883-5121
INDUSTRIALS
Transportation & AerospaceFadi Chamoun, CFA 416-359-6775
Diversified IndustrialsDevin Dodge, CFA 416-359-6774
Diversified Industrials & Industrial DistributionR. Scott Graham 212-885-4077
MachineryJoel Tiss 212-883-5112
Business & Industrial ServicesJeffrey M. Silber 212-885-4063
Mobility Equipment & TechnologyRichard Carlson, CFA 212-883-5141
1 First Canadian Place, P.O. Box 150, Toronto, ON M5X 1H3 416-359-4000 • 129 Saint-Jacques Street, 10th Floor, Montreal, Quebec H2Y 1L6 • 900, 525 - 8th Avenue S.W., Calgary, AB. T2P 1G1 95 Queen Victoria Street, London, U.K., EC4V 4HG • 3 Times Square, 29th Floor, New York, NY 10036 212-885-4000 • 200 Tower Place, 3348 Peachtree Road, NE, Suite 1430, Atlanta, GA 30326 100 High Street, 26th Floor, Boston, MA 02110 617-451-0670 • 600 17th Street, Suite 1704S, South Tower, Denver, CO 80202 • 700 Louisiana Street, Suite 2100, Houston, TX 77002 713-546-9746
One Market, Spear Tower, Suite 1515, San Francisco, CA 94105 415-591-2100 • 115 S. LaSalle Street, Chicago, IL 60603
Director of Canadian Equity ResearchBert Powell, CFA 416-359-5301
Associate Director − CanadaHari Sambasivam 416-359-8357
Associate Director − USTodd J. Jonasz 212-885-4051
Director of US Equity ResearchCarl Kirst, CFA 212-885-4113
Equity Research Analysts

BMO Capital Markets is a leading, full-service North American-based financial services
provider offering corporate, institutional and government clients access to a complete range
of products and services. These include equity and debt underwriting, corporate lending
and project financing, merger and acquisitions advisory services, securitization, treasury
management, market risk management, debt and equity research and institutional sales
and trading. With approximately 2,500 professionals in 30 locations around the world,
including 16 offices in North America, BMO Capital Markets works proactively with clients to
provide innovative and integrated financial solutions.
BMO Capital Markets is a member of BMO Financial Group (NYSE, TSX: BMO), one of the
largest diversified financial services providers in North America with US$591.6 billion total
assets and over 45,000 employees as at January 31, 2018. For more information, visit
www.bmocm.com/.
BMO Capital Markets is a trade name used by BMO Financial Group for the wholesale banking businesses of Bank of Montreal, BMO Harris Bank N.A, (Member FDIC), BMO Ireland Plc, and Bank of Montreal (China) Co. Ltd. and the institutional broker dealer businesses of BMO Capital Markets Corp. (Member SIPC) in the U.S., BMO Nesbitt Burns Inc. (Member Canadian Investor Protection Fund) in Canada, Europe and Asia, BMO Capital Markets Limited in Europe and Australia and BMO Advisors Private Limited in India.
® Registered trademark of Bank of Montreal in the United States, Canada and elsewhere.
www.bmocm.com
AbOuT bMO CAPITAL MArkeTS
bMO CAPITAL MArkeTSCAnAdA LeAdS The GLObAL CAnnAbIS PArAdIGM ShIFT: InITIATInG APhrIA And CAnOPy AT OuTPerFOrM