can we predict lattice energy ... - school of chemistry
TRANSCRIPT

electronic reprint
Acta Crystallographica Section B
StructuralScience
ISSN 0108-7681
Can we predict lattice energy from molecular structure?
Carole Ouvrard and John B. O. Mitchell
Copyright © International Union of Crystallography
Author(s) of this paper may load this reprint on their own web site provided that this cover page is retained. Republication of this article or itsstorage in electronic databases or the like is not permitted without prior permission in writing from the IUCr.
Acta Cryst. (2003). B59, 676–685 Ouvrard and Mitchell � Lattice energy from structure
research papers
676 Ouvrard and Mitchell � Lattice energy from structure Acta Cryst. (2003). B59, 676±685
Acta Crystallographica Section B
StructuralScience
ISSN 0108-7681
Can we predict lattice energy from molecularstructure?
Carole Ouvrard² and John B. O.
Mitchell*
Unilever Cambridge Centre for Molecular
Informatics, Department of Chemistry,
Lensfield Road, Cambridge CB2 1EW, England
² Current address: Centre for Theoretical and
Computational Chemistry, Department of
Chemistry, University College London, 20
Gordon Street, London WC1H 0AJ, England.
Correspondence e-mail: [email protected]
# 2003 International Union of Crystallography
Printed in Great Britain ± all rights reserved
By using simply the numbers of occurrences of different atom
types as descriptors, a conceptually transparent and remark-
ably accurate model for the prediction of the enthalpies of
sublimation of organic compounds has been generated. The
atom types are de®ned on the basis of atomic number,
hybridization state and bonded environment. Models of this
kind were applied ®rstly to aliphatic hydrocarbons, secondly to
both aliphatic and aromatic hydrocarbons, thirdly to a wide
range of non-hydrogen-bonding molecules, and ®nally to a set
of 226 organic compounds including 70 containing hydrogen-
bond donors and acceptors. The ®nal model gives squared
correlation coef®cients of 0.925 for the 226 compounds in the
training set and 0.937 for an independent test set of 35
compounds. The success of such a simple model implies that
the enthalpy of sublimation can be predicted accurately
without knowledge of the crystal packing. This hypothesis is in
turn consistent with the idea that, rather than being
determined by the particular features of the lowest-energy
packing, the lattice energy is similar for a number of
hypothetical alternative crystal structures of a molecule.
Received 17 July 2003
Accepted 28 August 2003
1. Introduction
The enthalpy of sublimation, �Hsub, of a solid is the experi-
mental thermodynamic quantity describing the stability of the
crystal structure. This enthalpy can be de®ned by
�Hsub � ÿElattice ÿ 2RT; �1�
where the lattice energy, Elattice, then constitutes an approx-
imation to �Hsub (Gavezzotti & Filippini, 1997).
�Hsub is thus a thermodynamic quantity of real interest, as
it quanti®es the strength of the intermolecular interactions in
the crystal structure. Various modelling methods using either
empirical or theoretically based potential energy functions are
able to calculate the lattice energy of a given experimental or
hypothetical crystal structure. The main aim of such theore-
tical calculations is usually the prediction of crystal structure.
These methods allow determination of the global minimum of
the lattice energy, or for non-rigid molecules the global
minimum of the sum of the lattice and intramolecular energies,
which is assumed to correspond to the most favourable crystal
packing (Pertsin & Kitaigorodsky, 1986; Gavezzotti & Filip-
pini, 1997; Beyer et al., 2001; Gavezzotti, 2002).
electronic reprint

As calculation of the lattice energy by such methods
requires both signi®cant computational resources and
knowledge of the crystal structure, an attractive alternative
approach is the use of predictive models based on experi-
mental thermodynamic quantities. For many molecules, the
accurately calculated lattice energy of the experimental crystal
structure is not signi®cantly different from those calculated for
several hypothetical alternative structures (Beyer et al., 2001).
Often the experimental structure is not the global minimum, at
least in the best available model potential, and sometimes
other polymorphs are also found experimentally. These
observations suggest that a plurality of different possible
crystal packings are energetically close together, within a
range of about 5±10 kJ molÿ1. Thus, it seems reasonable to
assume that it is possible to make a good prediction of lattice
energy, or almost equivalently of sublimation enthalpy, that is
independent of any knowledge or prediction of the detailed
crystal packing but dependent on the structural formula of the
monomer.
Predictive QSPR (quantitative structure±property rela-
tionship) models are widely used for the estimation of
physicochemical properties (Katritzky et al., 1995). In the
literature, most predictive models for thermodynamic quan-
tities are dedicated to the enthalpy of vaporization (Chickos et
al., 1981) or to boiling point (Horvath, 1992). In particular,
several methods of predicting the boiling points of hydro-
carbons have been proposed. These methods were initially
derived from models based on additive group contributions of
fragments (Stein & Brown, 1994), but more recently, neural-
network or multilinear-regression analyses have been
performed. For the prediction of boiling point, it has been
shown that a neural-network approach can usefully improve
the accuracy of the prediction (Egolf et al., 1994). Fewer
studies, however, are devoted to the prediction of �Hsub of
organic compounds (Aihara, 1959; Bondi, 1963; Chickos et al.,
1986; Charlton et al., 1995; Arnautova et al., 1996). Westwell et
al. (1995) presented correlations between the enthalpies of
sublimation and the melting and boiling points of a large
sample of organic and inorganic crystals. Fragment-group-
contribution approaches were proposed by Aihara (1959) and
later by Bondi (1963) for a wider range of organic and inor-
ganic compounds. Chickos et al. (1986) established a model
based on semi-empirical descriptors limited to hydrocarbons.
More recently, multilinear-regression analyses against three-
dimensional parameters have been carried out for restricted
families of compounds (Gavezzotti, 1989, 1991; Gavezzotti &
Filippini, 1992). Charlton et al. (1995) have shown that a
neural-network model does not improve the accuracy of the
predictive model for �Hsub of organic compounds compared
with a multilinear-regression analysis approach. In this work,
we thus chose to develop our model with this latter metho-
dology in order to study the relationships between simple
molecular descriptors of organic compounds and their
respective enthalpies of sublimation. In order to develop a
general method of prediction, we widened our data set to
incorporate some organic compounds containing S or halogen
atoms, as well as many more compounds restricted to carbon,
hydrogen, nitrogen and oxygen. The data set was analysed for
two kinds of molecule. Firstly, we studied �Hsub for 156
compounds in which no hydrogen bond can occur. Secondly, in
order to develop a general predictive model, we considered
both the previous set of compounds and 70 others that can
form hydrogen bonds.
2. Methodology
The predictive model was based on a multilinear-regression
analysis on a training set of 226 organic compounds containing
H, C, N, O, S, Fl, Cl, Br and I atoms. The model was then tested
on a validation data set of 35 molecules, similar in composition
to the training set. The experimental enthalpies of sublimation
were extracted from the NIST Database (Chickos, 2001).
Where more than one value was available, we selected
according to the criteria of using, where possible, one litera-
ture source for families of similar compounds and using the
more recent experimental determinations.
2.1. Structural analysis
Among the main types of molecular descriptors usually
used in QSPR analyses (Katritzky et al., 1995) we took into
account only constitutional ones. These descriptors are
derived from the two-dimensional connectivity tables of the
molecular structures. For this purpose, we applied the SATIS
algorithm (Mitchell et al., 1999) to the MOL-format ®les
describing the molecular structures. Each atom is described by
a code generated according to the atomic numbers of the atom
and of its covalent neighbours. The connectivity code of each
Acta Cryst. (2003). B59, 676±685 Ouvrard and Mitchell � Lattice energy from structure 677
research papers
Table 1De®nitions of the parameters used in the multilinear-regression analyses.
Notation De®nition
The 18 parameters used in the ®nal modelC3 Number of tertiary C atoms (C atom covalently bonded to
four atoms, one of which is an H atom)C4 Number of quaternary C atoms (C atom covalently bonded to
four non-H atoms)Carom Number of C atoms involved in an aromatic system, bonded
to three atoms of which at least two are C atomsCnoC3C4,noarom Number of C atoms that are neither branched nor aromaticCO Number of carbonyl groupsCS Number of thiocarbonyl groupsNO Number of N atoms in NO2 groupsNnitrile Number of N atoms in nitrile groupsNnonitrile Number of N atoms not in nitrile groupsNH Number of NH donor atomsOether Number of ether O atomsOH Number of OH donor atomsSO Number of S atoms bonded to O atomsSether Number of thioether S atomsF Number of F atomsCl Number of Cl atomsBr Number of Br atomsI Number of I atoms
Additional parameters used in other modelsC Number of C atomsCnoC3C4 Number of C atoms that are neither tertiary nor quaternaryN Total number of N atomsO Total number of O atoms
electronic reprint

research papers
678 Ouvrard and Mitchell � Lattice energy from structure Acta Cryst. (2003). B59, 676±685
atom gives a description of the molecular composition in terms
of the atomic number, hybridization state and bonded envir-
onment of each atom. In this paper, the descriptors are
represented by the symbols listed in Table 1.
The set of 226 molecules corresponds to a large range of
�Hsub values. The histogram shown in Fig. 1 demonstrates
that these data approximately follow a normal distribution.
The training data set is thus not restricted to a small range of
�Hsub values, and the predictive model can justi®ably be
developed for a wide range of enthalpies of sublimation.
2.2. Statistical analysis
The multilinear-regression analysis assumes that �Hsub
correlates linearly with the chosen molecular descriptors. We
®rst analysed the relationships between the enthalpy of
sublimation and each of the variables, and we observed a
linear dependence of �Hsub on every one of the parameters.
This result demonstrates that the linear behaviour is not
merely an artefact of the large number of data points. The
statistical analyses were performed using least-squares mini-
mization with Statistica software (StatSoft, 2000). In order to
avoid any redundancy or partial correlation between variables,
we analysed the Pearson correlation matrix for each regres-
sion performed. We chose the value of 0.05 as a limit for the p
level of each coef®cient. For the ®nal analysis, 18 parameters
are considered. Nevertheless, the data set of 226 compounds is
large enough to take into account 18 parameters as, for most
of the molecules, only a few of the parameters are non-zero.
2.2.1. Effects of differing temperatures of measurement.The experimental sublimation-enthalpy values used in this
work were measured at a variety of different temperatures. We
considered the possibility of adjusting them to a single refer-
ence temperature (298.15 K) using the method of Chickos
(1998). These empirical adjustments were used to reparame-
trize some of our models in order to test whether such
adjustments would give a signi®cant improvement in the
regression model.
3. Results and discussion
3.1. Choice of variables
Most crystal structure predictions and lattice-energy
calculations are based on an atom±atom interaction model.
Since the enthalpy of sublimation can be de®ned by (1), it is
usually assumed that this quantity describes the energy of the
crystal lattice and quanti®es the intermolecular forces that
occur in the crystal. In the atom±atom approach to intermol-
ecular forces, the assumption of pairwise additivity leads to the
following expression for the lattice energy, as the sum of the
interactions between pairs of atoms, i and j, belonging to two
different molecules
Elattice � 0:5P
j
P
i6�jUij: �2�
In this work, we develop a model based on constitutional
two-dimensional descriptors extracted from the connectivity
table, conversely to several previous models of �Hsub, which
used calculated topological, electrostatic, geometrical or
quantum-chemical descriptors as parameters. The numbers of
atoms of each type present in a molecule are taken as
descriptors, with atom types being de®ned by their atomic
numbers, hybridization states and bonded environments. In
effect, we assume that the energetic contribution of an inter-
action depends on the atomic numbers and the functional-
group environments of the atoms. Thus, unlike many QSPR
studies, the descriptors in our work are very simple to
understand and interpret. Obviously, some of these descrip-
tors, such as number of H atoms and number of C atoms, can
correlate within a family. For example, although the number of
H atoms correlates strongly with �Hsub, we chose as
descriptors the numbers of occurrences of heavy (non-H)
atom types, as they are assumed to describe better the
skeleton and the functional groups in the molecules. The use
of these descriptors means that the estimation of �Hsub does
not require any knowledge or assumption about the crystal
system, space group or packing arrangement of the crystal
structure.
Figure 1Histogram of the 226 experimental values of �Hsub for the training dataset.
Figure 2Relationship between �Hsub and the number of heavy atoms (C, O, N, S,F, Cl, Br and I) for non-hydrogen-bonded compounds (+ sign) and formolecules with hydrogen-bond donors (grey circles). This relationshipillustrates the gross dependence of enthalpy of sublimation on the size ofthe molecule.
electronic reprint

We ®rst observe that, for both training and validation data
sets, �Hsub increases with the number of heavy atoms, thus
indicating that �Hsub roughly depends on the size of the
molecule and also on the speci®c interactions occurring in the
crystal structure. Indeed, Fig. 2 shows two groups of points
corresponding to compounds with or without hydrogen-bond
donors. In this work, we ®rst study the behaviour of molecules
without hydrogen bonds and then develop the predictive
model for all classes of compounds, including those containing
hydrogen bonds.
3.2. Analysis of the relationships between DHsub andmolecular structures of organic compounds withouthydrogen bonds
In the case of hydrocarbons, the size dependence of �Hsub
is shown more obviously in Figs. 3 and 4 than it is when
families of compounds are not distinguished. There is a
general increase of �Hsub with the number of C atoms when
there is no speci®c interaction. Nevertheless, �Hsub correlates
according to two different relationships depending on whether
aliphatic or aromatic compounds are considered. This result is
then in agreement with the assumption that the electronic
effects are not the same for each hybridization state and
bonded environment of carbon. Consequently, we split the
hydrocarbons into two families: aliphatic and aromatic. Our
hydrocarbon data set contains only saturated alkanes and
compounds with aromatic rings. It has no unsaturated
aliphatic hydrocarbons with double or triple bonds.
3.2.1. Analysis of aliphatic hydrocarbons. We considered
®rst the case of aliphatic molecules. Here, enthalpy of subli-
mation increases with the number of C atoms in the molecule.
This behaviour has been noticed previously for�Hsub (Bondi,
1963) and boiling point (Wessel & Jurs, 1995). Conversely to
the boiling point behaviour (Wessel & Jurs, 1995), �Hsub
correlates linearly with molecular weight and also with the
number of C atoms, as illustrated in Fig. 3, such that
�Hsub=kJ molÿ1 � 0:673 � 7:265C; �3�with n = 33, r = 0.937, r2 = 0.879 and s = 13.924 kJ molÿ1.
Although the squared correlation coef®cient could be
improved from 0.879 to 0.921 by also taking into account the
number of H atoms, we retained the regressions against the
number of C atoms given by (3). Indeed, the partial correla-
tion between the variables C and H is so high (r2 = 0.949) that
they could not both be considered in the same analysis.
Fig. 4 shows the lowering of �Hsub for branched systems.
For the same number of C atoms, �Hsub is lower than for the
corresponding linear alkane. Indeed, a C atom bonded to
more than two non-H atoms becomes sterically hindered and
less accessible to intermolecular interactions. Thus, the inter-
actions with its neighbours are weaker than for a C atom
covalently bonded to two or three H atoms. If we apply (3) to
the case of branched systems, �Hsub is always overestimated
compared with experimental values, and the largest residuals
between predicted values from (3) and experimental values
correspond to adamantyl derivatives or t-butylmethane.
Regression equation (4) takes into account the number of
branched C atoms, C4 and C3
�Hsub=kJ molÿ1 � 2:141 � 3:416C3
ÿ 1:479C4 � 7:812CnoC3C4; �4�with n = 33, r = 0.980, r2 = 0.968 and s = 7.414 kJ molÿ1.
However, this modi®cation does not signi®cantly improve
either the correlation coef®cient or the standard deviation
compared with (5)
�Hsub=kJ molÿ1 � 3:703 � 7:724CnoC3C4; �5�with n = 33, r = 0.979, r2 = 0.959 and s = 8.117 kJ mol±1.
Indeed, our sample contains few molecules with tertiary or
quaternary C atoms, and the coef®cients of C4 and C3 are not
statistically reliable, as their standard errors are of similar
magnitudes to the actual coef®cients. As the number of
branched C atoms does not strongly in¯uence �Hsub, and the
C3 and C4 parameters are not necessary for this model, we
retained (5) as the predictive model for alkanes.
Simple linear alkanes are known to exhibit an odd±even
alternation in their melting points and related properties, for
Acta Cryst. (2003). B59, 676±685 Ouvrard and Mitchell � Lattice energy from structure 679
research papers
Figure 4Trendline for linear alkanes (open circles), highlighting the speci®cbehaviour of the enthalpy of sublimation for branched hydrocarbons.Adamantyl derivatives (open triangles) and tertiary or quaternarysystems (®lled triangles) show a systematic lowering of the enthalpy ofsublimation compared with analogous linear molecules. Cyclic alkanes(®lled circles) behave similarly only for high numbers of C atoms.
Figure 3Linear and non-linear dependence of, respectively, the enthalpy ofsublimation (grey circles) and boiling point (open squares) on the numberof C atoms for linear alkanes.
electronic reprint
research papers
680 Ouvrard and Mitchell � Lattice energy from structure Acta Cryst. (2003). B59, 676±685
reasons related to crystal packing (Boese et al., 1999). As
expected, this trend is seen in the sublimation energy data, as
is apparent from the alternation of open circles above and
below the trendline in Fig. 4 (although not all the relevant
straight-chain alkanes are in our data set). For this speci®c
homologous series, and probably also for a few related series
of linear monofunctional molecules, the multilinear regression
could be improved by including the parity of the chain length
as a parameter. This method would, however, not be applic-
able to branched hydrocarbons, let alone to the diversity of
organic molecules we seek to model, and hence we chose not
to include such a parameter.
3.2.2. Analysis of aromatic hydrocarbons. For both satu-
rated and aromatic hydrocarbons, �Hsub tends to correlate
linearly with the number of C atoms. Conversely to the work
of Charlton et al. (1995), in which only the number of C atoms
was retained, we differentiated between C atoms according to
their hybridization states and bonded environments.
A multilinear-regression analysis with the parameters C3,
C4, Carom and CnoC3C4,noarom was performed for the 50 hydro-
carbons of our data set
�Hsub=kJ molÿ1 � 2:929 � 3:367C3
ÿ 1:542C4 � 6:270Carom
� 7:746CnoC3C4;noarom; �6�with n = 50, r = 0.982, r2 = 0.965 and s = 6.981 kJ molÿ1. This
analysis also gives a small negative coef®cient (ÿ1.542) for
quaternary C atoms. Its size and negative value is consistent
with the lowering of �Hsub seen in Fig. 4. The large uncer-
tainty of this coef®cient (�1:2) and the calculated p level
(0.202) attest to its non-reliability in this analysis.
Contrary to chemical intuition (Fig. 4), neither the standard
deviation nor the correlation coef®cient is signi®cantly
improved by the addition of C3 and C4 parameters to the
multilinear-regression analysis. Nevertheless, these para-
meters will be considered for inclusion in subsequent models
of larger data sets, as we assume that the large uncertainty in
the coef®cients is only due to the small number of molecules in
the hydrocarbon data set that contain such branched atoms.
For this data set, we thus use (7), in which only the number
of aromatic C atoms and the number of non-branched C atoms
are considered
�Hsub=kJ molÿ1 � 4:162 � 6:185Carom
� 7:680CnoC3C4;noarom; �7�with n = 50, r = 0.979, r2 = 0.958 and s = 7.478 kJ molÿ1.
Even though the correlation coef®cient is not improved in
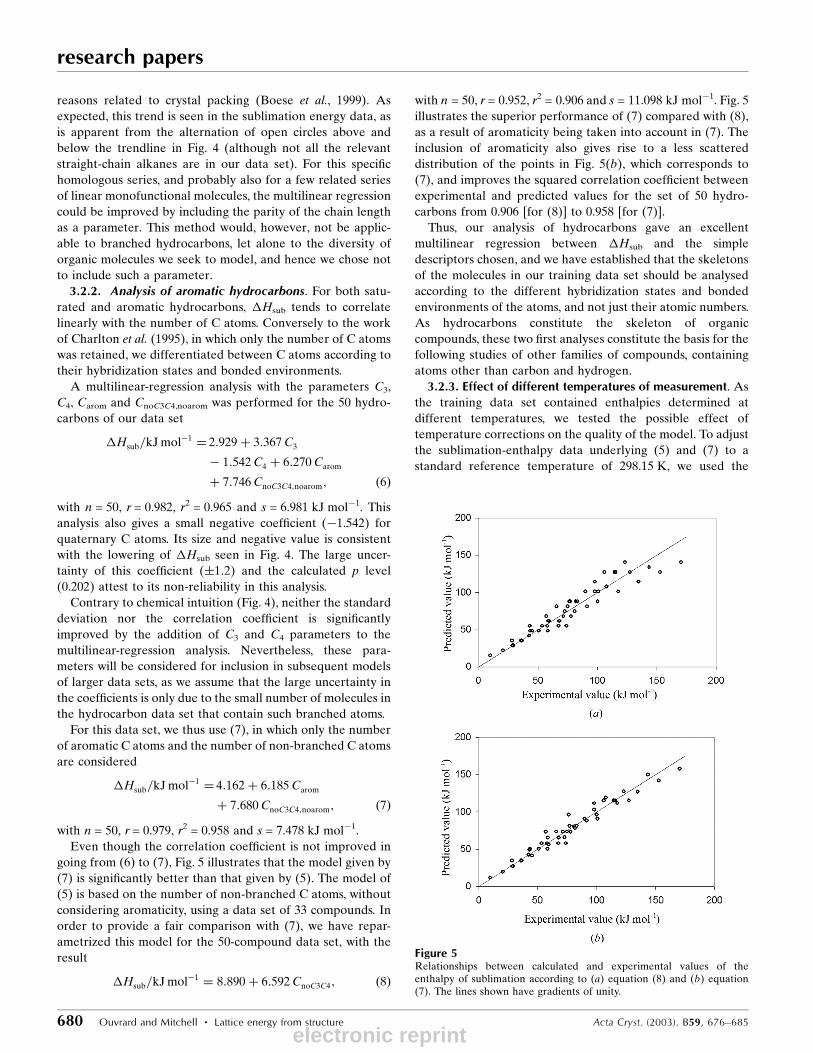
going from (6) to (7), Fig. 5 illustrates that the model given by
(7) is signi®cantly better than that given by (5). The model of
(5) is based on the number of non-branched C atoms, without
considering aromaticity, using a data set of 33 compounds. In
order to provide a fair comparison with (7), we have repar-
ametrized this model for the 50-compound data set, with the
result
�Hsub=kJ molÿ1 � 8:890 � 6:592CnoC3C4; �8�
with n = 50, r = 0.952, r2 = 0.906 and s = 11.098 kJ molÿ1. Fig. 5
illustrates the superior performance of (7) compared with (8),
as a result of aromaticity being taken into account in (7). The
inclusion of aromaticity also gives rise to a less scattered
distribution of the points in Fig. 5(b), which corresponds to
(7), and improves the squared correlation coef®cient between
experimental and predicted values for the set of 50 hydro-
carbons from 0.906 [for (8)] to 0.958 [for (7)].
Thus, our analysis of hydrocarbons gave an excellent
multilinear regression between �Hsub and the simple
descriptors chosen, and we have established that the skeletons
of the molecules in our training data set should be analysed
according to the different hybridization states and bonded
environments of the atoms, and not just their atomic numbers.
As hydrocarbons constitute the skeleton of organic
compounds, these two ®rst analyses constitute the basis for the
following studies of other families of compounds, containing
atoms other than carbon and hydrogen.
3.2.3. Effect of different temperatures of measurement. As
the training data set contained enthalpies determined at
different temperatures, we tested the possible effect of
temperature corrections on the quality of the model. To adjust
the sublimation-enthalpy data underlying (5) and (7) to a
standard reference temperature of 298.15 K, we used the
Figure 5Relationships between calculated and experimental values of theenthalpy of sublimation according to (a) equation (8) and (b) equation(7). The lines shown have gradients of unity.
electronic reprint
method proposed by Chickos (1998) for estimating the values
of unknown heat capacities by the group-additivity approach
(Chickos et al., 1993). The regression equations thus obtained
are given by (9) for the aliphatic model and (10) for the model
including aromatic hydrocarbons [c.f. equations (5) and (7)]
�Hsub=kJ molÿ1 � 0:769 � 7:906CnoC3C4; �9�
with n = 33, r = 0.979, r2 = 0.959 and s = 8.278 kJ molÿ1, and
�Hsub=kJ molÿ1 � 1:573 � 6:353Carom
� 7:834CnoC3C4;noarom; �10�
with n = 50, r = 0.979, r2 = 0.959 and s = 7.699 kJ molÿ1.
Thus, the overall quality of the model is hardly affected by
the temperature adjustments, the effect on the correlation
coef®cients is negligible and the standard deviations become
slightly worse. Therefore, while we recognize that differing
temperatures of measurement represent a potential source of
inaccuracy in the model, we decided not to apply empirical
adjustments to the data underlying the subsequent models.
3.3. Predictive model for non-hydrogen-bonded molecules
A similar analysis of the relationships between �Hsub and
several other molecular descriptors was performed for the
training data set of 156 compounds. The molecules contain H,
C, N, O, S, F, Cl, Br and I atoms, which have been classi®ed
according to their atomic numbers, bonded environments and
hybridization states (Table 1). These atoms belong to various
functional groups but include no hydrogen-bond donors or
acceptors.
Different multilinear regressions have been analysed for
this data set. We ®rst tested the relevance of the C4 parameter
for two models, one taking into account the hybridization
states and bonded environments of heavy atoms, and the other
not. For both models, regressions led to weak negative C4
coef®cients of ÿ1.636 and ÿ1.778. These values are in
agreement with the lowering of �Hsub previously observed in
such cases and also show the in¯uence of the C4 parameter on
the enthalpy of sublimation to be weak. This coef®cient is not
reliable as the standard errors, �1:5 and �1:4, respectively, for
the two models, are of similar magnitude to the coef®cient
itself. The p level calculated for this parameter is also too high,
at nearly 0.3, compared with the generally accepted upper
limit of 0.05. This descriptor has therefore been removed from
the multilinear-regression analyses.
According to the correlation observed in Fig. 2, the size of
the molecule, given by the number of heavy atoms, is not
adequate for predicting �Hsub, nor, indeed, is a regression
equation that classi®es the non-C atoms by atomic number
only
�Hsub=kJ molÿ1 � 10:102 � 7:743N
� 4:907O� 1:980 F
� 14:313 S� 9:661Cl
� 11:484Br� 18:141 I
� 3:307C3 � 5:913Carom
� 7:219CnoC3C4;noarom; �11�with n = 156, r = 0.936, r2 = 0.876 and s = 10.684 kJ molÿ1.
Although (11) gives a good squared correlation coef®cient of
0.876, the alternative model that takes into account atomic
hybridization states and bonded environments leads to better
results
�Hsub=kJ molÿ1 � 7:077 � 2:544F
� 10:144Cl � 12:284Br
� 19:573 I � 3:496C3
� 6:012Carom � 7:311CnoC3C4;noarom
� 10:075CO� 19:459Oether
� 8:442NO� 20:635 SO
� 20:478CS� 13:199 Sether
� 10:763Nnitrile � 8:935Nnonitrile; �12�;with n = 156, r = 0.947, r2 = 0.896 and s = 9.976 kJ molÿ1.
Indeed, taking into account the different hybridization
states and bonded environments of atoms in the multilinear-
regression analysis slightly improves both the squared corre-
lation coef®cient, to 0.896, and the standard deviation, which
falls below 10 kJ molÿ1, and thus leads to a better distribution
of residuals (as shown in Fig. 6), with fewer outliers than in the
case of (11). The distribution of residuals is normal in both
cases, which is an unsurprising consequence of the optimiza-
tion of the regression equations. The residuals from (12),
which take into account differences in hybridization state and
bonded environment, are smaller in magnitude and have a
narrower range of values than those from (11).
Model (12) is thus retained for the case of non-hydrogen-
bonded systems, as it gives a good agreement between the
experimental and predicted values and is consistent with
chemical intuition.
3.4. General predictive model
After having analysed multilinear regressions for speci®c
classes of compounds, the aim was to develop a general
predictive model of enthalpy of sublimation applicable to
molecular crystals with and without hydrogen bonds. We thus
used a data set of 226 compounds, which contains all 156 of the
molecules studied previously and 70 others with hydrogen-
bond donors and acceptors.
Our analyses of non-hydrogen-bonded systems have
already shown that enthalpy of sublimation is dependent on
the atomic numbers, hybridization states and bonded
environments of the component atoms. Nevertheless, for
hydrogen-bonded systems, this enthalpy is also dependent on
the nature and number of hydrogen bonds occurring in the
crystal structure. This dependence is illustrated in Fig. 7, which
Acta Cryst. (2003). B59, 676±685 Ouvrard and Mitchell � Lattice energy from structure 681
research papers
electronic reprint

research papers
682 Ouvrard and Mitchell � Lattice energy from structure Acta Cryst. (2003). B59, 676±685
shows that both diamides and dicarboxylic acids behave
differently from the corresponding monofunctional molecules.
Multilinear-regression analyses were performed with all of
the parameters used previously, to which the numbers of
hydrogen-bond donors were added. The data set contains both
NH and OH hydrogen-bond donors. In previous studies,
occurrences of either of these two donors were combined in
one parameter. As there is good reason to believe that NH
and OH groups will form hydrogen bonds with different
average energies (Abraham et al., 1989; Rablen et al., 1998;
Leo, 2000), we described these groups using two separate
donor parameters, viz. NH and OH. This separation improves
the standard deviation by 1 kJ molÿ1 and the squared corre-
lation coef®cient from 0.908 to 0.925
�Hsub=kJ molÿ1 � 6:942 � 3:127F
� 10:456Cl � 12:926Br
� 19:763 I � 3:297C3
ÿ 3:305C4 � 5:970Carom
� 7:631CnoC3C4;noarom � 20:141NH
� 30:172OH � 7:341CO
� 18:249Oether � 8:466NO
� 20:585 SO� 19:676CS
� 12:840 Sether � 11:415Nnitrile
� 8:953Nnonitrile; �13�
with n = 226, r = 0.962, r2 = 0.925 and s = 9.579 kJ molÿ1. This
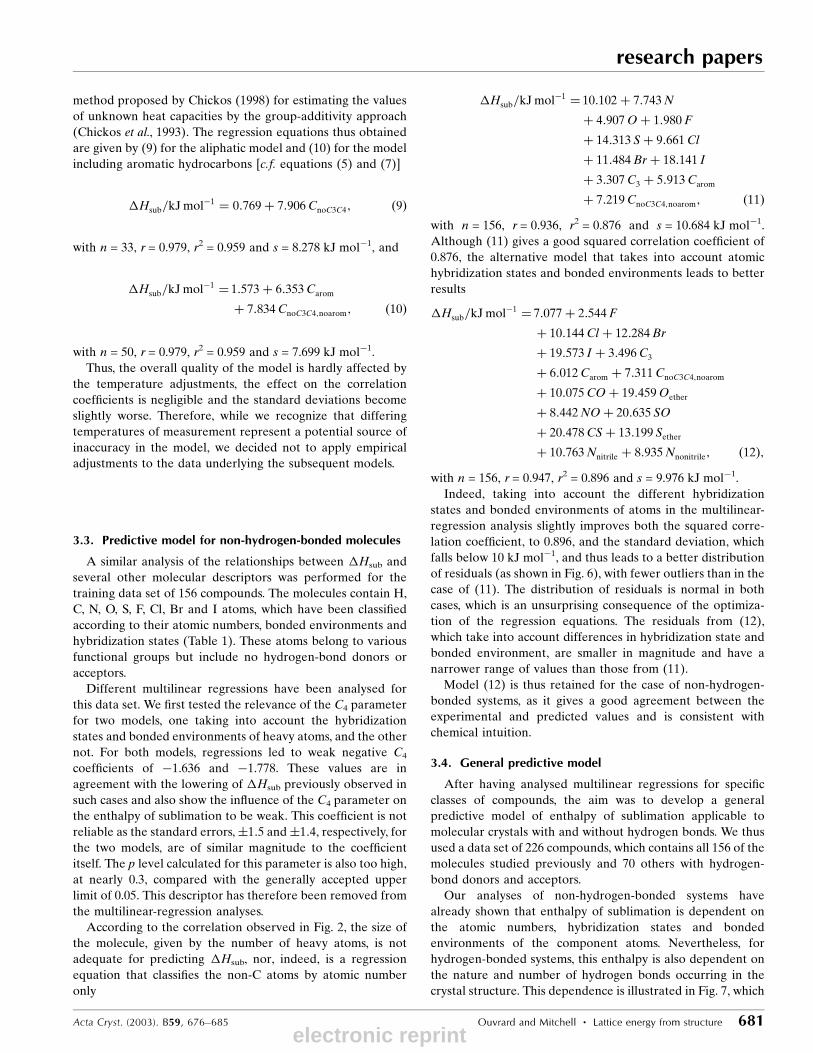
improvement is illustrated in Fig. 8(a), which shows that the
points are less scattered when the two hydrogen-bond donors
are considered separately. Similarly, (13) leads to a better
distribution of residuals between predicted and experimental
values, as seen in Fig. 8(b). The model has 18 parameters, but
the number playing any role for a particular molecule will
Figure 6(a) Predictive models and (b) histograms of the distributions of the residuals between experimental and predicted values of �Hsub. Cases (i) and (ii)correspond to (11) and (12), respectively, for non-hydrogen-bonded molecules. The lines shown have gradients of unity.
Figure 7Differences between the behaviour of amides (open circles), carboxylicacids (open triangles), diamides (®lled circles), dicarboxylic acids (®lledtriangles) and amino acids (grey squares).
electronic reprint
typically be much smaller and is given by the number of
different relevant atom types that the molecule contains.
3.5. Validation of the model
The ®nal model, as presented in (13), was tested on a
validation data set of 35 molecules belonging to the same
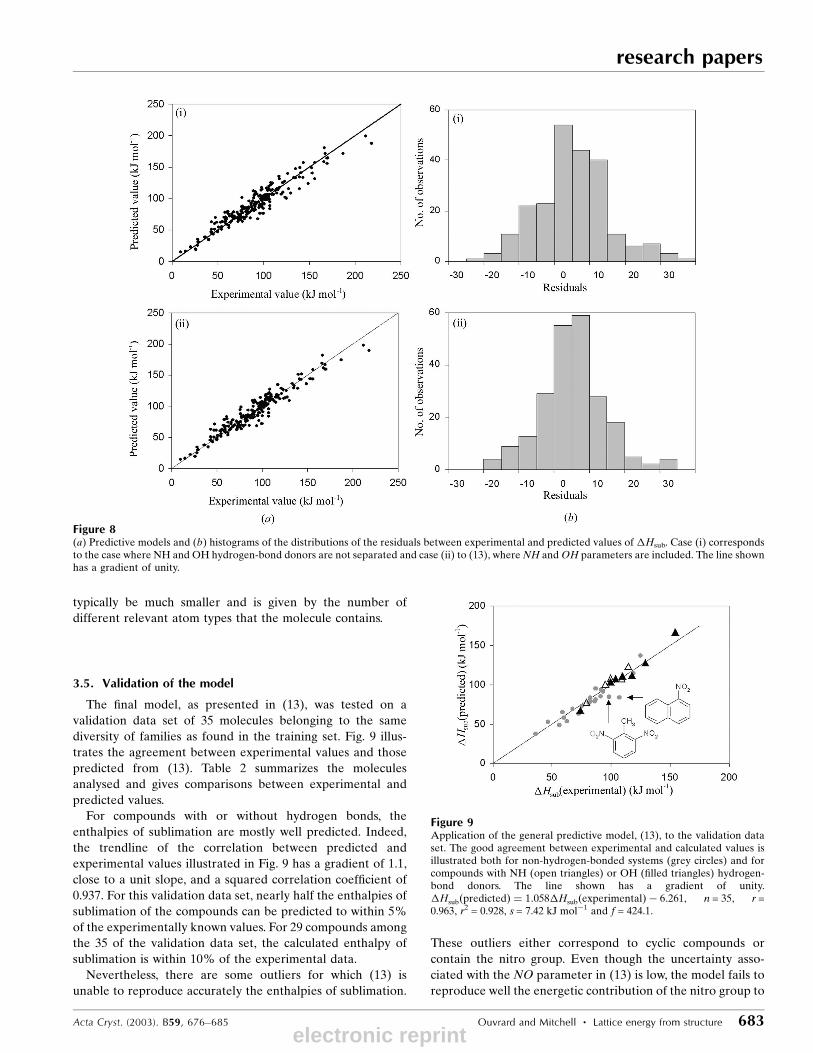
diversity of families as found in the training set. Fig. 9 illus-
trates the agreement between experimental values and those
predicted from (13). Table 2 summarizes the molecules
analysed and gives comparisons between experimental and
predicted values.
For compounds with or without hydrogen bonds, the
enthalpies of sublimation are mostly well predicted. Indeed,
the trendline of the correlation between predicted and
experimental values illustrated in Fig. 9 has a gradient of 1.1,
close to a unit slope, and a squared correlation coef®cient of
0.937. For this validation data set, nearly half the enthalpies of
sublimation of the compounds can be predicted to within 5%
of the experimentally known values. For 29 compounds among
the 35 of the validation data set, the calculated enthalpy of
sublimation is within 10% of the experimental data.
Nevertheless, there are some outliers for which (13) is
unable to reproduce accurately the enthalpies of sublimation.
These outliers either correspond to cyclic compounds or
contain the nitro group. Even though the uncertainty asso-
ciated with the NO parameter in (13) is low, the model fails to
reproduce well the energetic contribution of the nitro group to
Acta Cryst. (2003). B59, 676±685 Ouvrard and Mitchell � Lattice energy from structure 683
research papers
Figure 9Application of the general predictive model, (13), to the validation dataset. The good agreement between experimental and calculated values isillustrated both for non-hydrogen-bonded systems (grey circles) and forcompounds with NH (open triangles) or OH (®lled triangles) hydrogen-bond donors. The line shown has a gradient of unity.�Hsub�predicted� � 1:058�Hsub�experimental� ÿ 6:261, n = 35, r =0.963, r2 = 0.928, s = 7.42 kJ molÿ1 and f = 424.1.
Figure 8(a) Predictive models and (b) histograms of the distributions of the residuals between experimental and predicted values of�Hsub. Case (i) correspondsto the case where NH and OH hydrogen-bond donors are not separated and case (ii) to (13), where NH and OH parameters are included. The line shownhas a gradient of unity.
electronic reprint

research papers
684 Ouvrard and Mitchell � Lattice energy from structure Acta Cryst. (2003). B59, 676±685
the sublimation enthalpies of 2-methyl-1,3-dinitrobenzene and
1-nitronaphthalene. However, we should consider that nitro
compounds are commonly subject to thermal decomposition,
which gives rise to inaccuracy in the experimental determi-
nation of their enthalpies of sublimation (Cundall et al., 1978).
It therefore seems dif®cult to estimate accurately the contri-
bution of the nitro functionality.
4. Conclusions
We have shown that, by using simply the numbers of occur-
rences of different atom types as descriptors, we can generate
a conceptually transparent and remarkably accurate model for
the prediction of the enthalpies of sublimation of organic
compounds. As we progress from aliphatic hydrocarbons to
include ®rst aromatic molecules, then general non-hydrogen-
bonded organic substances and ®nally hydrogen-bonded
molecules, the number of parameters to be considered
increases at each stage. Nonetheless, the relationships retain
their predictive power and analysis of the residuals shows that
there are few outliers.
The very fact that so simple a model can give such good
results is in itself of great interest. In particular, our results
imply that the enthalpy of sublimation can be predicted
accurately without knowledge of the crystal packing. This
hypothesis is consistent with the idea that the sublimation
enthalpy, and therefore the lattice energy, is not dominated by
the particular features of a single lowest-energy structure.
Rather, there is an `achievable lattice energy' that can be
predicted fairly accurately from the monomer structural
diagram and can be realized, to within relatively small varia-
tions, by a number of alternative crystal packings. This result is
exactly what has often, though not always, been found in
crystal structure prediction exercises (Beyer et al., 2001;
Anghel et al., 2002). These enthalpically near-equivalent
structures are, given the third law of thermodynamics and the
probable small entropy differences between crystal forms
(Gavezzotti & Filippini, 1995; Day, 2002), likely also to be
close in free energy. This fact might be taken as a suggestion
that more molecules have experimentally realizable poly-
morphs than has been thought. However, some caution is
required here, as our results have nothing to say about the
Table 2Performance of the model for the 35 compounds constituting the validation data set.
T/K = temperature or range of temperatures of the experimental determination when data are available. ���H� � �H�experimental� ÿ�H�predicted�.�H% = �(�H)/�H(experimental).
Compound Formula (K) T/K (kJ molÿ1) Exp. �Hsub (kJ molÿ1) Calc. �Hsub (kJ molÿ1) �(�H) �H%
Acridine C13H9N1 298 91.7 (�0.4) 93.5 ÿ1.8 ÿ2.01,2-Benzenedicarbonitrile C8H4N2 298 86.9 (�1.5) 80.9 6.0 6.91,10-Biphenylene C12H8 298 87.3 (�0.3) 78.6 8.7 10.01,3-Butadiyne C4H2 211 36.2² 37.5 ÿ1.3 ÿ3.6p-tert-Butylbenzoic acid C11H14O2 334 103.8 (�0.4) 107.5 ÿ3.7 ÿ3.6Chrysene C18H12 383 118.8² 114.4 4.4 3.7Cyclohexane C6H12 186 46.6² 52.7 ÿ6.1 ÿ13.1Decane C10H22 298 82.4² 83.3 ÿ0.9 ÿ1.1Dibenzothiophene C12H8S1 298 93.3² 91.4 1.9 2.03,3-Diethylpentane C9H20 59.0² 64.7 ÿ5.7 ÿ9.7Diethylsulfone C4H10O2S1 86.2 (�2.5) 78.6 7.6 8.84,40-Di¯uorobiphenyl C12H8F2 298 91.2 (�4.2) 84.8 6.4 7.01,3-Dinitrobenzene C6H4N2O4 298 81.2 (�1.7) 76.6 4.6 5.71,3-Dithiane C4H8S2 263 72.6² 63.1 9.5 13.13-Ethylbenzoic acid C9H10O2 298 99.7 (�0.4) 103.2 ÿ3.5 ÿ3.5Heptadecane C17H36 298 125.1² 136.7 ÿ11.6 ÿ9.3Heptanamide C7H15N1O1 345±365 99.6² 108.0 ÿ8.4 ÿ8.4Hexadecanoic acid C16H32O2 326 154.4 (�4.2) 166.6 ÿ12.2 ÿ7.9Hexanamide C6H13N1O1 353 95.1 (�0.4) 100.4 ÿ5.3 ÿ5.6Hexanedioic acid C6H10O4 383 129.0 (�1.0) 127.8 1.2 0.92-Methyladamantane C11H18 320 67.5 (�2.1) 69.2 ÿ1.7 ÿ2.52-Methyl-1,3-dinitrobenzene C6H7N2O4 277±323 98.3 (�0.8) 84.3 14.0 14.24-Methylpyridine C6H7N1 243 62.7² 53.4 9.3 14.81-Naphthalenecarboxylic acid C11H8O2 117.6 (�0.4) 111.8 5.8 4.92-Nitrofuran C4H3N1O3 75.3 (�2.1) 72.6 2.7 3.61-Nitronaphthalene C10H7N1O2 328 ÿ107.1 (�2.1) 83.6 23.5 21.9Nonamide C9H19N1O1 353±370 114.6 (�3.3) 123.2 ÿ8.6 ÿ7.5Oxamic acid C2H3N1O3 298 108.9 (�2.1) 107.3 1.6 1.5Pentachlorobenzene C6H1Cl5 298 87.1 (�0.4) 95.0 ÿ7.9 ÿ9.1Propanamide C3H7N1O1 79.2 (�0.3) 77.5 1.7 2.1Propanoic acid C3H6O2 225-238 74.0 (�1.0) 67.3 6.7 9.1Pyrazine C4H4N2 288±317 56.2² 48.7 7.5 13.5Thianthrene C12H8S2 298 99.4 (�0.6) 104.3 ÿ4.9 ÿ4.92,4,5-Trimethylbenzoic acid C10H12O2 298 109.6 (�0.5) 110.8 ÿ1.2 ÿ1.11,2-Xylene C8H10 248 60.1² 58.0 2.1 3.5
² Experimental error data not available.
electronic reprint
kinetic factors affecting either the formation or the stability of
polymorphs.
The approach used here could be extended to the predic-
tion of other molecular properties, such as boiling point, log P,
where P is the n-octanol/water partition coef®cient, and
solubility. Our approach is complementary to conventional
QSPR. Where the most accurate possible prediction is
required, a traditional QSPR will probably be the more
suitable method. For developing the chemical understanding
of the contributions of different atom types to molecular
properties, however, we believe that the kind of study
presented here will prove invaluable.
JBOM and CO thank Unilever for their ®nancial support of
the Centre for Molecular Informatics. CO thanks the Minis-
teÁ re de l'Education Nationale et de la Recherche FrancËais for
its ®nancial support. CO is also grateful to the Laboratoire de
Spectrochimie et Mode lisation (Nantes, France) for their
agreement to her carrying out part of her research with JBOM
in Cambridge. The authors also thank Professor Sally Price
(University College London) for helpful discussions on this
manuscript.
References
Abraham, M. H., Duce, P. P., Prior, D. V., Barratt, D. G., Morris, J. J. &Taylor, P. J. (1989). J. Chem. Soc. Perkin Trans. 2, pp. 1355±1375.
Aihara, A. (1959). Bull. Chem. Soc. Jpn, 32, 1242±1248.Anghel, A. T., Day, G. M. & Price, S. L. (2002). CrystEngComm, 4,
348±355.Arnautova, E. A., Zakharova, M. V., Pivina, T. S., Smolenskii, E. A.,
Sukhachev, D. V. & Shcherbukhin, V. V. (1996). Russ. Chem. Bull.45, 2723±2732.
Beyer, T., Lewis, T. & Price, S. L. (2001). CrystEngComm, 3, 178±212.Boese, R., Weiss, H.-C. & Blaser, D. (1999). Angew. Chem. Int. Ed. 38,
988±992.Bondi, A. (1963). J. Chem. Eng. Data, 8, 371±381.Charlton, M., Docherty, R. & Hutchings, M. G. (1995). J. Chem. Soc.Perkin Trans. 2, pp. 2023±2030.
Chickos, J. S. (1998). Thermochim. Acta, 313, 19±26.
Chickos, J. S. (2001). Heat of Sublimation Data in NIST ChemistryWebBook, NIST Standard Reference Database Number 69,edited by P. J. Linstrom & W. G. Mallard. National Institute ofStandards and Technology, Gaithersburg, MD 20899, USA.http://webbook.nist.gov.
Chickos, J. S., Annunziata, R., Ladon, L. H., Hyman, A. S. &Liebman, J. F. (1986). J. Org. Chem. 51, 4311±4314.
Chickos, J. S., Hosseini, D. J., Hesse, D. G. & Liebman, J. F. (1993).Struct. Chem. 4, 261±269.
Chickos, J. S., Hyman, A. S., Ladon, L. H. & Liebman, J. F. (1981). J.Org. Chem. 46, 4294±4296.
Cundall, R. B., Palmer, T. F. & Wood, C. E. C. (1978). J. Chem. Soc.Faraday Trans. 1, 74, 1339±1345.
Day, G. M. (2002). PhD thesis, University College London, UK.Egolf, L. M., Wessel, M. D. & Jurs, P. C. (1994). J. Chem. Inf. Comput.Sci. 34, 947±956.
Gavezzotti, A. (1989). J. Am. Chem. Soc. 111, 1835±1843.Gavezzotti, A. (1991). J. Phys. Chem. 95, 8948±8955.Gavezzotti, A. (2002). CrystEngComm, 4, 343±347.Gavezzotti, A. & Filippini, G. (1992). Acta Cryst. B48, 537±545.Gavezzotti, A. & Filippini, G. (1995). J. Am. Chem. Soc. 117, 12299±
12305.Gavezzotti, A. & Filippini, G. (1997). Theoretical Aspects andComputer Modeling, edited by A. Gavezzotti, ch. 3, pp. 61±97.Chichester: J. Wiley and Sons.
Horvath, A. L. (1992). Molecular Design: Chemical StructuresGeneration from the Properties of Pure Organic Compounds.Amsterdam: Elsevier.
Katritzky, A. R., Lobanov, V. S. & Karelson, M. (1995). Chem. Soc.Rev. 24, 279±287.
Leo, A. J. (2000). J. Pharm. Sci. 89, 1567±1578.Mitchell, J. B. O., Alex, A. & Snarey, M. (1999). J. Chem. Inf. Comput.Sci. 39, 751±757.
Pertsin, A. J. & Kitaigorodsky, A. I. (1986). In The Atom±AtomPotential Method. Berlin: Springer Verlag.
Rablen, P. R., Lockman, J. W. & Jorgensen, W. L. (1998). J. Phys.Chem. A, 102, 3782±3797.
StatSoft (2000). Statistica. StatSoft Inc., Tulsa, OK 74104, USA.http://www.statsoftinc.com.
Stein, S. E. & Brown, R. L. (1994). J. Chem. Inf. Comput. Sci. 34, 581±587.
Wessel, M. D. & Jurs, P. C. (1995). J. Chem. Inf. Comput. Sci. 35, 68±76.
Westwell, M. S., Searle, M. S., Wales, D. J. & Williams, D. H. (1995). J.Am. Chem. Soc. 117, 5013±5015.
Acta Cryst. (2003). B59, 676±685 Ouvrard and Mitchell � Lattice energy from structure 685
research papers
electronic reprint