can the financial sector deliver?
TRANSCRIPT

1
INDIA’S ECONOMIC AMBITIONS:
Can the Financial Sector Deliver?
Ratna SahayMonetary & Capital Markets Department
International Monetary Fund
FICCI
March 12th, 2019, New Delhi

Outline
• India’s Financial System: Taking Stock
• Recent Reforms: What Has Been Done?
• Strengthening the Financial System: What Next?
2

“The world’s second-most-populous country has been
flirting with a Lehman moment”
–The Economist (November 2018)
3

India’s Financial System: Taking Stock
4

Economic Backdrop
5
183.5
136.2
90
100
110
120
130
140
150
160
170
180
190
2010 2011 2012 2013 2014 2015 2016 2017 2018
G-20 Peers Range India G-20 Peers Median 1/
Real Growth: India and G20 Peers(Index, Seasonally Adjusted, 2010-Q1=100)
Sources: Haver Analytics and IMF Staff CalculationsIndia's G-20 peers are Brazil, Russia, China, South Africa, Indonesia and Turkey
7.2 7.3
21.2
13.4
0
5
10
15
20
25
2010-13 2014-17
Avg. GDP growth Poverty Rate
India: GDP growth and poverty rate(In percent)
Sources: Haver Analytics and World Bank Group, Poverty and Equity Data Portal.Note: Poverty rate is based on the international poverty line (2011 PPP, $1.9 per person per day).
2011
2015

Economic Backdrop
6
70.1
69.8
69.7
69.8
69.9
70.0
70.1
2010-2013 2014-2017
Gross Debt (% of GDP)
Source: Haver Analytics
-3.4
-1.2
-7.9-7.2
-9
-8
-7
-6
-5
-4
-3
-2
-1
0
2010-2013 2014-2017
External Current Account and Fiscal Balance
Current Account Balance (% of GDP) Fiscal Balance
Source: World Economic Outlook
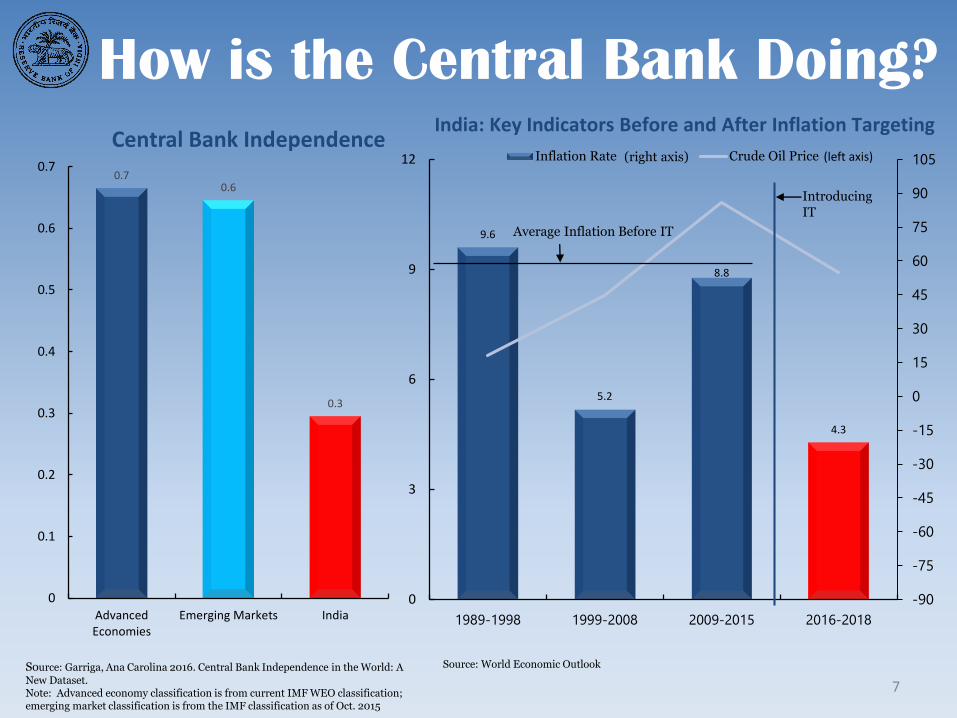
How is the Central Bank Doing?
7
0.70.6
0.3
0
0.1
0.2
0.3
0.4
0.5
0.6
0.7
AdvancedEconomies
Emerging Markets India
Central Bank Independence
Source: Garriga, Ana Carolina 2016. Central Bank Independence in the World: A
New Dataset. Note: Advanced economy classification is from current IMF WEO classification; emerging market classification is from the IMF classification as of Oct. 2015
9.6
5.2
8.8
4.3
-90
-75
-60
-45
-30
-15
0
15
30
45
60
75
90
105
0
3
6
9
12
1989-1998 1999-2008 2009-2015 2016-2018
Inflation Rate Crude Oil Price
India: Key Indicators Before and After Inflation Targeting
Source: World Economic Outlook
Introducing IT
Average Inflation Before IT
(right axis) (left axis)

How is the Central Bank Doing?
8
3.31
5.65
-0.14
4.84
9.60
-2
0
2
4
6
8
10
12
14
Inflation and Consensus Forecasts(Percent, year-on-year)
Headline Core-Core Food Consensus Expectations (1 year ahead) HH Expectations (1 year ahead)
Source: India IMF Article IV Staff Report, 2018

Are Financial Markets Competitive?
9
Countries Dominated by State-Owned Banks
BhutanChina
India
Belarus
LibyaEgypt Algeria Costa Rica
Turkmenistan
So
urc
e: B
art
h, C
ap
rio
& L
evin
e (2
00
6)

Are Financial Markets Competitive?
10
100
55
32
12
55
10
0
20
40
60
80
100
120
UnitedStates
Korea Brazil India IndiaPrivateSectorBanks
IndiaPublicSectorBanks
Productivity of Bank Employees(Number of transactions/hour)
5.0%
4.0%
3.4%
2.4%
0%
1%
2%
3%
4%
5%
6%
India Thailand China Singapore
Intermediation Costs(lending-deposit spread)
So
urc
e: B
art
h, C
ap
rio
& L
evin
e (2
00
6)
So
urce
: McK
insey
Stu
dy
(20
01)
Source: Report of the Committee of Financial Sector Reforms, GOI (2008)

Are Financial Markets Deep?
11
50
100
150
200
250
300
50
100
150
200
250
300
Au
g-1
0
Jul-
11
Jun
-12
May-1
3
Ap
r-14
Mar-
15
Feb
-16
Jan
-17
Dec-
17
No
v-1
8
Brazil China Russia India (SENSEX)
Stock Market Indices(June 1, 2009 = 100)
Source: Bloomberg Financial Markets L.P.

Are Financial Markets Deep?
12
3.7
22.1 22.5
0
5
10
15
20
25
30
Pensions Life Insurance
Long term Institutional Investors(2012, Percent of GDP)
India U.S.
Source: Mercer, OECD, Allianz Global Investors, IMF Staff estimates
43.046.0
68.6
81.1
108.8
142.3
-
20
40
60
80
100
120
140
160
Indonesia Brazil India Korea SouthAfrica
UnitedStates
Equity Market Value-to-GDP Ratio (2018)
Source: Bloomberg, Haver Analytics

Are Financial Markets Deep?
13
38.749.7
59.7
136.2147.7
155.8
192.2
0
50
100
150
200
250
Indonesia India Brazil UnitedKingdom
South Africa China United States
Domestic Credit to Private Sector 2017(Percent of GDP)
Source: World Development Indicators

Does the Financial Sector Serve the Population?
14
Growth of Aadhaar Accounts, 2012-2017 Growth of Bank Accounts, 2014-2017

Does the Financial Sector Serve the Population?
15
Financial Inclusion and Gender Gap
Source: IMF staff calculations based on the 2017 Global Findex.
0%
10%
20%
30%
40%
50%
60%
70%
80%
90%
100%
0% 10% 20% 30% 40% 50% 60% 70% 80% 90% 100%
share of adults with an account (men)
shar
e o
f ad
ult
s w
ith
an
acc
ou
nt
(wo
men
)
Philippines
Georgia
Turkey
Mongolia
Argentina
Bangladesh
Jordan
Pakistan
UAE
Lao PDR
Denmark
Myanmar
Namibia
Bolivia
Sri Lanka
Nigeria
South Sudan
India

Is There a Tradeoff Between Financial Inclusion
and Financial Stability?
16
Financial Inclusion and Financial Stability
Source: “Financial Inclusion: Can It Meet Multiple Macroeconomic Goals?” Ratna Sahay et al. SDN 15/17 IMF September 2015

Are Banks Sound Enough to Finance the
Real Economy?
17Source: Reserve Bank of India, and IMF Staff estimates.
-10
-5
0
5
10
15
20
25
30
-10
-5
0
5
10
15
20
25
30
Mar-16Mar-17Mar-18 Sep-18 Mar-16Mar-17Mar-18 Sep-18 Mar-16Mar-17Mar-18 Sep-18
Public sector banks Private banks Foreign banks
Credit growth (yoy change)
NPA ratio
Non-Performing Assets and Credit Growth(In percent)

Are Banks Sound Enough to Finance
the Real Economy?
18
Return on Assets(Percent)
0.4
-0.3-0.2
1.61.6
1.5
1.8
1.4
1.7
-0.5
0.0
0.5
1.0
1.5
2.0
Mar-15 Mar-16 Mar-17
Public sector banks Private sector banks
Foreign banks Aggregate
8.79.1 9.5
12.8 13.2 13.4
15.315.9
17.1
0
3
6
9
12
15
18
Mar-15 Mar-16 Mar-17
Public sector banks Private sector banks
Foreign banks Aggregate
Regulatory Tier 1 Capital Adequacy Ratio(Percent)
Source: Reserve Bank of India, and IMF Staff estimates.

Are Corporates Sound Enough to Contribute to Growth?
19
Indian corporate leverage is among the highest across emerging markets…
BRAARG
RUS IND
TUR
IDNKORCHN
THA
MEXCOL
ZAFPOL
HUN
KAZ
PHL
VIE
PER
CRO
CZE
EGY
ROM
NIG
MYS
0
20
40
60
80
100
120
140
160
180
0 20 40 60 80 100 120 140 160 180
Corporate Leverage, Selected EMs(Debt-to-Equity Ratio, top quartile)
2014
20
15
Source: IMF, Corporate Vulnerability Utility.

Are Corporates Sound Enough to Contribute to Growth?
20
… with leverage particularly high across the largest corporates, and debt-at-risk levels edging up.
0
40
80
120
160
0
10
20
30
40
50
FY
2015
FY
2016
FY
2017*
FY
2015
FY
2016
FY
2017* .
Debt-at-Risk Leverage
Corporate Sector Vulnerabilities(In percent)
Top 50 firms All other firms
Sources: CapitalIQ; and IMF staff estimates.Note: Based on a sample of 1,826 firms. 2017 estimates reflect each firm's latest available quarter. Topfirms determined based on latest total assets. Leverage is median debt-to-equity ratio in each group(no firms with negative equity). Debt-at-risk is the share of debt of firms with ICR less than 1.

Are Corporates Sound Enough to Contribute to Growth?
21
Corporates are exposed to external shocks through external commercial borrowings...
1/ Other local securities include commercial paper (CP) and syndicated loans.
11.6 11.5 12.3 12.7 12.7 11.3 11.1
70.9 69.8 69.3 66.8 65.7 64.0 64.5
17.6 18.7 18.4 20.4 21.6 24.7 24.4
0
10
20
30
40
50
60
70
80
90
100
Mar-12 Mar-13 Mar-14 Mar-15 Mar-16 Mar-17 Mar-18
Outstanding Corporate Debt in India 1/
(In percent of total corporate funding)
ECBs Bank Credit Local bonds & CPs

Are Corporates Sound Enough to Contribute to Growth?
22
… but dependence on external foreign-currency funding has declined considerably
0
2
4
6
8
10
12
14
FY20
05
FY20
06
FY20
07
FY20
08
FY20
09
FY20
10
FY20
11
FY20
12
FY20
13
FY20
14
FY20
15
FY20
16
FY20
17
Overseas Borrowing of Indian Corporates(In billions of U.S. Dollars)
Rupee-Denominated Bonds (RDB; external) External Commercial Borrowing (ECB; in foreign currency)
Sources: Reserve Bank of India; IMF, Financial Soundness Indicators; IMF, Corporate Vulnerability Utility; and IMF staff estimates

Can the Non-Bank Sector Pick Up the Slack?
23
23.6
30.7
3.13.8
20.0
22.0
6.05.0
0
5
10
15
20
25
30
35
NBFC-D NBFC-ND-SI NBFC-D NBFC-ND-SI
CAR NPAs
Mar-12 Mar-17
NBFCs Financial Soundness Indicators(Percent)
Scheduled commercial
banks, 81Rural banks and cooperatives, 9
Non-banking financial
companies, 12
Insurance companies, 18
Pension and mutual funds, 15
Financial System Structure (In percent of GDP, March 2017)
Sources: India Article IV IMF Staff Report (2017)
60%
11%
13%
9%
7%
(Share of total)
Sources: Bloomberg; Reserve Bank of India; Insurance Regulatory and Development Authority of India and Securities Exchange Board of India

Can the Non-Bank Sector Pick Up the Slack?
24
0.00 0.50 1.00 1.50 2.00 2.50 3.00 3.50 4.00 4.50 5.00
United States
China
South Korea
Brazil
India
Indonesia
South Africa
Issuance of Non-Financial Corporates (% of GDP)
2018 2013
16.3
11.3
-
5.0
10.0
15.0
20.0
25.0
Mar-
13
Sep
-13
Mar-
14
Sep
-14
Mar-
15
Sep
-15
Mar-
16
Sep
-16
Mar-
17
Sep
-17
Mar-
18
Sep
-18
Contribution to growth (bank) Contribution to growth (NBFC) NBFC loans and advances (y/y change) Bank non-food credit (y/y change)
Sources: RBI and staff estimates.
Credit Growth(Annual percent change)

Challenges in the Non-Bank Sector
25
63.7
45.9
58.0
49.9 49.2
26.0
15.3 13.9
8.1
17.0 17.1
19.1
20.3
0
10
20
30
40
50
60
70
Co
nst
ruct
ion
Meta
ls
Text
iles
Gem
s &
Jew
elr
y
Pap
er
Infr
ast
ruct
ure
Ch
em
icals
Cem
en
t
Au
to &
Tra
nsp
ort
En
gin
eeri
ng
Oth
ers
Fo
od
Pro
cess
ing
Bev &
To
bacc
o
Corporate Sector Debt-at-Risk(In percent of sectoral debt, 2016)
Sources: CapitalIQ; and IMF staff estimates.Note: Debt-at-risk is debt of firms with interest coverage ratio—multiple of earnings before interest, taxes, depreciation and amortization (EBITDA) relative to interest expenses—below one.
All sectors
Infrastructure38.8
Retail loans14.2
Industries11.7
Transport6.4
Commercial real estate
5.4
Others23.4
NBFCs Loans by Sector(Percent, March 2017)
Sources: Bloomberg; Reserve Bank of India; Insurance Regulatory and Development Authority of India and Securities Exchange Board of India

Challenges in the Non-Bank Sector
26
Network plot of the financial system (March 2018)
44.8 44.4 45.9 43.0 46.0
28.3 28.0 25.5 26.9 22.3
5.2 4.9 5.0 6.8 9.1
21.6 22.7 23.6 23.2 22.6
0
10
20
30
40
50
60
70
80
90
100
Mar-13 Mar-14 Mar-15 Mar-16 Mar-17
NBFC: Sources of Funding(percent of total borrowing)
Debentures Bank borrowings
Commercial paper Other
Sources: RBI and staff calculations.Source: India FSSA IMF Report, 2017Note: PSBs: Public sector banks, UCBs: Urban commercial banks, HFCs: Housing Finance companies, NBFCs: Non-bank financial corporations, AFIs: All India Financial Institutions, PFs: Private Pension Funds, AMC-MFS: Asset management companies and mutual funds, FBs: Foreign banks, PVBs: Private banks, Insurance cos: Insurance companies

Macroeconomic fundamentals improving slowly.
Credibility of RBI has increased.
27
Most banks are well capitalized, the insurance and security markets are well supervised.
India’s Financial System: Key Takeaways
The PSBs dominate banking sector, are inefficient, NPAs are large, governance is poor. Sovereign-bank nexus is large.
Financial sector increasingly reaching the underserved, helped by technological innovations.
Financial markets are deepening. Pension sector is underdeveloped.
Corporate sector is highly leveraged, high debt-at-risk, impacting banks’ and non-banks’ balance sheets.
Interconnections amongst banks and between banks and non-banks are high. Non-bank sector, though small is rising rapidly, creating vulnerabilities for the financial system.

Recent Reforms: What Has Been Done?
28

29
Recent Reforms: What Has Been Done?
2010Creation of
Financial Stability and Development Committee lead to better interagency
cooperation.
2015Introduction of
Inflation Targeting Framework in the RBI.
2015Started Asset Quality
Review of 36 commercial banks (including all PSBs) covering 93% of all
loans.
2016Insolvency and
Bankruptcy Code introduced to deal with insolvency of companies
and individuals.
2016-18Recognition of NPAs: NPAs increased from 9.6% to 11.6% in one year as restructured loans were moved to
NPA category.
2017The new Prompt Corrective Action framework became effective in April 2017. By
December 2017, RBI instructed 11 PSBs (out of 21), representing 40% of NPAs, to put several large
corporate accounts to time-bound resolution process’s.
Amendment of IBC in June 2018 prioritizes a speedy sale of assets
under liquidation.
2017-18Recapitalization plan for PSBs (1.3
percent of GDP): announced in October 2017, first tranche of
recapitalizations Feb.-March 2018.
2018Introduction of Banking Reforms
Roadmap. Indradhanush Plan and Banking Board Bureau (BBB)
to improve governance and operations in PSBs—quality of
Board members, infuse new talent from private sector, etc.
Recapitalization to be contingent on strengthening governance.

Strengthening the Financial System:
What Next?
30

Amend RBI Act to provide full regulatory and supervisory powers over the PSBs.
In addition to IBC, enhance out of court restructuring of corporates, speedy/time limits, with penalties for non-cooperative creditors. Remove impediments to voluntary settlement processes and develop distressed debt markets.
31
Recapitalization of PSBs should attract fresh capital. Provision of fresh capital based on meaningful restructuring of PSBs. Exit of weak banks. Outright privatization?
Strengthening the Financial System: What Next?
In additional to stock problem (NPAs), address flow problem by enhancing risk-management of banks and financial strength of corporates.
BBB should be further empowered to appoint and remove senior management of PSBs.
Monitor risks migrating to non-bank sector. Improve prudential framework for balance sheet risk management of NBFCs. Enforce stricter standards of corporate governance.
Introduce Special Resolution Regime for financial institutions, per international standards.
Review Statutory Liquidity Ratio (SLR) and Priority Sector Lending (PSL).
Reform ELA (emergency liquidity assistance from the RBI) to clarify eligibility, collateral standards, penalty rates. Government to give guarantee if solvency in doubt.
Strengthen FSDC—systemic risk monitoring, crisis preparedness and response.

Thank You!
32