can the euro area avoid a “lost decade”? - cepii - accueil · 2 cepii – policy brief no 2 –...
TRANSCRIPT

SummaryA “lost decade” refers to an extended period of low or negative growth triggered by an economic crisis and that could have been avoided by the use of efficient crisis policies. The risk to the world’s developed economies of a lost decade was highlighted early on in the 2007-2008 crisis. Now, five years on from the severe recession of 2009, the risk appears much more of a concern for the Euro Area.
We find that there is currently a moderate to high risk of production capacities in the Euro Area being permanently impaired. The risk relates mostly to the prolonged period of stalled investment and persistent unemployment, with its detrimental effect on human capital. In addition, paying off past debt will be painful to both the public and private sectors, in particular in the context of a low inflation environment.
The policy response in the Euro Area has been hesitant. It emphasised structural reforms over cyclical policies. While structural reforms are a good lever for growth in the long term, they need to be accompanied by much stronger cyclical policies, especially given the recessionary environment. In short, there is a danger the decade could be lost because of an excess of confidence in the ability to fight a major economic crisis with structural reforms only.
Can the Euro Area Avoid a “Lost Decade”?
No 2 – April 2014
Benjamin Carton, Jérôme Héricourt and Fabien Tripier
Policy Brief
F 2 3
Italy; 6.1
UK; 2.2
USA; 2.8
Japan; 0.2
Germany; -3.2
Euro area; 4.4
Spain; 17.9
France; 2.3
-5.0 0.0 5.0 10.0 15.0 20.0
Unemployment skyrocketted...
17%
19%
21%
23%
13%
15%
2002 2004 2006 2008 2010 2012USA Japan UK Euro area
...and investment tumbled almost everywhere...
60
80
100
120
140
0
20
40
1980 1984 1988 1992 1996 2000 2004 2008 2012
Germany France Italy Spain
... while corporate indebtedness is likely to hinder a sound recovery
Source: OECD. Source: Eurostat. Source: Datastream.

2 CEPII – Policy Brief No 2 – April 2014
Can the Euro Area avoid a “lost decade”?
1 Introduction
1.1 Fear of a lost decade has been “topical” since 2009
Seven years ago, the financial markets entered a period of turmoil that pushed the European and American economies into the most severe recession of the post-war period. The severity of the 2009 recession, and subsequent weak recovery, has raised the risk of a lost decade for these economies. Although there is no strict economic definition of a lost decade (see Box 1), there has been abundant commentary on the risks, not just for the US1, but also for the UK2, and more recently for the euro area3. If the threat seems, at least for now, to have receded for the US and the UK, it remains a concern for the euro area and has been considered sufficiently serious enough to be addressed by policymakers: see Box 2 “The lost decade and policymakers”.
1.2 Policy mismanagement turns a crisis into a lost decade
The term “lost decade” has been used to describe both the Japanese economy during the 1990s (see Box 3) and the situation seen in the 1980s in the developing countries, Argentina, Chile and Mexico. The two cases are, however, radically different. The Japanese economy experienced a long-lasting slowdown in its growth rate, marked by highly persistent deflation, whereas the Latin American countries saw a decade of negative growth following severe sovereign debt crises. Despite the obvious differences in their magnitude and origins, the two cases share two essential characteristics of a lost decade: (i) the persistence of the economic downturn beyond the original crisis; and (ii) policy mismanagement of the crisis.The “persistence” element of a lost decade means that even after the initial crisis ends, the economy does not recover to its pre-crisis growth levels, leading to a relative downgrading compared with other economies. Looking back to 1970, Japanese GDP per capita relative to US GDP per capita peaked at 87% in 1991, just before the lost decade, and since then has steadily decreased to just over 70% (see Figure 1). A similar picture is seen in Mexico, where a peak of 44% was reached in 1981, before falling sharply during the lost decade and subsequently flat-lining at around 30%.Policy mismanagement lengthens the duration of the crisis, transforming it from a crisis into a lost decade. For the Latin
(1) Several articles published by the Financial Times highlight this interest in the lost decade. W. Munchau asked in 2008 “Is there a risk that the US will suffer a Japanese-style lost decade?”, while R. Stephen claimed in 2009 “US not certain of avoiding Japan-style ‘lost decade’” and L. Summers concluded in 2011 that the “United States is now half way to a lost economic decade.” (2) See, for example, the article “The UK now faces a ‘lost decade’ ” by M. Wolff published by the Financial Times in 2011.(3) See the article “Europe’s Lost-and-Found Decade” by Barry Eichengreen published by Project Syndicate in 2013.
American countries, the end of the lost decade is generally associated with the Brady plan of 1989 - a scheme put in place to resolve the debt crisis. The long time taken to find this international political agreement delayed the countries’ return to international capital markets and is considered a key reason behind the lost decade. In Japan, the long time taken to restructure the banking industry is generally seen as one of the main reasons for the failure of several policy attempts to escape from the deflationary trap.
1.3 The euro area is showing signs of entering a lost decade
After six years of economic and financial crisis, macroeconomic activity in 2013 was below its 2007 level for most countries in the euro area, with the notable exception of Germany. Figure 2A shows real GDP growth for selected countries (four countries in the euro area and three comparable economies: Japan, UK, and the US). Only Germany and the US have succeeded in recovering to pre-crisis levels, with an overall increase of 4% between 2007-2013, against a modest 0.7% in France and negative values for the other countries. The picture worsens if we look at real GDP per capita, as shown in Figure 2B. In this scenario, only German residents are (on average) richer than before the crisis, US and Japan residents have just recovered to pre-crisis level, while in all the other countries people are poorer than before the crisis, with the strongest decline seen in Italy. A 10% fall in real output per capita can be viewed as a “rare macroeconomic disaster” (see Box 1) suggesting that the risk of a lost decade in Europe appears a serious one. The risk for the euro area is it fails to build a “smart, sustainable and inclusive economy”, as targeted by the European Commission in its strategy for 20204. Indeed, facing a crisis similar to the US and the UK, the euro area has undertaken
(4) See the communication from the Commission “Europe 2020 a strategy for smart, sustainable and inclusive growth” and the website http://ec.europa.eu/europe2020/index_en.htm.
0.35
0.4
0.45
0.7
0.8
0.9
0.25
0.3
0.5
0.6
1970 1980 1990 2000 2010
Japan (left scale) Mexico (right scale)
Figure 1 – Two examples of a lost decade(Per capita GDP relative to the US)
Source: OECD.

CEPII – Policy Brief No 2 – April 2014 3
Policy Brief
macroeconomic and banking-sector recapitalisation measures that may, in fact, have prolonged the economic downturn.
1.4 A lost decade erases past investments, shifting growth downwards
The nature of a lost decade is that it cancels out the benefits of past investments (in capital accumulation, infrastructure development, market reputation, technological advances, and human capital formation), with the inevitable result that long-term economic growth shifts down a gear. Growth theories relate long-term economic growth to productivity, capital efficiency, population growth, and technological progress. In other words, growth is the accounting result of the accumulation of production factors (labour and capital) and the efficiency with which they are used. The latter is enhanced by technical progress, and measured by total factor productivity (TFP). Assessing the foreseeable costs of the crisis requires understanding the ways through which each of these growth components could be affected, and the corresponding time horizon.
1.5 What are the pressures on the euro area?
Focusing on the euro area, we look at the current pressures on the economy, explain how these could weaken or delay a recovery, and discuss policies that may be helpful. In short, this paper focuses on the long-term consequences of the 2007/2008 crisis, and asks two main questions: i) will there
Euro area; -1.7%
Germany; 4.2%
France; 0.7%
Italy; -8.5%
Spain; -5.9%
USA; 5.9%
Japan; 0.3%
UK; -1.4%
-9.0% -7.0% -5.0% -3.0% -1.0% 1.0% 3.0% 5.0%
Figure 2A – Diverging trajectories following the crisis(Real GDP growth 2007-2013)
Figure 2B – An even stronger shock for standard of living(Real GDP per capita growth 2007-2013)
Source: OECD.
UK 6 2%
Euro area; -3.5%
Germany; 4.4%
France; -2.3%
Italy; -11.0%
Spain; -8.3%
USA; 1.0%
Japan; 0.7%
UK; -6.2%
-12.0% -10.0% -8.0% -6.0% -4.0% -2.0% 0.0% 2.0% 4.0%
Box 1. Business Cycle MethodologyThere is no rigorous definition for the lost decade, but this notion can be illustrated using the business cycle methodology.Burns and Mitchell (1946), still the key reference in this area, define a business cycle as the sequence of changes between expansions and recessions, from peaks to troughs. Today, the NBER (for the US Economy) and the CEPR (for the Euro-Area) follow a methodology to identify these changes that is close to the one originally proposed by Burns and Mitchell. Interestingly, while these authors quantified the duration of cycles (“from more than one year to ten or twelve years”), they did not do so for a cycle’s magnitude. Therefore, the 2001 and 2007-2009 episodes are classified by the NBER under the same definition for the US economy, recession, despite obvious differences between them.Several proposals have been made to take into consideration the magnitude of business cycles, to distinguish regular fluctuations from irregular events. Kehoe and Prescott (2002) edited a special volume of the Review of Economic Dynamics on the Great Depressions of the 20th Century. For the authors, during a Great Depression, “de-trended output per working-age person must fall at least 15% within the first decade of the depression” with a final “deviation at least 20% below trend”. According to these definitions, the lost decades of Argentina, Chile and Mexico in the 1980s are qualified as Great Depressions by the authors, whereas Japan’s lost decade is qualified as a not-quite-great depression (the fall is below 15% within the first decade of the depression). The authors emphasised that the economy may not return to the original trend path at the end of a depression. However, the choice of the original trend is crucial and may lead to opposite conclusions.Barro (2006) proposed the notion of rare economic disaster defined as “a peak-to-trough fall in per capita GDP by at least 15%” and more recently as a fall of 10% in Barro and Ursua (2008). This figure (10%) is below the figures proposed by Kehoe and Prescott (2002), but series are not de-trended to identify rare disasters. Using historical data that start in 1870, Barro and Ursua (2008) conclude that the disaster probability is around 3.6% per year, the disaster size has a mean of 21-22% and an average duration of 3.5 years. Emerging countries as Argentina or Mexico experienced rare disasters in the 1980s, but not Japan after World War II.

4 CEPII – Policy Brief No 2 – April 2014
Can the Euro Area avoid a “lost decade”?
be any permanent damage to the euro area economy; ii) could adequate public policies prevent this damage? First, we look at how the crisis could have durably harmed investment and thus the means of production, through a sustained decrease in the capital stock and the aging of infrastructure (section 2). Second, we study how persistently high unemployment and changing demographics could lead to a decrease in the number and the quality of jobs (section 3). Third, we show how the debt overhang from the financial crisis may maintain financial constraints on the private and public sectors weighing on growth prospects (section 4). In each section, we focus on developments in the euro area as a whole (when data is available), and in France, Germany, Italy and Spain, which together account for 80% of the euro area economy. For comparative purposes, we report the same data for the US, the UK, Japan and when relevant, OECD countries. Policy implications are discussed in the last section.
2 The possible deterioration of production capacities
2.1 Investment: no clear trend towards recovery
The first channel through which a crisis can lead to a permanent cut in capital stock is via falling investment and the permanent dismantling of unused production lines. If investment recovery is weak or non-existent, the deterioration of the capital stock will be long lasting. The standard way to measure investment is Gross Fixed Capital Formation (GFCF), defined in the national accounts as acquisition less disposals of productive fixed assets, i.e. assets intended for use in the production of other goods and services for a period of more than a year.Figure 3A below depicts the ratio of GFCF over GDP in the 2002-2013 period for the four major economies (Germany, France, Italy, and Spain) of the euro area; for comparison, Figure 3B displays the same series for the euro area as a whole
and the US, Japan, and UK. To get a clear idea of the trends for productive investment, we also report, for the same countries,5 the ratio of GFCF over GDP excluding residential investment, in Figures 4A & 4B.
Investment has dropped and is failing to recover in the euro area. None of the countries/areas we have looked at have got back to pre-crisis levels. However, there has been no real recovery in the euro area, where the trend remains
(5) This indicator is not available for the euro area as a whole.
17%
19%
21%
23%
13%
15%
2002 2004 2006 2008 2010 2012USA Japan UK Euro area
Figure 3B – A worldwide, synchronized fall(GFCF over GDP, %)
22%
27%
32%
19%
20%
21%
22%
17%
%
17%
18%
2002 2004 2006 2008 2010 2012
Germany France Italy Spain
Figure 3A – A general slump in investment in the euro area, a collapse for Spain(GFCF over GDP, %; Right scale for Spain)
Source: Eurostat.
Box 2 – The lost decade and policymakers“The primary macroeconomic challenge for the next 10 years is to ensure that they do not turn into another ‘lost decade’.”Jean-Claude Trichet, President of the ECB (Jackson Hole, Wyoming, 27 August 2010)“(...) simultaneously with fiscal consolidation, we have to take structural measures that will lift our potential output growth. In my view, the big risk is that once the recovery gets more robust, we sit idly in self-complacency and forget the structural reforms. That would lead us to a sluggish recovery – or even a lost decade.”Olli Rehn, European Commissioner for Economic and Monetary Policy (Brussels Economic Forum Brussels, 25 May 2010)“I do not agree with those who say that Europe is in a ‘lost decade’. Euro area countries are using the second decade of the euro to undo the mistakes of the first – and in doing so, laying the foundations for sustainable growth in the decades to come.”Mario Draghi, President of the ECB (Berlin, 21 November 2013)

CEPII – Policy Brief No 2 – April 2014 5
Policy Brief
downwards, and the loss since 2007’s peak is more than 3 percentage points. Italy is on a very similar path, and France and Germany, after a short recovery in 2010-2011, seem to be once more on a downward trend. The contraction in Spain is by far the strongest: the investment rate has decreased by more than one third since its peak of 2007, falling from almost 31% to less than 18% in 2013. This highlights the importance of the real estate bubble supporting the dynamics of Spanish growth before 2008 (see below). To a lesser extent, this was also the case for the UK: following its decline by almost 4 percentage points since the 2007 peak, the rate of investment has fallen to an historical low. Conversely, it is striking to see that after steep falls (especially in the US, by 5 percentage points) investment rates in Japan and the US seem to have been on a constant recovery path since 2010.
The deceleration of non-residential investment is more structural. Looking at non-residential investment allows an even clearer picture to emerge. Figures 4A and 4B show that for Spain, the UK and to a lesser extent, France and Italy, most of the pre-2008 dynamics of investment were actually driven by real estate: the non-residential investment rate was constant or had already started to decrease before the crisis. The trajectory seems flatter for the US, the productive investment rate fluctuating in a narrow band between 13.5 and 14% until 2009, when the crisis brings it below 12%. Only Japan and to a lesser extent Germany display a relatively constant profile of their productive investment rate over the whole period,
15%
17%
19%
21%
11%
13%
2002 2004 2006 2008 2010 2012
Germany France Italy Spain
Figure 4A – The fall in investment is not entirely driven by real estate in the EA... (Private non-residential and government GFCF over GDP, %)
11%13%15%17%19%21%
5%7%9%
2002 2004 2006 2008 2010 2012USA UK Japan
Figure 4B – ... but is for other advanced economies (Private non-residential and government GFCF over GDP, %)
Source: Datastream.
Box 3. The Japan Lost Decade Controversy and the Fear of Deflation1
Recently, the relevance of Japan’s lost decade has been debated, on the grounds of Japan’s unusual demographics. Among others, Krugman (2013) points out: “You can argue that demographically adjusted, the whole tale of Japanese stagnation is a myth.” However, Japanese slow or no growth in the nineties remains a robust fact, and appears therefore as a useful reference for the Euro Area situation. Moreover, Eichengreen (2013)2 points out that Europe’s economy presents similar structural weaknesses to those at the beginning of the 1990s in Japan. It is notably the deflation that is a key characteristic of the recent Japan experience. The current crisis started with huge falls in inflation rates around the world (driven partially by the fall in energy prices) and episodes of deflation for the US economy and Euro Area. After a quick recovery to pre-crisis levels in 2012, inflation rates in the Euro Area have since fallen well below 2%. Deflation is therefore still a relevant concern for the recovery given its negative impact on real costs (that is the nominal prices of debts and wages divided by production prices) and on aggregate demand (falling prices delay consumption and investment).
1 “The Japan Story” published by the New York Times (February 5, 2013).2 “Why-europe-will-avoid-a-lost-decade” published by Project Syndicate (March 19, 2013).
1
2
3
4
5
6Euro Area JapanUnited Kingdom United States
-3
-2
-1
0
Jan-02 Jan-03 Jan-04 Jan-05 Jan-06 Jan-07 Jan-08 Jan-09 Jan-10 Jan-11 Jan-12 Jan-13 Jan-14

6 CEPII – Policy Brief No 2 – April 2014
Can the Euro Area avoid a “lost decade”?
appearing immune both to the pre-2008 real estate bubble and the post-2008 crisis.
All in all, there was no clear sign of investment recovery in the euro area and in the UK by the end of 2013, which may be reflected in a lasting impact on the capital stock. To put these trends into perspective, it may be useful to compare them with those of investment during the Great Depression. In the US, Cole and Ohanian (1999) report that business investment fell nearly 80% between 1929 and 1933, while household investment (consumer durables) declined by more than 55% over the same time span. As a consequence, investment’s share of GDP fell from 25% in 1929 to 8% in 1932. During the 1934–39 recovery, the proportion of GDP devoted to investment averaged about 15%, compared to its postwar average of 20%. It seems clear that the contraction of investment in the US during the Great Depression was much greater than in any of our considered countries for the period 2008-2009 – only Spain can arguably be said to have suffered a shock comparable in size. However, both the sizes of the persistent gaps between current and pre-crisis levels of investment, and the inability of most of the countries/areas to close them are reminiscent of the US situation in the second part of the thirties. Cole and Ohanian (1999) note that in the US this lower rate of investment led to a decline in the capital stock: the gross stock of fixed reproducible private capital declined by more than 6% between 1929 and 1939, negatively impacting potential output.
2.2 R&D: no sign of deterioration for now
The fall in investment may also impact negatively TFP in the short term, because of capital stock aging.6 However, over the long run, a much more substantial impact could be caused by Research and Development (R&D) spending cuts.7 R&D spending is highly cash-consuming, and in times of crisis, financial constraints are harder and more binding (see Aghion et al., 2012, on the cyclicality of R&D spending). Figure 5 below presents the ratio of R&D gross expenditures over GDP as averages over the periods 2002-2007 (before the crisis) and 2008-20128 (since the crisis started) for the EU-159 as a whole, Germany, France, Italy, Spain, and, again for comparison purposes, for all OECD countries, the US, Japan, and the UK.The picture is quite different from the one for investment. Two important facts stand out. First, there has been no downward trend for R&D spending. The ratio has actually slightly increased since before the crisis period. R&D
(6) This effect is however hard to assess, because of the well-known difficulties in measuring the quality of capital stock.(7) See Aghion and Howitt (2009), chapters 3 and 4, for an analytical presentation of the growth enhancing effects of innovation and R&D.(8) Figures are not available yet for 2013. (9) No figure was available for the euro area, but the trend seen in the EU-15, which is made of the 12 founding countries of the euro area, plus Denmark, UK and Sweden, should be very close to that of the euro area.
spending in absolute terms certainly decreased during the hardest times of the recession, but at a slower rate than GDP. For now, it seems to be remaining fairly stable everywhere. Second, EU-15 as a whole, France and especially the UK, Italy and Spain, are still lagging behind the OECD, the US and Japan in terms of R&D effort. A noticeable exception is Germany, where the ratio is now only very slightly below that of the US.For the moment at least, we can conclude from these figures that no long-term impact of the crisis on TFP should be expected. A less positive conclusion is that R&D efforts are still insufficient (or not efficient enough)10 in the EU to enhance potential growth in a way compatible with the objectives of the agenda “Europe 2020”.11
2.3 Exported products: an acceleration of a restructuring process?
Another interesting way to gauge the lasting effects of the current crisis is to examine the degree of diversification (or, conversely, specialization) of exports. Developed countries tend to have a highly diversified portfolio of export products (which constitutes a “natural” protection against idiosyncratic shocks). A consequence of the crisis could be (because of the supply chain disruption and dismantling of unused production lines) that some products are dropped from export, with potential consequences over the long run. Indeed, recent trade academic research shows that entering an export market is more costly than exporting greater amounts to a market already entered; in technical terms, the sunk costs of exports are higher
(10) In the case of France, the system of tax credit for R&D set up in 2008 appears to have had limited success and been costly (see the report by the French Government Accountability Office – Cour des comptes – in 2013).(11) The “Europe2020” strategy sets a 3% objective for R&D expenditure as a percentage of GDP.
2%
3%
4%
0%
1%
2002-2007 2008-2012
Figure 5 – Innovation spending seems to be spared so far(Gross expenditures on R&D over GDP, %)
Source: OECD, MSTI database.

CEPII – Policy Brief No 2 – April 2014 7
Policy Brief
than fixed continuing costs.12 Firms that have given up lines of products may well therefore have done so permanently. Figures 6A, 6B and 6C below display the number of HS613 products exported over the 2002-2011 period. Figure 6A presents the trend for France, Germany, Italy, and Spain, and Figure 6B for the euro area, Japan, UK and the US. For illustration purposes, we include a sample of emerging and developing countries (Brazil, China, India, Indonesia, and Vietnam) in Figure 6C.In developed economies, there was a slight, but regular, downward trend before 2007, when an obvious break arises. Since the start of the crisis, the reduction in the number of exported products has considerably accelerated, with all developed economies losing between 250 and 350 products, except in the US, where the loss is “only” 150 products. If we now turn to emerging economies, the picture is strikingly different. There has been a trend towards a reduction in the number of products over the decade for some of the big emerging economies (Brazil, China, India), but it is clearly less marked than for developed countries. And what is even more interesting is that for some emerging countries, like Brazil and Indonesia, the trend reverses in 2010 when the number of products starts to rise, while a smaller economy like Vietnam has stayed on an upwards path, with a gain of 600 products over the decade.Obviously, one should be very cautious in interpreting these results. First, recent research shows that export diversification follows a hump-shaped pattern along the economic development path: countries tend to diversify their trade when they develop, before concentrating again at some point (see Cadot, Carrère and Strauss-Kahn, 2011). The trends depicted in Figures 6A and 6B could therefore be a normal feature of highly developed countries, even if the acceleration of the phenomenon with the crisis remains unsettling. Besides, some simple calculations show that products which “disappeared” in 2011 represented only 0.2% of the total euro area exports in 2002 (the figure slightly increases to 0.5% if we consider the products which disappeared in 2010, compared to trade in 2000).
(12) Evidence in line with this view is provided by Das et al. (2007), who find, using Colombian firm-level data, that sunk costs of entry into the export market represent between 18.4% and 41.2% of the annual value of a firm’s exports. The fixed costs associated with the continuation of the exporting activity are estimated to be considerably lower, i.e. around 1% of the value of exports.(13) The Harmonised Commodity Description and Coding System (HS) is an international nomenclature for the classification of products. It classifies goods in a six-digit code system. The HS-6 level is the most disaggregated internationally comparable one, with more than 5,000 products registered.
3 The deterioration of the labour market
The labour market is fundamental to understanding the mechanisms of a lost decade and the conditions needed for a recovery. Rising unemployment has led to a deterioration in human capital, with displaced workers not only losing financially in the short term, but more significantly, risking becoming
4,750
4,800
4,850
4,900
4,950
5,000
4,600
4,650
4,700
2002 2003 2004 2005 2006 2007 2008 2009 2010 2011
Germany France Italy Spain
Figure 6A – Export portfolio shrinks: should we worry?(Number of HS-6 products exported)
4,7004,7504,8004,8504,9004,9505,000
4,5004,5504,6004,650
2002 2003 2004 2005 2006 2007 2008 2009 2010 2011
USA Japan UK Euro Area
Figure 6B – The fall is common to all advanced economies...(Number of HS-6 products exported)
3 800
4,000
4,200
4,400
4,600
4,800
5,000
3,200
3,400
3,600
3,800
2002 2003 2004 2005 2006 2007 2008 2009 2010 2011
India Brazil Indonesia Vietnam China
Figure 6C – ... but not to emerging ones(Number of HS-6 products exported)
Source: CEPII - BACI

8 CEPII – Policy Brief No 2 – April 2014
Can the Euro Area avoid a “lost decade”?
unemployable as their current skill sets atrophy and they miss out on accumulating new skills. This is not just an issue for the unemployed: owing to market externalities, high rates of unemployment lower the productivity of the economy as a whole and could lead to a persistent reduction in the supply of vacant jobs for all workers. Unemployment is also detrimental to long-term growth through its negative impact on investment in human capital.
3.1 Job losses in the euro area
In 2013, total employment was equal to 139 million for the euro area, down from the maximum of 144 million reached in 2008. In addition to the loss of five million jobs (or 3.4% of the total number of jobs in 2008), the crisis has also halted the trend of job growth in Europe. A simple extrapolation of this trend of 1.6% per year since 2008 would give a total of 157 million jobs by 2013. Therefore, the absolute five million jobs lost is at the lower end of the true loss, which could be as high as seventeen million jobs.The crisis has also ended the narrowing of the gap in the employment rate between the euro area and comparable countries. In 1997, the employment rate in the euro area was 58%, more than ten percentage points below the level in the US or Japan. After ten years of steady narrowing, the gap with the US economy had more than halved by 2008, leaving the euro area employment rate at a level very close to the OECD average. It is important to note that European labour markets are highly heterogeneous and have been widely differently affected by the crisis. These differences are important because all European countries are committed to the “Europe 2020” agenda and its objective of an employment rate of 75% of 20-64 year-olds. France and Italy look most representative of the euro area as a whole with employment and unemployment rates close to the average for the region. Spain has experienced the most severe labour market crisis with an unemployment rate now exceeding 25%, reversing fifteen years of rising employment and falling unemployment. Germany is an outlier in the euro area, being the only country where, between 2008 and 2013, the employment rate increased, while the unemployment rate fell (see Burda and Hunt - 2011 - for an investigation of the German experience).
3.2 Beyond the crisis: the role of demographics
After several years of financial crisis, a key issue now for the euro area is to restore its pre-crisis trend of jobs growth. The primary difficulty in achieving this is demographic - the last seven years have also been a time of a deep demographic shift. While the working-age
130
135
140
145
150
155
160
120
125
130
1997 1999 2001 2003 2005 2007 2009 2011 2013
Jobs Trend (1997-2007)
Figure 7 – Employment growth: the sudden stop(Total employment in the euro area in millions vs. trend)
Source: OECD.
61
63
65
67
69
71
73
75
55
57
59
1997 1999 2001 2003 2005 2007 2009 2011 2013
USA Euro area UK Japan
Figure 8 – Broken trends in employment rates(Employment rate)
Source: OECD.
It l 5 2%
Japan; 1.1%
Spain; -17.1%
UK; -1.0%
USA; -6.2%
Euro area; -3.1%
France; -0.3%
Germany; 6.3%
Italy; -5.2%
-18.0% -14.0% -10.0% -6.0% -2.0% 2.0% 6.0%
Figure 9 – Employment falls everywhere but in Germany(Change in employment rate, 2007-2013)
Source: OECD.

CEPII – Policy Brief No 2 – April 2014 9
Policy Brief
population grew steadily at an annual rate of 0.4% between 1985 and 2008, it was almost flat in 2010 and fell since 2012. As Figure 11 shows, the euro area demographic trend is converging with that of Japan and diverging from the US, where the working-age population is still growing at a substantial rate. This implies that the trend of job growth will certainly be slower in the future given the strong inertia of underlying demographics. The situation may be worsened if the euro area fails to recover its pre-crisis level (and trend) in the employment rate and unemployment remains high.
3.3 The risk of persistent high unemployment
High unemployment could persist even after the causes of the crisis have completely disappeared because of the hysteresis phenomenon. Hysteresis is a notion that became popular in economics to explain why unemployment remained high in the 1980s despite the disappearance of the shocks at the start of the crisis at the end of the 1970s
(such as oil price shocks, increase in interest rates, high inflation). To assess the current risk of hysteresis, it is necessary to distinguish between the cyclical and structural components of unemployment. If the unemployment increase is cyclical, the solution is the ending of the crisis via expansionary macroeconomic policies. If it is structural, as data from the ECB (2012) suggests,14 ending the crisis will not be enough and without specific policies to revive the labour market, the economy will experience a higher long-term unemployment rate, also called the “natural rate of unemployment” or Non-Accelerating Inflation Rate of Unemployment (NAIRU).Two main mechanisms usually explain how cyclical unemployment gives birth to structural unemployment during a severe crisis: discouraged workers lessen their efforts to find work and long-term unemployment makes workers unemployable. New mechanisms have also been put forward to explain the severity of the current unemployment crisis, like the skill mismatch resulting
from the housing crisis and ensuing large drop in the share of construction employment (Hobijn and Şahin, 2013), and the reduced recruiting intensity of businesses following a “wait and see” strategy, as a result of heightened political uncertainty (Leduc and Liu, 2013).
4 Paying for past accumulation of debt
The current crisis is characterised by a large “debt overhang”, both in the private and the public sector. The high debt level is not only the result of the current crisis: debt accumulation also grew during the previous growth cycle, mainly in the private sector, and it is now undermining growth prospects. It is commonly recognised that a large amount of debt is detrimental to growth. However, the magnitude of the effect, or the existence of a threshold, is still controversial (Egert Balazs, 2013). More importantly, a consensus on the correct policies to reduce public debt or promote the reduction of private debt, contingent on economic conditions, still appears beyond reach.
(14) According to the ECB (2012) measures of European structural unemployment rates between 2007 and 2010, (provided by the IMF, the OECD and the European Commission) increased in all European countries, except Germany and Austria, with considerable heterogeneity. For example, OECD (2013) estimates of the NAIRU moved from 7.4% in 2008 to 6.7% in 2012 in Germany, from 8.4% to 9.1% in France and from 13.5% to 18.1% in Spain. For the US economy between 2007 and 2010, Daly et al. (2012) report a 1.5 percentage points increase in the structural unemployment rate, far below the observed increase in unemployment rate, of 5.6 percentage points.
0 00%
0.50%
1.00%
1.50%
2.00%
2.50%
-1.00%
-0.50%
0.00%1997 1999 2001 2003 2005 2007 2009 2011 2013
euro area (17 countries) United States Japan
Figure 11 – Declining demographics in the EA and Japan but not in the US(Working-age population, growth rate)
Source: OECD.
F 2 3
Italy; 6.1
UK; 2.2
USA; 2.8
Japan; 0.2
Germany; -3.2
Euro area; 4.4
Spain; 17.9
France; 2.3
-5.0 0.0 5.0 10.0 15.0 20.0
Figure 10 – A worldwide sharp rise in unemployment except in Germany(Change in unemployment rate, 2007-2013)
Source: OECD..

10 CEPII – Policy Brief No 2 – April 2014
Can the Euro Area avoid a “lost decade”?
4.1 Charybdis: A strong deleveraging in private debt…
Household and non-financial firm debts have been the main drivers of growth periods since 1980The household debt-to-GDP ratio has increased in all advanced economies for the past 30 years. Figures 12A & 12B below display the figures for the same set of countries used previously, plus Canada for comparison purposes. The upward trend is not linear: the US, the UK and Canada have seen two large credit cycles since the 1980s: one in the second half of the 1980s, the other in the first half of the 2000s. Spain and, to a lesser extent, Italy and France only experienced the most recent one. Germany and Japan are two outliers as their credit cycles are not contemporary with other advanced economies: Germany had a short buoyant cycle just after its reunification whereas Japan experienced a long leveraging cycle in the 1980s that ended with an extended period of stagnation, its so-called lost decade, in the 1990s (see Box 3).The evolution of household debt has mirrored the economic cycle in advanced economies. A common upward trend in private, non-financial debt-to-GDP ratio over the last 30 years has raised private leverage to unprecedentedly high levels (see Schularick and Taylor, 2012). This leverage trend ended during the crisis and the shift in households’ saving behaviour has been an important driver of the low economic growth rate since then. The evolution of non-financial firms debt (Figures 13A & 13B) has also mirrored the business cycle and shown an upward trend in most countries during the last 30 years. The increase in firm debt was particularly significant at the end of 1990s, driven by the IT bubble in the US, UK, Spain and France and the trend endured up to the mid-2000s. Germany and Japan are outliers again: firm debt has remained stable in Germany while in Japan it reduced by more than 40% of GDP during its lost decade.
Current private deleveraging is weighing on economic growth Since 2008, household and firm debt has declined in most countries. This massive private deleveraging process is
now weighing on the growth rate. In fact, the large increase in the household net saving rate during the crisis, with no corresponding increase in investment by firms, has revived the “paradox of thrift” theory popularised by Keynes (Chamley, 2012). Accounting definitions imply that this phenomenon has to be reflected either in decreasing government savings or an improvement in the current account, or both. Indeed, the countries that have experienced the largest decline in household debt have also seen a large current account “improvement”, i.e. a decline in domestic demand that mechanically reduces
Box 4 – Labour market reformsReforms have been most significant in Spain: allowing greater flexibility in adjusting hours and wages and introducing a new employment contract to avoid the segmentation of the labour market. These may have played a role in the improvement of competitiveness in the last few years, but the unemployment rate has still strongly increased and the new contract is still underused by firms. In France, reforms initially dealt with increasing labour market flexibility (i.e., working time annualisation and voluntary contract ending). More recently, the government has targeted cost-competitiveness through a reduction in labour taxation. In Germany, reforms to increase flexibility in hours and wages and allow low wage part-time contracts were introduced in the 2000s. The government is now planning to introduce a minimum wage.In Italy, the labour market reforms initiated by the Monti government were partially rescinded by the succeeding government. The new Italian Prime Minister, Matteo Renzi, has announced a series of labour market reforms, but has given no detailed agenda.
30
40
50
60
70
80
90
0
10
20
30
1980 1984 1988 1992 1996 2000 2004 2008 2012
Germany France Italy Spain
Figure 12A – The burden or household debt now clearly weighs on growth, exept in Germany...(Household debt, percentage of GDP)
Source: Datastream.
60
70
80
90
100
110
120
30
40
50
60
1980 1984 1988 1992 1996 2000 2004 2008 2012
USA Japan UK Canada
Figure 12B – ... and in Japan(Household debt, percentage of GDP)

CEPII – Policy Brief No 2 – April 2014 11
Policy Brief
imports, and a deterioration in the public balance owing to a slump in revenues. The current low inflation in the euro area is making this process of deleveraging more difficult and painful as the nominal drop in interest rates is largely offset by the reduction in the nominal income growth rate (Figure 14).
4.2 … and Scylla: constraints on increasing or reducing public debt
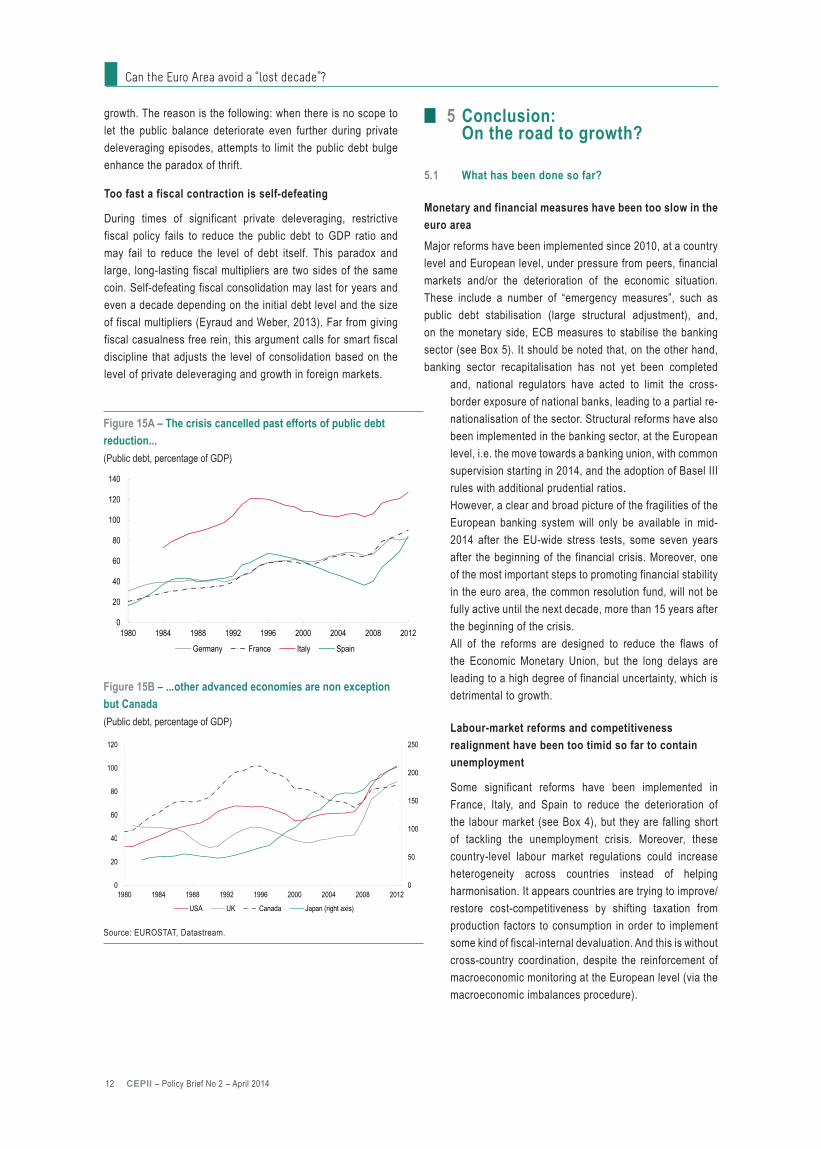
Public debt management before the 2008 crisis ignored the risks related to high private leveraging The evolution of public debt (Figures 15A & 15B below) during the last 30 years reflects both the economic cycle and the importance of sustainability issues. Public debt generally increases in periods of economic downturn, but most developed countries have seen a constant upward trend throughout the last 30 years. This can be explained by looser credit constraints on the public sector (the real interest rate on government bonds declined following the 1980s’ disinflation) or less attention being paid to long-run sustainability. Canada is the only country where public debt at the end of 2012 was lower than the previous peak, i.e. after the 1991-92 recession.
The relationship between private debt dynamics and the business cycle has been well documented. The work of Hyman Minsky, 30 years ago, emphasised the role of asset price drops in triggering deleveraging of the private sector and recessions (known as the Minsky moment). The link between private deleveraging and falls in growth and employment has been even stronger in the last three recessions in the US (1991, 2001 and 2008).The relationship between public debt and the business cycle is less clear as two opposite forces are at play. Under the Minsky paradigm, during government expenditure-induced expansions (particularly due to war expenditures, as they can be considered as independent from the business cycle), public debt increases. During a private leveraging boom, public debt decreases, but increases generally just after the Minsky moment, when the private sector starts to deleverage.
Where fiscal space is absent, the crisis is deeper and longer Following the controversial paper, Reinhart and Rogoff (2010), many studies have estimated the effect of government debt on economic growth (searching for the existence of a “deterring-growth” threshold value of public debt) and have enlarged the remit to include private non-financial debt (Cecchettiet al., 2011). A recent study by Jordà, Schularick and Taylor (2013) shows that private debt has historically been the starting point of the leverage cycle, with public debt at that stage in the cycle being mainly passive. In advanced economies, the subsequent private deleveraging phase leads to low growth – the higher the level of accumulated private debt the more the
growth prospects are reduced in the medium to long term. In this phase, public debt starts to matter too. A high level of public debt exacerbates the damaging effect of high private debt on
0.02
0.03
0.04
0.05
0.06
0.07
-0.02
-0.01
0
0.01
Germany Spain France Italy
2003-2008 2008-2013
Figure 14 – Large reduction of nominal income growth rate cancelled out interest rate drop in the euro area(Nominal GDP growth rate, percentage, five year average)
Source: EUROSTAT.
60
80
100
120
140
0
20
40
1980 1984 1988 1992 1996 2000 2004 2008 2012
Germany France Italy Spain
Figure 13A – Firms are also highly indebted in the EA(Non-financial corporation debt, percentage of GDP))
Source: Datastream.
60
80
100
120
140
0
20
40
1980 1984 1988 1992 1996 2000 2004 2008 2012
USA Japan UK Canada
Figure 13B – ... and in Japan(Non-financial corporation debt, percentage of GDP))
12 CEPII – Policy Brief No 2 – April 2014
Can the Euro Area avoid a “lost decade”?
growth. The reason is the following: when there is no scope to let the public balance deteriorate even further during private deleveraging episodes, attempts to limit the public debt bulge enhance the paradox of thrift.
Too fast a fiscal contraction is self-defeating
During times of significant private deleveraging, restrictive fiscal policy fails to reduce the public debt to GDP ratio and may fail to reduce the level of debt itself. This paradox and large, long-lasting fiscal multipliers are two sides of the same coin. Self-defeating fiscal consolidation may last for years and even a decade depending on the initial debt level and the size of fiscal multipliers (Eyraud and Weber, 2013). Far from giving fiscal casualness free rein, this argument calls for smart fiscal discipline that adjusts the level of consolidation based on the level of private deleveraging and growth in foreign markets.
5 Conclusion: On the road to growth?
5.1 What has been done so far?
Monetary and financial measures have been too slow in the euro area Major reforms have been implemented since 2010, at a country level and European level, under pressure from peers, financial markets and/or the deterioration of the economic situation. These include a number of “emergency measures”, such as public debt stabilisation (large structural adjustment), and, on the monetary side, ECB measures to stabilise the banking sector (see Box 5). It should be noted that, on the other hand, banking sector recapitalisation has not yet been completed
and, national regulators have acted to limit the cross-border exposure of national banks, leading to a partial re-nationalisation of the sector. Structural reforms have also been implemented in the banking sector, at the European level, i.e. the move towards a banking union, with common supervision starting in 2014, and the adoption of Basel III rules with additional prudential ratios. However, a clear and broad picture of the fragilities of the European banking system will only be available in mid-2014 after the EU-wide stress tests, some seven years after the beginning of the financial crisis. Moreover, one of the most important steps to promoting financial stability in the euro area, the common resolution fund, will not be fully active until the next decade, more than 15 years after the beginning of the crisis. All of the reforms are designed to reduce the flaws of the Economic Monetary Union, but the long delays are leading to a high degree of financial uncertainty, which is detrimental to growth.
Labour-market reforms and competitiveness realignment have been too timid so far to contain unemployment
Some significant reforms have been implemented in France, Italy, and Spain to reduce the deterioration of the labour market (see Box 4), but they are falling short of tackling the unemployment crisis. Moreover, these country-level labour market regulations could increase heterogeneity across countries instead of helping harmonisation. It appears countries are trying to improve/restore cost-competitiveness by shifting taxation from production factors to consumption in order to implement some kind of fiscal-internal devaluation. And this is without cross-country coordination, despite the reinforcement of macroeconomic monitoring at the European level (via the macroeconomic imbalances procedure).
60
80
100
120
140
0
20
40
1980 1984 1988 1992 1996 2000 2004 2008 2012
Germany France Italy Spain
Figure 15A – The crisis cancelled past efforts of public debt reduction...(Public debt, percentage of GDP)
Source: EUROSTAT, Datastream.
100
150
200
250
40
60
80
100
120
0
50
0
20
40
1980 1984 1988 1992 1996 2000 2004 2008 2012
USA UK Canada Japan (right axis)
Figure 15B – ...other advanced economies are non exception but Canada(Public debt, percentage of GDP)

CEPII – Policy Brief No 2 – April 2014 13
Policy Brief
Investment and innovation policies in the euro area lack depth and coordinationFew reforms have been designed to promote investment and innovation at a country level despite the critical drop in firms’ profitability observed in many countries, and the external fund cost hike in Spain and Italy. The national initiatives that do aim to promote cooperation between industry and university or to subsidise R&D (the High-Tech initiative in Germany, the National Research Plan in Italy, and National Strategy for Research and Innovation in France) are insufficiently coordinated with European strategy, have low levels of funding, and are too small to tackle the challenges to growth facing the euro area.
5.2 What remains to be done
More structural reforms, more monetary backing and less purely fiscal measures should be the common agendaStructural and cyclical policies are the two main tools to fight a recession. Since 2009, European institutions have put forward structural policies as the main response to the crisis. Five years later, this strategy has not delivered the expected results. While
Box 5 - New European Financial Regulations1
Reforms implemented at the European level following the crisis focus mainly on the financial sector (much more than on innovation or the labour market, for example). This box summarises the timetable for the main reforms to emphasise the long time taken to implement them despite the relatively quick reaction by European institutions. There are three main stages of reforms.1st Stage: reforming financial supervision (2009-2011). In 2009, the “high-level group on financial supervision in the EU” chaired by J. de Larosière launched a major restructuring of the financial supervision rules under the framework of the new European System of Financial Supervision (ESFS). The latter is based on three new European Supervisory Authorities: the European Banking Authority, the European Securities and Markets Authority, and the European Insurance and Occupational Pensions Authority. The three authorities are coordinated by the Joint Committee of the European Supervisory Authorities and exchange information with national supervisory authorities. The ESFS is complemented by the European Systemic Risk Board, which is in charge of the macro-prudential oversight of the financial system. The ESFS has been in place since 2011 and is in charge of important issues such as the creation of a single rulebook for all financial institutions in the European Union and the implementation of the Basel III framework in the European Union.2nd Stage: organising assistance to countries in crisis (2010-2012). Specific structures have been created to provide financial assistance to Euro Area member states experiencing or threatened by financing difficulties, as in Ireland, Greece and Spain. The European Financial Stability Facility (EFSF) was created in May 2010 as a temporary rescue mechanism and replaced in October 2012 by the European Stability Mechanism (ESM). The ECB decided to make its interventions on sovereign debt markets, known as Outright Monetary Transactions (OMTs), strictly conditional on the existence of an EFSF/ESM program for the concerned country.3rd Stage: reforming the European banking industry (2012-…). This stage was launched after the publication of the report by the “High-level Expert Group on reforming the structure of the EU banking sector” chaired by E. Liikanen in 2012, and is still in progress. The main reform is known as the Banking Union, and relies on two key regulations: the Single Supervisory Mechanism (SSM) regulation and the Single Resolution Mechanism (SRM) regulation. The SSM regulation ensures common rules for the supervision of financial institutions and the SRM regulation establishes a single resolution board and a single bank resolution fund for the resolution of failing banks. The Banking Union is not yet effective although political agreement was reached at the end of 2013 and the ECB has just started to perform a comprehensive assessment of financial institutions. At the beginning of 2014, the European Commission proposed a new reform for the banking industry: the separation of potentially risky trading activities from their deposit-taking business. To sum up, even if financial supervision and the mechanism for financial assistance are now both effective, we are still only at the very beginning of the implementation of reforms for the banking industry.
1 See the Financial Stability Review of November 2013 published by the ECB for a detailed presentation of these reforms and http://europa.eu/rapid/press-release_MEMO-13-1168_en.htm for an update.
we agree that structural reforms are the right tool to sustain growth in the long run and they have been required in the European context, we note that:
1. Most structural reforms take time to increase growth potential and may have recessive effects in the short run. If they have to be implemented during a period of recession, they should be accompanied by strong countercyclical policies to stimulate aggregate demand. Compared with the US, the fiscal agenda in the euro area has been oriented towards consolidation and unconventional monetary policy has been limited.
2. Structural policies are difficult to implement in a European context. Indeed, European countries have already failed to implement the structural reforms set out in the Lisbon strategy of 2000, which defined five priorities in line with the analysis developed in this paper: employment, education, innovation, poverty reduction and climate/energy. Despite clear willingness at a European level, at a national level, buy-in and achievement have been poor. In fact, one could argue we could be looking at two lost decades: as shown in Figure 16, the decline in comparison to the US economy started at the beginning of the 1990s.

14 CEPII – Policy Brief No 2 – April 2014
Can the Euro Area avoid a “lost decade”?
0 6
0.7
0.8
0.9
0.5
0.6
1970 1974 1978 1982 1986 1990 1994 1998 2002 2006 2010
Euro area France Germany Italy Spain
Figure 16 – .The decline started well before the “Great Recession”(Real GDP per capita relative to the US)
Source: OECD..
matching approach to labor markets: Did the natural rate of unemployment rise?”, The Journal of Economic Perspectives, 26(3), 3-26.Das S., Roberts M. J., Tybout & J.R. (2007), “Market Entry Costs, Producer Heterogeneity, and Export Eynamics”, Econometrica 75 (3), 837–873.Dao M. & Loungani P. (2010), “The Human Cost of Recessions: Assessing It, Reducing It (EPub)”, International Monetary Fund.ECB (2012), “Euro Area Labour Markets and the Crisis”, Occasional Paper Series No 138.Egert B. (2013), “The 90% Public Debt Threshold: The Rise and Fall of a Stylized Fact”, CESifo Working Paper No. 4242.Eyraud L. & Weber A. (2013), “The Challenge of Debt Reduction during Fiscal Consolidation”, IMF Working Paper, No 13/67, March.Hobijn B., & Şahin A. (2013), “Beveridge Curve Shifts across Countries since the Great Recession”, IMF Economic Review 61, 566–600.Jordà O., Schularick M. & Taylor A. M. (2013), “Sovereigns versus Banks: Credit, Crises, and Consequences”, NBER Working Paper No. 19506.Kehoe T. J. & Prescott E. C. (2002), “Great depressions of the 20th century”, Review of Economic Dynamics, 5(1), 1-18.Leduc S. & Liu Z. (2013), “Uncertainty and the slow labor market recovery”, FRBSF Economic Letter, 2013, 21.Reinhart C. & Rogoff K. (2010), “Growth in a Time of Debt”, American Economic Review, 100(2), 573-78.Schularick M. & Taylor A. M. (2012), “Credit Booms Gone Bust: Monetary Policy, Leverage Cycles, and Financial Crises, 1870-2008”, American Economic Review 102(2), 1029-61.
ReferencesAghion P., Askenazy P., Berman N., Cette G. & Eymard L. (2012), “Credit Constraints and The Cyclicality of R&D Investment: Evidence from France, Journal of the European Economic Association 10(5), 1001-1024.Aghion P. & Howitt P. (2009), The Economics of Growth, MIT Press.Barro R.J. (2006), “Rare Disasters and Asset Markets in the Twentieth Century,” Quarterly Journal of Economics, 121, August, 823–866. Barro, R.J. & J.F. Ursua (2008), “Consumption Disasters since 1870,” Brookings Papers on Economic Activity, 255–335. Burda M. C. & Hunt J. (2011), “What Explains the German Labor Market Miracle in the Great Recession?”.Brookings Papers on Economic Activity, 2011(1), 273-319.Burns A. F. & Mitchell W. C. (1946), Measuring Business Cycles, NBER.Cadot O., Carrère C. & Strauss-Khan V. (2011), “Export Diversification: What’s Behind the hump?,” The Review of Economics and Statistics 93(2), 590–605.Chamley C. (2012), “A Paradox of Thrift in General Equilibrium without Forward Markets”, Journal of the European Economic Association 10(6), 1215–1235.Cecchetti S., Madhusudan M. & Zampolli F. (2011), “The real effects of debt”, BIS Working Papers 352, Bank for International Settlements.Cole H. & Ohanian L. (1999), “The Great Depression in the United States from a Neoclassical Perspective,” Federal Reserve Bank of Minneapolis Quarterly Review 23(1), 2-24.Cour des Comptes (2013), “L’évolution et les conditions de maîtrise du crédit d’impôt en faveur de la recherche”, Communication à la Commission des Finances de l’Assemblée nationale, juillet.Daly M. C., Hobijn B., Şahin A. & Valletta R. G. (2012), “A search and
Structural reforms are the most efficient way to increase potential growth in the long run and this approach has been the motivating force behind European growth strategy since the beginning of the 2000s. While an economic crisis may represent an opportunity to promote structural reforms, and we believe these are needed, they should not be branded as the sole solution to the crisis. The decade could be lost because of an excess of confidence in the ability to fight a great recession purely with structural reforms.
About the authors Benjamin Carton is economist at CEPREMAP. Jérôme Héricourt is Research Fellow at CEPII and Assistant Professor at University of Lille 1 and EQUIPPE. Fabien Tripier is Scientific Advisor at CEPII and Professor at University of Lille 1 and CLERSÉ.
Contact: [email protected]

Policy Brief
CEPII – Policy Brief No 2 – April 2014 15
CEPII (Centre d’Etudes Prospectives et
d’Informations Internationales) is a French
institute dedicated to producing independent,
policy-oriented economic research helpful to
understand the international economic environment
and challenges in the areas of trade policy,
competitiveness, macroeconomics, international
finance and growth.
CEPII Policy Brief CEPII’s insights on international economic policy
CEPII – Paris – 2014
All rights reserved. Opinions expressed in this publication are those of the author(s) alone.
Editorial Director: Natacha VallaProduction: Sophie de Salée
CEPII113, rue de Grenelle75007 Paris
+33 1 53 68 55 00
www.cepii.fr
Press contact: [email protected]
Previous IssuesTransatlantic Trade: Whither Partnership, Which Economic Consequences? by Lionel Fontagné, Julien Gourdon & Sébastien Jean, No 1, September 2013.
