can technology save us from evolving cybersecurity … · · 2014-11-26can technology save us...
TRANSCRIPT
© 2014 Level 3 Communications, LLC. All Rights Reserved. Proprietary and Confidential.
Chris RichterSenior Vice President, Managed Security Services
November 3, 2014
Can Technology Save Us From Evolving Cybersecurity Threats?
© 2014 Level 3 Communications, LLC. All Rights Reserved. Level 3, Level 3 Communications, the Level 3 Communications Logo, the Level 3 logo and “Connecting and Protecting the Networked World” are either registered service marks or service marks of Level 3 Communications, LLC and/or one of its Affiliates in the United States and/or other countries. Level 3 services are provided by wholly owned subsidiaries of Level 3 Communications, Inc. Any other service names, product names, company names or logos included herein are the trademarks or service marks of their respective owners.
© 2014 Level 3 Communications, LLC. All Rights Reserved. Proprietary and Confidential.
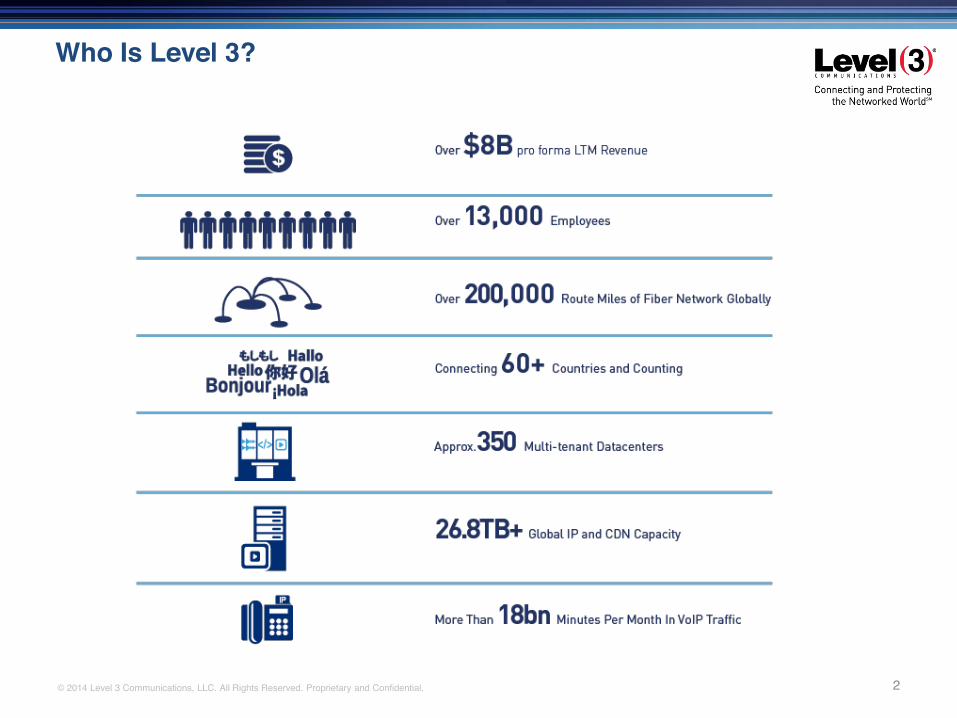
Who Is Level 3?
2
© 2014 Level 3 Communications, LLC. All Rights Reserved. Proprietary and Confidential.
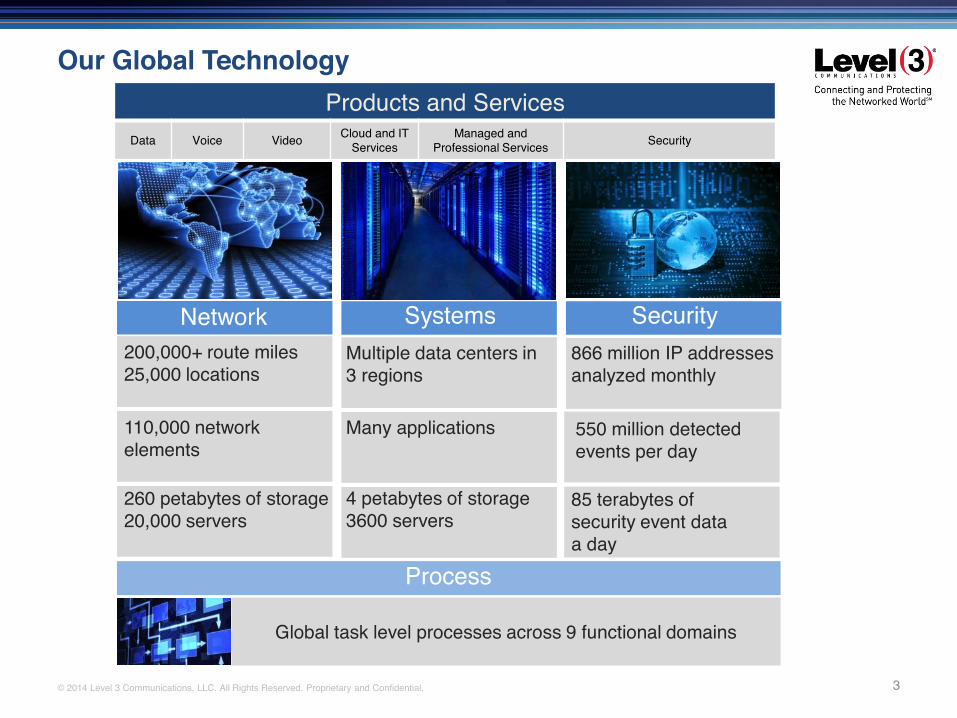
Our Global Technology
Network Systems Security
Process
4 petabytes of storage 3600 servers
Multiple data centers in 3 regions
Many applications
866 million IP addresses analyzed monthly
550 million detected events per day
85 terabytes of security event data a day
Global task level processes across 9 functional domains
260 petabytes of storage20,000 servers
200,000+ route miles25,000 locations
110,000 network elements
Products and ServicesData Voice Video Cloud and IT
ServicesManaged and
Professional Services Security
3
© 2014 Level 3 Communications, LLC. All Rights Reserved. Proprietary and Confidential.
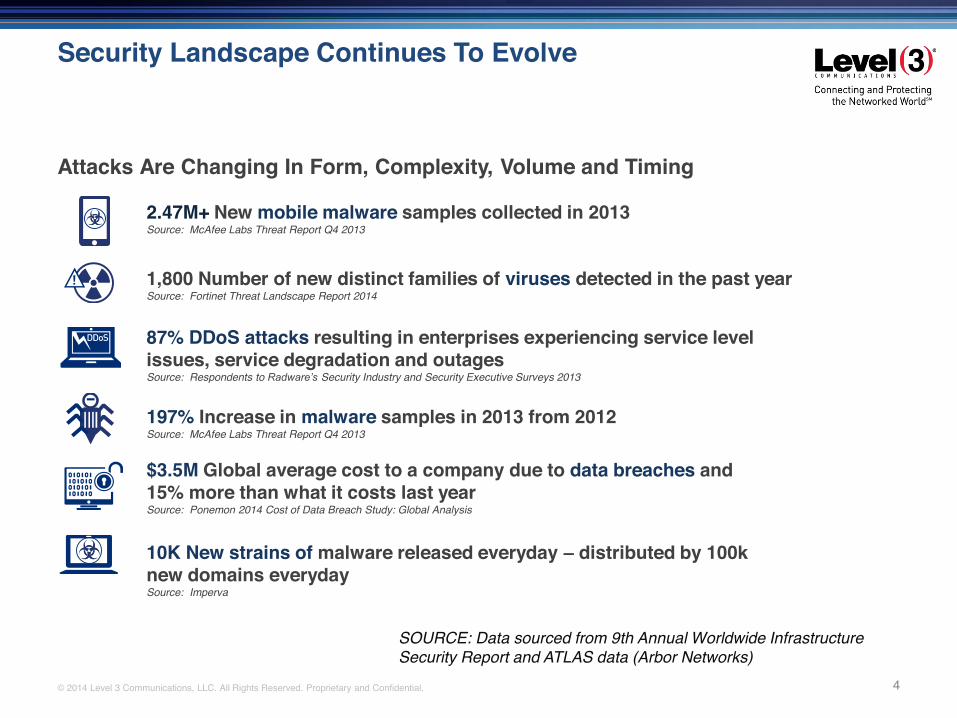
Security Landscape Continues To Evolve
4
Attacks Are Changing In Form, Complexity, Volume and Timing
2.47M+ New mobile malware samples collected in 2013Source: McAfee Labs Threat Report Q4 2013
1,800 Number of new distinct families of viruses detected in the past yearSource: Fortinet Threat Landscape Report 2014
87% DDoS attacks resulting in enterprises experiencing service level issues, service degradation and outagesSource: Respondents to Radware’s Security Industry and Security Executive Surveys 2013
197% Increase in malware samples in 2013 from 2012Source: McAfee Labs Threat Report Q4 2013
$3.5M Global average cost to a company due to data breaches and 15% more than what it costs last yearSource: Ponemon 2014 Cost of Data Breach Study: Global Analysis
10K New strains of malware released everyday – distributed by 100k new domains everydaySource: Imperva
SOURCE: Data sourced from 9th Annual Worldwide Infrastructure Security Report and ATLAS data (Arbor Networks)
© 2014 Level 3 Communications, LLC. All Rights Reserved. Proprietary and Confidential. 5
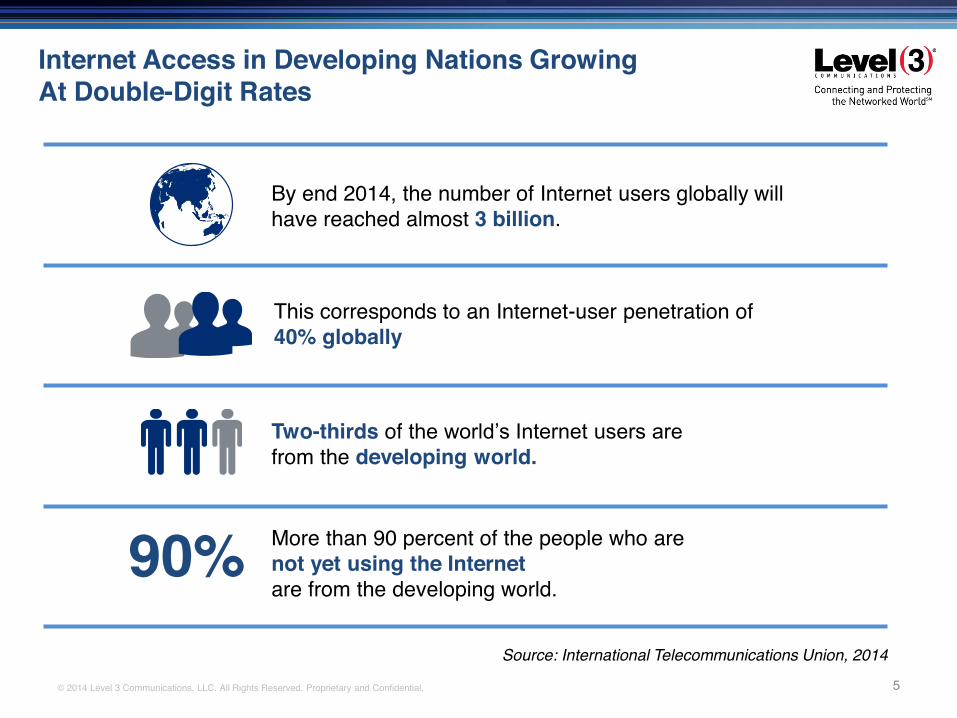
Internet Access in Developing Nations Growing At Double-Digit Rates
Source: International Telecommunications Union, 2014
By end 2014, the number of Internet users globally will have reached almost 3 billion.
Two-thirds of the world’s Internet users are from the developing world.
More than 90 percent of the people who are not yet using the Internetare from the developing world.
90%
This corresponds to an Internet-user penetration of 40% globally
© 2014 Level 3 Communications, LLC. All Rights Reserved. Proprietary and Confidential.
Stir-In The Internet of Everything
6
http://www.youtube.com/watch?v=lX0AQxh4yaw

© 2014 Level 3 Communications, LLC. All Rights Reserved. Proprietary and Confidential.
Attacker Profile
7
Attacker
Soph
istic
atio
n
Motivation Targets
In May, the U.S. Justice Department indicted 5 Chinese military officers on charges of hacking into the computer networks of U.S. companies and stealing commercial secrets. It linked all of them to PLA Unit 61398 in Shanghai.
• Political Statement• Protest
• Military Actions• Industrial Advantage
• $$$$$$• Extortion• Commercial Ransom
• Sell Trade Secrets• Disgruntled Employee
In a manifesto announcing its DDoSoperation, Anonymous railed against Sony for going after coders who seek to modify hardware that they own.
Hackers found vulnerabilities in the company’s network through remotely controlled HVAC systems and were able to access payments system data of over 40 Million credit cards.
Matthew Keys used his access as a former employee of the Tribune Co. to help a hacker deface the website of the Los Angeles Times in 2010.
Low
Med
ium
High
High
Source: Analysis of the North American Managed Security Services Market, July 2014.
© 2014 Level 3 Communications, LLC. All Rights Reserved. Proprietary and Confidential.
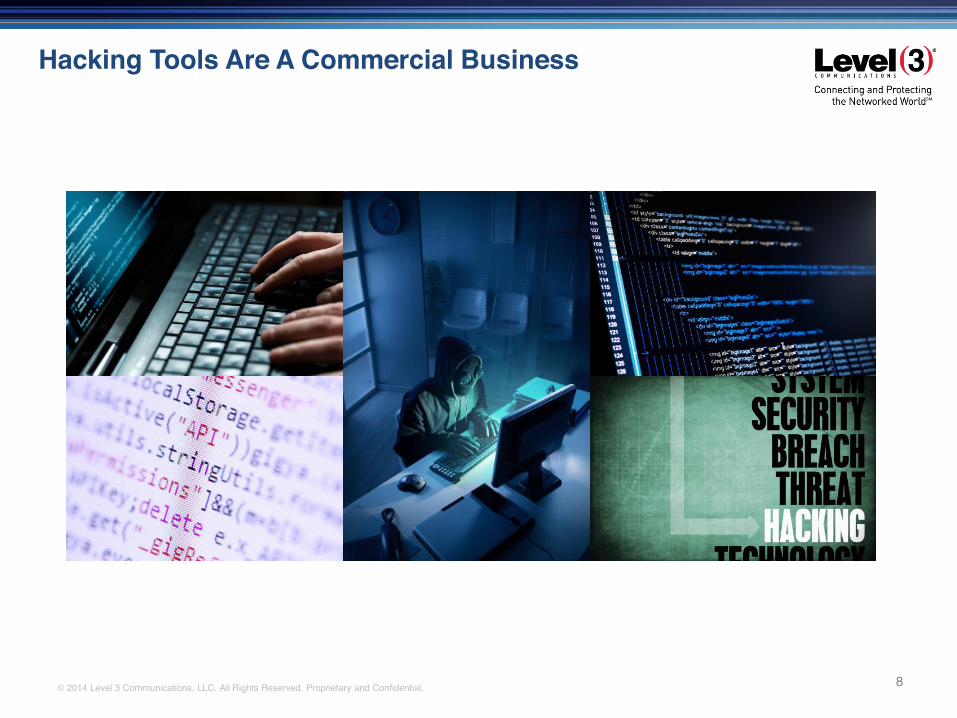
Hacking Tools Are A Commercial Business
8
© 2014 Level 3 Communications, LLC. All Rights Reserved. Proprietary and Confidential.
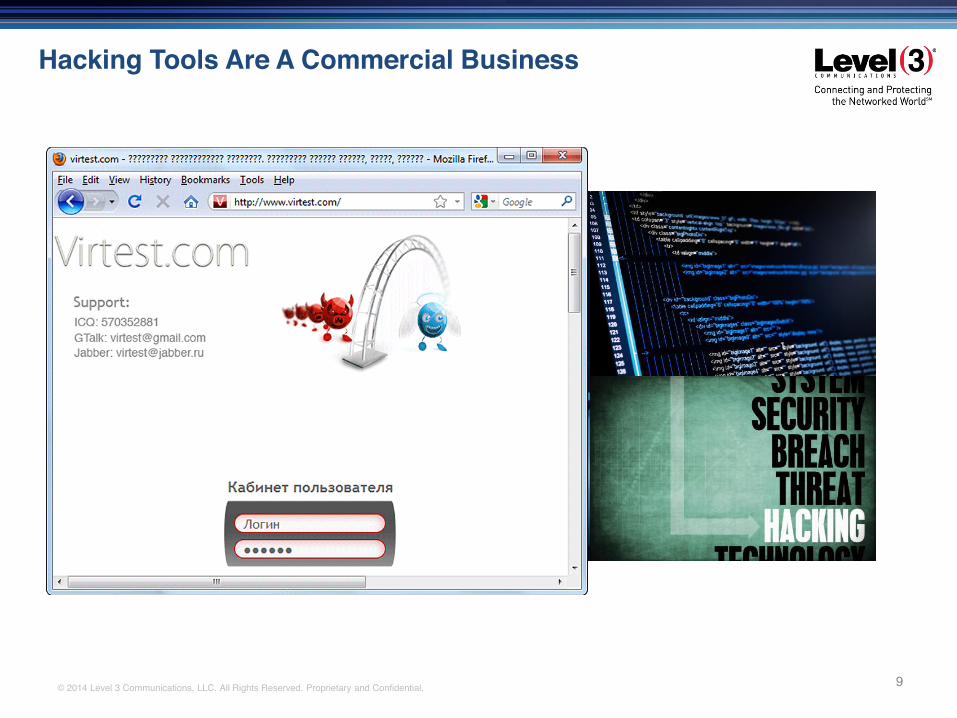
Hacking Tools Are A Commercial Business
9

© 2014 Level 3 Communications, LLC. All Rights Reserved. Proprietary and Confidential.
Hacking Tools Are A Commercial Business
10
© 2014 Level 3 Communications, LLC. All Rights Reserved. Proprietary and Confidential.
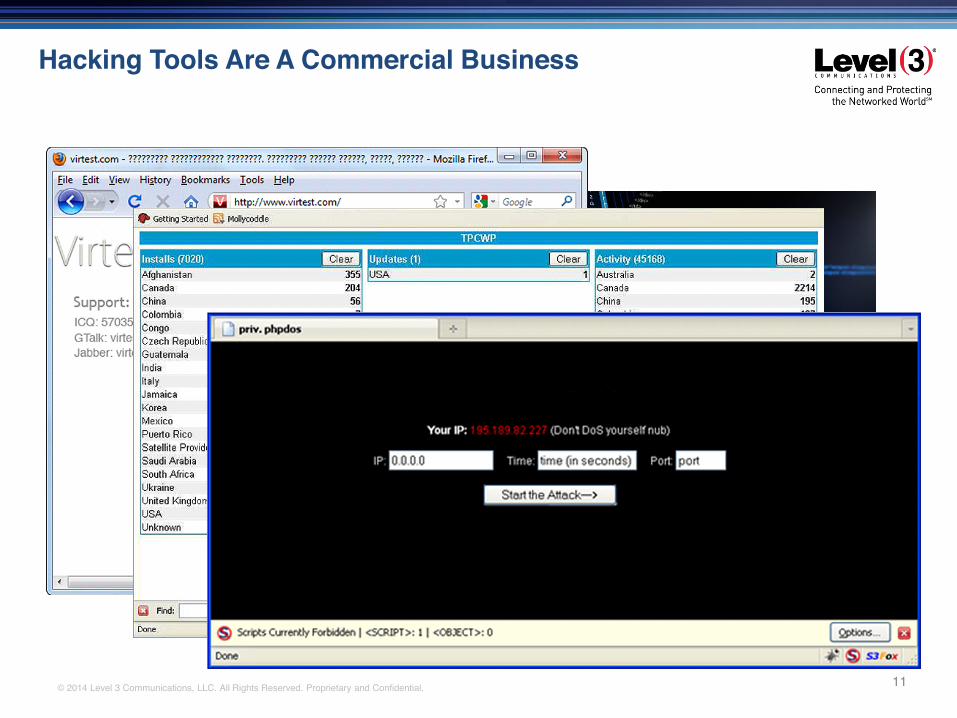
Hacking Tools Are A Commercial Business
11
© 2014 Level 3 Communications, LLC. All Rights Reserved. Proprietary and Confidential.
(Sourced from ITRC Breach Report 2012)(Sourced from ITRC Breach Report 2012)
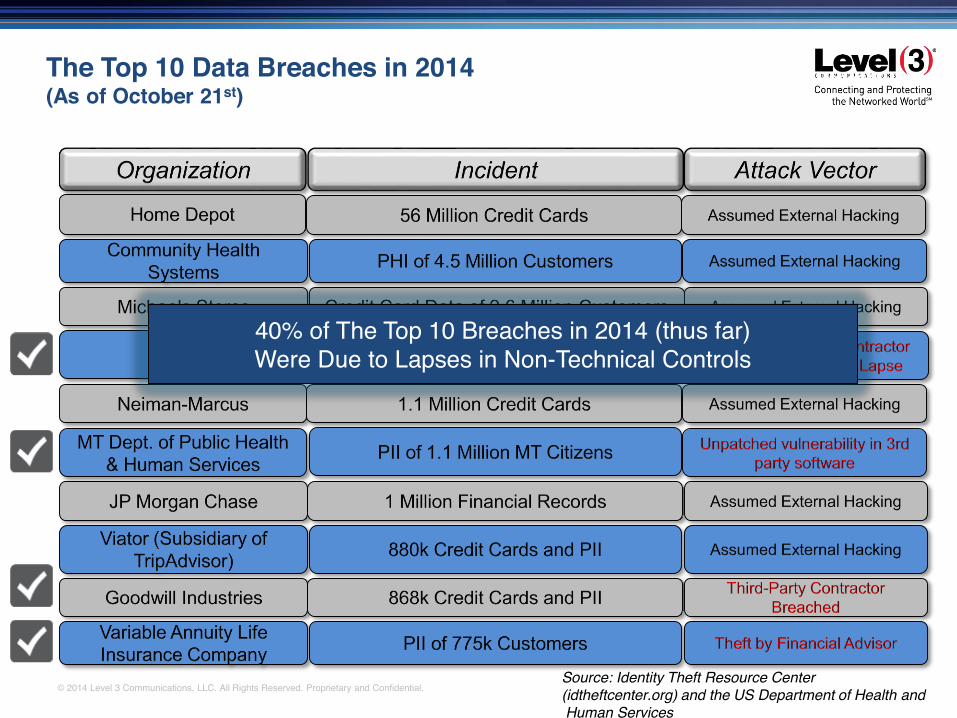
40% of The Top 10 Breaches in 2014 (thus far) Were Due to Lapses in Non-Technical Controls
The Top 10 Data Breaches in 2014(As of October 21st)
Source: Identity Theft Resource Center(idtheftcenter.org) and the US Department of Health andHuman Services
© 2014 Level 3 Communications, LLC. All Rights Reserved. Proprietary and Confidential. 13
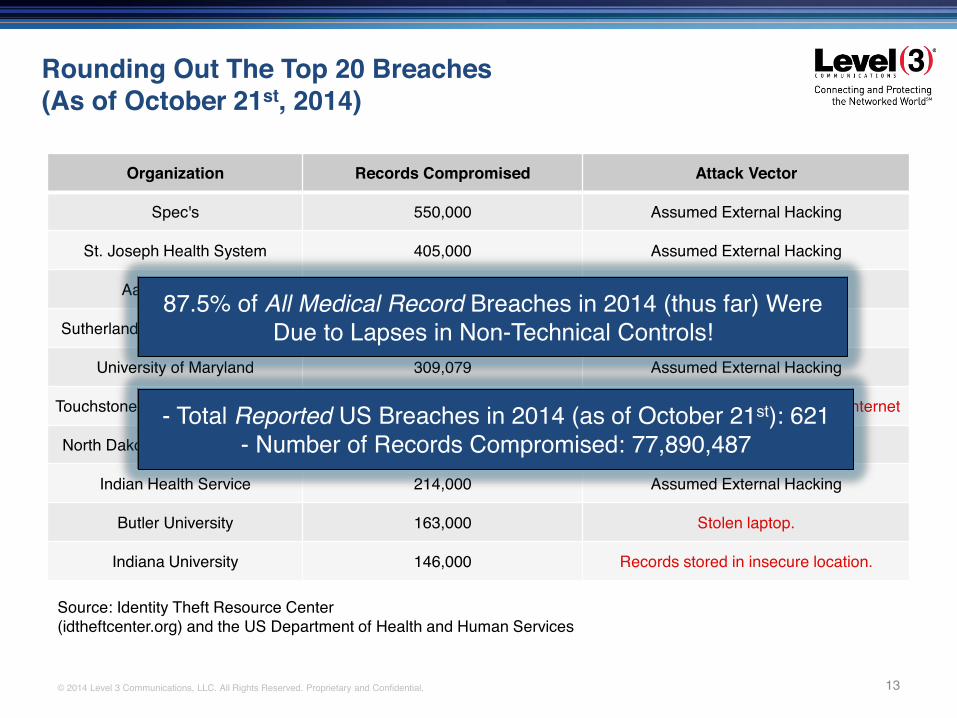
Organization Records Compromised Attack Vector
Spec's 550,000 Assumed External Hacking
St. Joseph Health System 405,000 Assumed External Hacking
Aaron Brothers 400,000 Assumed External Hacking
Sutherland Healthcare Solutions 342,197 Physical theft of computers.
University of Maryland 309,079 Assumed External Hacking
Touchstone Medical Imaging, LLC 307,528 Folder with PII left accessible to the internet
North Dakota University System 291,465 Assumed External Hacking
Indian Health Service 214,000 Assumed External Hacking
Butler University 163,000 Stolen laptop.
Indiana University 146,000 Records stored in insecure location.
87.5% of All Medical Record Breaches in 2014 (thus far) Were Due to Lapses in Non-Technical Controls!
- Total Reported US Breaches in 2014 (as of October 21st): 621- Number of Records Compromised: 77,890,487
Source: Identity Theft Resource Center(idtheftcenter.org) and the US Department of Health and Human Services
Rounding Out The Top 20 Breaches(As of October 21st, 2014)
© 2014 Level 3 Communications, LLC. All Rights Reserved. Proprietary and Confidential.
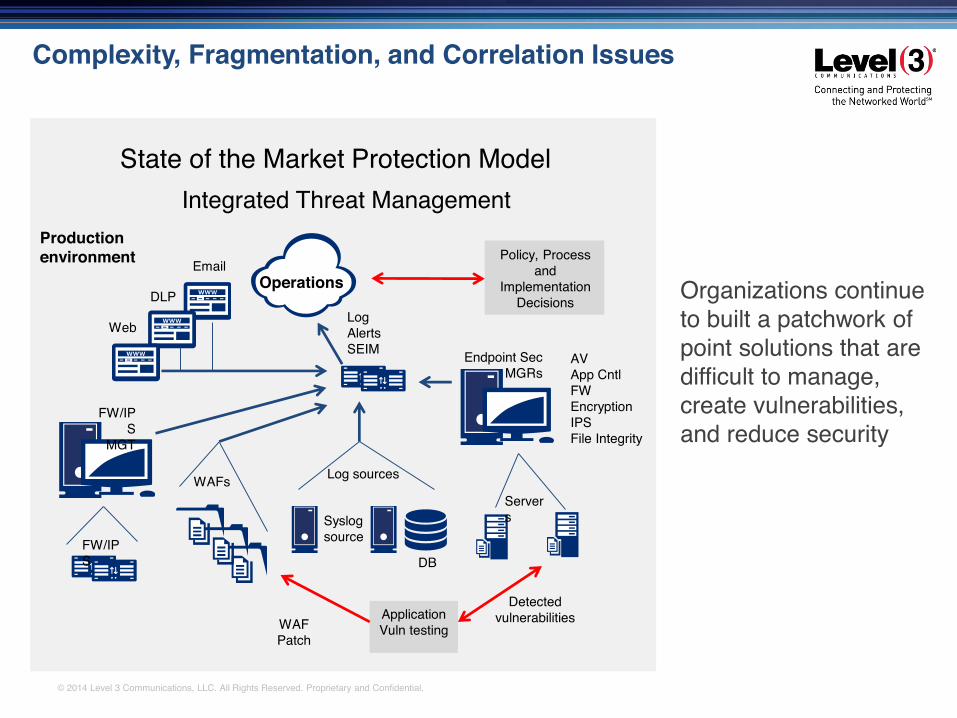
Complexity, Fragmentation, and Correlation Issues
Organizations continue to built a patchwork of point solutions that are difficult to manage, create vulnerabilities, and reduce security
State of the Market Protection Model
Productionenvironment Email
DLP
Web
Operations
LogAlertsSEIM
Log sources
AVApp CntlFWEncryptionIPSFile Integrity
Endpoint Sec MGRs
Servers
DB
Syslogsource
WAFs
FW/IPS
FW/IPS
MGT
WAF Patch
DetectedvulnerabilitiesApplication
Vuln testing
Policy, Process and
Implementation Decisions
Integrated Threat Management
© 2014 Level 3 Communications, LLC. All Rights Reserved. Proprietary and Confidential.
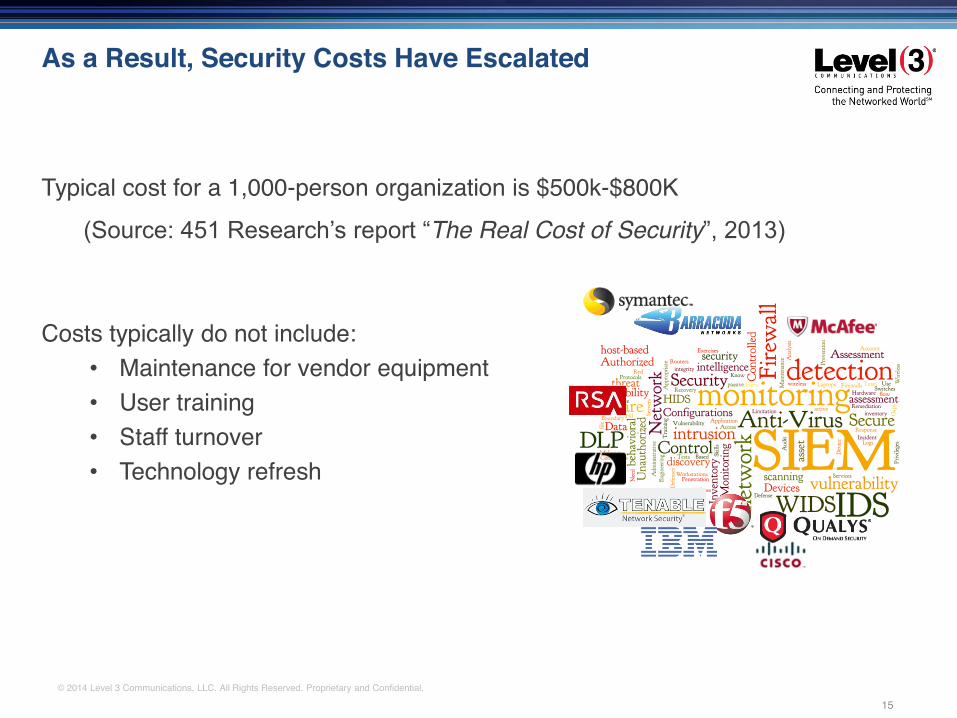
As a Result, Security Costs Have Escalated
Typical cost for a 1,000-person organization is $500k-$800K (Source: 451 Research’s report “The Real Cost of Security”, 2013)
Costs typically do not include:• Maintenance for vendor equipment• User training• Staff turnover• Technology refresh
15
© 2014 Level 3 Communications, LLC. All Rights Reserved. Proprietary and Confidential.
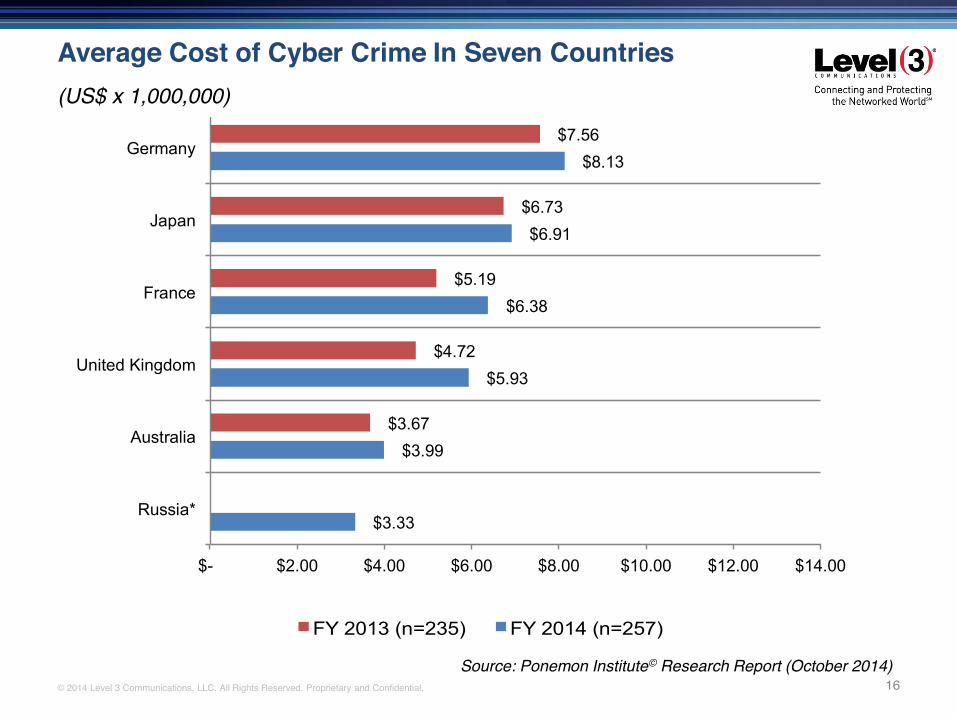
Average Cost of Cyber Crime In Seven Countries
Ponemon Institute© Research Report Page 2
Global at a glance This year’s annual study was conducted in the United States, United Kingdom, Germany, Australia, Japan, France and for the first time, the Russian Federation, with a total benchmark sample of 257 organizations. Country-specific results are presented in seven separate reports. Figure 1 presents the estimated average cost of cyber crime for seven country samples involving 257 separate companies, with comparison to last year’s country averages. Cost figures are converted into U.S. dollars for comparative purposes.2 As shown, there is significant variation in total cyber crime costs among participating companies in the benchmark samples. The US sample reports the highest total average cost at $12.7 million and the Russian sample reports the lowest total average cost at $3.3 million. It is also interesting to note that all six countries experienced a net increase in the cost of cyber crime cost over the past year – ranging from 2.7 percent for Japan to 22.7 percent for the United Kingdom. The percentage net change between FY 2014 and FY 2013 (excluding Russia) is 10.4 percent. Figure 1. Total cost of cyber crime in seven countries Cost expressed in US dollars (000,000), n = 257 separate companies
2The Wall Street Journal’s August 1, 2014 currency conversion rates.
$3.33
$3.99
$5.93
$6.38
$6.91
$8.13
$12.69
$3.67
$4.72
$5.19
$6.73
$7.56
$11.56
$- $2.00 $4.00 $6.00 $8.00 $10.00 $12.00 $14.00
Russia*
Australia
United Kingdom
France
Japan
Germany
United States
*FY 2013 results for Russia were not collected
FY 2013 (n=235) FY 2014 (n=257)
16
Ponemon Institute© Research Report Page 2
Global at a glance This year’s annual study was conducted in the United States, United Kingdom, Germany, Australia, Japan, France and for the first time, the Russian Federation, with a total benchmark sample of 257 organizations. Country-specific results are presented in seven separate reports. Figure 1 presents the estimated average cost of cyber crime for seven country samples involving 257 separate companies, with comparison to last year’s country averages. Cost figures are converted into U.S. dollars for comparative purposes.2 As shown, there is significant variation in total cyber crime costs among participating companies in the benchmark samples. The US sample reports the highest total average cost at $12.7 million and the Russian sample reports the lowest total average cost at $3.3 million. It is also interesting to note that all six countries experienced a net increase in the cost of cyber crime cost over the past year – ranging from 2.7 percent for Japan to 22.7 percent for the United Kingdom. The percentage net change between FY 2014 and FY 2013 (excluding Russia) is 10.4 percent. Figure 1. Total cost of cyber crime in seven countries Cost expressed in US dollars (000,000), n = 257 separate companies
2The Wall Street Journal’s August 1, 2014 currency conversion rates.
$3.33
$3.99
$5.93
$6.38
$6.91
$8.13
$12.69
$3.67
$4.72
$5.19
$6.73
$7.56
$11.56
$- $2.00 $4.00 $6.00 $8.00 $10.00 $12.00 $14.00
Russia*
Australia
United Kingdom
France
Japan
Germany
United States
*FY 2013 results for Russia were not collected
FY 2013 (n=235) FY 2014 (n=257)
Source: Ponemon Institute© Research Report (October 2014)
(US$ x 1,000,000)
© 2014 Level 3 Communications, LLC. All Rights Reserved. Proprietary and Confidential.
Marketing
Financial
Newsfeeds/Blogs
Legal documents
Cardholder data
Healthcare/PHI
Data Classification
Understand the value and location of your data assets1
© 2014 Level 3 Communications, LLC. All Rights Reserved. Proprietary and Confidential.
e-Commerce
Test and Development
ERP
CRM
Payment processing
Evaluate Your Applications
Understand your applications’ security and the data they control and access2

© 2014 Level 3 Communications, LLC. All Rights Reserved. Proprietary and Confidential.
Focus on simplicity• Complexity is a risk• Segmentation• APIs• Orchestration• Storage and Backup• Access Controls
IT Infrastructure
Audit your architecture3
© 2014 Level 3 Communications, LLC. All Rights Reserved. Proprietary and Confidential.
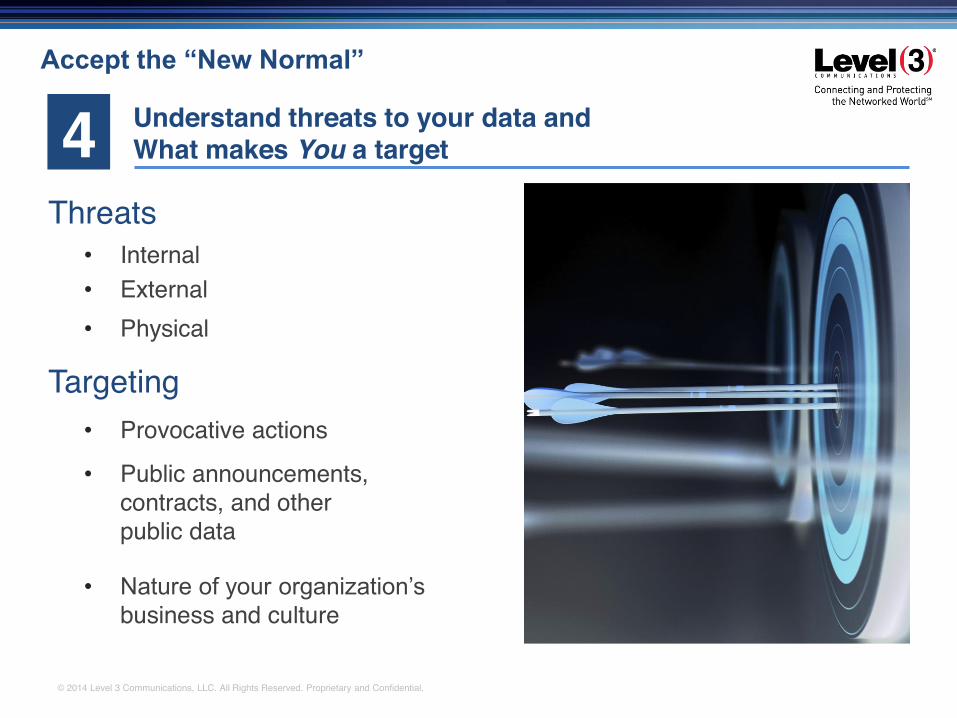
• External• Internal
• Physical
Targeting• Provocative actions
Threats
• Public announcements, contracts, and other public data
• Nature of your organization’s business and culture
Accept the “New Normal”
Understand threats to your data andWhat makes You a target4
© 2014 Level 3 Communications, LLC. All Rights Reserved. Proprietary and Confidential.
• Being compliant does not equal secure.
Look beyond standards and regulations.
Establish and adhere to a governance, risk, and compliance (GRC) framework. (Many to choose from!)
Develop a risk-based approach to managing threats and vulnerabilities.
Governance, Risk and Compliance
Fear the hacker, not the auditor5
© 2014 Level 3 Communications, LLC. All Rights Reserved. Proprietary and Confidential.
Collaboration
Collaborate with service providers and peers
• Some controls are better suited for delivery by service providers (network, cloud, MSSPs, risk assessments, etc.)
• Collaboration with peer organizations is vital.
• Take advantage of government resources: standards, programs, events, consortiums, services.
6
© 2014 Level 3 Communications, LLC. All Rights Reserved. Proprietary and Confidential.
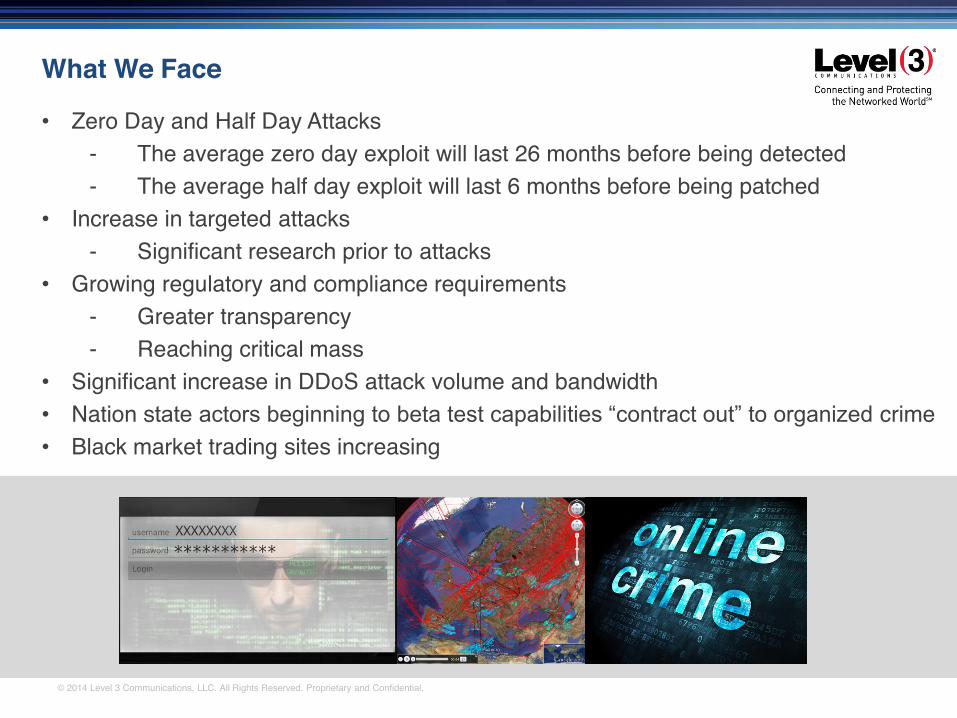
What We Face
• Zero Day and Half Day Attacks- The average zero day exploit will last 26 months before being detected- The average half day exploit will last 6 months before being patched
• Increase in targeted attacks- Significant research prior to attacks
• Growing regulatory and compliance requirements- Greater transparency- Reaching critical mass
• Significant increase in DDoS attack volume and bandwidth• Nation state actors beginning to beta test capabilities “contract out” to organized crime• Black market trading sites increasing
© 2014 Level 3 Communications, LLC. All Rights Reserved. Proprietary and Confidential. 24
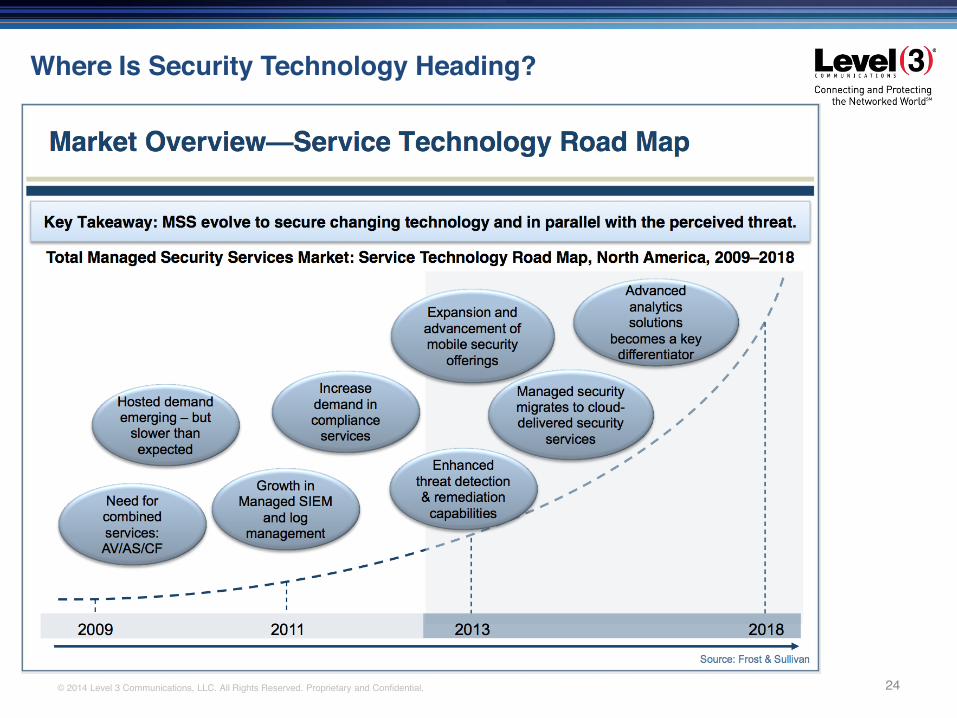
Where Is Security Technology Heading?
© 2014 Level 3 Communications, LLC. All Rights Reserved. Proprietary and Confidential.
Summary
• The threat landscape is evolving rapidly due to nation-state, organized crime, and cyber terrorism
• Organizations must assume the “new normal” -- at least some parts of their networks have been compromised
• Your data is an asset -- understand its value, location, and movement
• Establishing and adhering to a governance framework is critical
• Perform regular security evaluations, risk assessments, and awareness training for employees
• Determine core competencies, perform functions that you do well, outsource others to trusted, skilled firms
• Some security functions must be done in partnership with your service provider(s)
• Information sharing partnerships are essential
• Technology-based controls are important, but are not a cybersecurity panacea