can taxes tame the banks? evidence from european bank ... · can taxes tame the banks? evidence...
TRANSCRIPT

Can taxes tame the banks?
Evidence from European bank levies
WP 13/25
The paper is circulated for discussion purposes only, contents should be considered preliminary and are not to
be quoted or reproduced without the author’s permission.
December 2013
John Vella
Oxford University Centre for
Business Taxation
Working paper series | 2013
Michael P Devereux
Oxford University Centre for
Business Taxation
Niels Johannesen
University of Copenhagen

Can taxes tame the banks?
Evidence from European bank levies∗
Michael P. Devereux
Oxford University Centre for Business Taxation, Saïd Business School, Oxford
Niels Johannesen
University of Copenhagen
John Vella
Oxford University Centre for Business Taxation, Saïd Business School, Oxford
December 9, 2013
Abstract
In the wake of the financial crisis, a number of countries have introduced levies
on bank borrowing with the aim of reducing risk in the financial sector. This paper
studies the behavioral responses to the bank levies and evaluates the policy. We
find that the levies induced banks to borrow less but also to hold more risky assets.
The reduction in funding risk clearly dominates for banks with high capital ratios
but is exactly offset by the increase in portfolio risk for banks with low capital
ratios. This suggests that while the levies have reduced the total risk of relatively
safe banks, they have done nothing to curb the risk of relatively risky banks, which
presumably pose the greatest threat to financial stability.
∗We thank seminar participants at the Goethe University of Frankfurt, University of Copenhagen,University of Oxford (Saïd Business School and Faculty of Law) as well as participants at CESifo, ETPFand IIPF conferences for comments and suggestions. We are particularly grateful to Alan Morrison,Michael Keen, Alfons Weichenrieder and Raphael Parchet for valuable suggestions. We are grateful toRichard Collier and his colleagues at PwC, and Mark Gibbins, for their help with the national banklevies. Niels Johannesen acknowledges generous support from the Nordic Tax Research Council and theEconomic Policy Research Network. Devereux and Vella acknowledge the financial support of the ESRCunder grant RES-060-25-0033.
1

1 Introduction
Excessive risk-taking by financial institutions is widely regarded as the main cause of
the global financial crisis in 2007-2008 (Diamond and Rajan, 2009; Brunnermeier, 2009).
Prior to the crisis, banks invested heavily in mortgage-backed securities, the risk of which
was grossly underestimated, while at the same time relying increasingly on short-term
borrowing for funding. As real estate markets weakened and losses on mortgage-backed
securities mounted, the equity capital of many banks was quickly wiped out and uncer-
tainty about the solvency of counterparts caused money markets to freeze (Gorton and
Metrick, 2012; Shin, 2009). To avoid a collapse of the entire financial system, govern-
ments intervened by providing banks with credit lines, loan guarantees and new capital
(Laeven and Valencia, 2013). While the collapse was avoided at a staggering cost, the cri-
sis nevertheless spread to the real economy where firms suffered from the ensuing decline
in lending by troubled banks (Ivashina and Scharfstein, 2010; Santos, 2011; Chodorow-
Reich, 2013).
By making it painfully clear that distressed banks can impose very significant costs
on tax payers, other banks and non-financial firms, the financial crisis has revived an old
debate about government intervention in the financial sector. Many scholars have argued
in favor of tightening capital requirements (e.g. Admati et al., 2010; Hart and Zingales,
2011). This stance is supported by the theoretical arguments that banks with more
capital have more incentives to monitor borrowers (Allen, Carletti and Marquez, 2011)
and less incentives to invest in excessively risky assets (Acharya, Mehran and Thakor,
2011) and by empirical analysis showing that banks with more capital generally fare
better during a financial crisis (Berger and Bouwman, 2013; Beltratti and Stulz, 2012).
In response to the crisis, the Basel capital requirements, the cornerstone of international
financial regulation, have indeed been strengthened moderately.
Recognizing that externalities can be addressed with taxation as well as regulation,
a number of countries, including the UK and Germany, have introduced a new type of
bank levy proposed by the IMF (2010). The bank levies typically fall directly on bank
borrowing and have a clear Pigouvian rationale: given that the social cost of bank distress
exceeds the private cost, there is scope for a corrective tax on the types of bank funding
that increase the risk of distress. By raising the cost of borrowed funds, the levies are
2
designed to increase stability in the financial sector by inducing banks to rely more on
own capital. Some levies have more elaborate features, most of which can be rationalized
within a Pigouvian framework. In the UK and Netherlands, for instance, short-term
borrowing is taxed at a higher rate than long-term borrowing since the former involve a
larger refinancing risk than the latter (Perotti and Suarez, 2011). In Germany and other
countries, the levy rate structure is progressive presumably reflecting that the external
cost of bank failure is higher for large banks than for small banks.
This paper studies how banks responded to the levies with the ultimate aim of as-
sessing whether the levies have been successful in reducing risk in the financial sector.
We draw on detailed information from the financial reports of more than 5,000 European
banks and exploit that the adoption of bank levies constitutes a rich natural experiment
with several types of variation. First, 11 countries in the European Union ("EU") adopted
levies over the period 2009-2011 while the remaining 16 countries did not. Second, levy
rates vary substantially between countries that have adopted a levy. Third, marginal levy
rates vary within countries both in the cross-sectional dimension due to progressivity in
the rate structure and in the time dimension due to rate changes. We exploit all these
types of variation in a panel model that spans the period 2008-2011. The model includes
standard determinants of capital structure at the bank and country levels as well as bank
fixed effects to capture the permanent components of capital structure (Lemmon, Roberts
and Zender, 2008).
Our first main finding is that bank levies had a statistically and economically sig-
nificant effect on banks’ funding choices. Specifically, our results suggest that banks
raised their equity-asset ratio by 1 to 1.5 percentage points on average in response to the
levies. This holds in a range of different specifications and is robust to the inclusion of
region-specific, bank-size specific and equity-ratio specific non-linear time trends where
identification effectively derives from comparisons of banks within the same region, of
the same approximate size and with the same approximate equity-asset ratio. The causal
interpretation of the estimates is further supported by the finding that banks affected by
the levies had the same pre-levy trends in equity-asset ratios as other banks and by a
placebo test on a sample of large non-financial firms.
These results suggest that bank levies can be quite successful in reducing banks’
3
funding risk. The banks in our sample initially had an equity-asset ratio of around 0.13,
so the benchmark estimate of 0.015 suggests that bank levies caused an increase in the
equity-asset ratio of an average bank of more than 10%. Importantly, we find that the
increase in equity-asset ratios is driven by an increase in the stock of equity rather than
a decrease in the stock of assets. This matters for policy purposes if there are concerns
that banks may respond to the levies by slashing lending to households and non-financial
firms to the detriment of the real economy.
Our second main finding is that bank levies, despite changing directly only the incen-
tives underlying banks’funding choices, also had an effect on banks’portfolio choices.
Specifically, we find that banks changed their portfolio of assets in response to the levies
so as to increase the average regulatory risk weight by around 3%. We argue that this
is likely to be the result of an unintended interaction with financial regulation, which
imposes a minimum ratio of bank capital to risk-weighted assets. Hence, to the extent
that banks raise more capital because of the levies, they are also able to increase the risk
of their assets while still complying with the regulatory capital requirements.
These results suggest that the bank levies, which are designed to reduce the risk of the
financial sector, actually lead to an increase in banks’portfolio risk. This result relates to
a classical theoretical literature on risk shifting, which shows that when regulators limit
banks’funding risk by imposing capital requirements, banks optimally undo the effect
on their total risk, at least partly and sometimes more than fully, by taking on more
portfolio risk (Koehn and Santomero, 1980; Kim and Santomero, 1988). It also relates
to recent theoretical analysis of the interaction between banking regulation and taxation
(Keen, 2011).
An important limitation of these results is our crude measurement of portfolio risk.
While it is well-known that regulatory risk weights are imperfect measures of portfolio
risk (Hellwig, 2010), they are frequently used in the literature (e.g. Jacques and Nigro,
1997; Rime, 2001; Keen and de Mooij, 2012) and have been shown to correlate with
outcomes such as the share of non-performing loans and bank failure (Avery and Berger,
1991). Regardless of their correlation with true portfolio risk, regulatory risk weights are
perfectly suited to detect portfolio changes in response to the bank levies if, as we argue,
the levies affect portfolio choices through an interaction with regulation.
4

Our third set of findings concern the heterogeneity in banks’responses to the bank
levies. We show that while banks with a high initial level of capital increased their equity-
asset ratio most in response to the levies, only banks with a low initial level of capital
increased the risk of their assets. The latter finding supports the interpretation that
the indirect effect of levies on portfolio choices is due to the interaction with financial
regulation, which is more likely to be a binding constraint for banks with low levels of
capital.
These results suggest that the intended behavioral response, the decrease in funding
risk, was largest in relatively safe banks whereas the unintended response, the increase
in portfolio risk, occurred only in relatively risky banks. This seems to imply that the
levies were more successful in reducing total risk in initially safe banks than in initially
risky banks. We obtain this result directly by using the ratio of regulatory capital to
risk-weighted assets, which captures both funding risk (in the numerator) and portfolio
risk (in the denominator), as a measure of total risk. We find that the effect of the levies
on this measure was significantly positive for banks with a high initial level of capital
and precisely zero for banks with a low initial level of capital.
The main contribution of the paper is to evaluate a new type of government interven-
tion in the financial markets: levies on bank borrowing have already been introduced in
important banking centers such as the U.K. and Germany with the aim of enhancing fi-
nancial stability and are currently under consideration in many other countries including
the U.S. Our assessment of the levies is somewhat mixed: there is evidence that banks
have reduced funding risk considerably in response to the levies, but it also appears that
some banks have undone the effect on total risk by taking on more portfolio risk. Specif-
ically, the levies seem to have reduced risk in the relatively safe banks while there are no
signs that they have curbed risk in the relatively risky banks, which presumably pose the
greatest threat to financial stability.
The remainder of the paper is structured in the following way. Section 2 provides
background information about the bank levies; Section 3 sets out a brief conceptual
framework linking funding and portfolio risk and analyzing the impact of a bank levy;
Section 4 describes the data; Section 5 presents the results; and Section 6 concludes.
5
2 The bank levies
In the wake of the financial crisis, the IMF promoted levies on the risky part of bank
funding as a tool to increase revenue collection from the financial sector while at the
same time contributing to financial stability by incentivizing banks to adopt less risky
capital structures. Bank levies of some form have been adopted in a number of countries
and are still under consideration in many others. In the US, for instance, the Financial
Crisis Responsibility Fee was first proposed by the Obama Administration in 2010 and
is included in its budget proposal for 2014.
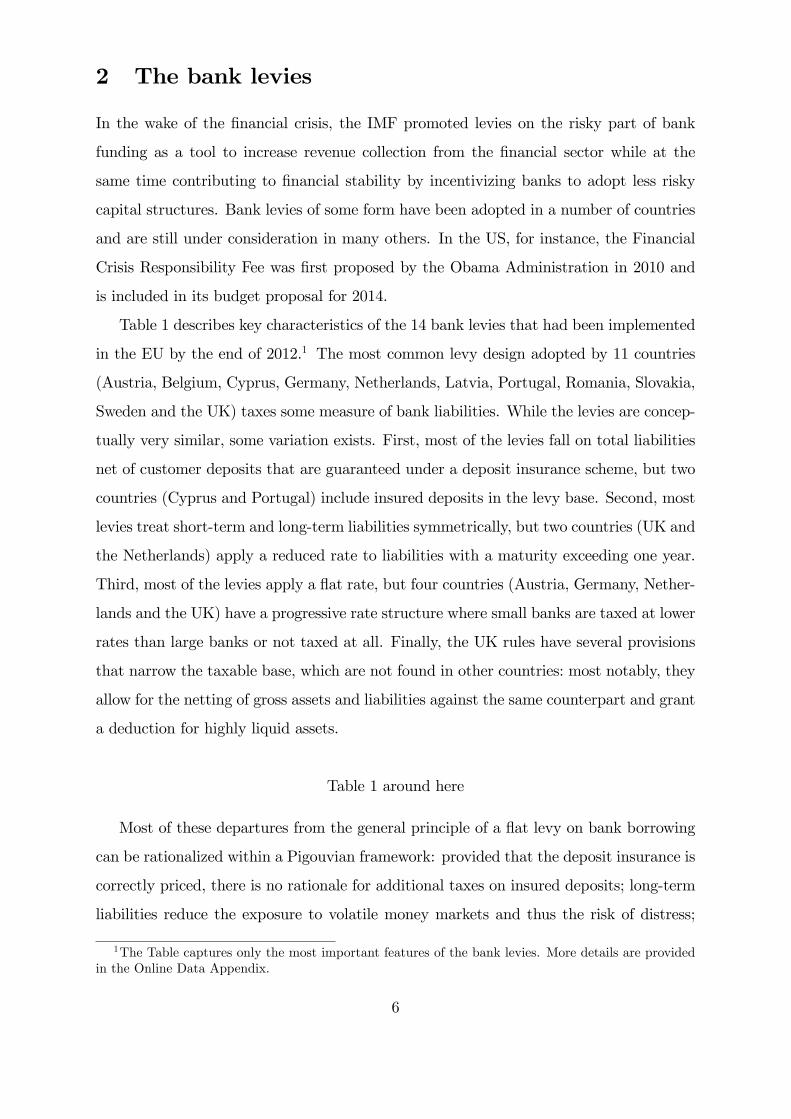
Table 1 describes key characteristics of the 14 bank levies that had been implemented
in the EU by the end of 2012.1 The most common levy design adopted by 11 countries
(Austria, Belgium, Cyprus, Germany, Netherlands, Latvia, Portugal, Romania, Slovakia,
Sweden and the UK) taxes some measure of bank liabilities. While the levies are concep-
tually very similar, some variation exists. First, most of the levies fall on total liabilities
net of customer deposits that are guaranteed under a deposit insurance scheme, but two
countries (Cyprus and Portugal) include insured deposits in the levy base. Second, most
levies treat short-term and long-term liabilities symmetrically, but two countries (UK and
the Netherlands) apply a reduced rate to liabilities with a maturity exceeding one year.
Third, most of the levies apply a flat rate, but four countries (Austria, Germany, Nether-
lands and the UK) have a progressive rate structure where small banks are taxed at lower
rates than large banks or not taxed at all. Finally, the UK rules have several provisions
that narrow the taxable base, which are not found in other countries: most notably, they
allow for the netting of gross assets and liabilities against the same counterpart and grant
a deduction for highly liquid assets.
Table 1 around here
Most of these departures from the general principle of a flat levy on bank borrowing
can be rationalized within a Pigouvian framework: provided that the deposit insurance is
correctly priced, there is no rationale for additional taxes on insured deposits; long-term
liabilities reduce the exposure to volatile money markets and thus the risk of distress;
1The Table captures only the most important features of the bank levies. More details are providedin the Online Data Appendix.
6

and the distress of large banks is likely to be associated with disproportionately large
externalities due to their systemic role. One feature of the Austrian levy, however, seems
to be motivated mostly by other considerations: the levies paid by Austrian banks in
2011-2013 were made with reference to the balance sheet in 2010, presumably to enhance
the predictability of the government revenue to be raised by the levy. The fact that
the law was passed very close to year-end in 2010 effectively eliminates the scope for
behavioral responses to the levy during our sample period.
Three countries (France, Hungary and Slovenia) have adopted bank levies that are
conceptually quite different from the design described above. In France, the taxable base
is the minimum amount of capital necessary to comply with the regulatory requirements.
In Hungary, the bank levy falls on total assets net of inter-bank lending. In Slovenia, the
taxable base is total assets with no deductions, however, the levy is not due if either the
level of lending to the non-financial sector or the growth in lending to the non-financial
sector exceeds a threshold. It is not immediately clear how we should expect these three
levies to affect banks’funding and portfolio choices. None of them directly change the
incentives underlying funding choices and while one should expect the French levy to
cause a decrease in portfolio risk, this is not obvious for the Hungarian and Slovenian
levies. Because of these ambiguities, most of our empirical analysis omits the French,
Hungarian and Slovenian banks from the sample and focuses on the 10 bank levies that
fall on a similar and well-defined measure of bank liabilities.
It is important to note that several other policy initiatives aiming to enhance stabil-
ity in the financial sector may directly and indirectly have affected banks’funding and
portfolio choices. First, the new international framework for financial regulation, Basel
III, to be phased in from 2013 will increase the minimum capital requirements in terms
of risk-weighted assets and introduce a minimum leverage ratio in terms of total consol-
idated assets. It is likely that banks anticipating future regulatory requirements started
adopting their capital structure already during our period of analysis. Note, however,
that bank capital requirements are regulated at the EU level, hence it seems safe to as-
sume that two otherwise similar banks located in two different countries within the EU
were affected similarly by the regulatory changes. Second, in the aftermath of the fi-
nancial crisis many governments intervened in the banking sector by providing distressed
7

banks with new equity and by guaranteeing their debt to third parties. In the countries
most adversely affected by the crisis, these measures were very significant in size. In
Ireland, for instance, government equity injections accumulated to around 4% of total
bank assets over the period 2008-2011 and government guarantees of bank debt peaked
at around 20% of total bank assets in 2009 (European Commission, 2012).
3 Conceptual Framework
We argued loosely in the introduction that a levy on bank liabilities should be expected
to affect not only banks’funding choices but also their portfolio choices because of the
interaction with bank regulation. To illustrate this mechanism, we develop a simple model
of bank behavior in the presence of regulation and a bank levy. The model draws on Keen
and de Mooij (2012), but extends it along several dimensions, notably by treating both
funding and portfolio structure as fully endogenous outcomes. The model is not intended
to capture all the complex channels through which a levy may affect bank choices and
therefore makes a number of simplifying assumptions to focus on the channel that we
believe is key, the interaction between the levy and bank regulation.2
A bank raises funds equal to 1, of which a fraction E0 is in the form of equity and
the remaining fraction L is in the form of debt. The bank invests a proportion α of its
funds into risky assets with an uncertain, but on average positive, return θ − 1, and the
remaining proportion 1 − α into a risk-free asset rate with a return that we normalize
to zero. The cumulative distribution function of θ is F (θ). A bank levy at rate T is
levied on L. Shareholders have limited liability. Abstracting from a potential regulatory
penalty described below, the value of the equity of the bank after one period is therefore:
E = max {αθ + (1− α)− L(1 +R(L) + T ), 0} (1)
Inside the bracket, the first two terms are the values of the two types of assets, the third
term is the liability to the lenders and the tax liability. If this is negative, then the bank
defaults, and the shareholders receive zero. Lenders charge an interest rate of R. We
2A richer version of the model incorporating an endogenous risk premium on debt and equity isavailable on request.
8

assume that creditors of the bank are fully insured depositors. However, we also assume
that the bank is large enough to exert some market power. As a result, it may need to
increase the interest rate that it pays to depositors in order to borrow more. We capture
this by making the interest rate a function of borrowing, RL > 0. To simplify here, we
assume that this relationship is linear, so that RLL = 0; this is not crucial.
At the end of the period, the value of risk-weighted assets is αθ. The Basel regulatory
requirement is that the ratio of equity to risk-weighted assets exceeds the minimum value,
denoted B; that is:E
αθ� B (2)
Given the initial choice of debt and the asset portfolio, the bank will fail to meet the
Basel requirement if the realized value of the risky assets θ is below a cut-off value, θB
given by:
θB =1
1−B
{1− 1− L(1 +R(L) + T )
α
}(3)
In the event of not meeting the Basel requirement, the bank faces a penalty P proportional
to the shortfall in equity. Letting EB denote the amount of equity that satisfies the Basel
requirement, the penalty amounts to:3
P = c(EB − E) = cα(θB − θ) (4)
where c is the penalty rate. The penalty reduces the value of E so that default occurs if:
αθ + (1− α)− L(1 +R(L) + T )− cα(θB − θ) < 0
Given the initial choice of debt and risk, the bank will default if the rate of return on
risky assets is below a cut-off value, θD given by
θD =(1−B + c)
(1−B)(1 + c)
{1− 1− L(1 +R(L) + T )
α
}(5)
Note that θD < θB so that there is a range of realizations of θ where the bank fails to
meet the Basel requirement but does not default.
3In practice, a bank could lose its licence to operate if it fails to meet the regulatory constraint. Thepenalty here is a more general proxy of the cost.
9
The bank makes funding and portfolio choices to maximize the return to the share-
holders. It is convenient to express this as the expected value of equity at the end of
the period, net of the potential penalty, and also net of the opportunity cost of equity
finance, ρ. In principle, ρ reflects the risk inherent in owning the bank’s equity; however
we simplify by assuming that it is fixed. Hence, the bank chooses L and α to maximize:
W =
∫ ∞
θD{αθ + (1− α)− L(1 +R(L) + T ))} f(θ)dθ (6)
−∫ θB
θDcα(θB − θ)f(θ)dθ − (1 + ρ)(1− L)
The derivatives of W with respect to L and α can be stated as:
WL = ρ− (R + T + LRL)
∫ ∞
θDf(θ)dθ − cαθBL
∫ θB
θDf(θ)dθ (7)
and
Wα =
∫ ∞
θD(θ − 1)f(θ)dθ −
∫ θB
θDc(θB − θ + αθBα )f(θ)dθ (8)
where θBL > 0 and θBα > 0 are derivatives of θB with respect to L and α respectively.
It follows from (7) that a small increase in leverage changes the return to the share-
holders through two channels: it affects funding costs by reducing the opportunity cost of
equity finance by ρ (first term) while at the same time increasing the cost of debt finance
by R+ T + LRL in all states of the world where the bank does not go bankrupt (second
term). It also adds to the penalty in all the states of the world where equity falls short
of the Basel requirement but the bank does not go bankrupt (third term). Likewise, (8)
shows that a small increase in asset risk changes W through two channels: it increases
the expected return to assets (first term) but also adds to the penalty in all the states
of the world where equity falls short of the Basel requirement but the bank does not go
bankrupt (second term). Based on these insights, it is relatively straightforward to show
how a bank levy shapes banks’optimal funding and portfolio choices:
Proposition 1 A levy on bank debt induces banks to reduce its leverage (dL/dT < 0)
and increase its asset risk (dα/dL > 0)
Proof. See the Appendix
10

Intuitively, if R is low, a bank can lower its funding costs by relying more on debt
financing. It can also raise its expected investment return by investing more in risky
assets. In the presence of bank regulation, however, banks balance these positive effects
of risk-taking with a negative effect in the form of a higher penalty in the states of the
world where equity falls short of the Basel requirement. When a levy on bank liabilities
is introduced, the cost saving associated with debt financing is lowered, which induces
the bank to rely less on debt and more on equity. This, in turn, implies that there are
fewer states of the world in which the banks does not meet the Basel requirement and,
hence, a lower marginal cost of increasing portfolio risk. In the new optimum, the bank
therefore takes less funding risk and more portfolio risk.
While the model does not explicitly account for bank heterogeneity, it is fairly obvious
that the mechanism we have modeled, by which a bank levy causes banks to increase
portfolio risk, only applies to banks that are effectively constrained by the Basel require-
ment. If a bank, for reasons outside the model, initially has so much equity that the
risk of violating the Basel requirement were zero, a further reduction in debt financing
in response to a bank levy does not change the marginal costs and benefits of portfolio
risk. We therefore conjecture that the positive effect of the bank levy on portfolio risk is
larger for banks that are initially closer to the Basel constraint.
4 Data and measurement
Our main source of data is Bankscope, which contains information on balance sheets,
income statements and regulatory reports taken from banks’annual reports. Table 2
summarizes balance sheet and regulatory information for the full sample of 5,087 banks
from 27 European countries for the time period 2008-2011. As shown in column (2), the
main source of funding for the average bank in the sample was customer deposits, which
accounted for around 53% of total assets, whereas deposits from other banks accounted
for around 17% and equity accounted for around 13%.4 The average bank lent around
53% of its funds to customers, around 16% to other banks and held around 21% in
4While equity/assets falls between zero and one for the vast majority of banks, it takes very largenegative values in the few cases where liabilities are very large relative to assets. To avoid that theseextreme observations have an excessively large impact on our results, we exclude banks for which thereare observations of equity/assets below -1. This reduces the sample by 31 observations.
11

securities. Finally, the average bank reported a regulatory capital ratio of around 16%
and an average regulatory risk weight of assets of around 59%.5 Note that not all banks
publish regulatory information, hence the number of observations drops considerably
when we move from balance sheet information to regulatory measures. Only around 60%
of the banks in our sample disclose information about their regulatory capital ratio in
their financial statements and only about 40% additionally report the stock of regulatory
capital, which is required to back out the average risk weight.
Table 2 around here
We also report variable means separately for four subsamples. The key distinction in
our empirical analysis is between banks that are subject to a levy and banks that are
not. We therefore split the bank sample on whether the home country introduced a bank
levy at some point during the period 2008-2012. As reported in columns (4)-(7), banks in
levy countries and non-levy countries are reasonably comparable in terms of observable
characteristics although banks in levy countries are somewhat larger, rely slightly more
on deposits and less on long-term borrowing for financing and have somewhat riskier
assets than banks in other countries. Moreover, an important endeavor of the paper is
to investigate whether bank responses to the levies correlated with the extent to which
they were constrained by regulation. For this purpose we split the sample on whether the
ratio of regulatory capital to risk-weighted assets was above or below the sample median
in 2008. As reported in columns (8)-(11), banks with high regulatory capital ratios were
a lot smaller, relied more on equity and had slightly less risky assets than banks with low
regulatory capital ratios.
The dependent variables are formed on the basis of these data. Our measure of
funding risk is the ratio of equity to total assets both measured at book value. For several
reasons, book values are more appropriate than the market values for our purposes. First,
we would like our measure of funding risk to depend on the funding structure but not on
the portfolio structure. While the book value of equity is unaffected by portfolio choices,
5In few cases, the average risk weight exceeds one; in the most extreme cases by several orders ofmagnitude. To avoid that these observations, which are necessarily due to errors in the financial reports,affect the results, we exclude banks for which there are observations of the average risk weight above 1.This reduces the sample by around 200 observations.
12
at least until these choices give rise to gains or losses, the market value of equity is
likely to reflect all types of risk. Second, we are ultimately interested in active responses
to the bank levies, such as share issues and changes in dividend policy, and we would
therefore like to purge our measure of funding risk from the influence of other factors to
the greatest extent possible. This suggests that book values are more suitable than market
values, because the latter but not the former are affected by changes in expectations about
future income and costs. One example of this mechanism is the bank levies themselves,
which represent future costs for the banks and may therefore mechanically drive down
the market value of equity holding banks’funding and portfolio choices constant.
Our measure of portfolio risk is the ratio of risk-weighted assets to total assets or,
equivalently, the average regulatory risk weight of assets. It is well-known that regulatory
risk weights are far from perfect measures of true portfolio risk. Since the adoption
of the Basel II agreement, many banks have relied on their own estimates of the risk
of assets and some commentators have expressed concern that the use of internal risk
models have allowed banks to effectively circumvent the regulatory capital requirements
by understating portfolio risk (e.g. Haldane, 2013). Despite their weaknesses, regulatory
risk weights are probably the best available measure of portfolio risk and have been used
extensively in the literature on bank responses to financial regulation (e.g. Rime, 2001)
and taxation (Keen and de Mooij, 2012). Moreover, since the risk weights correspond
precisely to the regulatory definition of portfolio risk, it is exactly this measure that
should change if banks whose risk taking is effectively constrained by the regulatory
capital requirements shift risk from the liability side of their balance sheet to the asset
side in response to the levies.
Our measure of total risk is the ratio of regulatory capital to risk-weighted assets.
This ratio captures both funding risk and portfolio risk and is the key variable used by
financial regulators to assess the risk of individual banks. By incorporating the regulatory
risk weights, it obviously suffers from the same measurement problems as the risk weights
themselves.
The main explanatory variables concern the bank levies. Combining hand collected
information from national legal texts, a survey by KPMG (2012) and other notes by
professional tax advisers in the relevant countries, we have created a comprehensive
13

database with detailed information on the bank levies, which is available in the Online
Data Appendix.6 Drawing on this database, we construct two variables that capture
the incentives facing banks. First, we construct a dummy variable for the existence
of a bank levy at the country-year level. This variable is useful for policy evaluation
purposes because it allows us to estimate the average effect of the levies that have been
implemented on the outcomes of interest. Since we are interested in behavioral responses
to the levies and the Austrian levy was effectively retroactive for 2011-2013, we code the
dummy variable zero for this country. Second, we construct a measure of the marginal
levy rate, which we define as the additional levy cost associated with a unit increase in
taxable liabilities, at the bank-year level. In principle, this measure fully captures the
within-country and between-country variation in marginal incentives across banks and
allows us to directly estimate the tax responsiveness of the outcomes of interest. To
construct the variable, we estimate the levy base for each individual bank and year on
the basis of the balance sheet information and the legal definition of the levy base and
identify the marginal levy rate applying to a base of that size. Details on the construction
of marginal levy rates are available in the Online Data Appendix.
Finally, we employ a number of country-level and bank-level control variables includ-
ing (i) inflation rates and real GDP growth rates from Eurostat; (ii) statutory corporate
tax rates collected from the OECD Tax Database and the KPMG Corporate and Indirect
Tax Survey 2011; (iii) information on government recapitalizations of distressed banks
and government guarantees of bank debt from the European Commission (2012); and (iv)
a list of the European banks faced with temporary additional capital requirements from
the European Banking Authority (2011). These data are all available and documented
in the Online Data Appendix.
6Available at the webpage: www.nielsjohannesen.net.
14

5 Results
5.1 Funding risk
We first explore the effect of bank levies on funding risk by estimating the extent to which
the levies induced banks to rely more on equity funding. As a first step, we estimate the
following baseline model:
(Equity
Assets
)ict
= α + βlevyict + γic + θt + φXict + ψZct + εit (9)
where γic denotes bank fixed effects, θt denotes time fixed effects and Xict and Zct are
vectors of bank-level and country-level control variables respectively. Bank fixed effects
absorb all cross-sectional variation so that identification of the levy variable only derives
from changes in the dependent variable. Time fixed effects absorb factors common to
all banks such as changes in EU-level bank regulation. Unless stated otherwise, the
sample includes all banks in the 27 EU countries except France, Hungary and Slovenia
and the sample period is 2008-2011. Coeffi cients are reported with robust standard errors
clustered at the bank level.
Table 3 reports results from this baseline model. As shown in column (1), the simplest
specification with no control variables yields a highly significant estimate of β suggesting
that bank levies on average raised equity-asset ratios by around 1.8 percentage points.
The estimates are slightly lower but qualitatively unchanged when control variables are
introduced. Columns (2) and (3) show that adding country-level covariates produces
an estimate of around 1.6 percentage points while further adding bank-level covariates
lowers the estimate to around 1.5 percentage points. Whereas country-level covariates
are often insignificant and diffi cult to interpret, bank-level covariates are statistically
significant and intuitive. The negative coeffi cient on assets (conditional on bank fixed
effects) suggests that expansions of bank balance sheets tend to be financed with debt,
which implies an erosion of the equity ratio. This is consistent with the findings in Adrian
and Shin (2010). The positive coeffi cient on profitability reflects that profits in a given
financial year mechanically translate into retained earnings on the end-of-year balance
sheet and thus, everything else equal, increase the equity-asset ratio (at least until the
profits are possibly paid out as dividends in the course of the following financial year).
15
Table 3 around here
Columns (4)—(6) show that the positive effect of levies on the equity-asset ratio re-
mains when using the estimated marginal levy rate as explanatory variable. The esti-
mated coeffi cient is highly significant across the three specifications. The coeffi cient in
column (6) of around 0.26 suggests that banks subject to the UK marginal levy rate
of 0.075% on average increased their equity-asset ratios by around 2 percentage points
relative to banks subject to a zero marginal levy rate.
It is conceivable that the baseline results are driven by other shocks, which had a
significant impact on bank capital structure and which were correlated with the imple-
mentation of levies. We address this concern in a number of robustness tests reported in
Table 4.
First, there were several other governments interventions in the banking sector than
the bank levies during the sample period. We attempt to control directly for those by aug-
menting the model with the following four variables: (i) cumulative government spending
on bank recapitalizations measured as a fraction of total bank assets (European Commis-
sion, 2012); (ii) government guarantees of bank borrowing measured as a fraction of total
bank assets; (iii) the share of bank assets invested in trading securities, which became
subject to increased capital coverage requirements in 2011 and; (iv) a dummy variable
coded one for banks that temporarily became subject to stricter capital requirements in
2011 (European Banking Authority, 2011). Column (1) reports the coeffi cients on the
levy dummy (panel A) and the marginal levy rate (panel B) in two regressions that add
controls for these government interventions to the baseline model. The coeffi cient on the
levy measures is virtually unchanged compared to the baseline estimates.
Table 4 around here
Second, if the sovereign debt crisis in Greece, Portugal, Spain and Italy caused banks
in Southern Europe to suffer greater losses than banks in other regions and if governments
in Southern Europe were less likely to adopt bank levies than governments in other
regions, this could cause a positive correlation between bank levies and equity ratios. We
16
control non-parametrically for regional shocks by including region-specific time dummies
in the model. We define five geographical regions, each of which includes at least one
country that has introduced a levy and at least one country that has not, and augment the
model with interactions between region dummies and time dummies.7 Note that in this
specification, identification of the levy variables derives exclusively from within-region
comparisons of banks that were subject to a levy and banks that were not. Column (2)
shows that the effect of the bank levies is robust to region-specific non-linear time trends.
Third, small banks and large banks exhibit significant differences in funding and
portfolio structure, hence banks of different sizes may have been exposed differently
to the sovereign debt crisis and other major shocks to the financial sector during the
sample period. If exposure to bank levies also correlates with size, for instance because
of progressive levy rate structures or because countries with larger banks were more likely
to adopt a bank levy, the baseline model produces biased estimates. We control for shocks
correlating with bank size by including bank size-specific time dummies in the model: for
each decile in the distribution of bank size in 2008 we construct a dummy and add its
interactions with the time dummies to the baseline model. Column (3) shows that the
estimated effect of the levies are almost unaffected.
Fourth, it is plausible that highly leveraged banks faced a strong market pressure to
reduce leverage in the wake of the financial crisis. If countries with more leveraged banks
were also more likely to adopt a bank levy, the baseline model would produce biased
estimates. Analogous to the procedure applied above, we control for factors affecting
banks with different leverage differentially by including equity ratio-specific time dummies
in the model: for each decile in the distribution of equity-asset ratios in 2008 we construct
a dummy and include its interactions with the time dummies in the baseline model.
Column (4) shows that the coeffi cients on the levy variables hardly change. Fifth, column
(5) shows that the bank levies remain economically and statistically significant when
simultaneously including controls for other government interventions as well as region-
specific, bank size-specific and equity ratio-specific time dummies.
7Eastern Europe is Poland, Estonia, Latvia, Lithuania, Czech Republic, Slovakia, Slovenia, Hungary,Romania and Bulgaria; Southern Europe is Spain, Portugal, Greece, Italy, Cyprus and Malta; NorthernEurope is Denmark, Sweden and Finland; Central Europe is Austria, Germany, Netherlands, Belgium,France and Luxembourg; and the British Isles is the UK and Ireland.
17

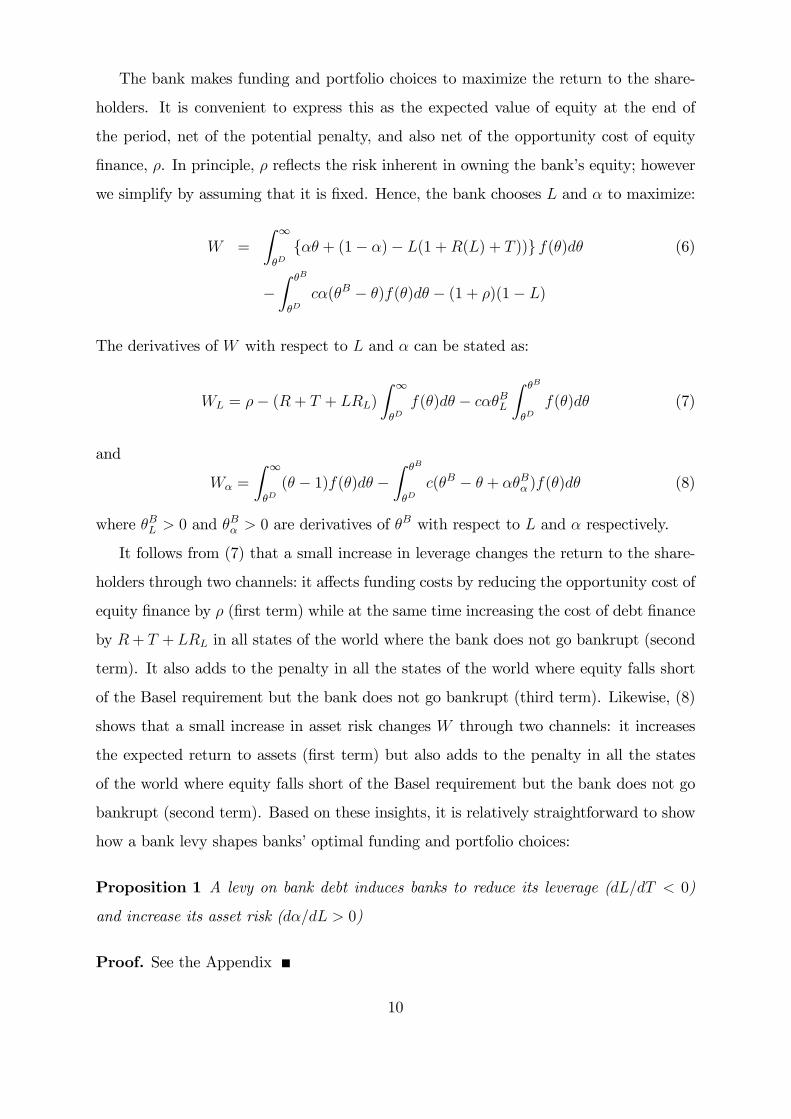
Another possible concern is that the levy variables may pick up pre-existing differential
trends in equity ratios. If banks hit by a levy were for some reason on different trajectories
than other banks, this could show up in the estimated effects of the levies. To address
this concern, we first construct a dummy variable for banks facing a positive marginal
levy rate as well as three dummy variables indicating one year, two years and three years
before marginal levy rate turned positive. We then estimate the baseline model with
these variables.8 As illustrated in Figure 1, the coeffi cients on the pre-levy dummies are
small and insignificant suggesting that the pre-levy trend in equity-asset ratios did not
differ between banks that were hit by a levy and those that were not.
Figure 1 around here
Finally, we conduct two placebo tests and report the results in Table 5. First, we
estimate the effect of bank levies on the equity-asset ratios of non-banks.9 If the esti-
mated effect on banks were driven by unobserved shocks at the country-level, e.g. an
increased supply of equity capital or pressure from investors to reduce leverage, it should
be expected that such shocks would affect non-banks similarly. Columns (1)-(2) show
that in the sample of non-banks, the effect of levies is small and insignificant in the
baseline model and even negative when additional controls are introduced. Second, we
estimate the effect of the Austrian, French, Hungarian and Slovene bank levies, which
did not create an incentive to rely more on equity funding. If our results were driven by
unobserved characteristics of countries that chose to adopt bank levies rather than the
changed incentives created by the levies themselves, we should expect to find an effect
on Austrian, French, Hungarian and Slovene banks similar to that on banks facing a
levy on bank borrowing. We thus estimate the baseline model on a sample that includes
banks in Austria, France, Hungary and Slovenia as well as banks in countries that did
not introduce a levy. Columns (3)-(4) show that the coeffi cient on the levy dummy is
small and insignificant in the baseline model and almost exactly zero when additional
8The sample period is extended to 2004-2011 to allow all levies to contribute to the identification ofthe pre-levy trends
9The sample is drawn from the database Amadeus and consists of the largest firms in the EU withthe size threshold chosen so as to roughly match the number of observations of the bank sample.
18

controls are introduced.
Table 5 around here
We have conducted a number of other robustness tests, which are not included here
due to space constraints (reported in the "Reviewer Appendix"). For instance, the posi-
tive effect of levies on equity ratios is robust to including the lagged dependent variable on
the right hand side; to estimating the model in first differences; and to instrumenting the
marginal levy rate, which is strictly speaking endogenous in countries with progressive
levy rates, with the marginal levy rate that would have applied if banks had the exact
same balance sheet as before the levies were introduced.10
5.2 Portfolio risk and total risk
While an increase in the equity-asset ratio is clearly an important objective of the bank
levies, it is a concern that the levies may interact with regulation so as to induce banks
to increase portfolio risk as highlighted by the conceptual framework.
To test whether bank levies have an effect on portfolio risk, we estimate the baseline
model with the average regulatory risk weight as dependent variable. Table 6 reports the
results. Columns (1)-(2) show that the levies had a highly significant effect on portfolio
risk regardless of which of the levy measures is used. Column (1) suggests that the
average bank changed its portfolio when a bank levy was introduced with the result
that the average risk weight increased by around 2 percentage points. The average value
of the risk variable in the sample is around 0.60 so the estimate implies an increase in
risk weights of around 3%. Column (2) shows that these results survive when using the
marginal levy rate as explanatory variable. The coeffi cient of around 0.5 suggests that
the UK bank levy induced banks subject to the top marginal levy rate of 0.075% to
increase the average risk weight of their assets by around 3.7 percentage points.
Table 6 around here
So far, our results have shown that bank levies were associated with a reduction in
10This is essentially the procedure applied by Gruber and Saez, 2002 in the context of personal incometaxation.
19
funding risk and an increase in portfolio risk. To estimate the net effect of these two
responses on total risk, we estimate (9) with the regulatory capital ratio as dependent
variable. Columns (3)-(4) show that the effect of the levies on capital ratios is positive and
statistically significant regardless of which of the levy measures is used. This suggests that
the levies had a net positive impact on the robustness of the average bank. Specifically,
column (3) suggests that the average bank increased its regulatory capital ratio by 0.8
percentage points, which corresponds to an increase of around 5%, when a bank levy was
introduced. Column (4) suggests that a UK bank subject to the top marginal levy rate
of 0.075% increased its regulatory capital ratio by around 1 percentage point in response
to the levy.
5.3 Heterogeneity in responses
In the two previous sections, we estimated the effect of the bank levies on the funding
and portfolio choices of an average bank. However, if the incentive for risk shifting works
through the regulatory capital requirement, as argued above, this effect should be much
stronger for banks that are effectively constrained by this requirement.
We test these hypotheses by constructing separate dummy variables for banks with a
ratio of regulatory capital to risk-weighted assets below the median ("low capital") and
above the median ("high capital") respectively. We then introduce interactions between
these two dummy variables and the levy measure into the model, which effectively allows
the effect of bank levies to differ between the relatively "risky banks" and relatively "safe
banks".
Two caveats apply. First, we cannot allow the dummy variables for regulatory capital
to vary over time since this would make them endogenous to risk taking. Hence, we define
the dummy variables in terms of regulatory capital ratios in 2008, which is exogenous to
later changes in risk taking induced by the levies. Second, the initial regulatory capital
ratio may itself be an important determinant of future changes in risk taking. This would
be the case if, for instance, negative shocks to the regulatory capital ratio induce banks
to reduce risk taking in future periods so as to return to their target regulatory capital
ratio. We address this issue by introducing interactions between the two dummies for
high and low regulatory capital and the time dummies. By conditioning the time trend
20
on the initial regulatory capital ratio, we ensure that identification effectively derives
from comparisons of banks with approximately the same initial regulatory capital ratio
of which some were hit by a bank levy and some were not.
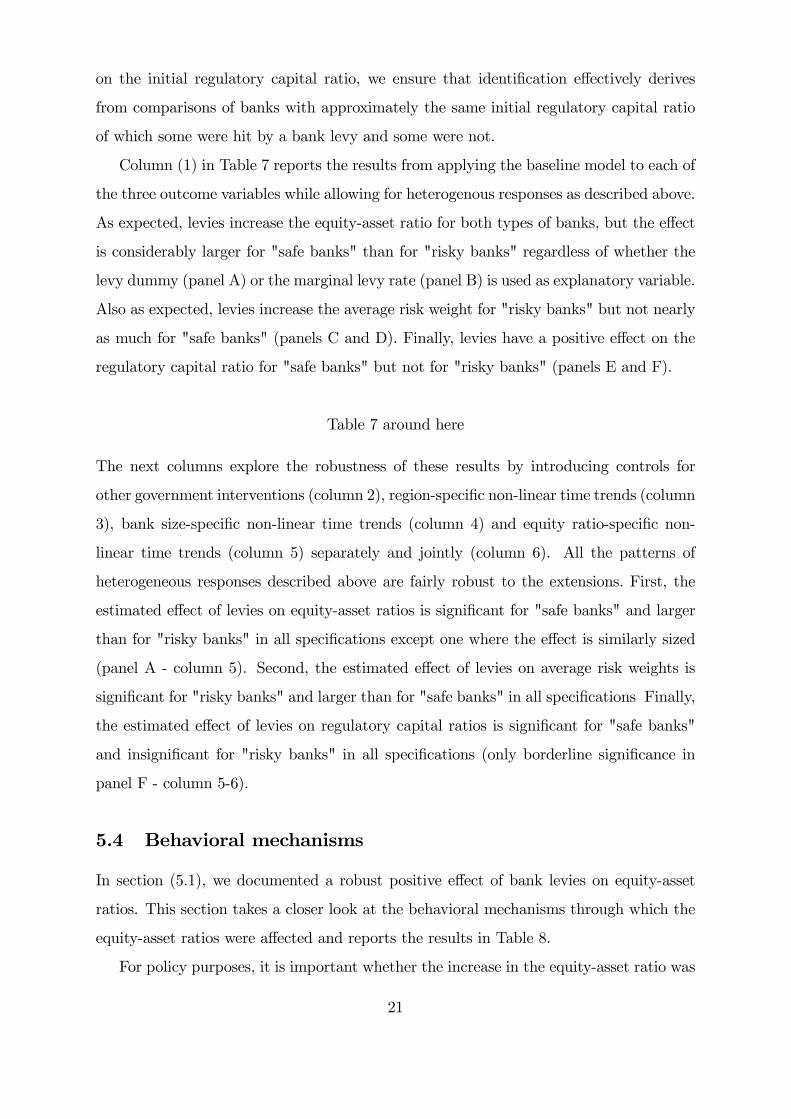
Column (1) in Table 7 reports the results from applying the baseline model to each of
the three outcome variables while allowing for heterogenous responses as described above.
As expected, levies increase the equity-asset ratio for both types of banks, but the effect
is considerably larger for "safe banks" than for "risky banks" regardless of whether the
levy dummy (panel A) or the marginal levy rate (panel B) is used as explanatory variable.
Also as expected, levies increase the average risk weight for "risky banks" but not nearly
as much for "safe banks" (panels C and D). Finally, levies have a positive effect on the
regulatory capital ratio for "safe banks" but not for "risky banks" (panels E and F).
Table 7 around here
The next columns explore the robustness of these results by introducing controls for
other government interventions (column 2), region-specific non-linear time trends (column
3), bank size-specific non-linear time trends (column 4) and equity ratio-specific non-
linear time trends (column 5) separately and jointly (column 6). All the patterns of
heterogeneous responses described above are fairly robust to the extensions. First, the
estimated effect of levies on equity-asset ratios is significant for "safe banks" and larger
than for "risky banks" in all specifications except one where the effect is similarly sized
(panel A - column 5). Second, the estimated effect of levies on average risk weights is
significant for "risky banks" and larger than for "safe banks" in all specifications Finally,
the estimated effect of levies on regulatory capital ratios is significant for "safe banks"
and insignificant for "risky banks" in all specifications (only borderline significance in
panel F - column 5-6).
5.4 Behavioral mechanisms
In section (5.1), we documented a robust positive effect of bank levies on equity-asset
ratios. This section takes a closer look at the behavioral mechanisms through which the
equity-asset ratios were affected and reports the results in Table 8.
For policy purposes, it is important whether the increase in the equity-asset ratio was
21

achieved by a substitution of debt funding for equity funding for a given level of assets or
by a reduction in assets for a given level of equity. In the latter case, the adverse effects
on the real economy could potentially be severe if the reduction in assets were driven by a
contraction in lending to non-financial firms. To test which of the two possible channels is
most empirically relevant, we estimate the baseline model where the dependent variable
is the equity stock (in logs) and the asset stock (in logs) respectively. Columns (1)-(2)
show that equity stocks increased significantly in response to the levies whereas columns
(3)-(4) show that there was no significant effects on asset stocks.
Table 8 around here
Moreover, from the basic accounting definition of equity, it follows that there are three
channels through which the stock of equity may have increased in response to the bank
levies: (i) banks raised equity on the capital markets for instance through issues of new
shares; (ii) banks reduced dividend payments to shareholders; (iii) banks earned larger
profits. While the first two channels represent real changes in financial policy that are
consistent with the change in incentives, it would be diffi cult to explain an effect of levies
on profitability. Ideally, we would like to know how much each of the three channels
contributed to the estimated increase in equity or, at least, how much of the total effect
can be attributed to real changes in financial policy and how much is the effect of changes
in profitability. Since we are unable to obtain good measures of share issues and dividend
payments, we take an indirect approach: we first compute an adjusted measure of equity
that only reflects active financial policy. In the starting year 2008, the adjusted equity
measure equals actual equity whereas, in the years 2009-2011, it equals actual equity net
of cumulated after-tax profits since 2008. By eliminating the mechanical effect of profits
on equity, the adjusted equity measure only changes when banks raise equity and pay
out dividends. We then estimate the baseline model using this adjusted equity measure.
Columns (5)-(6) show that the effect of levies on adjusted equity is comparable to and
in one case even slightly larger than the baseline results suggesting that the estimated
increase in equity-asset ratios fully reflects changes in banks’financial policy.
22

6 Concluding remarks
In the wake of the financial crisis, a number of countries have introduced bank levies in
an attempt to reduce risk in the financial sector. This paper has studied how the levies
introduced by the countries of the EU affected banks’funding and portfolio choices with
the ultimate aim of assessing whether the levies met this objective.
We first showed that the levies were associated with an average increase in equity-
asset ratios of around 1 to 1.5 percentage points. The increase in the equity-asset ratio
was shown to reflect active financial policy such as share issues and changes in dividend
policy rather than a contraction of the balance. These findings suggest that levies are
associated with a considerable reduction in banks’funding risk. We then showed that the
levies caused a sizable increase in regulatory risk-weights for the average bank. These
results suggest that banks may have responded to the levies by shifting risk from the
liability side to the asset side of the balance sheet. For the average bank, however, the
increase in portfolio risk is suffi ciently small that the net effect of the levies is to reduce
total risk.
Finally, we explored the heterogeneity in responses to the bank levies by splitting the
sample into "risky banks" with a low initial regulatory capital ratio and "safe banks" with
a high initial regulatory capital ratio. We found that while "safe banks" increased their
equity-asset ratio most in response to the levies, only "risky banks" increased the risk
of their assets so that while "safe banks" experienced a considerable reduction in total
risk, there was no such effect for "risky banks". This is consistent with the conceptual
framework that indicates that "risky banks", closer to being initially constrained by
regulatory capital requirements, switch their risk from the funding side to the portfolio
side in response to a tax on the funding side.
The results speak to current policy debates about banking regulation. The Basel
III agreements introduce the requirement that the ratio of regulatory capital to assets
(i.e. the leverage ratio) exceed a threshold of 3%. This complements the existing capital
requirement with respect to the ratio of regulatory capital to risk-weighted assets. Our
finding that funding risk and portfolio risk are substitutes suggests that the new minimum
leverage ratio could be of limited value. It is true that highly leveraged banks may be
forced to raise more equity to reach the minimum leverage ratio. However, to the extent
23

that the risk choices of these banks were initially constrained by the existing capital
requirement, they are likely to take advantage of the room for additional portfolio risk
created by the additional equity to leave total risk unaffected.
References
[1] Acharya, V., Mehran, H., Thakor, A., 2011. Caught between Scylla and Charybdis?
Regulating bank leverage when there is rent seeking and risk shifting. Unpublished
working paper. New York University
[2] Admati A., Demarzo, P., Hellwig, M., Pfleiderer, P., 2010. Fallacies, Irrelevant Facts,
and Myths in the Discussion of Capital Regulation: Why Bank Equity is Not Ex-
pensive, Stanford GSB Research Paper No. 2063
[3] Adrian, T., Shin, H., 2010. Liquidity and leverage. Journal of Financial Intermedi-
ation 19, 418—437
[4] Allen, F., Carletti, E., Marquez, R., 2011. Credit Market Competition and Capital
Regulation. Review of Financial Studies 24(4), 983-1018.
[5] Avery, R., Berger, A., 1991. Risk-based Capital and Deposit Insurance Reform.
Journal of Banking and Finance 15, 847-874.
[6] Beltratti, A., Stulz, R.M., 2012. The credit crisis around the globe: Why did some
banks perform better? Journal of Financial Economics 105, 1-17.
[7] Berger, A., Bouwman, C., 2013. How does capital affect bank performance during
financial crisis? Journal of Financial Economics 109, 146-176
[8] Brunnermeier, M., 2009. Deciphering the Liquidity and Credit Crunch 2007—2008.
Journal of Economic Perspectives 23(1), 77—100
[9] Chodorow-Reich, G., 2013. The Employment Effects of Credit Market Disruptions:
Firm-level Evidence from the 2008-09 Financial Crisis. Unplublished manuscript.
[10] Diamond, D., Rajan, R., 2009. The Credit Crisis: Conjectures about Causes and
Remedies. American Economic Review 99(2), 606-610.
24
[11] European Commission, 2012. Facts and figures on State aid in the EU Member
States. Commission StaffWorking Document, COM(2012) 778 final
[12] European Banking Authority, 2011. EBA Recommendation on the creation and su-
pervisory oversight of temporary capital buffers to restore market confidence. 8 De-
cember 2011.
[13] Gorton, G., Metrick, A., 2012. Securitized Banking and the Run on the Repo. Jour-
nal of Financial Economics 104, 425-451
[14] Gruber, J., Saez, E., 2002. The elasticity of taxable income: evidence and implica-
tions. Journal of Public Economics 84, 1-32.
[15] Haldane, A., 2013. Constraining discretion in bank regulation. Bank of England
mimeo
[16] Hart, O., Zingales, L., 2011. A New Capital Regulation for Large Financial Institu-
tions. American Law and Economics Review 13, 453—490.
[17] Hellwig, M., 2010. Capital regulation after the crisis: Business as usual? Preprints
of the Max Planck Institute for Research on Collective Goods, No. 2010/31
[18] International Monetary Fund, 2010. Financial Sector Taxation. The IMF’s Report
to the G-20 and Background Material.
[19] Ivashina, V., Scharfstein, D., 2010. Bank lending during the financial crisis of 2008.
Journal of Financial Economics 97, 319-338.
[20] Iyer, R., Peydro, J., 2011. Interbank Contagion at Work: Evidence from a Natural
Experiment. Review of Financial Studies 24(4), 1337-1377.
[21] Jacques, K., Nigro, P., 1997. Risk-based Capital, Portfolio Risk and Bank Capital: A
Simultaneous Equations Approach. Journal of Economics and Business 49, 533-547.
[22] Keen, M., 2011, The Taxation and Regulation of Banks. IMF Working Paper
WP/11/206
[23] Keen, M., de Mooij, R., 2012. Debt, Taxes and Banks. IMF Working Paper
WP/12/48.
25
[24] Kim, D., Santomero, A.M.,1988. Risk in Banking and Capital Regulation. Journal
of Finance 43,1219-1233.
[25] Koehn, M., Santomero, A.M.,1980. Regulation of bank capital and portfolio risk.
Journal of Finance 35,1235—1250.
[26] KPMG, 2011. Corporate and Indirect Tax Survey.
[27] KPMG, 2012. Bank Levies - comparison of certain jurisdictions. Edition IX.
[28] Laeven, L., Valencia, F., 2013. Resolution of Banking Crises: The Good, the Bad,
and the Ugly. In Stijn Claessens, M. Ayhan Kose, Luc Laeven and Fabián Valencia
(eds.), Financial Crises: Causes, Consequences, and Policy Responses, IMF.
[29] Lemmon, M., Roberts, M., Zender, J., 2008. Back to the Beginning: Persistence and
the Cross-Section of Corporate Capital Structure. Journal of Finance 63,1575-1608.
[30] Perotti, E., Suarez, J., 2011. A pigouvian approach to liquidity regulation. CEPR
Discussion Paper No. 8271
[31] Rime, B., 2001. Capital Requirements and Bank Behaviour: Empirical Evidence for
Switzerland. Journal of Banking and Finance 25, 789-805.
[32] Santos, J., 2011. Bank Corporate Loan Pricing Following the Subprime Crisis. Re-
view of Financial Studies 24(6), 1916-1943.
[33] Shin, H.S., 2009. Reflections on Northern Rock: The Bank Run That Heralded the
Global Financial Crisis. Journal of Economic Perspectives 23(1), 101-120.
[34] Thakor, A.V., 2012. Incentives to innovate and financial crises. Journal of Financial
Economics 103,130—148.
26

7 Appendix
Proof of Proposition 1
Assuming WL = 0 and Wα = 0, then totally differentiating (7) and (8), and noting
WαT = 0, implies
WLL WLα
WαL Wαα
dLdα
= −dT
WLT
0
(10)
and hence
dL
dT= −WααWLT
∆;dα
dT=WαLWLT
∆. (11)
where ∆ = WLLWαα − W 2αL. Substituting for θ
B and θD and their derivatives with
respect to L and α, and rearranging, it is possible to derive the following expressions for
the elements of (11).
WLL =(1 +R + T + LRL)2
α(1−B)2cχ− 2RL
∫ ∞
θDf(θ)dθ (12)
Wαα =1− L(1 +R + T )
α2(1−B)
{1
(1−B)− θB
}cχ (13)
WαL =1 +R + T
α(1−B)
{1
(1−B)− θB
}cχ (14)
WLT = −∫ ∞
θDf(θ)dθ < 0 (15)
where
χ =(1−B + c)2
(1 + c)cf(θD)− f(θB) (16)
1/(1 − B) − θB > 0 if L(1 + R + T ) < 1. Assuming that L is suffi ciently small for
this to be true, then χ < 0 is a suffi cient condition for WLL < 0, Wαα < 0, WαL < 0
and ∆ > 0, in which case Proposition 1 follows, and the second order conditions of the
maximization hold.�
27

Table 1: Bank levies in the European UnionBase Rate structure in 2011* Entry into force
LEVIES ON BANK BORROWING:Austria** 0.000% up to €1 billion 2011
0.055% up to €20 billion0.085% above €20 billion
Belgium 0.035% 2012
Cyprus total liabilities net of equity 0,090% 2011
Germany 0.000% up to €300 million 20110.020% up to €10 billion0.030% up to €100 billion0.040% up to €200 billion0.050% up to €300 billion0.060% above €300 billion
Latvia 0.036% 2011
Portugal 0.050% 2011
Romania 0,100% 2011
Slovakia 0.400% 2012
Sweden 0.036% 2009
Netherlands 0.000% up to €20 billion 20120,044% above €20 billion(half rate for long-term funding)
UK 0.000% up to £20 billion 20110.075% above £20 billion(half rate for long-term funding)
OTHER LEVIES:France 0.250% 2011
Hungary 0.150% up to HUF 50 billion 20100.530% above HUF 50 billion
Slovenia*** Total assets 0.100% 2011
total liabilities net of equity and subordinated debt
total liabilities net of equity and insured deposits
total liabilities net of equity and insured deposits
total liabilities net of equity and insured deposits
total liabilities net of equity and insured deposits
total liabilities net of equity and insured deposits
Notes: *2012 rates when this is the year of entry into force; ** Levy payments in 2011-2013 were a function of the balance sheet in 2010; ***Exceptions apply depending on the stock and growth of lending to non-banks
total assets net of interbank loans
total liabilities net of equity and insured deposits
minimal amount of own funds required to comply with coverage ratio
total liabilities net of equity and insured deposits
total liabilities net of equity and insured deposits but netting of gross assets and liabilities against the same counterpart and deduction for liquid assets
total liabilities net of equity and insured deposits

Table 2 : Summary statistics
(1) (2) (3) (4) (5) (6) (7) (8) (9) (10) (11)
Obs Mean S.d. Obs Mean Obs Mean Obs Mean Obs Mean
Total Assets (euro million) 18131 17776 111022 12994 19975 5137 12212 5139 5228 5036 43257
Balance sheet components as share of total assets
Customer deposits 18131 0.53 0.30 12994 0.55 5137 0.48 5139 0.63 5036 0.55
Deposits from banks 18131 0.17 0.22 12994 0.18 5137 0.14 5139 0.14 5036 0.17
Long term funding 18131 0.10 0.10 12994 0.06 5137 0.19 5139 0.09 5036 0.15
Other liabilities 18126 0.07 0.15 12989 0.07 5137 0.06 5139 0.04 5036 0.05
Equity 18126 0.13 0.00 12989 0.13 5137 0.12 5139 0.11 5036 0.07
Loans to customers 18131 0.53 0.26 12994 0.51 5137 0.60 5139 0.55 5036 0.63
Loans to banks 18131 0.16 0.19 12994 0.16 5137 0.15 5139 0.16 5036 0.11
Securities 18131 0.21 0.19 12994 0.22 5137 0.17 5139 0.23 5036 0.18
Other assets 18131 0.09 0.17 12994 0.10 5137 0.08 5139 0.06 5036 0.06
Regulatory measures
Regulatory capital ratio 10175 0.17 0.08 6335 0.17 3840 0.17 5139 0.20 5036 0.13
Average risk weight 6997 0.59 0.18 3589 0.54 3408 0.64 3463 0.57 3534 0.61
Low capital
Note: Columns (1)-(3) provide summary statistics for our full sample of banks for the sample period 2008-2011. Columns (4)-(7) report variable means for banks located in countries that did / did not introduce a
bank levy during the period 2009-2012. Columns (8)-(11) report variable means for banks with a ratio of regulatory capital to risk-weighted assets above / below the sample median in 2008.
Levy Non-levy All banks High capital

Table 3: Equity - baseline(1) (2) (3) (4) (5) (6)
levy 0.0177*** 0.0164*** 0.0150***(0.0019) (0.0019) (0.0015)
marginal levy rate 0.1856*** 0.2282*** 0.2607***(0.0706) (0.0684) (0.0546)
log assets -0.1174*** -0.1175***(0.0338) (0.0337)
log assets squared 0.0020 0.0020(0.0024) (0.0024)
profitability 0.0035*** 0.0036***(0.0013) (0.0013)
inflation 0.0023*** 0.0015** 0.0026*** 0.0018***(0.0009) (0.0007) (0.0009) (0.0007)
gdp growth 0.0002 0.0006** 0.0006 0.0009***(0.0004) (0.0003) (0.0004) (0.0003)
corporate tax rate -0.2963 -0.0691 -0.5148*** -0.2803*(0.1944) (0.1695) (0.1913) (0.1693)
dummy 2009 0.0040*** 0.0114*** 0.0139*** 0.0040*** 0.0140*** 0.0162***(0.0011) (0.0033) (0.0029) (0.0011) (0.0034) (0.0029)
dummy 2010 0.0054*** 0.0086*** 0.0119*** 0.0058*** 0.0085*** 0.0120***(0.0013) (0.0026) (0.0021) (0.0013) (0.0026) (0.0021)
dummy 2011 -0.0049*** -0.0044** 0.0057*** 0.0035* 0.0017 0.0106***(0.0018) (0.0019) (0.0018) (0.0019) (0.0018) (0.0018)
Observations 16,449 16,449 16,415 16,449 16,449 16,415R-squared 0.0099 0.0116 0.2654 0.0036 0.0070 0.2620Number of banks 4,572 4,572 4,568 4,572 4,572 4,568bank fixed effects YES YES YES YES YES YEStime fixed effects YES YES YES YES YES YES
Equity / Assets
Note: The dependent variable is the ratio of book equity to assets; levy is a dummy variable at the country-year level taking the value one when there is a bank levy in place; marginal levy rate is an estimate at the bank-year level of the levy saving created by subsituting one unit of debt with one unit of equity; log assets is the log of assets; log assets squared is the log of assets squared; profitability is the ratio of pre-tax profits to assets; inflation is the rate of inflation at the country-year level; gdp growth is the rate of GDP growth at the country-year level; corporate tax rate is the corporate tax rate at the country-year level; dummy 2009 is a dummy variable indicating that the year is 2009.

Table 4: Equity - robustness(1) (2) (3) (4) (5)
PANEL Alevy 0.0151*** 0.0146*** 0.0147*** 0.0145*** 0.0103***
(0.0015) (0.0023) (0.0014) (0.0017) (0.0023)
PANEL Bmarginal levy rate 0.2843*** 0.1823*** 0.2885*** 0.2311*** 0.1529***
(0.0544) (0.0592) (0.0549) (0.0537) (0.0568)
Observations 16,218 16,415 15,819 15,844 15,819Covariates, bank FE and time FE YES YES YES YES YESControls for govt. interventions YES NO NO NO YEStime fixed effects × region NO YES NO NO YEStime fixed effects × size NO NO YES NO YEStime fixed effects × equity ratio NO NO NO YES YES
Equity / Assets
Note: The dependent variable is the ratio of book equity to assets; levy is a dummy variable at the country-year level taking the value one when there is a bank levy in place; marginal levy rate is an estimate at the bank-year level of the levy saving created by subsituting one unit of debt with one unit of equity; controls for government interventions include the value of government debt guarantees and recapitalization relative to bank assets and a dummy for intervention by the EU regulatory authorities; region indicates one of five regions in the EU; size indicates the 10 size deciles in 2008; equity ratio indicates the 10 equity ratio deciles in 2008. All equations include the variables: log assets: log assets squared, profitability, inflation, gdp growth and the corporate tax rate.

Table 5: Equity - placebo tests(1) (2) (3) (4)
levy 0.0045 -0.0050 0.0052 -0.0001(0.0042) (0.0059) (0.0035) (0.0030)
Observations 16,272 14,764 7,931 7,498Covariates, bank FE and time FE YES YES YES YESControls for govt. interventions NO YES NO YEStime fixed effects × region NO YES NO YEStime fixed effects × size NO YES NO YEStime fixed effects × equity ratio NO YES NO YES
Equity / Assets
Non-financial firmsAustrian, French, Slovene and
Hungarian levies
Note: The dependent variable is the ratio of book equity to assets; levy is a dummy variable at the country-year level taking the value one when there is a bank levy in place. All equations include the variables: log assets: log assets squared, profitability, inflation, gdp growth and the corporate tax rate. In columns (1)-(2), the sample consists of non-financial firms drawn from the Amadeus database so as to maintain the number of observation from each country as in the baseline regression. In columns (3)-(4), the consists of banks from countries with no levies as well as Austria, France, Slovenia and Hungary.

Table 6: Portfolio risk and regulatory capital ratio(1) (2) (3) (4)
levy 0.0200*** 0.0076***(0.0038) (0.0018)
marginal levy rate 0.4951*** 0.1425***(0.1268) (0.0528)
log assets -0.0437 -0.0428 -0.1419*** -0.1422***(0.0614) (0.0607) (0.0389) (0.0389)
log assets squared -0.0011 -0.0011 0.0051** 0.0051**(0.0035) (0.0035) (0.0023) (0.0023)
profitability -0.0440 -0.0315 0.4639*** 0.4708***(0.1335) (0.1342) (0.1505) (0.1501)
inflation 0.0008 0.0012 -0.0005 -0.0004(0.0014) (0.0014) (0.0006) (0.0006)
gdp growth -0.0006 -0.0004 -0.0003 -0.0001(0.0008) (0.0008) (0.0005) (0.0005)
corporate tax rate 0.2590 0.1472 0.0210 -0.0042(0.3299) (0.3283) (0.1624) (0.1648)
dummy 2009 -0.0127** -0.0106* 0.0061* 0.0073**(0.0059) (0.0059) (0.0032) (0.0032)
dummy 2010 -0.0165*** -0.0162*** 0.0165*** 0.0165***(0.0050) (0.0050) (0.0020) (0.0020)
dummy 2011 -0.0347*** -0.0317*** 0.0187*** 0.0210***(0.0051) (0.0048) (0.0024) (0.0022)
Observations 6,806 6,806 9,897 9,897R-squared 0.0844 0.0828 0.1543 0.1524Number of banks 2,225 2,225 3,026 3,026Bank and time FE YES YES YES YES
Risk weighted assets /Assets Regulatory capital / Risk weighted assets
Note: In columns (1-)-(2), the dependent variable is the ratio of risk-weighted assets to assets whereas in columns (3)-(4) it is the ratio of regulatory capital to risk weighted assets; levy is a dummy variable at the country-year level taking the value one when there is a bank levy in place; marginal levy rate is an estimate at the bank-year level of the levy saving created by subsituting one unit of debt with one unit of equity; log assets is the log of assets; log assets squared is the log of assets squared; profitability is the ratio of pre-tax profits to assets; inflation is the rate of inflation at the country-year level; gdp growth is the rate of GDP growth at the country-year level; corporate tax rate is the corporate tax rate at the country-year level; dummy 2009 is a dummy variable indicating that the year is 2009.

Table 7: Heterogeneity
(1) (2) (3) (4) (5) (6)
PANEL A
levy × low capital 0.012*** 0.011*** 0.007*** 0.011*** 0.010*** 0.005***
(0.001) (0.001) (0.002) (0.001) (0.001) (0.002)
levy × high capital 0.017*** 0.017*** 0.012*** 0.016*** 0.009*** 0.006**
(0.002) (0.002) (0.002) (0.002) (0.002) (0.003)
PANEL B
marg. levy rate × low capital 0.190*** 0.203*** 0.060 0.201*** 0.171*** 0.086**
(0.034) (0.034) (0.040) (0.032) (0.033) (0.037)
marg. levy rate × high capital 0.424*** 0.439*** 0.236*** 0.432*** 0.201*** 0.111
(0.073) (0.076) (0.062) (0.077) (0.072) (0.068)
Observations 9,897 9,822 9,897 9,695 9,708 9,695
PANEL C
levy × low capital 0.029*** 0.027*** 0.025*** 0.028*** 0.024*** 0.022***
(0.005) (0.005) (0.008) (0.005) (0.006) (0.008)
levy × high capital 0.009 0.012** 0.004 0.012** -0.003 -0.003
(0.006) (0.006) (0.008) (0.006) (0.007) (0.010)
PANEL D
marg. levy rate × low capital 0.550*** 0.564*** 0.477** 0.553*** 0.468** 0.452**
(0.175) (0.178) (0.198) (0.180) (0.183) (0.202)
marg. levy rate × high capital 0.340** 0.404** 0.163 0.414** 0.067 0.052
(0.165) (0.173) (0.177) (0.173) (0.174) (0.186)
Observations 6,753 6,691 6,753 6,594 6,603 6,594
PANEL E
levy × low capital 0.002 0.001 0.000 0.001 0.001 0.001
(0.002) (0.002) (0.004) (0.002) (0.002) (0.004)
levy × high capital 0.014*** 0.011*** 0.013*** 0.011*** 0.013*** 0.012**
(0.003) (0.003) (0.005) (0.003) (0.004) (0.005)
PANEL F
marg. levy rate × low capital 0.030 0.041 -0.045 0.024 0.013 0.010
(0.052) (0.050) (0.065) (0.054) (0.061) (0.062)
marg. levy rate × high capital 0.291*** 0.244** 0.231** 0.231** 0.201* 0.196*
(0.109) (0.112) (0.111) (0.113) (0.119) (0.119)
Observations 9,897 9,822 9,897 9,695 9,708 9,695
Covariates, bank FE and time FE YES YES YES YES YES YES
Controls for govt. interventions NO YES NO NO NO YES
time fixed effects × region NO NO YES NO NO YES
time fixed effects × size NO NO NO YES NO YES
time fixed effects × equity ratio NO NO NO NO YES YES
Equity / Assets
Risk weighted assets /Assets
Regulatory capital / Risk weighted assets
Note: In panels A-B the dependent variable is the ratio of book equity to assets; in panels B-C, it is the ratio of risk weighted assets to assets; in panels E-
F, it is the ratio of regulatory capital to risk weighted assets; levy is a dummy indicating that a bank levy in place; marginal levy rate is an estimate of the
levy saving created by subsituting one unit of debt with one unit of equity; low capital is a dummy for a regulatory capital ratio below the median in
2008; high capital is a dummy for a regulatory capital ratio above the median in 2008; controls for government interventions include the value of
government debt guarantees and recapitalization relative to bank assets and a dummy for intervention by the EU regulatory authorities; region indicates
one of five regions in the EU; size indicates the 10 size deciles in 2008; equity ratio indicates the 10 equity ratio deciles in 2008. All equations include the
variables: log assets, log assets squared , profitability , inflation , gdp growth and the corporate tax rate .
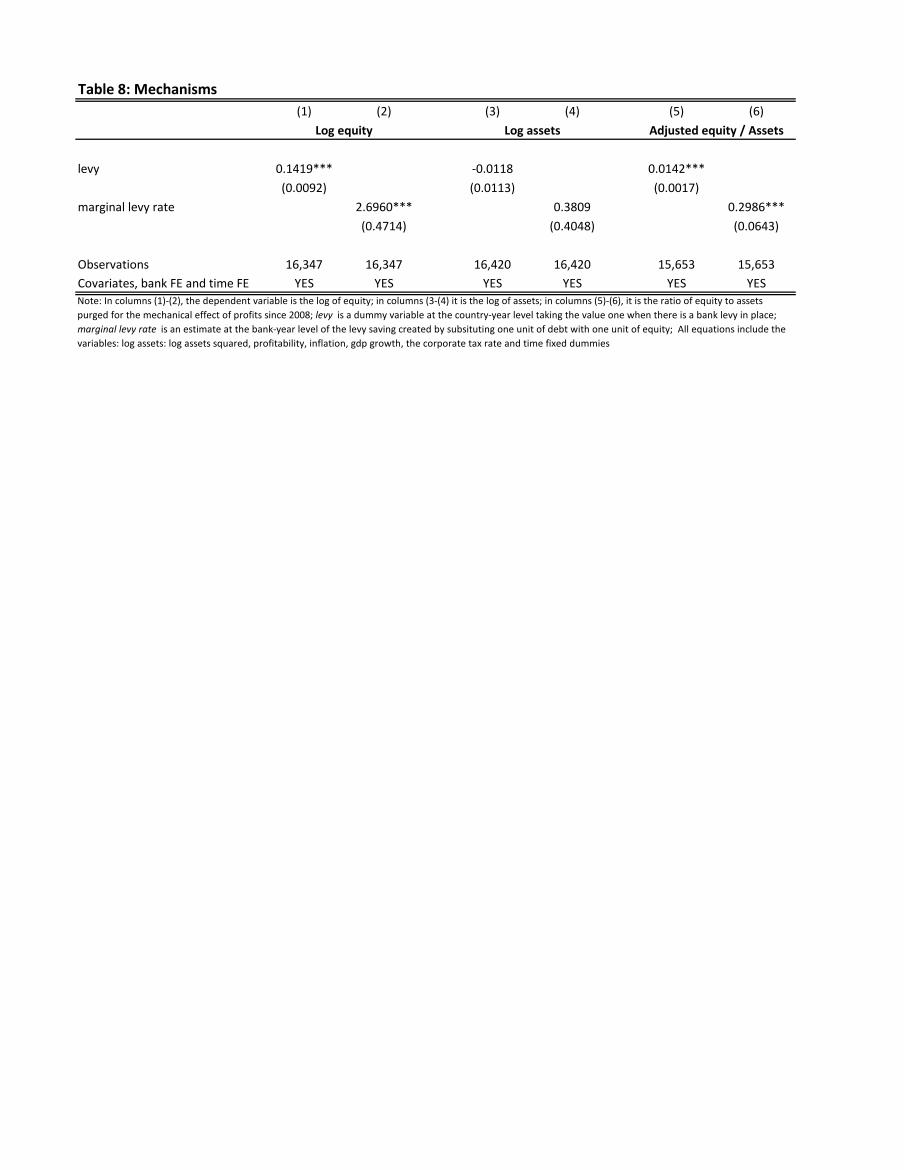
Table 8: Mechanisms(1) (2) (3) (4) (5) (6)
levy 0.1419*** -0.0118 0.0142***(0.0092) (0.0113) (0.0017)
marginal levy rate 2.6960*** 0.3809 0.2986***(0.4714) (0.4048) (0.0643)
Observations 16,347 16,347 16,420 16,420 15,653 15,653Covariates, bank FE and time FE YES YES YES YES YES YES
Log equity Log assets Adjusted equity / Assets
Note: In columns (1)-(2), the dependent variable is the log of equity; in columns (3-(4) it is the log of assets; in columns (5)-(6), it is the ratio of equity to assets purged for the mechanical effect of profits since 2008; levy is a dummy variable at the country-year level taking the value one when there is a bank levy in place; marginal levy rate is an estimate at the bank-year level of the levy saving created by subsituting one unit of debt with one unit of equity; All equations include the variables: log assets: log assets squared, profitability, inflation, gdp growth, the corporate tax rate and time fixed dummies
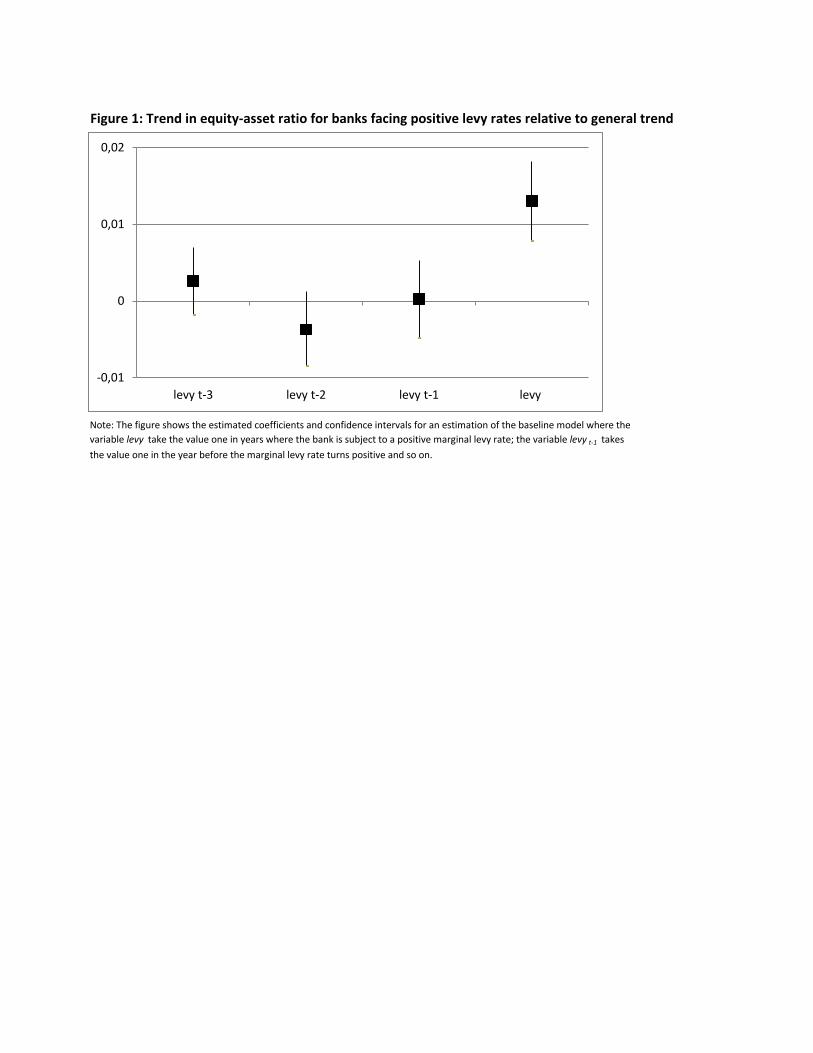
Figure 1: Trend in equity-asset ratio for banks facing positive levy rates relative to general trend
Note: The figure shows the estimated coefficients and confidence intervals for an estimation of the baseline model where the variable levy take the value one in years where the bank is subject to a positive marginal levy rate; the variable levy t-1 takes the value one in the year before the marginal levy rate turns positive and so on.
-0,01
0
0,01
0,02
levy t-3 levy t-2 levy t-1 levy

Reviewer Appendix(1) (2) (3) (4) (5) (6) (7) (8) (9) (10)
levy 0.0140*** 0.0131*** 0.0072*** 0.0065***(0.0014) (0.0013) (0.0018) (0.0018)
marginal levy rate 0.1741*** 0.2580*** 0.2054*** 0.1907*** 0.2284*** 0.2772***(0.0585) (0.0507) (0.0620) (0.0584) (0.0621) (0.0538)
equity /assets (lagged) 0.2354*** 0.1334*** 0.2384*** 0.1353***(0.0456) (0.0357) (0.0457) (0.0357)
log assets -0.1042*** -0.1042*** -0.0414** -0.0414** -0.1175***(0.0316) (0.0314) (0.0203) (0.0203) (0.0036)
log assets squared 0.0014 0.0014 -0.0002 -0.0002 0.0020***(0.0022) (0.0022) (0.0013) (0.0013) (0.0003)
profitability 0.0033** 0.0034** 0.0044 0.0044 0.0036***(0.0014) (0.0014) (0.0039) (0.0039) (0.0008)
inflation 0.0011* 0.0014** 0.0007 0.0009 0.0018***(0.0006) (0.0006) (0.0008) (0.0008) (0.0005)
gdp growth 0.0008*** 0.0011*** 0.0017*** 0.0018*** 0.0009***(0.0003) (0.0003) (0.0005) (0.0005) (0.0003)
corporate tax rate 0.0109 -0.1835 0.4821*** 0.3677** -0.2848***(0.1491) (0.1479) (0.1806) (0.1777) (0.0993)
Observations 15,579 15,551 15,579 15,551 15,579 15,551 15,579 15,551 16,449 16,415R-squared 0.0884 0.3025 0.0833 0.2993 0.0033 0.0394 0.0031 0.0393Number of banks 4,433 4,429 4,433 4,429 4,433 4,429 4,433 4,429 4,572 4,568bank fixed effects YES YES YES YES YES YES YES YES YES YEStime fixed effects YES YES YES YES YES YES YES YES YES YES
Equity / Assets Δ(Equity / Assets) Equity / AssetsOLS IV
Note: In columns (1)-(4) and (9)-(10), the dependent variable is the ratio of equity to assets; in columns (5)-(8) it is the first-difference in the ratio of equity to assets; levy is a dummy variable at the country-year level taking the value one when there is a bank levy in place; marginal levy rate is an estimate at the bank-year level of the levy saving created by subsituting one unit of debt with one unit of equity; log assets is the log of assets; log assets squared is the log of assets squared; profitability is the ratio of pre-tax profits to assets; inflation is the rate of inflation at the country-year level; gdp growth is the rate of GDP growth at the country-year level; corporate tax rate is the corporate tax rate at the country-year level. In columns (9)-(10), the marginal levy rate is instrumented with the marginal levy rate that would have applied had the bank had the exact same balance sheet as in 2008.

Oxford University Centre for Business Taxation Working Paper series recent papers
WP13/24 Matt Krzepkowski Debt and tax losses: the effect of tax asymmetries on the
cost of capital and capital structure
WP13/23 Jennifer Blouin, Harry Huizinga, Luc Laeven, Gaëtan Nicodème Thin
capitalization rules and multinational firm capital structure
WP13/22 Danny Yagan Capital tax reform and the real economy: the effects of the 2003
dividend tax cut
WP13/21 Andreas Haufler and Christoph Lülfesmann Reforming an asymmetric union: on
the virtues of dual tier capital taxation
WP13/20 Michael Blackwell Do the haves come out ahead in tax litigation? An empirical
study of the dynamics of tax appeals in the UK
WP13/19 Johannes Becker and Ronald B Davies Learning and international policy diffusion:
the case of corporate tax policy
WP13/18 Reuven S Avi-Yonah And yet it moves: taxation and labour mobility in the 21st
century
WP13/17 Anne Brockmeyer The investment effect of taxation: evidence from a corporate
tax kink
WP13/16 Dominika Langenmayr and Rebecca Lesterz Taxation and corporate risk-taking
WP13/15 Martin Ruf and Alfons J Weichenrieder CFC legislation, passive assets and the
impact of the ECJ’s Cadbury-Schweppes decision
WP13/14 Annette Alstadsæter and Martin Jacob The effect of awareness and incentives
on tax evasion
WP13/13 Jarkko Harju and Tuomos Matikka The elasticity of taxable income and income-
shifting between tax bases: what is “real” and what is not?
WP13/12 Li Liu and Andrew Harper Temporary increase in annual investment allowance
WP13/11 Alan J Auderbach and Michael P Devererux Consumption and cash-flow taxes in
an international setting
WP13/10 Andreas Haufler and Mohammed Mardan Cross-border loss offset can fuel tax
competition
WP13/09 Ben Lockwood How should financial intermediation services be taxed?

WP13/08 Dominika Langenmayr, Andreas Haufler and Christian J bauer Should tax policy
favour high or low productivity firms?
WP13/07 Theresa Lohse and Nadine Riedel Do transfer pricing laws limit international
income shifting? Evidence from European multinationals
WP13/06 Ruud de Mooij and Jost Heckemeyer Taxation and corporate debt: are banks any
different?
WP13/05 Rita de la Feria EU VAT rate structure: towards unilateral convergence?
WP13/04 Johannes Becker and Melaine Steinhoff Conservative accounting yields excessive
risk-taking - a note
WP13/03 Michael P.Devereux, Clemens Fuest, and Ben Lockwood The Taxation of Foreign
Profits: a Unified View
WP13/02 Giorgia Maffini Corporate tax policy under the Labour government 1997-2010
WP13/01 Christoph Ernst, Katharina Richter and Nadine Riedel Corporate taxation and the
quality of research & development
WP12/29 Michael P Devereux and Simon Loretz What do we know about corporate tax
competition?
WP12/28 Rita de la Feria and Richard Krever Ending VAT Exemptions: Towards A Post-
Modern VAT
WP12/27 Theresa Lohse, Nadine Riedel and Christoph Spengel The Increasing Importance of Transfer Pricing Regulations – a Worldwide Overview
WP12/26 Harry Huizinga, Johannes Voget and Wolf Wagner Capital gains taxation and the cost of capital: evidence from unanticipated cross-border
transfers of tax bases
WP12/25 Harry Huizinga, Johannes Voget and Wolf Wagner International taxation and cross border banking WP12/24 Johannes Becker and Nadine riedel Multinational Firms Mitigate Tax Competition WP12/23 Michael Devereux, Li Liu and Simon Loretz The Elasticity of Corporate Taxable Income: New Evidence from UK Tax Records
WP12/22 Olivier Bargain, Mathias Dolls, Clemens Fuest, Dirk Neumann, Andreas Peichl, Nico Pestel, Sebastian Siegloch Fiscal Union in Europe? Redistributive and Stabilising Effects of a European Tax-Benefit System and Fiscal Equalisation Mechanism

WP12/21 Peter Egger, Christian Keuschnigg, Valeria Merlo and Georg Wamser Corporate taxes and internal borrowing within multinational firms
WP12/20 Jarkko Harju and Tuomos Kosonen The impact of tax incentives on the economic activity of entrepreneurs
WP12/19 Laura Kawano and Joel slemrod The effects of tax rates and tax bases on corporate tax revenues: estimates with new measures of the corporate tax base WP12/18 Giacomo Rodano, Nicolas Serrano-Velarde and Emanuele Tarantino Bankruptcy law and the cost of banking finance
WP12/17 Xavier Boutin, Giacinta Cestone, Chiara Fumagalli, Giovanni Pica and Nicolas Serrano-Velarde The Deep pocket effect of internal capital markets
WP12/16 Clemens Fuest, Andreas Peichl and Sebastian Siegloch Which workers bear the burden of corporate taxation and which firms can pass it on? Micro evidence from Germany
WP12/15 Michael P. Devereux Issues in the Design of Taxes on Corporate Profit WP12/14 Alan Auerbach and Michael P. Devereux Consumption Taxes In An International Setting
WP12/13 Wiji Arulampalam, Michael P. Devereux and Federica Liberini Taxes and the location of targets
WP12/12 Scott Dyreng, Bradley Lindsey and Jacob Thornock Exploring the role Delaware plays as a tax haven
WP12/11 Katarzyna Bilicka and Clemens Fuest With which countries do tax havens share information?
WP12/10 Giorgia Maffini Territoriality, Worldwide Principle, and Competitiveness of Multinationals: A Firm-level Analysis of Tax Burdens
WP12/09 Daniel Shaviro The rising tax-electivity of US residency
WP12/08 Edward D Kleinbard Stateless Income
WP12/07 Vilen Lipatov and Alfons Weichenrieder Optimal income taxation with tax competition
WP12/06 Kevin S Markle A Comparison of the Tax-motivated Income Shifting of Multinationals in Territorial and Worldwide Countries WP12/05 Li Liu Income Taxation and Business Incorporation: Evidence from the Early Twentieth Century WP12/04 Shafik Hebous and Vilen Lipatov A Journey from a Corruption Port to a Tax Haven

WP12/03 Neils Johannesen Strategic line drawing between debt and equity WP12/02 Chongyang Chen, Zhonglan Dai, Douglas A. Shackelford and Harold H. Zhang,
Does Financial Constraint Affect Shareholder Taxes and the Cost of Equity Capital?
WP12/01 Stephen R. Bond and Irem Guceri, Trends in UK BERD after the Introduction of R&D Tax Credits WP11/24 Athiphat Muthitacharoen George R. Zodrow Revisiting the Excise Tax Effects of the Property Tax
WP11/23 Krautheim, Sebastian and Tim Schmidt-Eisenlohr Wages and International Tax Competition
WP11/22 Haufler, Andreas, Pehr-Johan Nörback and Lars Persson Entrepreneurial innovation and taxation WP11/21 Mancini, Raffaele, Paolo M. Panteghini and Maria laura Parisi Debt-Shifting in Europe WP11/20 Xing, Jing Does tax structure affect economic growth? Empirical evidence from OECD countries WP11/19 Freedman, Judith Responsive regulation, risk and rules: applying the theory to tax practice WP11/18 Devereux, Michael P. and Simon Loretz How would EU corporate tax reform affect US investment in Europe? WP11/17 Vella, John, Clemens Fuest and Tim Schmidt-Eisenlohr Response on EU proposal for a Financial Transaction Tax WP11/16 Loretz, Simon and Socrates Mokkas Evidence for profit-shifting with tax sensitive capital stocks WP11/15 Weisenbach, david A. Carbon taxation in the EU: Expanding EU carbon price WP11/14 Bauer, Christian, Davies, Ronald B. and Andreas Hauer Economic Integration and the Optimal Corporate Tax Structure with Heterogeneous Firms WP11/13 Englisch, Joachim National Measures to Counter Tax Avoidance under the Merger Directive WP11/12 de la Feria, Rita and Clemens Fuest Closer to an Internal Market? The Economic Effects of EU Tax Jurisprudence WP11/11 Englisch, Joachim EU Perspective on VAT Exemptions WP11/10 Riedel, Nadine and Hannah Schildberg-Hörisch Asymmetric Obligations

WP11/09 Böhm, Tobias and Nadine Riedel On Selection into Public Civil Service WP11/08 Auerbach, Alan J. and Michael P. Devereux Consumption and Cash-Flow Taxes in an International Setting WP11/07 Becker, Johannes and Clemens Fuest Tax Competition: M&A versus Greenfield Investment WP11/06 Riedel, Nadine Taxing Multinationals under Union Wage Bargaining WP11/05 Liu, Li and Rosanne Altshuler Measuring the Burden of the Corporate Income Tax under Imperfect Competition WP11/04 Becker, Johannes and Clemens Fuest The Taxation of Foreign Profits - The Old View, the New View, and a Pragmatic View WP11/03 Konrad, Kai Search Costs and Corporate Income Tax Competition WP11/02 Hellerstein,Walter Comparing the Treatment of Charities Under Value Added Taxes and Retail Sales Taxes WP11/01 Dharmapala, Dhammika and Nadine Riedel Earnings Shocks and Tax-Motivated Income-Shifting: Evidence from European Multinationals