can switching fuels save water? a life cycle - iopscience
TRANSCRIPT

LETTER • OPEN ACCESS
Can switching fuels save water? A life cyclequantification of freshwater consumption for Texascoal- and natural gas-fired electricityTo cite this article: Emily A Grubert et al 2012 Environ. Res. Lett. 7 045801
View the article online for updates and enhancements.
You may also likeFlared natural gas-based onsiteatmospheric water harvesting (AWH) foroilfield operationsEnakshi D Wikramanayake and VaibhavBahadur
-
Drought and the water–energy nexusin TexasBridget R Scanlon, Ian Duncan and RobertC Reedy
-
Changing the spatial location of electricitygeneration to increase water availability inareas with drought: a feasibility study andquantification of air quality impacts inTexasAdam P Pacsi, Nawaf S Alhajeri, Mort DWebster et al.
-
Recent citationsAssessment of regional water demand forcoal-based power plants in India: exploringits regional impact on other cross-sectoralwater stressDharmesh Kumar Singh and ShresthTayal
-
Water-energy-carbon nexus: A life cycleassessment of post-combustion carboncapture technology from power plant levelJunyao Wang et al
-
Chanceconstrained operation of the waterenergy nexus with conflicting objectivesNing Gao et al
-
This content was downloaded from IP address 177.154.226.86 on 07/12/2021 at 22:43
IOP PUBLISHING ENVIRONMENTAL RESEARCH LETTERS
Environ. Res. Lett. 7 (2012) 045801 (11pp) doi:10.1088/1748-9326/7/4/045801
Can switching fuels save water? A lifecycle quantification of freshwaterconsumption for Texas coal- and naturalgas-fired electricity
Emily A Grubert1, Fred C Beach2 and Michael E Webber2,3
1 Department of Environmental and Water Resources Engineering, The University of Texas at Austin,USA2 Center for International Energy and Environmental Policy, The University of Texas at Austin, USA3 Department of Mechanical Engineering, The University of Texas at Austin, USA
E-mail: [email protected]
Received 10 April 2012Accepted for publication 8 August 2012Published 8 October 2012Online at stacks.iop.org/ERL/7/045801
AbstractThermal electricity generation is a major consumer of freshwater for cooling, fuel extraction and airemissions controls, but the life cycle water impacts of different fossil fuel cycles are not well understood.Much of the existing literature relies on decades-old estimates for water intensity, particularly regardingwater consumed for fuel extraction. This work uses contemporary data from specific resource basins andpower plants in Texas to evaluate water intensity at three major stages of coal and natural gas fuel cycles:fuel extraction, power plant cooling and power plant emissions controls. In particular, the water intensityof fuel extraction is quantified for Texas lignite, conventional natural gas and 11 unconventional naturalgas basins in Texas, including major second-order impacts associated with multi-stage hydraulicfracturing. Despite the rise of this water-intensive natural gas extraction method, natural gas extractionappears to consume less freshwater than coal per unit of energy extracted in Texas because of the highwater intensity of Texas lignite extraction. This work uses new resource basin and power plant levelwater intensity data to estimate the potential effects of coal to natural gas fuel switching in Texas’ powersector, a shift under consideration due to potential environmental benefits and very low natural gasprices. Replacing Texas’ coal-fired power plants with natural gas combined cycle plants (NGCCs) wouldreduce annual freshwater consumption in the state by an estimated 53 billion gallons per year, or 60% ofTexas coal power’s water footprint, largely due to the higher efficiency of NGCCs.
Keywords: natural gas, coal, electric power, water intensity, life cycle analysis, energy–water nexus
S Online supplementary data available from stacks.iop.org/ERL/7/045801/mmedia
1. Introduction
1.1. Background
Coal and natural gas are depletable fossil fuels commonlyused to generate electricity, each with operational advantages
Content from this work may be used under the termsof the Creative Commons Attribution-NonCommercial-
ShareAlike 3.0 licence. Any further distribution of this work must maintainattribution to the author(s) and the title of the work, journal citation and DOI.
and environmental impacts. In the United States, costsand emissions from the coal and natural gas fuel cyclesin particular have received significant public attention,especially as new long-lived generation assets replace olderpower plants. Concern about greenhouse gas and other airemissions—and the associated compliance costs that coalplants increasingly face—has raised the question of whetherpolicy makers should promote a shift from coal to natural gasor other generation.
11748-9326/12/045801+11$33.00 c© 2012 IOP Publishing Ltd Printed in the UK
Environ. Res. Lett. 7 (2012) 045801 E A Grubert et al
Simultaneously, new water-intensive extraction methodsfor natural gas have created concern regarding waterconsumption and pollution for natural gas, historicallyconsidered a clean fuel. The trend toward more natural gas-fired electricity, the rapid expansion of hydraulic fracturingfor natural gas extraction, and recent major droughtshave publicly highlighted energy-related water consumption,withdrawal needs and contamination (see e.g. [1]). While theair and solid waste impacts of coal- and natural gas-firedelectricity have been well characterized [2], the relative waterintensity of coal and natural gas fuel cycles has receivedless attention. Despite recent specific attention to naturalgas’ impacts on water resources [3], both coal- and naturalgas-fired electricity use large amounts of water for fuelextraction and power plant operations, and decision makerscan benefit from a quantitative comparison of the two.
This work’s main objective is to quantify in-statewater consumption associated with Texas’ coal- and naturalgas-fired electricity, then to assess the potential impactsof coal to natural gas fuel switching on Texas’ freshwatersystems. Major contributions of this analysis include higherresolution data on the water intensity of coal and naturalgas extraction than have previously been published. Inparticular, this work derives water intensity factors usingresource basin-specific data and including major second-ordersources of water consumption. Notably, the water intensityof unconventional natural gas production via hydraulicfracturing is quantified for 11 separate basins. Many previousstudies have relied on 1993 average estimates of waterconsumed during natural gas and coal extraction [4–6], largelydue to a lack of data. This contemporary analysis builds onthe literature to provide new quantitative results relevant topolicy makers addressing energy, water and major relatedinfrastructures.
The ability to quantitatively compare the water intensityof coal- with natural gas-fired electricity is relevant to stateand national policy. Natural gas’ share of the Texas andUS fuel mixes has increased since 1990 (due to decreasingcoal-fired generation and steady natural gas share in Texasand steady coal-fired generation and increasing natural gasshare in the US) [7, 8]. In 2010, coal and natural gas provided36 and 45% of Texas’ roughly 400 TWh of electricity,respectively [7]. As more coal-fired power plants retire due toage and/or regulatory compliance costs, a more explicit shiftfrom coal to natural gas could begin, especially given today’shistorically low natural gas prices.
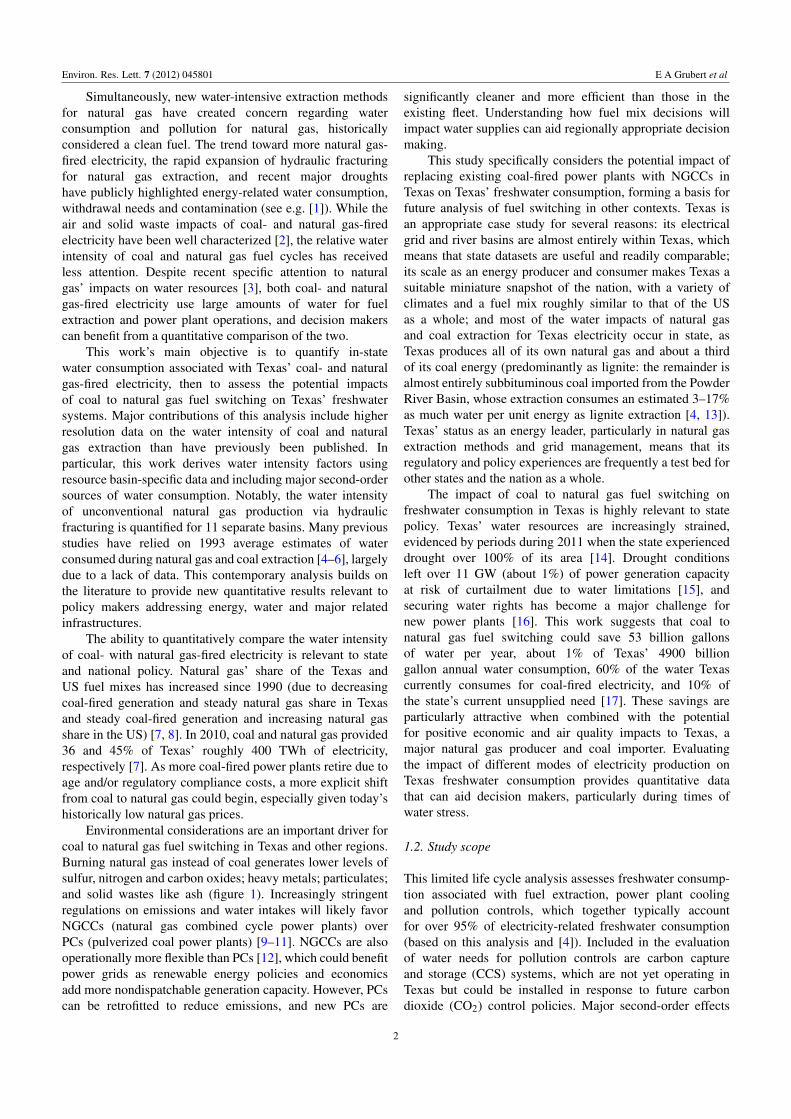
Environmental considerations are an important driver forcoal to natural gas fuel switching in Texas and other regions.Burning natural gas instead of coal generates lower levels ofsulfur, nitrogen and carbon oxides; heavy metals; particulates;and solid wastes like ash (figure 1). Increasingly stringentregulations on emissions and water intakes will likely favorNGCCs (natural gas combined cycle power plants) overPCs (pulverized coal power plants) [9–11]. NGCCs are alsooperationally more flexible than PCs [12], which could benefitpower grids as renewable energy policies and economicsadd more nondispatchable generation capacity. However, PCscan be retrofitted to reduce emissions, and new PCs are
significantly cleaner and more efficient than those in theexisting fleet. Understanding how fuel mix decisions willimpact water supplies can aid regionally appropriate decisionmaking.
This study specifically considers the potential impact ofreplacing existing coal-fired power plants with NGCCs inTexas on Texas’ freshwater consumption, forming a basis forfuture analysis of fuel switching in other contexts. Texas isan appropriate case study for several reasons: its electricalgrid and river basins are almost entirely within Texas, whichmeans that state datasets are useful and readily comparable;its scale as an energy producer and consumer makes Texas asuitable miniature snapshot of the nation, with a variety ofclimates and a fuel mix roughly similar to that of the USas a whole; and most of the water impacts of natural gasand coal extraction for Texas electricity occur in state, asTexas produces all of its own natural gas and about a thirdof its coal energy (predominantly as lignite: the remainder isalmost entirely subbituminous coal imported from the PowderRiver Basin, whose extraction consumes an estimated 3–17%as much water per unit energy as lignite extraction [4, 13]).Texas’ status as an energy leader, particularly in natural gasextraction methods and grid management, means that itsregulatory and policy experiences are frequently a test bed forother states and the nation as a whole.
The impact of coal to natural gas fuel switching onfreshwater consumption in Texas is highly relevant to statepolicy. Texas’ water resources are increasingly strained,evidenced by periods during 2011 when the state experienceddrought over 100% of its area [14]. Drought conditionsleft over 11 GW (about 1%) of power generation capacityat risk of curtailment due to water limitations [15], andsecuring water rights has become a major challenge fornew power plants [16]. This work suggests that coal tonatural gas fuel switching could save 53 billion gallonsof water per year, about 1% of Texas’ 4900 billiongallon annual water consumption, 60% of the water Texascurrently consumes for coal-fired electricity, and 10% ofthe state’s current unsupplied need [17]. These savings areparticularly attractive when combined with the potentialfor positive economic and air quality impacts to Texas, amajor natural gas producer and coal importer. Evaluatingthe impact of different modes of electricity production onTexas freshwater consumption provides quantitative datathat can aid decision makers, particularly during times ofwater stress.
1.2. Study scope
This limited life cycle analysis assesses freshwater consump-tion associated with fuel extraction, power plant coolingand pollution controls, which together typically accountfor over 95% of electricity-related freshwater consumption(based on this analysis and [4]). Included in the evaluationof water needs for pollution controls are carbon captureand storage (CCS) systems, which are not yet operating inTexas but could be installed in response to future carbondioxide (CO2) control policies. Major second-order effects
2
Environ. Res. Lett. 7 (2012) 045801 E A Grubert et al
Figure 1. On average, Texas’ coal-fired power plant fleet uses more energy and water and emits more air pollution to produce electricitythan Texas’ natural gas combined cycle plants (values normalized to production of 1 kWh of electricity).
from embodied water in drilling fluid components and inlimestone (used for sulfur pollution control) are included, butthe small amount of water used for transportation [4] andinfrastructure construction (e.g. for building power plants)is not. The Texas state line is the chosen study boundary,so out-of-state water consumption for materials used inTexas is not included. Drawing such geographical boundariesaligns better with the real-world aspects of state-based waterplanning and enables the use of internally consistent data.This work only addresses freshwater consumption, excludingmajor issues like water quality (e.g. chemical and thermalwater pollution) and water adequacy, or spatial and temporalavailability relative to demand (e.g. for power plant coolingwithdrawal needs). The study scope is illustrated in figures 1and 2.
This letter describes methods, data and results forestimating freshwater consumption associated with coal andnatural gas power plant cooling, extraction and pollutioncontrols. Discussions of the relative water intensity of coaland natural gas fuel cycles and routes to water savings follow.
Supplementary data can be found online (available at stacks.iop.org/ERL/7/045801/mmedia).
2. Methods
This life cycle analysis of Texas coal and natural gas fuelcycles uses literature-based water consumption rates forpower plant cooling, fuel extraction and pollution controls toevaluate freshwater consumption differences between NGCCsand existing PCs. These differences are evaluated at theindividual power plant level, assuming that each major PCin Texas is replaced by an NGCC of equivalent output withTexas NGCC fleet-average characteristics.
The standard metric used in this work is gallons ofwater consumed per kilowatt-hour of electricity generated(gal kWh−1), which allows direct comparison of the waterintensity of electricity from PCs and NGCCs. The waterintensity of coal and natural gas extraction in Texas iscalculated as gallons of water consumed per million Britishthermal units of fuel produced (gal/mmbtu). Data are from
3

Environ. Res. Lett. 7 (2012) 045801 E A Grubert et al
Figure 2. The study scope is limited to power plant cooling, fuel extraction and emissions controls within Texas. (Note: freshwaterconsumption incurred outside of Texas or for transportation (e.g. dust control for coal transport by rail or pressure testing for natural gastransport by pipeline) is not considered. Important electricity-related water considerations like adequacy for cooling water withdrawals,effect of use in small areas over short time periods, and impacts on water quality and habitats are outside the scope of this work.)
Nicot et al, a study of Texas oil, natural gas and miningindustry water use for the Texas Water Development Board(TWDB) that surveyed Texas coal producers on 2009–10coal production and associated water use and projected Texasnatural gas-related freshwater consumption between 2010and 2060 [18]. These figures are converted to gal kWh−1
using power plant heat rates to account for the differentefficiencies of PCs and NGCCs. Power plant fleet information,including heat rate, total generation, fuel source and installedemissions controls, is compiled from King et al [19], astudy of Texas power sector water use also prepared for theTWDB; United States Energy Information Administration(EIA) forms 860 and 923 [7, 8]; and the United StatesEnvironmental Protection Agency (EPA) Emissions andGeneration Resource Integrated Database (eGRID) [20]. Theremainder of this section presents specific data sources andanalytical approaches for each major freshwater-consumingsystem evaluated: fuel extraction, power plant cooling, andpollution controls for coal and natural gas fuel cycles in Texas.
2.1. Freshwater consumption for fuel extraction
2.1.1. Method: water consumption for coal extraction. Theaverage freshwater consumed to extract a short ton of Texaslignite is calculated assuming a conservatively high energydensity of 7000 btu/lb (Texas lignite heat content is typically
6500–7000 btu/lb) [21] and total 2009–10 production andwater use figures from all 11 active coal mines or mine groupsin Texas [18] according to equation (1):∑
Texas coal mines(water consumption (gal))
coal production (lb)×
lb7000 btu
. (1)
Freshwater intensity at coal mines depends primarily oninteractions between coal seams and aquifers, with centralTexas mines requiring more depressurization and dewateringthan east Texas mines due to their link to freshwateraquifers [18]. Water is consumed in other states to mineabout two thirds of the coal energy burned in Texas [22, 23].This out-of-state consumption is not tallied for this in-stateconsumption assessment but adds an estimated 2–10% to thetotal water consumption associated with coal extraction forTexas electricity, reflecting the much lower water intensity ofimported coal versus Texas lignite [4, 13].
The major use of water at coal mines is aquiferdewatering (depressurization), a process that removes waterfrom coal seams so that mining can proceed. Dewateringproduces water that theoretically becomes available for otherusers, but the water is generally extracted and dischargedindependent of potential beneficial use [18]. At least oneTexas lignite mine’s depressurization water is directlydesignated for municipal use, and such water is not countedtoward coal-related consumption here [18]. This document
4

Environ. Res. Lett. 7 (2012) 045801 E A Grubert et al
adopts the convention of the Texas Water Development Boardthat water removed from an aquifer and discharged without adesignated beneficial use represents consumption, as the wateris no longer available for use on demand and any downstreambenefits are ad hoc [18]. Stormwater removal from minepits is not considered consumption [18]. For clarity, thiswork assesses two values for freshwater consumption fromcoal extraction in Texas: gal/mmbtu of effective freshwaterconsumption, which includes depressurization water withouta designated downstream user, and gal/mmbtu of directconsumption, or freshwater inputs to coal mining.
2.1.2. Method: water consumption for natural gas extraction.The water intensity of natural gas extraction varies sub-stantially by basin and extraction technique, and so thiswork separately evaluates the water intensity of conventionalnatural gas extraction and extraction from 11 unconventionalbasins in Texas. Here, unconventional refers to naturalgas basins that require hydraulic fracturing for reservoirstimulation.
The freshwater intensity of conventional natural gasextraction is estimated using 10 years of data on Texasnatural gas well completions [24] and drilling fluid freshwateruse estimates based on surveys, borehole volume-basedcalculations and a literature review [18]. For the years 2000–9,water consumed per unit of natural gas is calculated bymultiplying a year’s oil and natural gas drilling water useby the proportion of natural gas wells and dividing by thatyear’s production. The 10 year average provides a baselinefor natural gas drilling water consumption per unit of energy,previously estimated as negligible in the literature [4]:[ 2009∑
i=2000
drilling water usei
×natural gas wellsi
completed oil and natural gas wells i
× [natural gas productioni]−1][10 years]−1. (2)
Texas’ fairly stable historical natural gas productionlevels [25] enable the assumption that lifetime productionfrom new wells is roughly equal to that year’s total naturalgas production. This assumption implies that wells are drilledat production replacement rate. Equation (2) is consideredan appropriate proxy for the water intensity of conventionalnatural gas production despite the inclusion of unconventionalproduction and byproduct natural gas production from oilwells: EIA reports 0 or unknown contribution from Texasunconventional natural gas wells through 2007 and less than25% in 2008–9, and byproduct natural gas accounts for∼10%of Texas’ production [22].
The water intensity of extraction from Texas’ mainunconventional natural gas basins is also calculated as waterconsumed/unit energy but includes water used for hydraulicfracturing. Estimated ultimate recovery (EUR) by basin isdivided by total estimated lifetime freshwater consumption for
drilling and hydraulic fracturing:[2060∑2010
basin freshwater consumption for drilling
and hydraulic fracturing][basin EUR]−1. (3)
Note that basin EURs are given in trillion cubic feet ofnatural gas equivalent (Tcfe), as some basins (like the EagleFord shale) produce oil and/or natural gas liquids (NGLs) inaddition to natural gas. While oil can be more water intensiveper unit of energy to extract than natural gas in traditionalsettings because of practices like waterflooding [26], theimpact of high liquids content on water use in hydraulicallyfractured shale basins is not explicitly considered here.Additionally, the potential for technological change is notincorporated, as the goal of this calculation is to determinetoday’s water intensity per unit of natural gas and bothEUR and total water use estimates are based on existingtechnology. Given the current focus on alternative fluids andwater recycling, near- to medium-term technological changesare likely to reduce water intensity [18].
In addition to direct water use for drilling andhydraulic fracturing, unconventional natural gas extractionuses proppants (usually sand or ceramic particles intended tohold fractures open) and chemicals whose production adds tothe total water footprint of unconventional natural gas, givenby equation (4):
drill water+ fracturing water+ water embedded in
proppant+ water embedded in chemicals. (4)
The water footprint of proppants and chemicals dependson the production methodology. About 25% of the roughly 6million short tons of proppant used for hydraulic fracturingin Texas in 2008 was Texas-mined industrial sand consumingan estimated 620 gal/short ton, with the remainder eitherimported or manufactured in Texas [18]. The freshwaterintensity of manufactured ceramic proppant is assumedequal to that of mined industrial sand, based on price datafrom [27, 28] and output from Carnegie Mellon’s life cycleanalysis tool, EIO-LCA [29]. EIO-LCA provides estimatesfor total water withdrawal per dollar of value by industry,here using the 2002 US Bureau of Economic Analysis’commodity-by-industry model of the US economy [29].Texas’ status as a major petrochemical producer suggests thatfracturing chemicals are largely manufactured in state, sothis analysis uses the EIO-LCA 2002 producer price modeland Jiang et al’s valuation of the chemicals in hydraulicfracturing fluids to estimate associated water consumption([30], details in supplementary data available at stacks.iop.org/ERL/7/045801/mmedia).
The water footprint of proppants is estimated to bebetween a low value assuming the 75% of proppants withunknown origin [18] are imported and a high value assumingall proppants used in Texas are mined or manufactured inTexas. The water footprint of chemicals is estimated to rangebetween a low value assuming that only direct manufacturingwater withdrawals are consumed and a high value assuming
5

Environ. Res. Lett. 7 (2012) 045801 E A Grubert et al
Table 1. A range of estimates for the freshwater consumption of chemical production is derived from an economic value-based life cycleanalysis tool. (Note: source [29]. Based on water withdrawals for top 10 sectors contributing to ‘other basic organic chemicalmanufacturing’, 2002 purchaser price model, $1 million in activity. Low estimate assumes all withdrawal for basic organic chemicalmanufacturing is consumption. High estimate assumes 1% of power sector withdrawals are consumed and that all other withdrawals arefully consumed.)
SectorWater withdrawals(kgal)
Low estimate, waterconsumption (kgal)
High estimate, waterconsumption (kgal)
Total 45 700 6430 32 700
Grain farming 23 600 23 600Power generation and supply 11 500 11 500 × 0.01 = 115Other basic organic chemicalmanufacturing
6 430 6430 6 430
Alkalis and chlorinemanufacturing
548 548
Cotton farming 457 457All other crop farming 360 360Petrochemical manufacturing 334 334Industrial gas manufacturing 318 318Paint and coatingmanufacturing
282 282
All other basic inorganicchemical manufacturing
225 225
that in addition, all other non-power generation withdrawalsand one per cent of the water withdrawn for power generationduring chemical manufacture are consumed in Texas [5]. Themethod is illustrated in table 1. Note that this range is likelyconservatively high, as some chemicals might be imported toTexas and some water recycling is likely. This conservatismis deemed appropriate due to large uncertainty about whichchemical compounds and amounts are used for hydraulicfracturing, though the impact of the uncertainty is likely smallsince extraction accounts for a relatively small portion of totalfuel cycle water consumption.
2.2. Freshwater consumption for power plant cooling
Cooling water consumption rates at Texas’ 18 operatingcoal-fired power plants (each with 1–4 generators, witha total of 36 coal boilers powering 37 generators [20])are derived from operational data presented in [19] (tableS.1, supplementary data available at stacks.iop.org/ERL/7/045801/mmedia). About 60% of Texas’ coal-fired powergeneration uses once through cooling, with the remaining 40%using wet recirculation [19].
NGCCs replacing coal-fired power plants in Texasare assumed to consume cooling water at a rate of0.23 gal kWh−1, based on data and analysis in [19].Texas’ NGCC generation is overwhelmingly cooled with wetrecirculating systems (over 90%), with the remainder usingonce through (about 5%) or air cooling [19].
2.3. Freshwater consumption for emissions controls
Of the common, commercially available emissions controlsystems, only sulfur oxide (SOx) controls consume significantamounts of water. Thirteen of Texas’ 36 coal-fired units areequipped with wet lime or limestone scrubbers to reduce SOx
emissions [20], which consume about 0.068 gal kWh−1 [31].Wet scrubbers and the fluidized bed combustion systemsat two other coal-fired units in Texas also consumeapproximately 0.227 pounds of lime or limestone kWh−1 [32]that, because of its weight, availability and relatively lowcost, is very likely mined in Texas. Based on the estimatefrom [18] that crushed limestone mining consumes 36 gallonsof surface or groundwater per short ton, the limestone usedfor sulfur scrubbing accounts for an additional embeddedfreshwater consumption of 0.004 gal kWh−1 for the nearlyhalf of Texas coal-fired electricity generated by units withsulfur scrubbers [20]. Natural gas-fired power plants arenot typically fitted with water-consuming pollution controlsystems due to their comparatively low air emissions, so waterconsumed for emissions controls mainly accrues to coal-firedelectricity.
Though CCS systems have not yet been deployed inTexas, they could increase total water consumption per kWhby 80% at PCs or 70% at NGCCs ([19], table 2, figure 3).Carbon capture systems increase power plant cooling needs,and high parasitic loads lead to more fuel combustion and thushigher total upstream water use for extraction.
3. Findings
Texas coal-fired power generation accounted for an estimated90 billion gallons of freshwater consumption in 2007 fromits full fuel cycle (0.61 gal kWh−1), including about 10billion gallons from mine dewatering. Generating the sameamount of power from Texas fleet-average NGCC unitswould consume 37 billion gallons of Texas freshwater(0.25 gal kWh−1), a 60% reduction versus coal. These figuresaccount for freshwater consumed for fuel extraction, coolingand emissions controls (table 3, figure 4). Higher efficiencyat Texas’ NGCCs versus its PCs accounts for about 80%
6

Environ. Res. Lett. 7 (2012) 045801 E A Grubert et al
Figure 3. Carbon capture systems increase life cycle in-state waterconsumption at the Texas PC and equivalent NGCC fleets. (Note:source [19]. ‘Without CCS’ values are averages for the 2007 PCfleet and an NGCC fleet with Texas-average characteristicsgenerating the same amount of electricity as the PC fleet in 2007.‘With CCS’ values are averages for the 2007 PC fleet assuming allplants are fitted with post-combustion carbon capture systems andfor an NGCC fleet producing the same amount of electricity andCO2 (83% of NGCCs in the ‘With CCS’ fleet are assumed to haveCCS systems).)
Table 2. Installing carbon capture systems at power plants wouldincrease water consumption significantly, but more for PCs thanNGCCs. (Note: source [19]. Values include dewatering dischargefor coal and use the EUR-weighted average for natural gas. Powerplants that import coal are assumed to continue to import. Waterneeds for non-carbon pollution controls might be higher thanindicated because some types of carbon dioxide scrubbers aresensitive to sulfur and would require higher sulfur removalefficacy [36]. The increase in water use for non-carbon pollutioncontrols includes installation of wet sulfur scrubbers at plants thatdo not currently use them.)
Pulverized coalNatural gas combined
cycle
Per cent gal kWh−1 Per cent gal kWh−1
Cooling water +95% +0.48 +75% +0.17Fuel extraction +43% +0.03 +18% +0.00Water fornon-carbonpollutioncontrols
+43% +0.07
Total +95% +0.58 +71% +0.18
of the water savings, mainly manifesting as reduced coolingneed due to lower waste heat production. Lower inherentcooling and emissions control needs at NGCCs account for
an additional 10% reduction in water consumption each, dueto the air-cooled gas turbine cycle and lower emissions ofNGCCs versus PCs (figure 4).
Saving 53 billion gallons of Texas freshwater byswitching from PC- to NGCC-generated electricity wouldincrease state natural gas demand by about 1.04 Tcf, 71%of 2007 state use and 15% of production [22, 23, 25].Generating 146 TWh at Texas’ PC plants in 2007 used 1.57quadrillion btu (quads) of coal energy (61 million tons/1.03quads imported, 42 million tons/0.54 quads in-state), whileNGCC units would consume 1.08 quads (1.04 Tcf) to generatethe same amount of electricity due to higher efficiency.
3.1. Water consumption for fuel extraction in Texas
Coal extraction in Texas for use at power plants consumedan estimated 11 billion gallons of freshwater in 2007,including water discharged without an identified downstreamuser. Replacing both Texas-extracted and imported coal withTexas natural gas would require an estimated 3.2 billiongallons of freshwater consumption for natural gas extraction(EUR-based average). Thus, replacing all coal burned in Texaswith natural gas extracted in Texas would avoid an estimated7.3 billion gallons of freshwater consumption per year. Notethat Texas coals’ low energy density make extraction forexport highly unlikely.
3.1.1. Water intensity of coal extraction in Texas. Coalmining in Texas consumes an estimated 16.1 gal/mmbtu offreshwater for direct use and mine dewatering, 1.6 gal/mmbtuof which are used directly for applications like domestic waterand dust control. This water use translates to 0.172 gal kWh−1
of freshwater consumption (0.017 gal kWh−1 withoutdewatering) at lignite-fired power plants, after accountingfor prevailing energy density and conversion efficiency atpower plants (table 4). Averaged across all Texas coal-firedpower plants, including those that use imported coal, Texascoal extraction accounts for 0.071 gal kWh−1 of freshwaterconsumption (0.007 gal kWh−1 without dewatering).
3.1.2. Water intensity of natural gas extraction in Texas.On average, natural gas extracted in Texas consumes anestimated 3.0 gal/mmbtu of freshwater, including indirectwater use for proppants and chemicals. This value translatesto 0.022 gal kWh−1 at Texas’ existing NGCC fleetand is based on expected EUR values for Texas’ major
Table 3. Fuel switching from coal to natural gas in combined cycle power plants could save 53 billion gallons of freshwater per year inTexas, about 20% of nonagricultural water consumption. (Note: switching from coal to natural gas combined cycle generation in Texaswould reduce in-state freshwater consumption by an estimated 53 billion gallons of water per year, based on 2007 generation levels. Figuresmight not sum perfectly due to rounding.)
Cooling water(bgal yr−1)
Fuel extraction(bgal yr−1)
Pollution controls(bgal yr−1)
Total(bgal yr−1)
Pulverized coal 75 11 5 90Natural gas combined cycle 34 3 — 37Savings from coal to gasswitching
41 7 5 53
7

Environ. Res. Lett. 7 (2012) 045801 E A Grubert et al
Figure 4. The greater efficiency of NGCCs is the primary driver of water savings versus PCs, mainly due to lower cooling water needs.(Note: sources: plant efficiency, [35]; cooling water needs, [19]. Efficiency effect accounts for the difference in heat rate between PCs andNGCCs and is calculated based on difference in excess btu consumed per kWh, e.g. on btu used beyond the 3412 btu kWh−1 unitequivalency. Cooling water needs are calculated assuming 15% of excess heat is lost to atmosphere through flue gases. Cooling waterconsumption is the generation-weighted average for Texas coal-fired power plants and the typical NGCC value described in the text. Coalextraction water intensity includes the 0 use associated with imported coal and assumes unallocated discharges from dewatering areconsumed during coal mining, and natural gas extraction water intensity is the EUR-weighted average for Texas natural gas, assumingproppants and chemicals collectively add 30% to the water intensity of unconventional natural gas extraction. Water consumption foremissions controls is the average over all Texas coal-fired power plants, including 0 use at plants without scrubbers.)
Table 4. Freshwater consumption for coal and natural gasextraction in Texas varies by resource basin. (Note: source [18, 31].Values include dewatering discharge for Texas lignite and embeddedwater in proppants and chemicals equal to 30% of direct water usefor Texas unconventional natural gas. Without dewatering, Texaslignite extraction consumes 1.6 gal/mmbtu (0.017 gal kWh−1). Thenatural gas average is EUR-weighted, assuming 60 Tcf ofconventional resources. Conversions from mmbtu to kWh assumethe Texas generation-weighted average heat rates of10 782 btu kWh−1 for coal-fired power plants and 7343 btu kWh−1
for NGCCs.)
Texas fuel resource
Waterconsumptionfor extraction(gal/mmbtu)
Waterconsumption forextraction(gal kWh−1)
Natural gas average 3.0 0.022Lignite 16.1 0.171
Natural gas by playConventional natural gas 0.2 0.002Eagle Ford 1.8–2.7 0.013–0.020Anadarko basin 2.0 0.015Bossier 2.4–3.8 0.018–0.028Gulf coast 2.9 0.021Pearsall 3.7 0.027Haynesville 4.0–6.3 0.029–0.046Other Permian Basin 4.1 0.030East Texas 4.3 0.031Woodford/Barnett 4.5 0.033Barnett 5.1–5.9 0.037–0.044Haynesville West 6.7 0.050
natural gas basins ([18]; table 4). The water intensityof extraction varies by natural gas basin, ranging froman estimated 0.2–5.2 gal/mmbtu of direct freshwaterconsumption (0.002–0.038 gal kWh−1). The HaynesvilleWest formation has the highest predicted water intensity,while conventional natural gas wells that are not hydraulicallyfractured have the lowest. Texas’ major shale gas plays,the Haynesville and Barnett, produce natural gas with anestimated direct water intensity of 3–5 gal/mmbtu (table 4).Increased water recycling, refracturing wells for additionalstimulus, and new or improved technology could change thesewater use estimates [18].
Embedded water in proppants and hydraulic fracturingchemicals likely adds the equivalent of between 20 and 60%of well site water consumption to natural gas extraction’sfreshwater consumption, with a best-guess estimate of about30%. Total impact on the water intensity of electricity variesby shale basin but ranges from 0.003 to 0.011 gal kWh−1
assuming a 30% increase versus direct water use. At aproppant loading of one pound per gallon of fracturing water,the embodied Texas freshwater consumption in proppantsis estimated at 80 000–310 000 gallons per million gallonsof hydraulic fracturing fluid, depending on how much ofthe proppant is mined or manufactured in Texas ratherthan imported. The estimated Texas freshwater consumptionembodied in hydraulic fracturing chemicals is similar, rangingfrom 76 000 to 320 000 gallons per million gallons ofhydraulic fracturing fluid.
8

Environ. Res. Lett. 7 (2012) 045801 E A Grubert et al
3.2. Water consumption for power plant cooling in Texas
Coal-fired power plants consumed 75 billion gallons offreshwater for cooling in 2007 (a generation-weighted averageof 0.50 gal kWh−1, with a range of 0.22–2.67 gal kWh−1
at operating Texas PCs). NGCCs with the same electricaloutput would consume 34 billion gallons for cooling(0.23 gal kWh−1), a savings of 41 billion gallons.
3.3. Water consumption for pollution controls in Texas
Sulfur control at scrubbed coal-fired power plants in Texasconsumed an estimated 5.0 billion gallons of water in2007 (0.034 gal kWh−1 overall, including unscrubbed plantgeneration). NGCCs do not have significant water-consumingpollution controls and thus would have avoided 5.0 billiongallons of freshwater consumption.
Using existing post-combustion carbon capture tech-nologies to reduce carbon dioxide emissions at Texas’existing coal-fired power plants by 85% would increasein-state freshwater consumption by an estimated 86 billiongallons per year. If the existing PC fleet were replacedby fleet-average NGCCs, the same carbon dioxide emissionreduction could be achieved with 120 billion gallons per yearless in-state freshwater consumption (details in supplementarydata available at stacks.iop.org/ERL/7/045801/mmedia).
4. Discussion
4.1. Freshwater consumption impact of coal to natural gasfuel switching in Texas
Converting Texas’ coal-fired power plants to NGCCs couldreduce freshwater consumption in Texas by over 50 billiongallons per year—60% of total coal-fired electricity-relatedconsumption and enough to supply 1 million people,assuming 140 gallons of daily consumption per person [16].Savings are likely to be even higher if some of the 23unscrubbed coal boilers in Texas are obliged to installwater-intensive scrubber systems. Some water savings couldbe realized without investing in new NGCCs by improvingexisting PC efficiency, increasing utilization of existingNGCCs or switching to less water-intensive cooling systemsat power plants, for example, though detailed implementationpathways are outside the scope of this study. Switching fromTexas lignite to imported Wyoming and Montana coal couldreduce both in-state and overall freshwater consumption forboth extraction and sulfur control, with potential air qualitybenefits and unclear economic tradeoffs for Texas.
The largest single water consumption category forpower generation is cooling water (∼80% of electricitygeneration-related freshwater consumption at PCs and ∼90%at NGCCs), which suggests that installing dry coolingsystems at PCs and/or NGCCs is also a viable way to savelarge amounts of water from the Texas electricity system.Typical dry cooling systems at PCs and NGCCs consume0.05 gal kWh−1 [16], a reduction of 95% at PCs and 80%at NGCCs. Switching to dry-cooled electricity would reduce
current cooling water consumption from 75 to about 7.5billion gallons per year. However, in Texas-like climates,annual average parasitic losses from switching to dry coolingfrom wet recirculating or open loop cooling are 2–3% forNGCCs and 11–13% for PCs [33], which translates to anincreased fuel and associated extraction water demand of2–3 or 12–14%. The additional fuel extraction-related waterconsumption of switching to dry cooling would be about 1.5billion gallons per year for the PC fleet (assuming currentmix of 40% wet recirculating and 60% once through coolingsystems)—about 2% of the savings—or less than 0.1 billiongallons per year for a replacement NGCC fleet (assumingcurrent mix of 90% wet recirculating and 5% once throughcooling systems) [19]. However, increasing fuel use andinstalling dry cooling systems would also increase costs andcould have other impacts.
Were post-combustion CCS systems to be deployed inTexas, the water advantage of NGCCs versus PCs wouldbe even larger than in the base case. NGCCs produce lessclimate change pollution, consume less water than PCs andbetter accommodate intermittent renewable energy sources ongrids, making them a potential tool in reducing both water andclimate stress with or without CCS systems.
4.2. Water for resource extraction
The finding that on average, Texas coal extraction consumesover seven times as much freshwater per kWh as Texas naturalgas extraction is somewhat unexpected (table 4), particularlygiven public concerns about the amount of water used forhydraulic fracturing in Texas [34]. When consumption fromdewatering coal mines is excluded, Texas coal and Texasnatural gas extraction consume roughly the same amount offreshwater per kWh. One major reason for the similarity isthat existing NGCCs are about 30% more efficient than PCsand thus require less fuel to produce electricity. In practice,Texas’ PCs (which are 31 yr old on average [35]) would likelybe replaced by new, even more efficient NGCCs, amplifyingthis distinction.
The water intensity of natural gas extraction in Texashas attracted more attention than the water intensity ofcoal mining, despite the fact that Texas lignite extractionis unusually water intensive for US coal [18]. In part,this attention is because of the rapid change in water usefor natural gas extraction since the commercialization ofhydraulic fracturing. In parallel, concerns about water qualityimpacts have also drawn attention to hydraulic fracturing.Natural gas from shales can be up to about 25 times aswater intensive as conventional natural gas (table 4), andthe use of high volume multi-stage hydraulic fracturingfor shale gas extraction is a recent but rapidly growingphenomenon, creating impacts at thousands of individual wellsites. Texas’ role as a natural gas exporter also means thatmuch of this water use is for the benefit of users outside ofTexas, as the presence of national markets encourages moreresource intensive, more expensive extraction techniques thanis required by the Texas market alone. By contrast, water usefor Texas coal extraction occurs at many fewer individual
9
Environ. Res. Lett. 7 (2012) 045801 E A Grubert et al
sites, began at a time when Texas had a smaller populationand lower drought stress, and has not changed dramaticallyover time. Furthermore, most of Texas’ coal is imported, withno in-state freshwater consumption for extraction.
5. Conclusions
Switching from pulverized coal to natural gas combinedcycle power plants in Texas would reduce in-state freshwaterconsumption, with savings driven by the greater efficiencyof NGCCs versus PCs. While freshwater consumption fornatural gas extraction in Texas has and will likely continueto increase with unconventional resource exploitation, ligniteextraction is over three times as water intensive as the mostwater-intensive shale gas expected in Texas, primarily becauseof the need to dewater mines. Repeating the analysis for otherregions, fuel mixes and energy systems (e.g. transportation)would likely prove helpful to decision makers seeking tobalance energy and water constraints.
Acknowledgments
This research was funded by the George and Cynthia MitchellFoundation, the US Department of Energy and the USNational Science Foundation’s EFRI-RESIN (Emerging Fron-tiers in Research and Innovation for Resilient Infrastructures)program.
References
[1] Galbraith K 2011 How energy drains water supplies The NewYork Times (www.nytimes.com/2011/09/19/business/global/19iht-green19.html)
[2] National Research Council 2007 Coal: Research andDevelopment to Support National Energy Policy(Washington, DC: National Academy Press) (www.nap.edu/.php?record id=11977)
[3] Klimasinska K and Efstathiou J Jr 2012 Drought helpsfracking foes build momentum for recycling Bloomberg(www.bloomberg.com/news/2012-07-23/drought-helps-fracking-foes-build-momentum-for-recycling.html)
[4] Gleick P H 1994 Water and energy Annu. Rev. EnergyEnviron. 19 267–99
[5] Department of Energy 2006 Energy Demands on WaterResources (www.sandia.gov/energy-water/congress report.htm)
[6] Fthenakis V and Kim H 2010 Life cycle uses of water in USelectricity generation Renew. Sustain. Energy Rev.14 2039–48
[7] Energy Information Agency Form 860 2010 Annual ElectricGenerator Report, 2009 (www.eia.gov/cneaf/electricity/page/eia860.html)
[8] Energy Information Agency Form 923 2010 Power PlantOperations Report, 2010 (www.eia.gov/cneaf/electricity/page/eia906 920.html)
[9] United States Environmental Protection Agency 2012Cross-State Air Pollution Rule (www.epa.gov/airtransport)
[10] United States Environmental Protection Agency 2012 Mercuryand Air Toxics Standards (www.epa.gov/mats)
[11] United States Environmental Protection Agency 2012 CoolingWater Intake Structures—CWA 316(b) (http://water.epa.gov/lawsregs/lawsguidance/cwa/316b/)
[12] Delarue E, Martens P and D’Haeseleer W 2012 Marketopportunities for power plant with post-combustion carboncapture Int. J. Greenhouse Gas Control 6 12–20
[13] Lovelace J K 2009 Methods for Estimating Water Withdrawalsfor Mining in the United States, 2005 (Reston, VA: UnitedStates Geological Survey)
[14] United States Drought Monitor—Texas 2011 As of 27 Sep2011 (www.drought.gov)
[15] Electricity Reliability Council of Texas 2011 Grid Operationsand Planning Report (www.ercot.com/content/meetings/board/keydocs/2011/1212/Item 06e - Grid Operationsand Planning Report.pdf)
[16] Stillwell A S, King C W, Webber M E, Duncan I J andHardberger A 2011 The energy-water nexus in Texas Ecol.Soc. 16 2
[17] Texas Water Development Board Water for Texas 2007 2007State Water Plan (www.twdb.state.tx.us/wrpi/swp/previous.asp)
[18] Nicot J, Hebel A, Ritter S, Walden S, Baier R, Galusky P,Beach J, Kyle R, Symank L and Breton C 2011 Current andProjected Water Use in the Texas Mining and Oil and GasIndustry (Austin, TX: Bureau of Economic Geology for theTexas Water Development Board) (www.texasenvironmentallaw.com/pdfs/ReportTWDB-MiningWaterUse.pdf)
[19] King C W, Duncan I J and Webber M E 2008 Water DemandProjections for Power Generation in Texas (Austin, TX:Bureau of Economic Geology for the Texas WaterDevelopment Board) (www.twdb.state.tx.us/wrpi/data/socio/est/final pwr.pdf)
[20] Environmental Protection Agency 2010 Emissions &Generation Resource Integrated Database: eGRID2010Version 1.1 (2007 data) (www.epa.gov/cleanenergy/energy-resources/egrid/index.html)
[21] Texas Window on State Government 2008 Energy Report:Coal (Austin, TX: Office of the Texas Comptroller) (www.window.state.tx.us/specialrpt/energy/nonrenewable/coal.php)
[22] Energy Information Administration 2010 State Energy DataSystem (SEDS) Texas (www.eia.gov/state/seds/seds-data-complete.cfm)
[23] Energy Information Administration 2009 Annual Coal Report:Coal Production and Number of Mines by State and MineType: 2007 (www.eia.gov/coal/annual/)
[24] Railroad Commission of Texas 2011 Texas Drilling Statistics(1960–2011) (www.rrc.state.tx.us/data/drilling/txdrillingstat.pdf)
[25] Railroad Commission of Texas 2011 Natural Gas Productionand Well Counts (1935–2010) (www.rrc.state.tx.us/data/production/gaswellcounts.php)
[26] Vaughan A, Pursell D and Pickering D 2010 Frac Attack:Risks, Hype, and Financial Reality of Hydraulic Fracturingin the Shale Plays (Houston, TX: Tudor, Pickering, Holt &Co.)
[27] CARBO Ceramics Inc. 2011 Form 10-K, Fiscal Year Ended 31December 2010 (www.sec.gov/Archives/edgar/data/1009672/000095012311018736/0000950123-11-018736-index.htm)
[28] Hunt Global Resources 2011 Hunt Global Resources toacquire 100 million ton frac sand mining operation PressRelease (www.huntglobalresources.com/pdf/HuntGlobalPress 052511.pdf)
[29] Carnegie Mellon University Green Design Institute 2008Economic Input-Output Life Cycle Assessment (EIO-LCA),US 2002 Producer Price Model (www.eiolca.net)
10

Environ. Res. Lett. 7 (2012) 045801 E A Grubert et al
[30] Mohan J, Griffin M, Hendrickson C, Jaramillo P,VanBriesen J and Venkatesh A 2011 Life cycle greenhousegas emissions of Marcellus shale gas Environ. Res. Lett.6 034014
[31] Grubert E and Kitasei S 2010 How energy choices affect freshwater supplies: a comparison of U.S. coal and natural gasNatural Gas and Sustainable Energy Initiative (www.worldwatch.org/)
[32] Spath P, Mann M and Kerr D 1999 Life cycle assessment ofcoal-fired power production National Energy TechnologyLaboratory Report TP-570-25119 (www.nrel.gov/docs/fy99osti/25119.pdf)
[33] Environmental Protection Agency 2009 Energy penalties, airemissions, and cooling tower side-effects TechnicalDevelopment Document 316(b) (Washington, DC: US
Environmental Protection Agency) (http://water.epa.gov/lawsregs/lawsguidance/cwa/316b/phase1/upload/2009 0402 316b phase1 technical ch3.pdf)
[34] Railroad Commission of Texas 2011 Water use in the BarnettShale (www.rrc.state.tx.us/barnettshale/waterusebarnettshale.php)
[35] Beach F C, Gonzalez M S, Butler J C and Webber M E 2011An analysis of the potential for expanded use of natural gasin electrical power generation, transportation, and directuse: Texas as a case study Report for The EnergyFoundation and The Cynthia and George MitchellFoundation
[36] Pehnt M and Henkel J 2009 Life cycle assessment of carbondioxide capture and storage from lignite power plants Int. J.Greenhouse Gas Control 3 49–66
11