can small hydro facilitate solar pv integration? evidence
TRANSCRIPT

Can small hydro facilitate solar PV integration?
Evidence from CAISORui Shan*, Oak Ridge National Laboratory
Colin Sasthav, University of TennesseeXianxun Wang, Duke University
42nd International Association for Energy Economics (IAEE) Annual ConferenceMay 29th -Jun 1st 2019, Montreal, Canada

Background
Solar PV brings the need of flexible resources for the grid
Battery may be expensive
Natural gas plant causes emission
Large hydropower has considerable environment impact
Small hydro (<30MW), has limited environment impact but usually thought not so flexible and responsive
Will it be a feasible option?

Observation
CAISO system wide averaged
daily profile for Jan and Jul, from
2013-2017
• Small hydro’s generation profile changes over the years• Morning peak become
evident• Evening peak delayed
• Is it significantly associated with solar PV’s increase?
• How does generation mix change rather than generation?
• Can we quantify such relation?

Method- Bayesian structural time series• Y: Portion of small hydro’s generation over the total
demand at hour h on day t;• X: Portion of solar PV on the same day t, spike-slab to
select the most influential one XH,t
• Break the hourly Yh into daily Yh,t time series sincesystem operator schedule them on daily basis
• Decompose into trend (T), monthly seasonality (S) and regression part with X;
• Similar to operator’s learning process, the relationship coefficient (and other parameters) is learned through a Bayesian learning process
• 24 models are built for each hour of small hydro• Iteration limit is 10,000 times
X1,t
X2,t
X23,t
X24,t
…
XH,t
T
S
Yh,t ~ β

Result
0
0.01
0.02
0.03
0.04
0.05
0.06
0.07
7 8 9 12 13 14 15 16 17 18 19 20 21 22
Coe
ffic
ient
Hydro Hour
Coefficient of Solar PV’s portion on small hydro’s portion
Solar Hour 8Solar Hour 14Solar Hour 18
00.10.20.30.40.50.60.70.80.9
1
1 3 5 7 9 11 13 15 17 19 21 23
Prob
abili
ty
Hydro Hour
Probability of Solar PV’s portion to be included
Solar Hour 13Solar Hour 14Solar Hour 18Solar Hour 20Solar Hour 8
• Statistically significant correlation between small hydro’s (SH) generation portion and solar PV’s, albeit small coefficient• Almost all the daytime and early evening, PV’s portion increase 1%, SH’s will increase 0.01%-0.06% • SH’s weight is most responsive with PV’s weight in the morning(8a.m.), due to two-side ramping demand (up then down)• Most hours of SH are associated with PV’s weight at its peaking time (2p.m.)• At lowest net load (1-3p.m.), SH is associated with PV’s weight at sunset time which varies across the year (5p.m.-8p.m.)• PV brings uncertainties and increases the need of many flexible resources, small hydro is one of them
BeginningPeakEnding

Explanation: Flexibility and Dispatchability• Less than half of small hydro
capacity in CA are low-flexible type (Run of River and Canal)
• Even the run of river type of hydro has ramping ability as ~5% of capacity per min*
• Almost half of small hydro plants (152/307) are not larger than 1.5MW, leading to limited flexibility
• As a fleet, the dispatchability can also provide considerable flexibility
Data from FERC license info in 2016
[0.0
0 , 1
.50
](1
.50
, 2.9
9 ]
(2.9
9 , 4
.49
](4
.49
, 5.9
8 ]
(5.9
8 , 7
.48
](7
.48
, 8.9
7 ]
(8.9
7 , 1
0.47
](1
0.47
, 11
.96
](1
1.96
, 13
.46
](1
3.46
, 14
.95
](1
4.95
, 16
.45
](1
6.45
, 17
.94
](1
7.94
, 19
.44
](1
9.44
, 20
.93
](2
0.93
, 22
.43
](2
2.43
, 23
.92
](2
3.92
, 25
.42
](2
5.42
, 26
.91
](2
6.91
, 28
.41
](2
8.41
, 29
.90
]
0
20
40
60
80
100
120
140
160
Capacity distribution
*International Energy Agency. (2014). The power of transformation: Wind, sun and the economics of flexible power systems. IEA.
23%
19%58%
California Operational Small Hydro Capacity (MW) by Mode
Run-of-river Canal/Conduit Others

Explanation: O&M Cost and LCOEMetric Natural Gas Plant Hydropower
Plant (<30MW)O&M Cost ($/kW-yr)1 23-50 31-125LCOE ($/MWh)1 30-119 36-69LCOE with Carbon Tax($/MWh) 46-144 36-69
• In the economic dispatch process, we assume the power plant bid at their O&M cost. • Small hydro is not the cheapest but some of them will still be dispatched along with some natural gas plants.• In terms of LCOE, small hydro is cheaper than many natural gas plant.• If impose a carbon tax at 48$/tCO2
2, more small hydro plants are preferred in system planning.• Even in a LCA analysis, small hydro only have 9 g/kWh and natural gas has 430 g/kWh.3• We suggest to plan more small hydro when resources are available and environment impact under control
1. Augustine C, Beiter P, Cole W, Feldman D, Kurup P, Lantz E, et al. 2018 Annual Technology Baseline ATB Cost and Performance Data for Electricity Generation Technologies-Interim Data Without Geothermal Updates. National Renewable Energy Laboratory-Data (NREL-DATA), Golden, CO (United …; 2018
2. Ricke K, Drouet L, Caldeira K, Tavoni M. Country-level social cost of carbon. Nat Clim Chang 2018;8:895 3. International Energy Agency. Renewable Energy Working Party, & IEA Renewable Energy Working Party.
(1998). Benign energy?: the environmental implications of renewables. OECD Publishing.
Q: Why not all natural gas plant but also small hydro?A: They are not exclusive and work together to provide flexibility

Future potential
We assume the relationship between SH and PV doesn’t change over time and the shape of daily profile doesn’t changeWe use the existing projection of CA’s demand and PV capacity to estimate the required small hydro capacity additionOnly account for the SH addition caused by PV, not hydrology nor other factorsThe highest generation addition of small hydro happen in afternoon of June:1620MW, as 3375MW capacity (CF=48%)The feasible SH capacity potential is 3.4 GW, higher than required while the technical potential is 7.2 GW
SH Capacity Need = .max1,3
SH1,3,4565 CF1,4589
= .max1,3
β3 ∗Solar1,?D1,?
− Solar1,?,4589D1,?,4589∗ D1,3 CF1,4589
D1,3 = D1,3,4589 ∗DBCBDE,4565DBCBDE,4589
Solar1,3 = Solar1,3,4589 ∗Solar CapBCBDE,4565Solar CapBCBDE,4589

Conclusion and Suggestion
• Small hydro has a complementary relationship, within the same day but may not in the same hour, with solar PV, which indicates that small hydro helps the grid to facilitate the solar PV;• When PV’s real-time generation portion increases 1%, SH’s will increase
0.01%-0.06%;• In terms of CO2, we need to exploit more small hydro’s potential;• CAISO’s current small hydro feasible potential is more than the required
capacity addition to accommodate future solar PV addition;• Technology advancement can unleash more potential of small hydro capacity.
It can reduce the need of battery and natural gas plant, saving money and reducing emission;

Slides for Q&A: Large Hydro
• Relationship of large hydro• Significant but not always
positive, probably due to pumped storage, water management constraints and cooling water demand
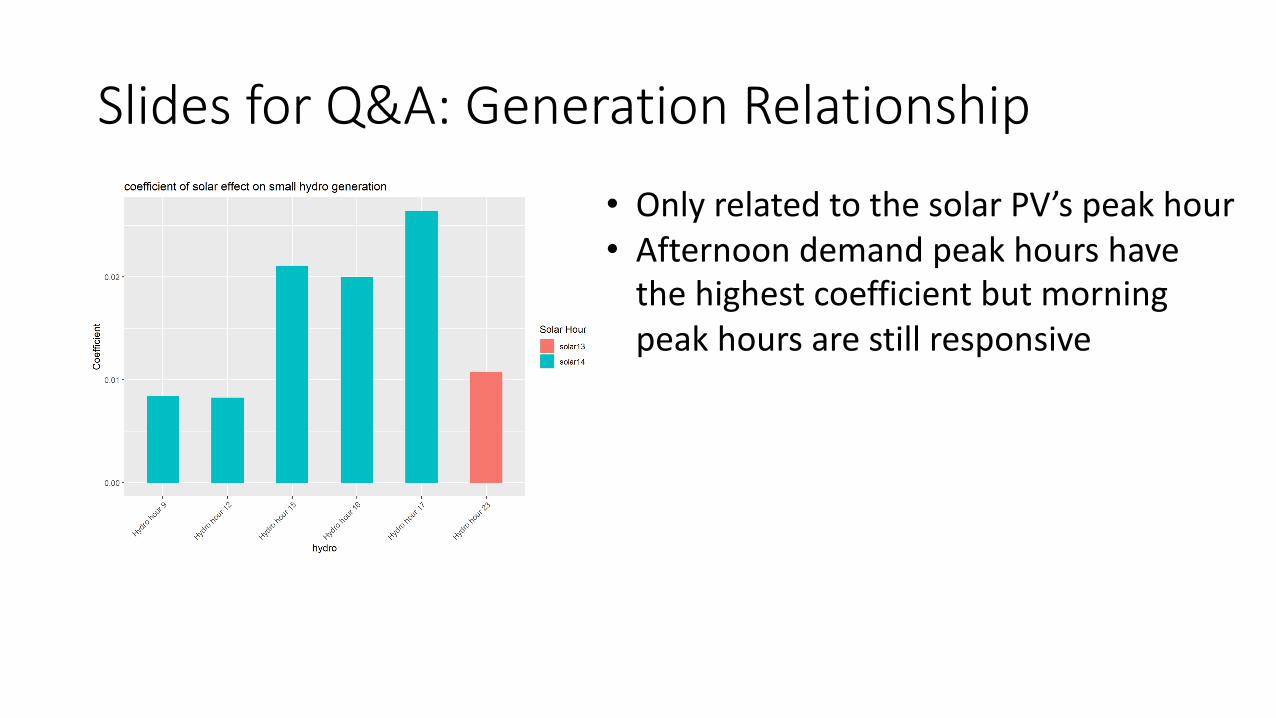
Slides for Q&A: Generation Relationship
• Only related to the solar PV’s peak hour• Afternoon demand peak hours have
the highest coefficient but morning peak hours are still responsive

Slides for Q&A: Dynamic Relationship
• Coefficients of generation relationship changes over time
• SH’s coefficients at the evening peak hours are always the highest
• SH’s coefficients in the morning peak hour increase over time, comparing to other coefficients
• All the coefficients have seasonality, perhaps due to the solar PV’s seasonality
Evening Peak Hours Coefficients
Morning Peak Hours Coefficients

Slides for Q&A: Model Details
• 𝑦𝐻,𝑡 = 𝑓(𝛽𝑇𝑋𝑡) + 𝜇𝑡 + 𝛾𝑡 + 𝜖𝑡
• 𝛽𝑖,𝑡+1 = 𝛽𝑖,𝑡 + 𝜑 𝜑~𝑁 0,𝜎𝑖2
𝑣𝑎𝑟 𝑥𝑖
•1
𝜎𝑖2~Γ(𝑎, 𝑏)
• 𝜇𝑡+1 = 𝜇𝑡 + 𝛿𝑡 + 휀𝑡 휀𝑡~𝑁(0, 𝜎휀2)
• 𝛿𝑡+1 = 𝐷 + 𝜙 𝛿𝑡 − 𝐷 + 𝜂𝑡 𝜂𝑡~𝑁(0, 𝜎𝜂2)
• 𝛾𝑡+1 = −σ𝑖=010 𝛾𝑡−𝑖 + 𝜏𝑡 𝜏𝑡~𝑁(0, 𝜎𝜏
2)